Zip Codes with the Highest Percentage of Population Employed in Health Diagnosing & Treating in North Las Vegas, NV
RELATED REPORTS & OPTIONS
Health Diagnosing & Treating
North Las Vegas
Compare Zip Codes
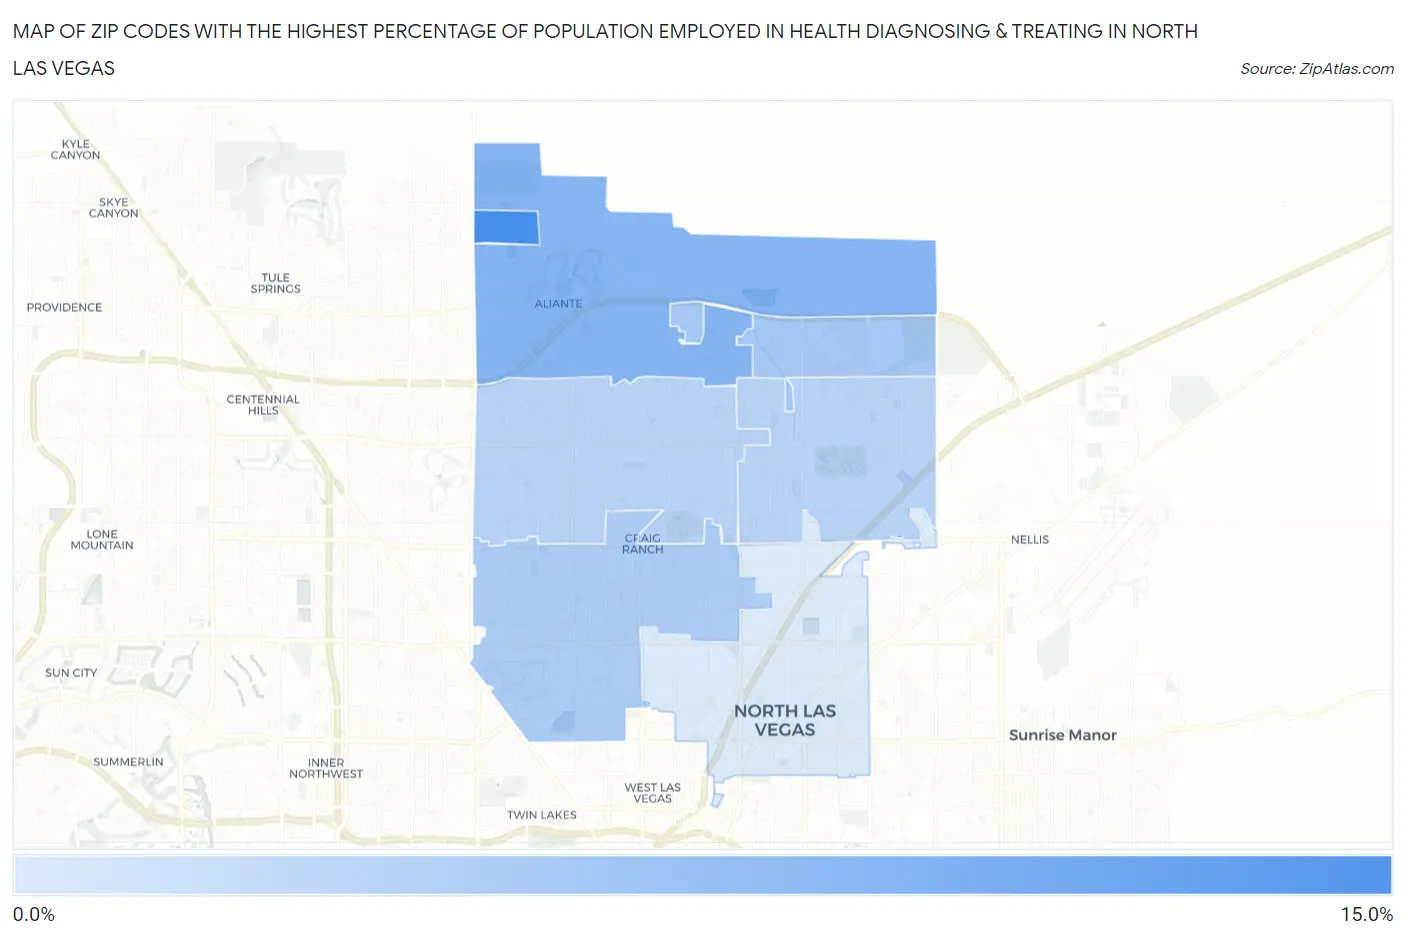
Map of Zip Codes with the Highest Percentage of Population Employed in Health Diagnosing & Treating in North Las Vegas
1.2%
12.3%
Zip Codes with the Highest Percentage of Population Employed in Health Diagnosing & Treating in North Las Vegas, NV
| Zip Code | % Employed | vs State | vs National | |
| 1. | 89085 | 12.3% | 4.9%(+7.38)#8 | 6.2%(+6.05)#2,060 |
| 2. | 89084 | 7.6% | 4.9%(+2.69)#30 | 6.2%(+1.36)#8,502 |
| 3. | 89086 | 5.1% | 4.9%(+0.198)#55 | 6.2%(-1.14)#17,296 |
| 4. | 89032 | 4.7% | 4.9%(-0.214)#64 | 6.2%(-1.55)#18,857 |
| 5. | 89081 | 3.8% | 4.9%(-1.12)#83 | 6.2%(-2.45)#22,021 |
| 6. | 89031 | 3.7% | 4.9%(-1.18)#85 | 6.2%(-2.52)#22,210 |
| 7. | 89030 | 1.2% | 4.9%(-3.75)#125 | 6.2%(-5.09)#27,638 |
1
Common Questions
What are the Top 5 Zip Codes with the Highest Percentage of Population Employed in Health Diagnosing & Treating in North Las Vegas, NV?
Top 5 Zip Codes with the Highest Percentage of Population Employed in Health Diagnosing & Treating in North Las Vegas, NV are:
What zip code has the Highest Percentage of Population Employed in Health Diagnosing & Treating in North Las Vegas, NV?
89085 has the Highest Percentage of Population Employed in Health Diagnosing & Treating in North Las Vegas, NV with 12.3%.
What is the Percentage of Population Employed in Health Diagnosing & Treating in North Las Vegas, NV?
Percentage of Population Employed in Health Diagnosing & Treating in North Las Vegas is 4.1%.
What is the Percentage of Population Employed in Health Diagnosing & Treating in Nevada?
Percentage of Population Employed in Health Diagnosing & Treating in Nevada is 4.9%.
What is the Percentage of Population Employed in Health Diagnosing & Treating in the United States?
Percentage of Population Employed in Health Diagnosing & Treating in the United States is 6.2%.