Zip Codes with the Highest Percentage of Population Employed in Architecture & Engineering in North Las Vegas, NV
RELATED REPORTS & OPTIONS
Architecture & Engineering
North Las Vegas
Compare Zip Codes
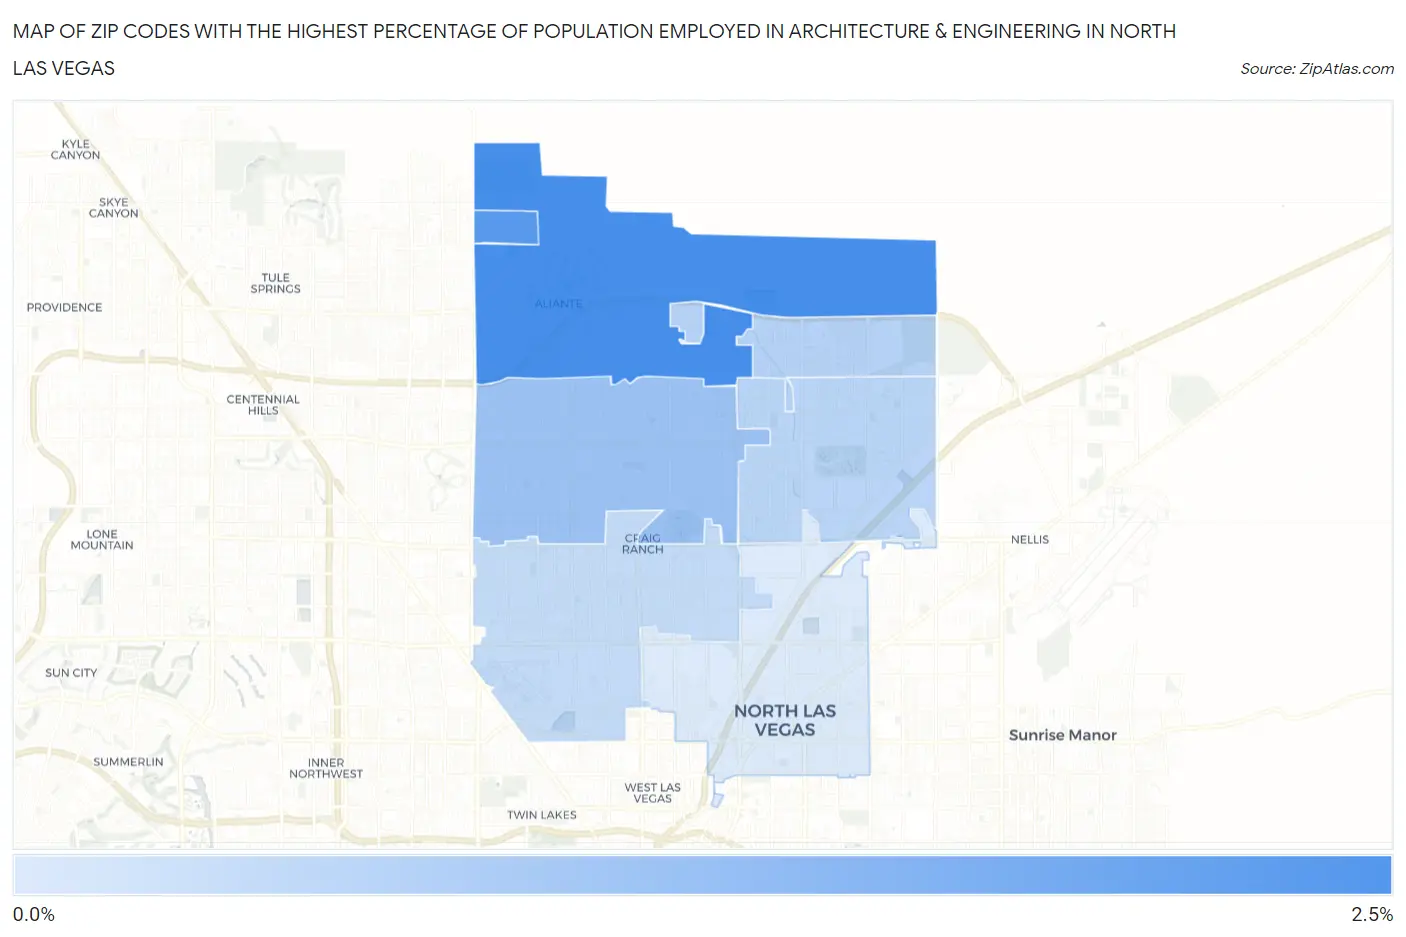
Map of Zip Codes with the Highest Percentage of Population Employed in Architecture & Engineering in North Las Vegas
0.16%
2.2%
Zip Codes with the Highest Percentage of Population Employed in Architecture & Engineering in North Las Vegas, NV
| Zip Code | % Employed | vs State | vs National | |
| 1. | 89084 | 2.2% | 1.5%(+0.667)#34 | 2.1%(+0.003)#8,743 |
| 2. | 89085 | 1.9% | 1.5%(+0.436)#41 | 2.1%(-0.229)#10,105 |
| 3. | 89031 | 1.0% | 1.5%(-0.482)#74 | 2.1%(-1.15)#16,578 |
| 4. | 89086 | 0.66% | 1.5%(-0.824)#91 | 2.1%(-1.49)#19,165 |
| 5. | 89081 | 0.61% | 1.5%(-0.876)#97 | 2.1%(-1.54)#19,563 |
| 6. | 89032 | 0.49% | 1.5%(-0.994)#106 | 2.1%(-1.66)#20,336 |
| 7. | 89030 | 0.16% | 1.5%(-1.33)#115 | 2.1%(-1.99)#22,236 |
1
Common Questions
What are the Top 5 Zip Codes with the Highest Percentage of Population Employed in Architecture & Engineering in North Las Vegas, NV?
Top 5 Zip Codes with the Highest Percentage of Population Employed in Architecture & Engineering in North Las Vegas, NV are:
What zip code has the Highest Percentage of Population Employed in Architecture & Engineering in North Las Vegas, NV?
89084 has the Highest Percentage of Population Employed in Architecture & Engineering in North Las Vegas, NV with 2.2%.
What is the Percentage of Population Employed in Architecture & Engineering in North Las Vegas, NV?
Percentage of Population Employed in Architecture & Engineering in North Las Vegas is 0.83%.
What is the Percentage of Population Employed in Architecture & Engineering in Nevada?
Percentage of Population Employed in Architecture & Engineering in Nevada is 1.5%.
What is the Percentage of Population Employed in Architecture & Engineering in the United States?
Percentage of Population Employed in Architecture & Engineering in the United States is 2.1%.