Zip Codes with the Highest Percentage of Population Employed in Computer & Mathematics in Bozeman, MT
RELATED REPORTS & OPTIONS
Computer & Mathematics
Bozeman
Compare Zip Codes
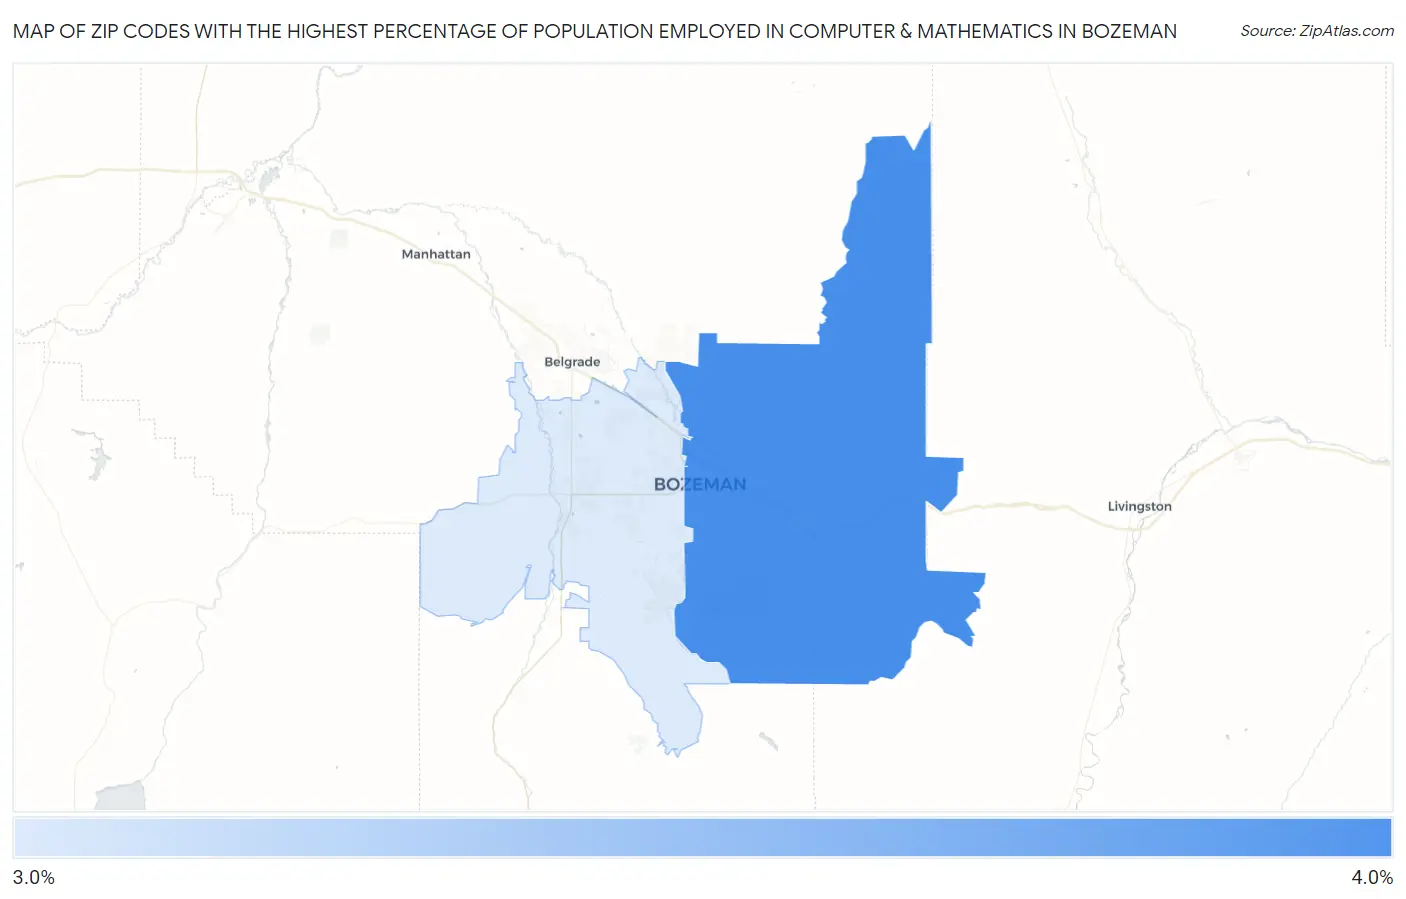
Map of Zip Codes with the Highest Percentage of Population Employed in Computer & Mathematics in Bozeman
3.6%
3.8%
Zip Codes with the Highest Percentage of Population Employed in Computer & Mathematics in Bozeman, MT
| Zip Code | % Employed | vs State | vs National | |
| 1. | 59715 | 3.8% | 2.2%(+1.58)#22 | 3.5%(+0.227)#5,591 |
| 2. | 59718 | 3.6% | 2.2%(+1.45)#25 | 3.5%(+0.105)#5,893 |
1
Common Questions
What are the Top Zip Codes with the Highest Percentage of Population Employed in Computer & Mathematics in Bozeman, MT?
Top Zip Codes with the Highest Percentage of Population Employed in Computer & Mathematics in Bozeman, MT are:
What zip code has the Highest Percentage of Population Employed in Computer & Mathematics in Bozeman, MT?
59715 has the Highest Percentage of Population Employed in Computer & Mathematics in Bozeman, MT with 3.8%.
What is the Percentage of Population Employed in Computer & Mathematics in Bozeman, MT?
Percentage of Population Employed in Computer & Mathematics in Bozeman is 3.7%.
What is the Percentage of Population Employed in Computer & Mathematics in Montana?
Percentage of Population Employed in Computer & Mathematics in Montana is 2.2%.
What is the Percentage of Population Employed in Computer & Mathematics in the United States?
Percentage of Population Employed in Computer & Mathematics in the United States is 3.5%.