Zip Codes with the Highest Percentage of Population with a Degree in Psychology in Bozeman, MT
RELATED REPORTS & OPTIONS
Psychology
Bozeman
Compare Zip Codes
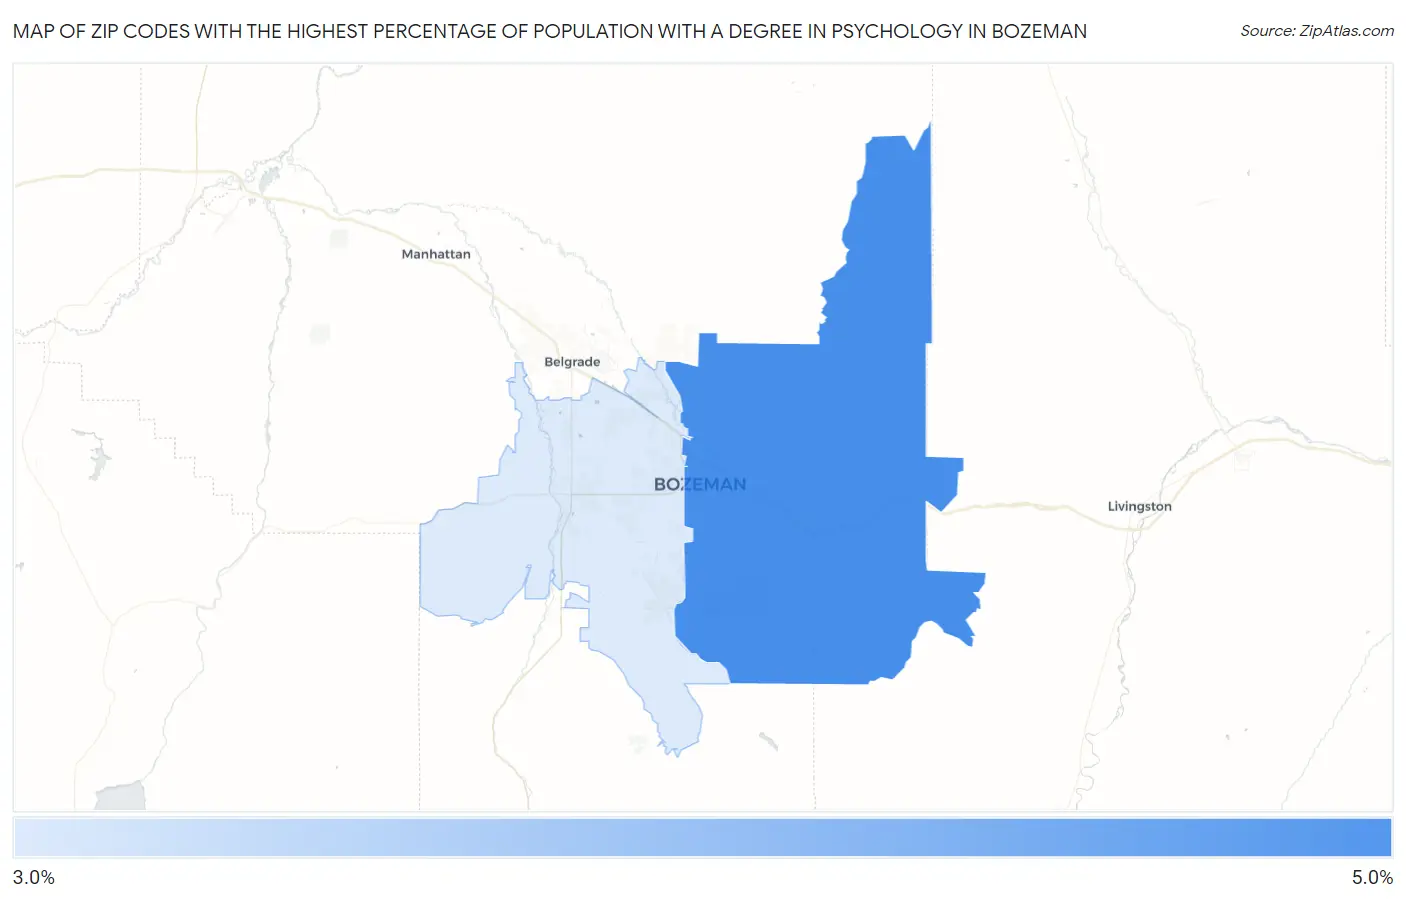
Map of Zip Codes with the Highest Percentage of Population with a Degree in Psychology in Bozeman
3.7%
4.2%
Zip Codes with the Highest Percentage of Population with a Degree in Psychology in Bozeman, MT
| Zip Code | % Graduates | vs State | vs National | |
| 1. | 59715 | 4.2% | 4.2%(-0.084)#83 | 5.1%(-0.895)#14,385 |
| 2. | 59718 | 3.7% | 4.2%(-0.543)#91 | 5.1%(-1.35)#15,971 |
1
Common Questions
What are the Top Zip Codes with the Highest Percentage of Population with a Degree in Psychology in Bozeman, MT?
Top Zip Codes with the Highest Percentage of Population with a Degree in Psychology in Bozeman, MT are:
What zip code has the Highest Percentage of Population with a Degree in Psychology in Bozeman, MT?
59715 has the Highest Percentage of Population with a Degree in Psychology in Bozeman, MT with 4.2%.
What is the Percentage of Population with a Degree in Psychology in Bozeman, MT?
Percentage of Population with a Degree in Psychology in Bozeman is 4.3%.
What is the Percentage of Population with a Degree in Psychology in Montana?
Percentage of Population with a Degree in Psychology in Montana is 4.2%.
What is the Percentage of Population with a Degree in Psychology in the United States?
Percentage of Population with a Degree in Psychology in the United States is 5.1%.