Zip Codes with the Highest Percentage of Population Employed in Architecture & Engineering in Macomb, MI
RELATED REPORTS & OPTIONS
Architecture & Engineering
Macomb
Compare Zip Codes
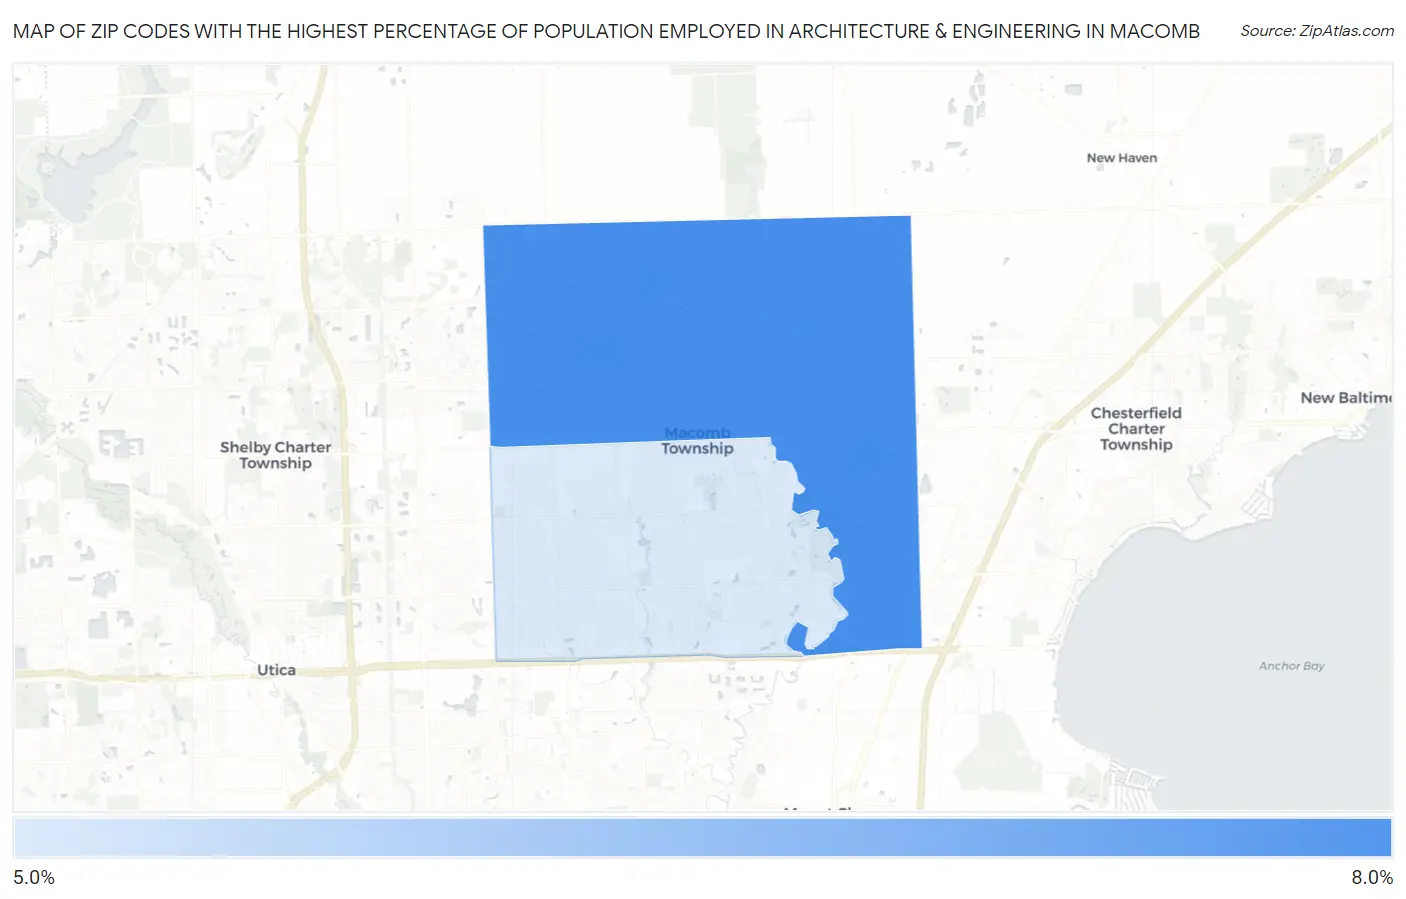
Map of Zip Codes with the Highest Percentage of Population Employed in Architecture & Engineering in Macomb
5.6%
6.9%
Zip Codes with the Highest Percentage of Population Employed in Architecture & Engineering in Macomb, MI
| Zip Code | % Employed | vs State | vs National | |
| 1. | 48042 | 6.9% | 3.4%(+3.53)#46 | 2.1%(+4.74)#777 |
| 2. | 48044 | 5.6% | 3.4%(+2.19)#95 | 2.1%(+3.41)#1,299 |
1
Common Questions
What are the Top Zip Codes with the Highest Percentage of Population Employed in Architecture & Engineering in Macomb, MI?
Top Zip Codes with the Highest Percentage of Population Employed in Architecture & Engineering in Macomb, MI are:
What zip code has the Highest Percentage of Population Employed in Architecture & Engineering in Macomb, MI?
48042 has the Highest Percentage of Population Employed in Architecture & Engineering in Macomb, MI with 6.9%.
What is the Percentage of Population Employed in Architecture & Engineering in Michigan?
Percentage of Population Employed in Architecture & Engineering in Michigan is 3.4%.
What is the Percentage of Population Employed in Architecture & Engineering in the United States?
Percentage of Population Employed in Architecture & Engineering in the United States is 2.1%.