Zip Codes with the Highest Percentage of Population Employed in Architecture & Engineering in Flint, MI
RELATED REPORTS & OPTIONS
Architecture & Engineering
Flint
Compare Zip Codes
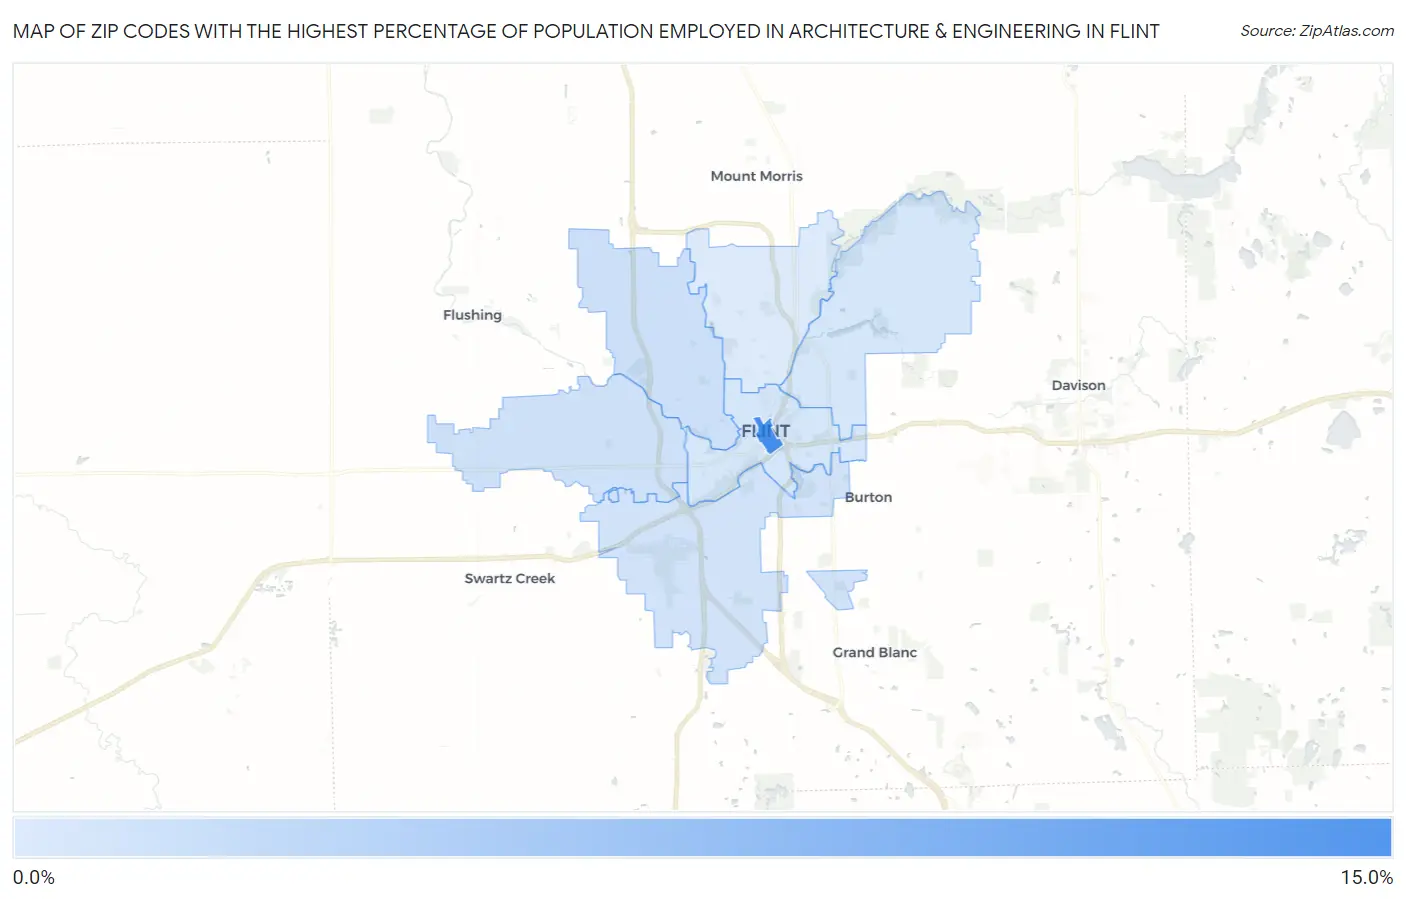
Map of Zip Codes with the Highest Percentage of Population Employed in Architecture & Engineering in Flint
0.23%
14.9%
Zip Codes with the Highest Percentage of Population Employed in Architecture & Engineering in Flint, MI
| Zip Code | % Employed | vs State | vs National | |
| 1. | 48502 | 14.9% | 3.4%(+11.5)#3 | 2.1%(+12.7)#152 |
| 2. | 48504 | 1.6% | 3.4%(-1.75)#538 | 2.1%(-0.530)#12,060 |
| 3. | 48532 | 1.5% | 3.4%(-1.87)#561 | 2.1%(-0.647)#12,871 |
| 4. | 48507 | 1.3% | 3.4%(-2.03)#600 | 2.1%(-0.812)#14,042 |
| 5. | 48506 | 0.86% | 3.4%(-2.50)#705 | 2.1%(-1.29)#17,650 |
| 6. | 48503 | 0.78% | 3.4%(-2.59)#734 | 2.1%(-1.37)#18,299 |
| 7. | 48505 | 0.23% | 3.4%(-3.13)#835 | 2.1%(-1.91)#21,885 |
1
Common Questions
What are the Top 5 Zip Codes with the Highest Percentage of Population Employed in Architecture & Engineering in Flint, MI?
Top 5 Zip Codes with the Highest Percentage of Population Employed in Architecture & Engineering in Flint, MI are:
What zip code has the Highest Percentage of Population Employed in Architecture & Engineering in Flint, MI?
48502 has the Highest Percentage of Population Employed in Architecture & Engineering in Flint, MI with 14.9%.
What is the Percentage of Population Employed in Architecture & Engineering in Flint, MI?
Percentage of Population Employed in Architecture & Engineering in Flint is 0.94%.
What is the Percentage of Population Employed in Architecture & Engineering in Michigan?
Percentage of Population Employed in Architecture & Engineering in Michigan is 3.4%.
What is the Percentage of Population Employed in Architecture & Engineering in the United States?
Percentage of Population Employed in Architecture & Engineering in the United States is 2.1%.