Zip Codes with the Highest Percentage of Population Employed in Architecture & Engineering in Monroe, MI
RELATED REPORTS & OPTIONS
Architecture & Engineering
Monroe
Compare Zip Codes
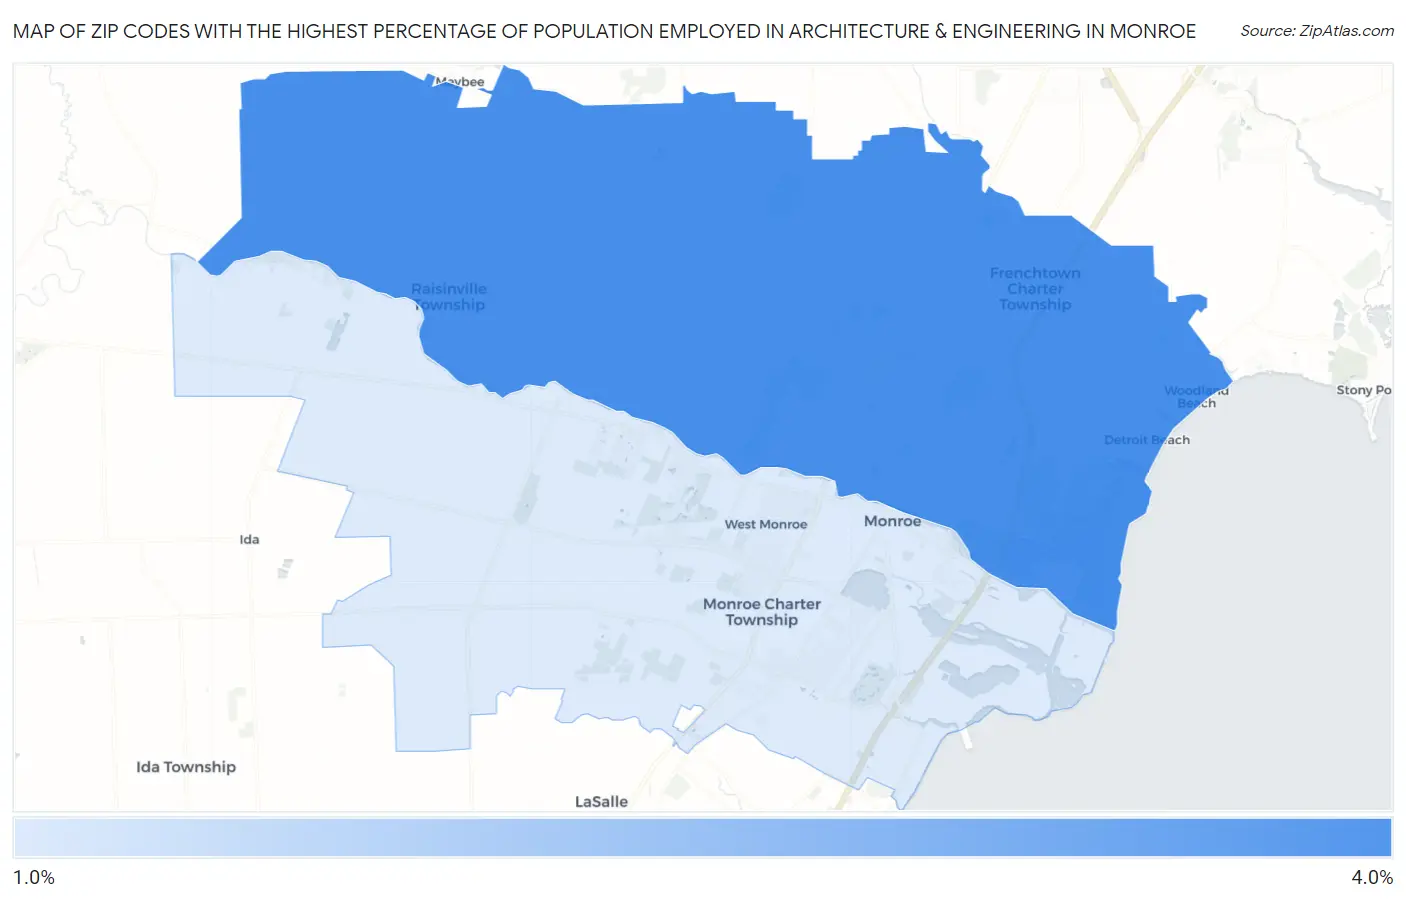
Map of Zip Codes with the Highest Percentage of Population Employed in Architecture & Engineering in Monroe
1.4%
3.3%
Zip Codes with the Highest Percentage of Population Employed in Architecture & Engineering in Monroe, MI
| Zip Code | % Employed | vs State | vs National | |
| 1. | 48162 | 3.3% | 3.4%(-0.082)#240 | 2.1%(+1.14)#4,242 |
| 2. | 48161 | 1.4% | 3.4%(-1.98)#586 | 2.1%(-0.758)#13,644 |
1
Common Questions
What are the Top Zip Codes with the Highest Percentage of Population Employed in Architecture & Engineering in Monroe, MI?
Top Zip Codes with the Highest Percentage of Population Employed in Architecture & Engineering in Monroe, MI are:
What zip code has the Highest Percentage of Population Employed in Architecture & Engineering in Monroe, MI?
48162 has the Highest Percentage of Population Employed in Architecture & Engineering in Monroe, MI with 3.3%.
What is the Percentage of Population Employed in Architecture & Engineering in Monroe, MI?
Percentage of Population Employed in Architecture & Engineering in Monroe is 2.1%.
What is the Percentage of Population Employed in Architecture & Engineering in Michigan?
Percentage of Population Employed in Architecture & Engineering in Michigan is 3.4%.
What is the Percentage of Population Employed in Architecture & Engineering in the United States?
Percentage of Population Employed in Architecture & Engineering in the United States is 2.1%.