Zip Codes with the Highest Percentage of Population Employed in Architecture & Engineering in Royal Oak, MI
RELATED REPORTS & OPTIONS
Architecture & Engineering
Royal Oak
Compare Zip Codes
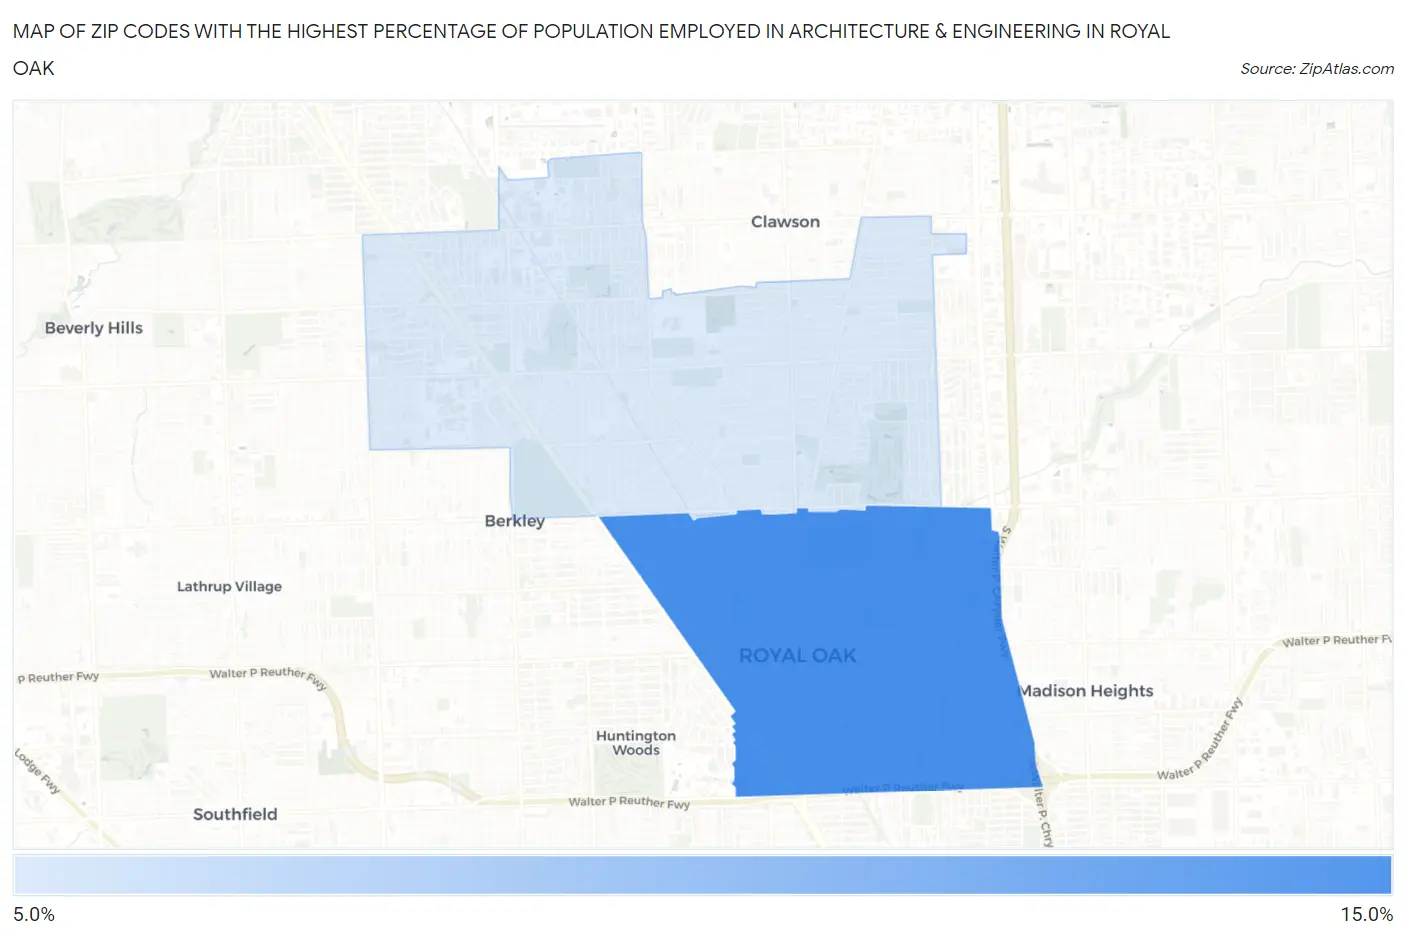
Map of Zip Codes with the Highest Percentage of Population Employed in Architecture & Engineering in Royal Oak
8.0%
10.7%
Zip Codes with the Highest Percentage of Population Employed in Architecture & Engineering in Royal Oak, MI
| Zip Code | % Employed | vs State | vs National | |
| 1. | 48067 | 10.7% | 3.4%(+7.30)#13 | 2.1%(+8.52)#298 |
| 2. | 48073 | 8.0% | 3.4%(+4.63)#33 | 2.1%(+5.84)#575 |
1
Common Questions
What are the Top Zip Codes with the Highest Percentage of Population Employed in Architecture & Engineering in Royal Oak, MI?
Top Zip Codes with the Highest Percentage of Population Employed in Architecture & Engineering in Royal Oak, MI are:
What zip code has the Highest Percentage of Population Employed in Architecture & Engineering in Royal Oak, MI?
48067 has the Highest Percentage of Population Employed in Architecture & Engineering in Royal Oak, MI with 10.7%.
What is the Percentage of Population Employed in Architecture & Engineering in Royal Oak, MI?
Percentage of Population Employed in Architecture & Engineering in Royal Oak is 9.2%.
What is the Percentage of Population Employed in Architecture & Engineering in Michigan?
Percentage of Population Employed in Architecture & Engineering in Michigan is 3.4%.
What is the Percentage of Population Employed in Architecture & Engineering in the United States?
Percentage of Population Employed in Architecture & Engineering in the United States is 2.1%.