Zip Codes with the Highest Percentage of Population Employed in Architecture & Engineering in Utica, MI
RELATED REPORTS & OPTIONS
Architecture & Engineering
Utica
Compare Zip Codes
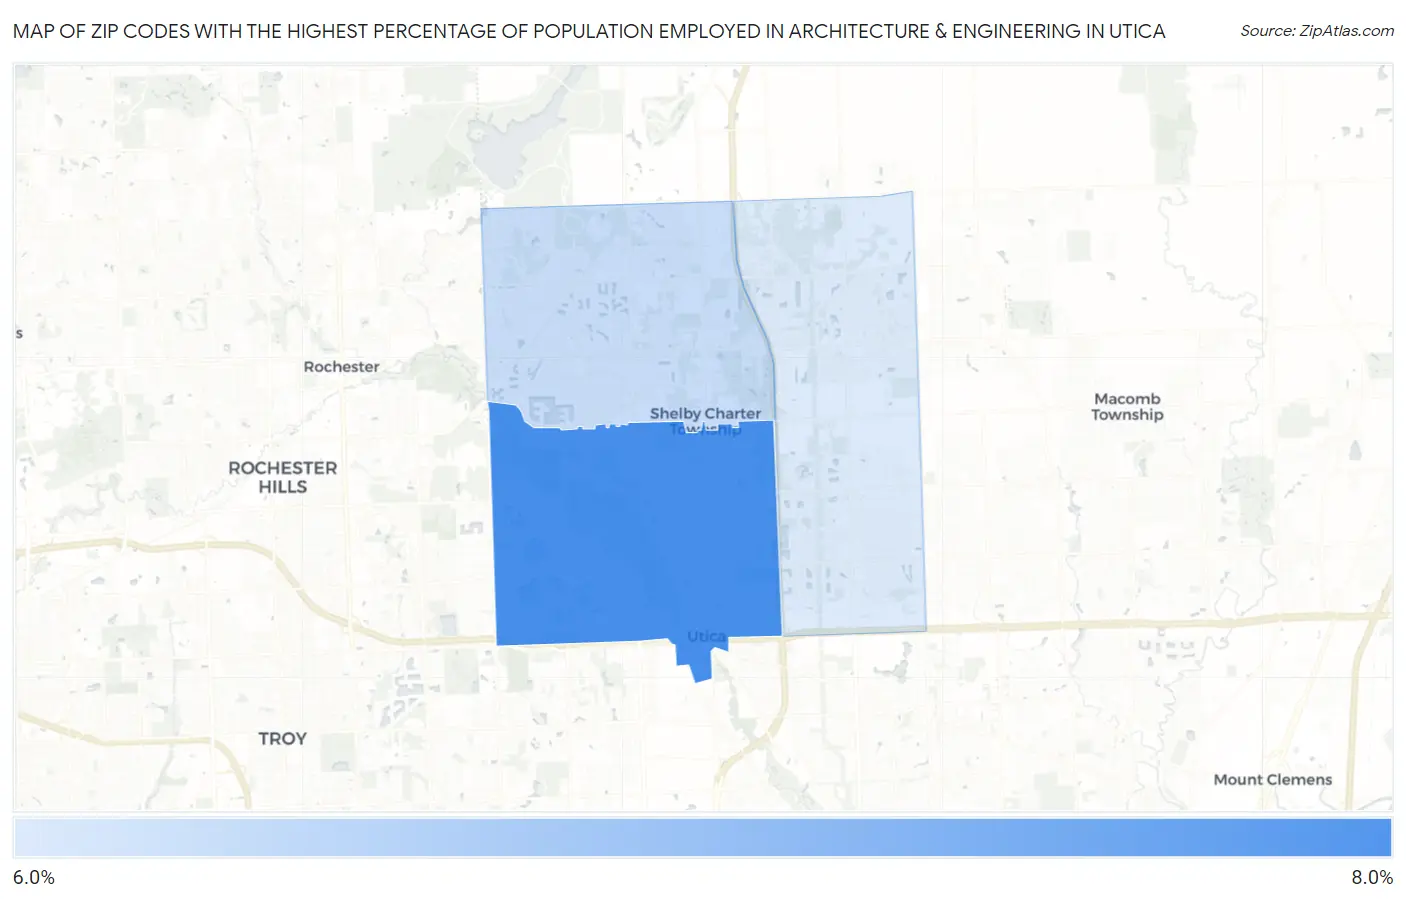
Map of Zip Codes with the Highest Percentage of Population Employed in Architecture & Engineering in Utica
6.4%
7.2%
Zip Codes with the Highest Percentage of Population Employed in Architecture & Engineering in Utica, MI
| Zip Code | % Employed | vs State | vs National | |
| 1. | 48317 | 7.2% | 3.4%(+3.85)#43 | 2.1%(+5.07)#704 |
| 2. | 48316 | 6.5% | 3.4%(+3.17)#56 | 2.1%(+4.39)#871 |
| 3. | 48315 | 6.4% | 3.4%(+3.06)#61 | 2.1%(+4.28)#917 |
1
Common Questions
What are the Top Zip Codes with the Highest Percentage of Population Employed in Architecture & Engineering in Utica, MI?
Top Zip Codes with the Highest Percentage of Population Employed in Architecture & Engineering in Utica, MI are:
What zip code has the Highest Percentage of Population Employed in Architecture & Engineering in Utica, MI?
48317 has the Highest Percentage of Population Employed in Architecture & Engineering in Utica, MI with 7.2%.
What is the Percentage of Population Employed in Architecture & Engineering in Utica, MI?
Percentage of Population Employed in Architecture & Engineering in Utica is 2.8%.
What is the Percentage of Population Employed in Architecture & Engineering in Michigan?
Percentage of Population Employed in Architecture & Engineering in Michigan is 3.4%.
What is the Percentage of Population Employed in Architecture & Engineering in the United States?
Percentage of Population Employed in Architecture & Engineering in the United States is 2.1%.