Zip Codes with the Highest Percentage of Population Employed in Architecture & Engineering in Burton, MI
RELATED REPORTS & OPTIONS
Architecture & Engineering
Burton
Compare Zip Codes
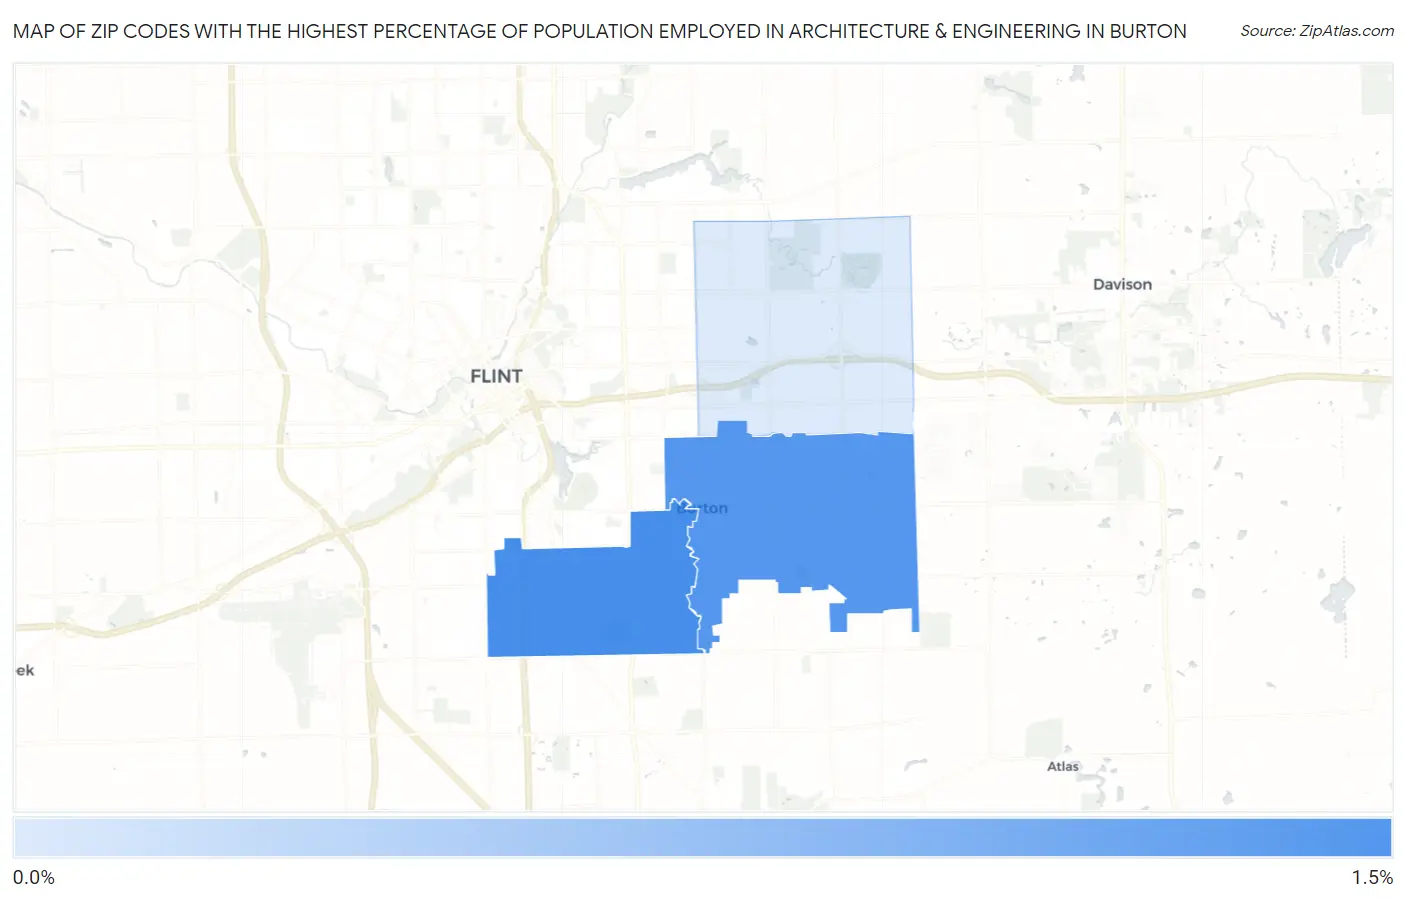
Map of Zip Codes with the Highest Percentage of Population Employed in Architecture & Engineering in Burton
0.39%
1.1%
Zip Codes with the Highest Percentage of Population Employed in Architecture & Engineering in Burton, MI
| Zip Code | % Employed | vs State | vs National | |
| 1. | 48529 | 1.1% | 3.4%(-2.25)#668 | 2.1%(-1.04)#15,742 |
| 2. | 48519 | 1.0% | 3.4%(-2.32)#677 | 2.1%(-1.10)#16,257 |
| 3. | 48509 | 0.39% | 3.4%(-2.97)#810 | 2.1%(-1.76)#21,013 |
1
Common Questions
What are the Top Zip Codes with the Highest Percentage of Population Employed in Architecture & Engineering in Burton, MI?
Top Zip Codes with the Highest Percentage of Population Employed in Architecture & Engineering in Burton, MI are:
What zip code has the Highest Percentage of Population Employed in Architecture & Engineering in Burton, MI?
48529 has the Highest Percentage of Population Employed in Architecture & Engineering in Burton, MI with 1.1%.
What is the Percentage of Population Employed in Architecture & Engineering in Burton, MI?
Percentage of Population Employed in Architecture & Engineering in Burton is 1.2%.
What is the Percentage of Population Employed in Architecture & Engineering in Michigan?
Percentage of Population Employed in Architecture & Engineering in Michigan is 3.4%.
What is the Percentage of Population Employed in Architecture & Engineering in the United States?
Percentage of Population Employed in Architecture & Engineering in the United States is 2.1%.