Zip Codes with the Highest Percentage of Population Employed in Architecture & Engineering in Dearborn Heights, MI
RELATED REPORTS & OPTIONS
Architecture & Engineering
Dearborn Heights
Compare Zip Codes
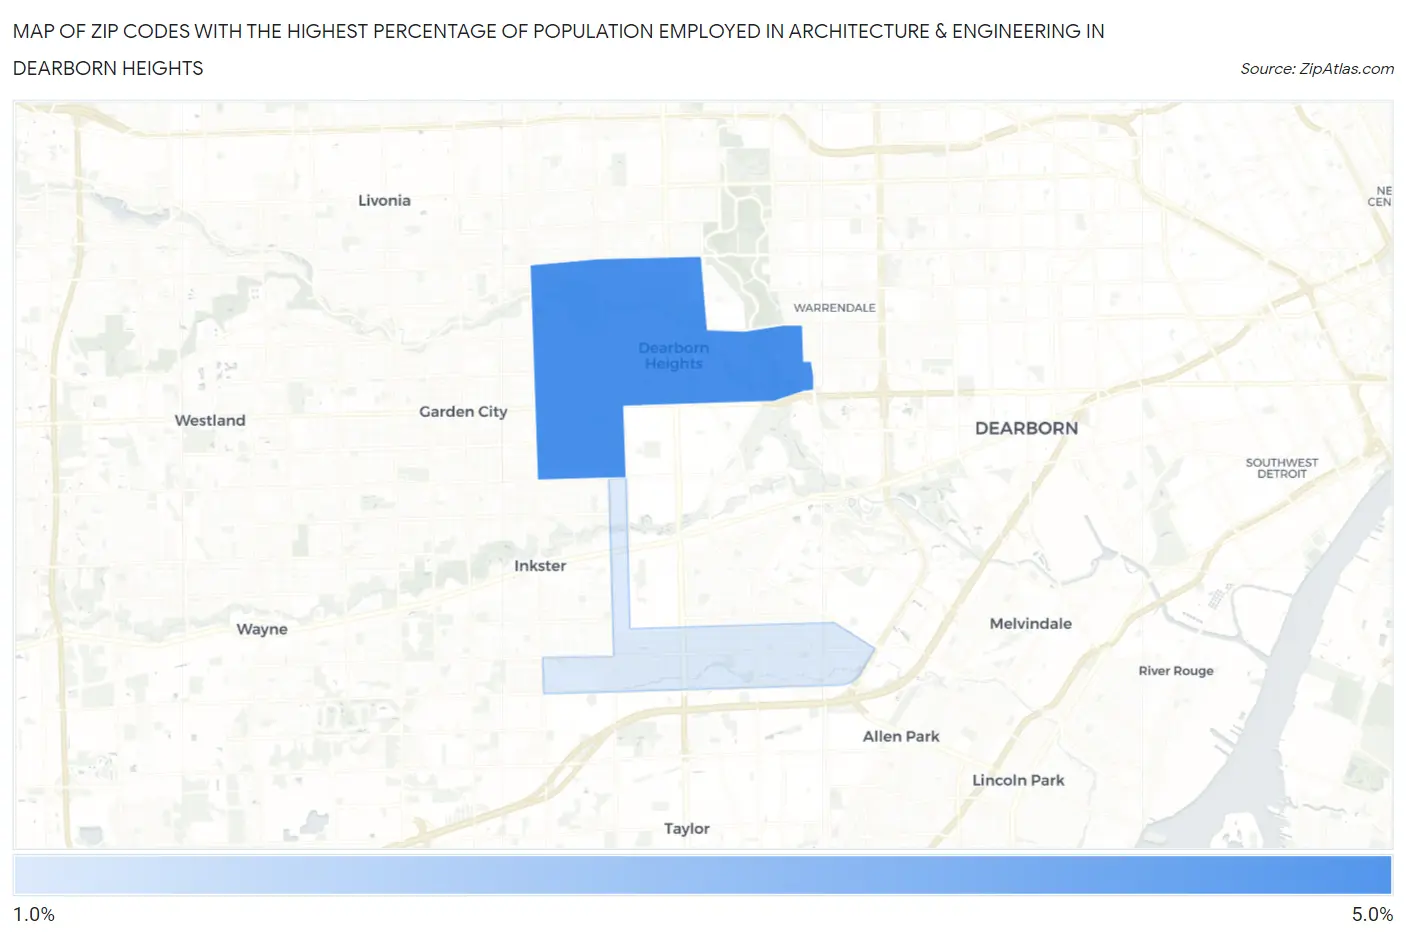
Map of Zip Codes with the Highest Percentage of Population Employed in Architecture & Engineering in Dearborn Heights
1.1%
4.3%
Zip Codes with the Highest Percentage of Population Employed in Architecture & Engineering in Dearborn Heights, MI
| Zip Code | % Employed | vs State | vs National | |
| 1. | 48127 | 4.3% | 3.4%(+0.890)#159 | 2.1%(+2.11)#2,415 |
| 2. | 48125 | 1.1% | 3.4%(-2.26)#669 | 2.1%(-1.04)#15,777 |
1
Common Questions
What are the Top Zip Codes with the Highest Percentage of Population Employed in Architecture & Engineering in Dearborn Heights, MI?
Top Zip Codes with the Highest Percentage of Population Employed in Architecture & Engineering in Dearborn Heights, MI are:
What zip code has the Highest Percentage of Population Employed in Architecture & Engineering in Dearborn Heights, MI?
48127 has the Highest Percentage of Population Employed in Architecture & Engineering in Dearborn Heights, MI with 4.3%.
What is the Percentage of Population Employed in Architecture & Engineering in Dearborn Heights, MI?
Percentage of Population Employed in Architecture & Engineering in Dearborn Heights is 3.1%.
What is the Percentage of Population Employed in Architecture & Engineering in Michigan?
Percentage of Population Employed in Architecture & Engineering in Michigan is 3.4%.
What is the Percentage of Population Employed in Architecture & Engineering in the United States?
Percentage of Population Employed in Architecture & Engineering in the United States is 2.1%.