Zip Codes with the Highest Percentage of Population Employed in Architecture & Engineering in Jackson, MI
RELATED REPORTS & OPTIONS
Architecture & Engineering
Jackson
Compare Zip Codes
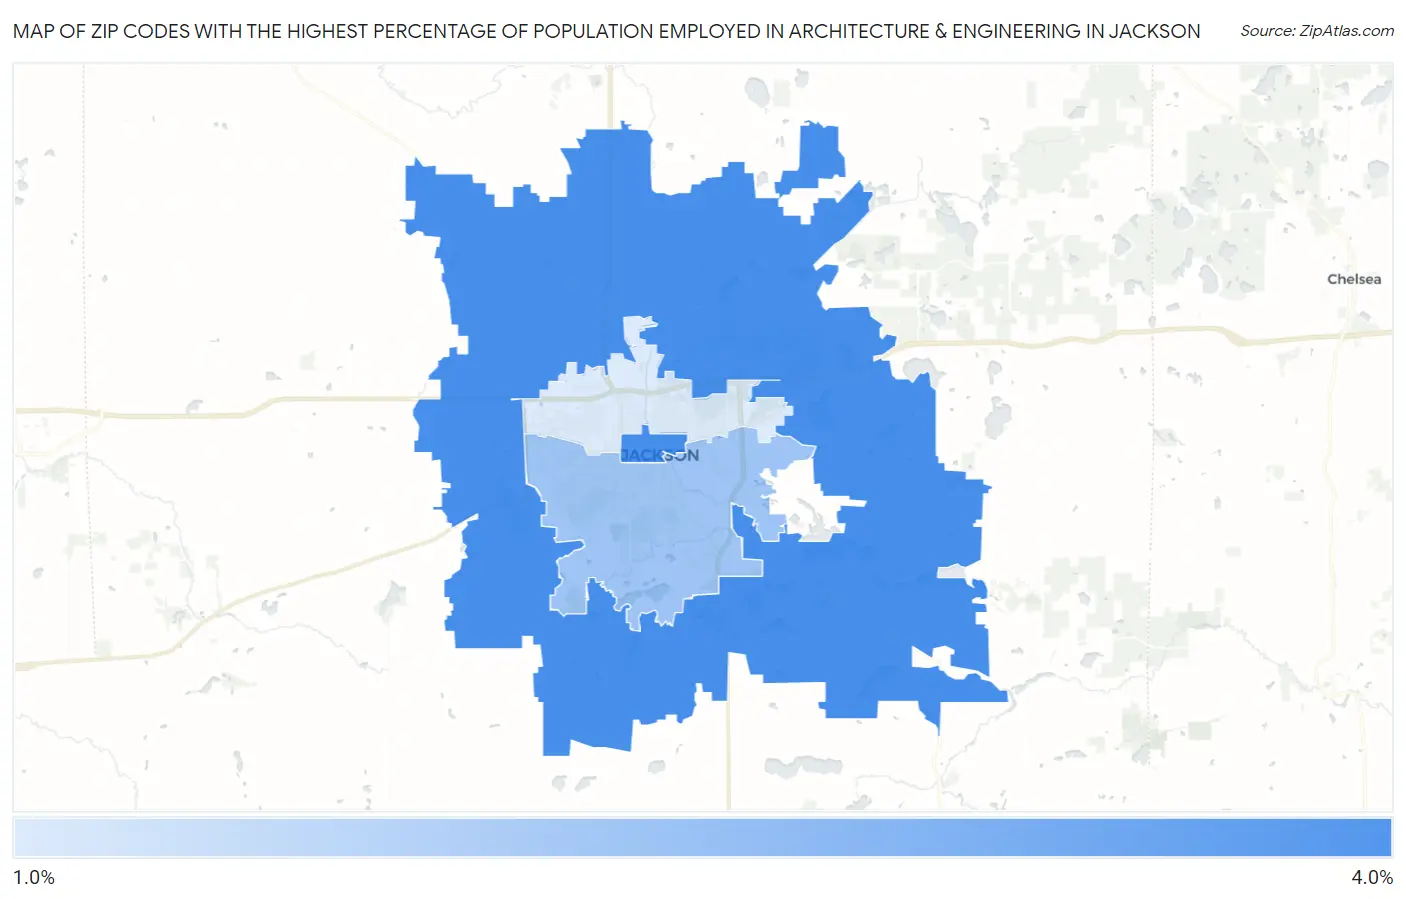
Map of Zip Codes with the Highest Percentage of Population Employed in Architecture & Engineering in Jackson
1.3%
3.1%
Zip Codes with the Highest Percentage of Population Employed in Architecture & Engineering in Jackson, MI
| Zip Code | % Employed | vs State | vs National | |
| 1. | 49201 | 3.1% | 3.4%(-0.299)#268 | 2.1%(+0.919)#4,819 |
| 2. | 49203 | 2.1% | 3.4%(-1.30)#436 | 2.1%(-0.081)#9,214 |
| 3. | 49202 | 1.3% | 3.4%(-2.02)#596 | 2.1%(-0.807)#14,006 |
1
Common Questions
What are the Top Zip Codes with the Highest Percentage of Population Employed in Architecture & Engineering in Jackson, MI?
Top Zip Codes with the Highest Percentage of Population Employed in Architecture & Engineering in Jackson, MI are:
What zip code has the Highest Percentage of Population Employed in Architecture & Engineering in Jackson, MI?
49201 has the Highest Percentage of Population Employed in Architecture & Engineering in Jackson, MI with 3.1%.
What is the Percentage of Population Employed in Architecture & Engineering in Jackson, MI?
Percentage of Population Employed in Architecture & Engineering in Jackson is 0.83%.
What is the Percentage of Population Employed in Architecture & Engineering in Michigan?
Percentage of Population Employed in Architecture & Engineering in Michigan is 3.4%.
What is the Percentage of Population Employed in Architecture & Engineering in the United States?
Percentage of Population Employed in Architecture & Engineering in the United States is 2.1%.