Zip Codes with the Highest Percentage of Households with Income Below $10,000 in Haverhill, MA
RELATED REPORTS & OPTIONS
Household Income | $0-10k
Haverhill
Compare Zip Codes
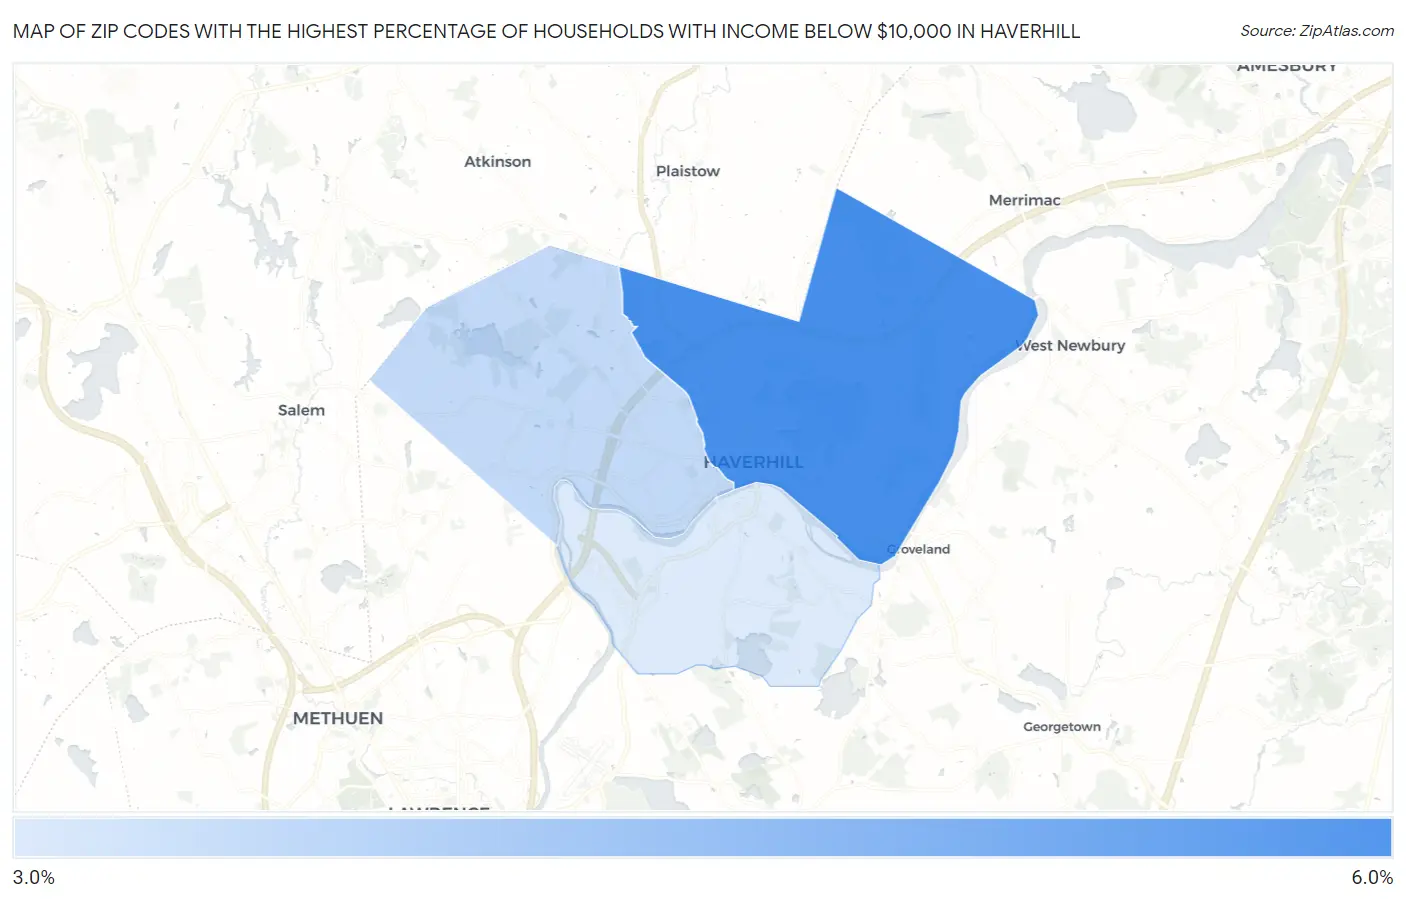
Map of Zip Codes with the Highest Percentage of Households with Income Below $10,000 in Haverhill
3.0%
5.7%
Zip Codes with the Highest Percentage of Households with Income Below $10,000 in Haverhill, MA
| Zip Code | Households with Income < $10k | vs State | vs National | |
| 1. | 01830 | 5.7% | 4.4%(+1.30)#102 | 4.9%(+0.800)#9,722 |
| 2. | 01832 | 3.5% | 4.4%(-0.900)#221 | 4.9%(-1.40)#17,267 |
| 3. | 01835 | 3.0% | 4.4%(-1.40)#266 | 4.9%(-1.90)#19,440 |
1
Common Questions
What are the Top Zip Codes with the Highest Percentage of Households with Income Below $10,000 in Haverhill, MA?
Top Zip Codes with the Highest Percentage of Households with Income Below $10,000 in Haverhill, MA are:
What zip code has the Highest Percentage of Households with Income Below $10,000 in Haverhill, MA?
01830 has the Highest Percentage of Households with Income Below $10,000 in Haverhill, MA with 5.7%.
What is the Percentage of Households with Income Below $10,000 in Haverhill, MA?
Percentage of Households with Income Below $10,000 in Haverhill is 4.3%.
What is the Percentage of Households with Income Below $10,000 in Massachusetts?
Percentage of Households with Income Below $10,000 in Massachusetts is 4.4%.
What is the Percentage of Households with Income Below $10,000 in the United States?
Percentage of Households with Income Below $10,000 in the United States is 4.9%.