Zip Codes with the Highest Percentage of Population with a Degree in Liberal Arts and History in Hammond, LA
RELATED REPORTS & OPTIONS
Liberal Arts and History
Hammond
Compare Zip Codes
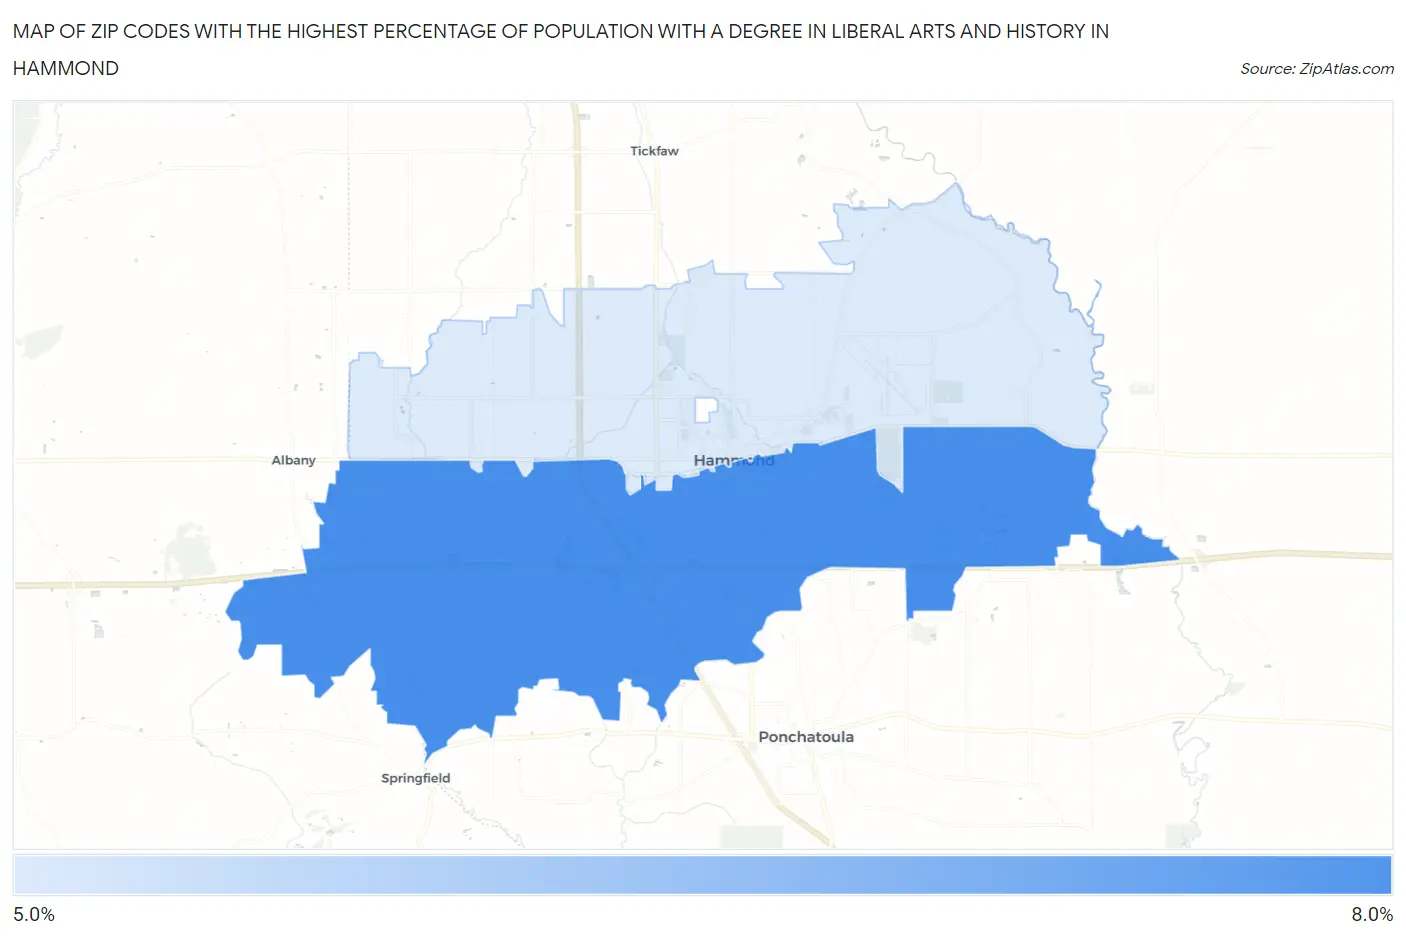
Map of Zip Codes with the Highest Percentage of Population with a Degree in Liberal Arts and History in Hammond
6.0%
6.6%
Zip Codes with the Highest Percentage of Population with a Degree in Liberal Arts and History in Hammond, LA
| Zip Code | % Graduates | vs State | vs National | |
| 1. | 70403 | 6.6% | 7.4%(-0.803)#212 | 4.9%(+1.77)#7,057 |
| 2. | 70401 | 6.0% | 7.4%(-1.48)#238 | 4.9%(+1.10)#8,595 |
1
Common Questions
What are the Top Zip Codes with the Highest Percentage of Population with a Degree in Liberal Arts and History in Hammond, LA?
Top Zip Codes with the Highest Percentage of Population with a Degree in Liberal Arts and History in Hammond, LA are:
What zip code has the Highest Percentage of Population with a Degree in Liberal Arts and History in Hammond, LA?
70403 has the Highest Percentage of Population with a Degree in Liberal Arts and History in Hammond, LA with 6.6%.
What is the Percentage of Population with a Degree in Liberal Arts and History in Hammond, LA?
Percentage of Population with a Degree in Liberal Arts and History in Hammond is 4.9%.
What is the Percentage of Population with a Degree in Liberal Arts and History in Louisiana?
Percentage of Population with a Degree in Liberal Arts and History in Louisiana is 7.4%.
What is the Percentage of Population with a Degree in Liberal Arts and History in the United States?
Percentage of Population with a Degree in Liberal Arts and History in the United States is 4.9%.