Zip Codes with the Highest Percentage of Population with a Degree in Liberal Arts and History in Lafayette, LA
RELATED REPORTS & OPTIONS
Liberal Arts and History
Lafayette
Compare Zip Codes
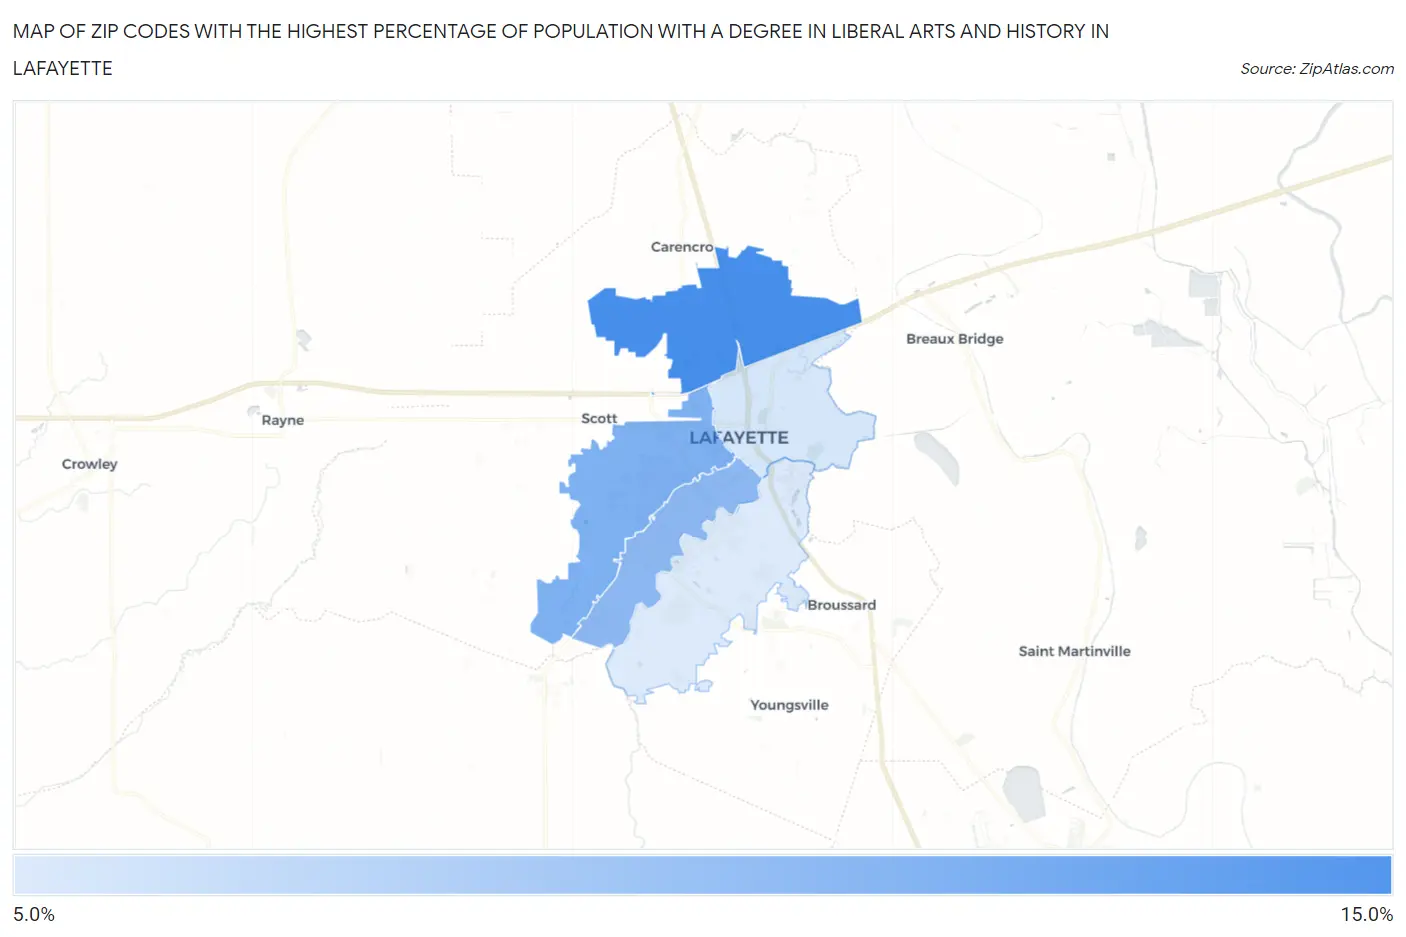
Map of Zip Codes with the Highest Percentage of Population with a Degree in Liberal Arts and History in Lafayette
6.5%
11.7%
Zip Codes with the Highest Percentage of Population with a Degree in Liberal Arts and History in Lafayette, LA
| Zip Code | % Graduates | vs State | vs National | |
| 1. | 70507 | 11.7% | 7.4%(+4.22)#82 | 4.9%(+6.79)#2,312 |
| 2. | 70506 | 9.7% | 7.4%(+2.24)#122 | 4.9%(+4.82)#3,312 |
| 3. | 70503 | 9.2% | 7.4%(+1.80)#133 | 4.9%(+4.37)#3,650 |
| 4. | 70501 | 6.7% | 7.4%(-0.723)#210 | 4.9%(+1.85)#6,889 |
| 5. | 70508 | 6.5% | 7.4%(-0.979)#214 | 4.9%(+1.60)#7,408 |
1
Common Questions
What are the Top 3 Zip Codes with the Highest Percentage of Population with a Degree in Liberal Arts and History in Lafayette, LA?
Top 3 Zip Codes with the Highest Percentage of Population with a Degree in Liberal Arts and History in Lafayette, LA are:
What zip code has the Highest Percentage of Population with a Degree in Liberal Arts and History in Lafayette, LA?
70507 has the Highest Percentage of Population with a Degree in Liberal Arts and History in Lafayette, LA with 11.7%.
What is the Percentage of Population with a Degree in Liberal Arts and History in Lafayette, LA?
Percentage of Population with a Degree in Liberal Arts and History in Lafayette is 8.7%.
What is the Percentage of Population with a Degree in Liberal Arts and History in Louisiana?
Percentage of Population with a Degree in Liberal Arts and History in Louisiana is 7.4%.
What is the Percentage of Population with a Degree in Liberal Arts and History in the United States?
Percentage of Population with a Degree in Liberal Arts and History in the United States is 4.9%.