Zip Codes with the Highest Percentage of Population with a Degree in Liberal Arts and History in Shreveport, LA
RELATED REPORTS & OPTIONS
Liberal Arts and History
Shreveport
Compare Zip Codes
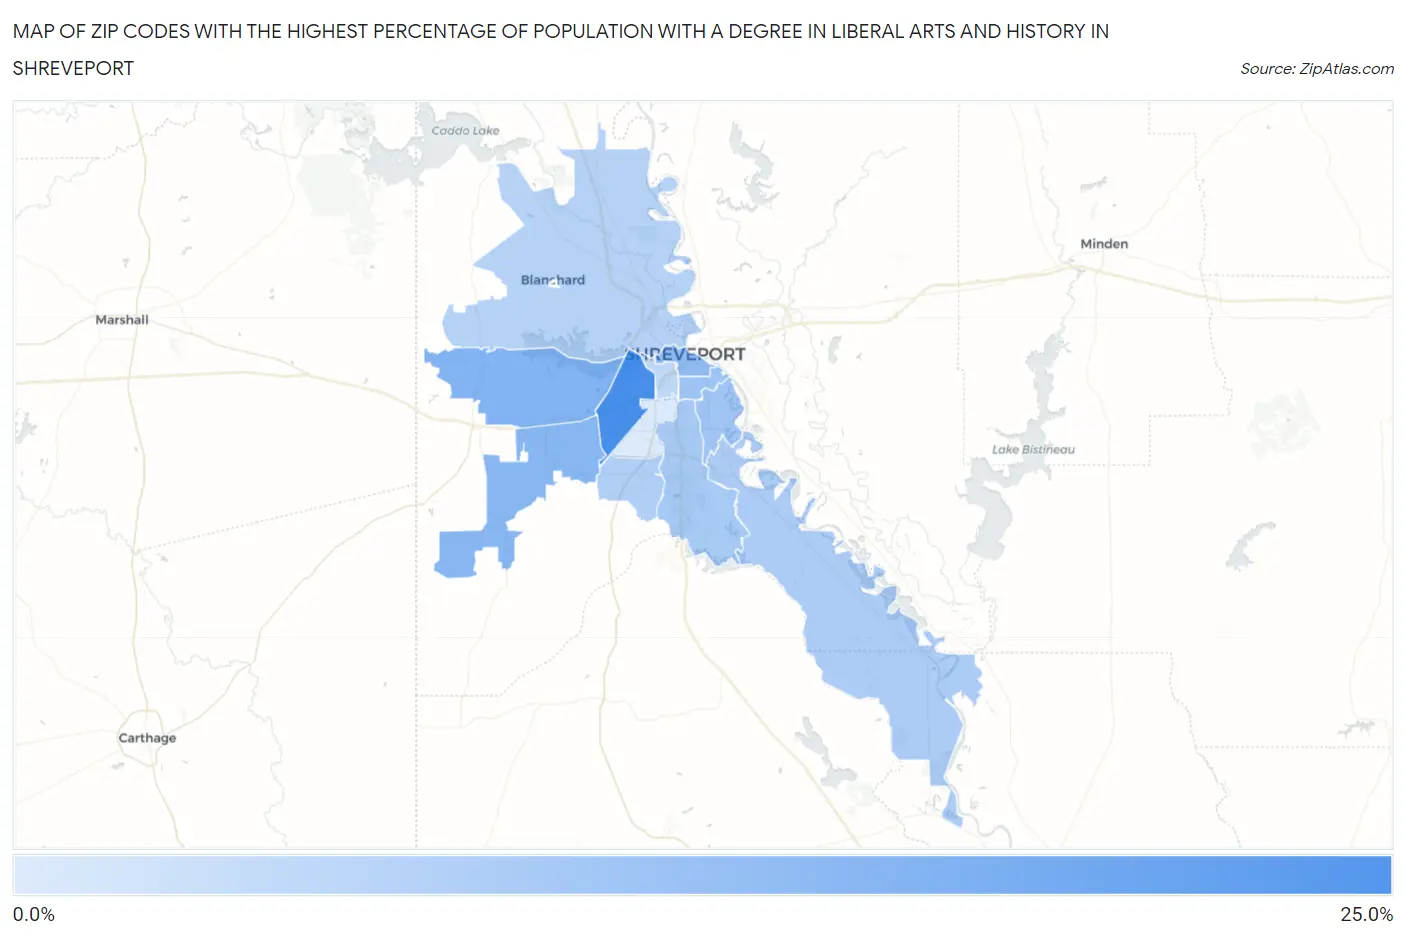
Map of Zip Codes with the Highest Percentage of Population with a Degree in Liberal Arts and History in Shreveport
0.14%
24.3%
Zip Codes with the Highest Percentage of Population with a Degree in Liberal Arts and History in Shreveport, LA
| Zip Code | % Graduates | vs State | vs National | |
| 1. | 71109 | 24.3% | 7.4%(+16.9)#19 | 4.9%(+19.4)#617 |
| 2. | 71119 | 14.5% | 7.4%(+7.08)#54 | 4.9%(+9.66)#1,520 |
| 3. | 71129 | 13.1% | 7.4%(+5.65)#69 | 4.9%(+8.22)#1,882 |
| 4. | 71101 | 11.8% | 7.4%(+4.40)#81 | 4.9%(+6.97)#2,252 |
| 5. | 71104 | 9.6% | 7.4%(+2.14)#125 | 4.9%(+4.71)#3,382 |
| 6. | 71105 | 9.2% | 7.4%(+1.75)#134 | 4.9%(+4.32)#3,686 |
| 7. | 71106 | 8.0% | 7.4%(+0.523)#165 | 4.9%(+3.10)#4,936 |
| 8. | 71115 | 7.4% | 7.4%(-0.041)#191 | 4.9%(+2.54)#5,723 |
| 9. | 71118 | 6.6% | 7.4%(-0.895)#213 | 4.9%(+1.68)#7,239 |
| 10. | 71107 | 5.8% | 7.4%(-1.62)#241 | 4.9%(+0.955)#8,973 |
| 11. | 71103 | 4.6% | 7.4%(-2.85)#288 | 4.9%(-0.278)#12,658 |
| 12. | 71108 | 0.14% | 7.4%(-7.31)#382 | 4.9%(-4.73)#24,213 |
1
Common Questions
What are the Top 10 Zip Codes with the Highest Percentage of Population with a Degree in Liberal Arts and History in Shreveport, LA?
Top 10 Zip Codes with the Highest Percentage of Population with a Degree in Liberal Arts and History in Shreveport, LA are:
What zip code has the Highest Percentage of Population with a Degree in Liberal Arts and History in Shreveport, LA?
71109 has the Highest Percentage of Population with a Degree in Liberal Arts and History in Shreveport, LA with 24.3%.
What is the Percentage of Population with a Degree in Liberal Arts and History in Shreveport, LA?
Percentage of Population with a Degree in Liberal Arts and History in Shreveport is 9.3%.
What is the Percentage of Population with a Degree in Liberal Arts and History in Louisiana?
Percentage of Population with a Degree in Liberal Arts and History in Louisiana is 7.4%.
What is the Percentage of Population with a Degree in Liberal Arts and History in the United States?
Percentage of Population with a Degree in Liberal Arts and History in the United States is 4.9%.