Witt, IL Map & Demographics
Witt Map
Witt Overview
$24,338
PER CAPITA INCOME
$74,000
AVG FAMILY INCOME
$53,301
AVG HOUSEHOLD INCOME
50.1%
WAGE / INCOME GAP [ % ]
49.9¢/ $1
WAGE / INCOME GAP [ $ ]
0.40
INEQUALITY / GINI INDEX
935
TOTAL POPULATION
491
MALE POPULATION
444
FEMALE POPULATION
110.59
MALES / 100 FEMALES
90.43
FEMALES / 100 MALES
33.9
MEDIAN AGE
3.3
AVG FAMILY SIZE
2.6
AVG HOUSEHOLD SIZE
411
LABOR FORCE [ PEOPLE ]
58.1%
PERCENT IN LABOR FORCE
9.7%
UNEMPLOYMENT RATE
Witt Zip Codes
Witt Area Codes
Income in Witt
Income Overview in Witt
Per Capita Income in Witt is $24,338, while median incomes of families and households are $74,000 and $53,301 respectively.
| Characteristic | Number | Measure |
| Per Capita Income | 935 | $24,338 |
| Median Family Income | 206 | $74,000 |
| Mean Family Income | 206 | $68,888 |
| Median Household Income | 365 | $53,301 |
| Mean Household Income | 365 | $61,485 |
| Income Deficit | 206 | $0 |
| Wage / Income Gap (%) | 935 | 50.12% |
| Wage / Income Gap ($) | 935 | 49.88¢ per $1 |
| Gini / Inequality Index | 935 | 0.40 |
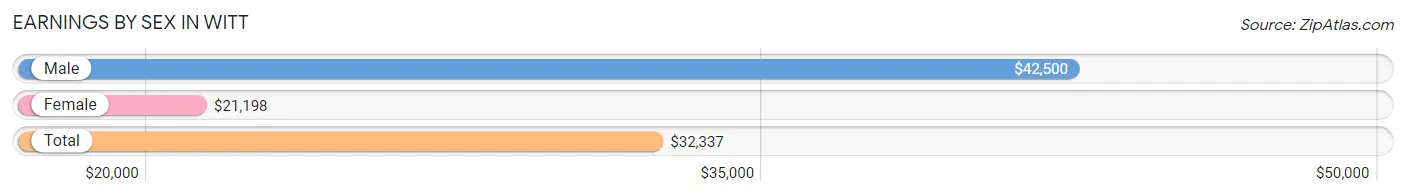
Earnings by Sex in Witt
Average Earnings in Witt are $32,337, $42,500 for men and $21,198 for women, a difference of 50.1%.
| Sex | Number | Average Earnings |
| Male | 280 (63.2%) | $42,500 |
| Female | 163 (36.8%) | $21,198 |
| Total | 443 (100.0%) | $32,337 |
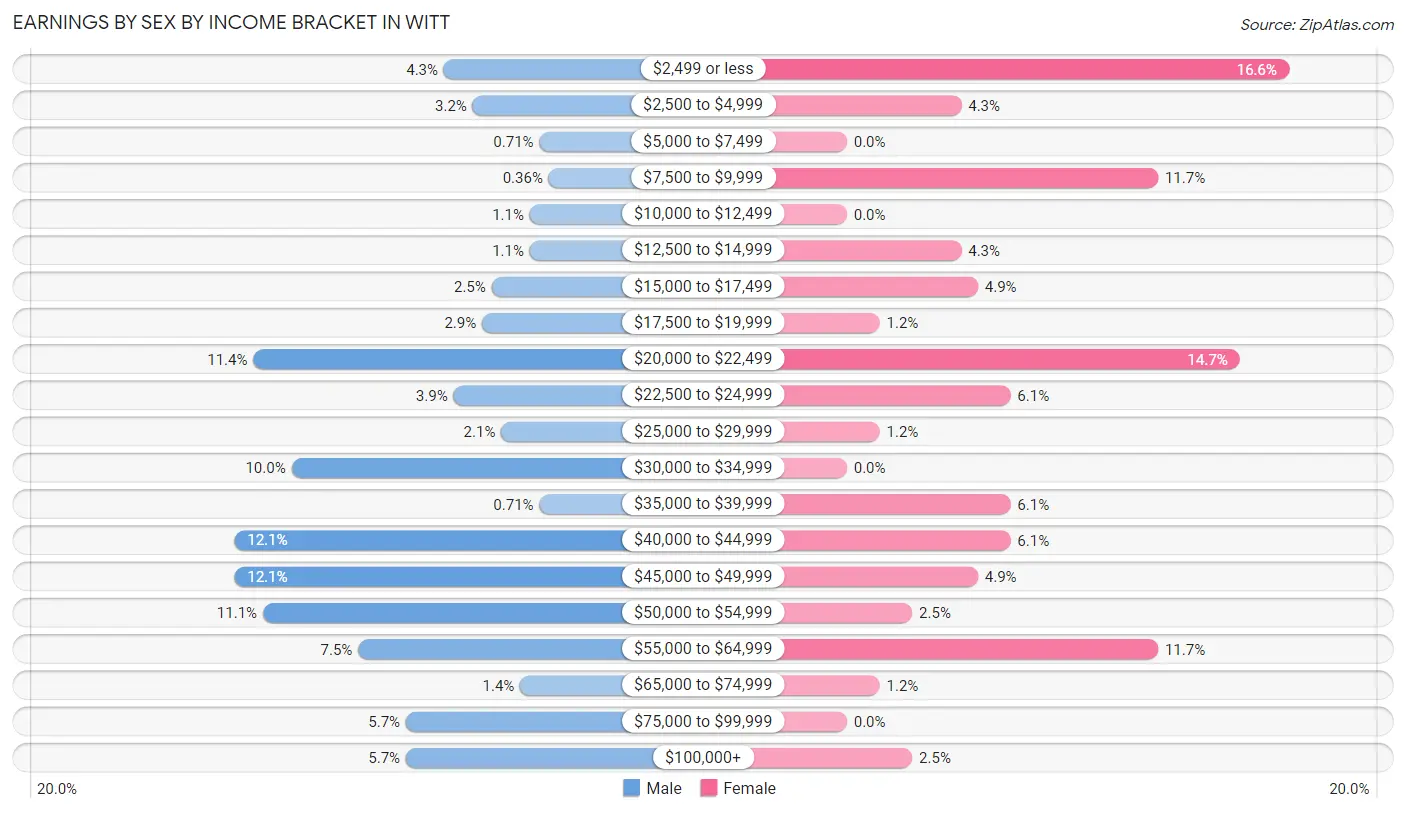
Earnings by Sex by Income Bracket in Witt
The most common earnings brackets in Witt are $40,000 to $44,999 for men (34 | 12.1%) and $2,499 or less for women (27 | 16.6%).
| Income | Male | Female |
| $2,499 or less | 12 (4.3%) | 27 (16.6%) |
| $2,500 to $4,999 | 9 (3.2%) | 7 (4.3%) |
| $5,000 to $7,499 | 2 (0.7%) | 0 (0.0%) |
| $7,500 to $9,999 | 1 (0.4%) | 19 (11.7%) |
| $10,000 to $12,499 | 3 (1.1%) | 0 (0.0%) |
| $12,500 to $14,999 | 3 (1.1%) | 7 (4.3%) |
| $15,000 to $17,499 | 7 (2.5%) | 8 (4.9%) |
| $17,500 to $19,999 | 8 (2.9%) | 2 (1.2%) |
| $20,000 to $22,499 | 32 (11.4%) | 24 (14.7%) |
| $22,500 to $24,999 | 11 (3.9%) | 10 (6.1%) |
| $25,000 to $29,999 | 6 (2.1%) | 2 (1.2%) |
| $30,000 to $34,999 | 28 (10.0%) | 0 (0.0%) |
| $35,000 to $39,999 | 2 (0.7%) | 10 (6.1%) |
| $40,000 to $44,999 | 34 (12.1%) | 10 (6.1%) |
| $45,000 to $49,999 | 34 (12.1%) | 8 (4.9%) |
| $50,000 to $54,999 | 31 (11.1%) | 4 (2.5%) |
| $55,000 to $64,999 | 21 (7.5%) | 19 (11.7%) |
| $65,000 to $74,999 | 4 (1.4%) | 2 (1.2%) |
| $75,000 to $99,999 | 16 (5.7%) | 0 (0.0%) |
| $100,000+ | 16 (5.7%) | 4 (2.5%) |
| Total | 280 (100.0%) | 163 (100.0%) |
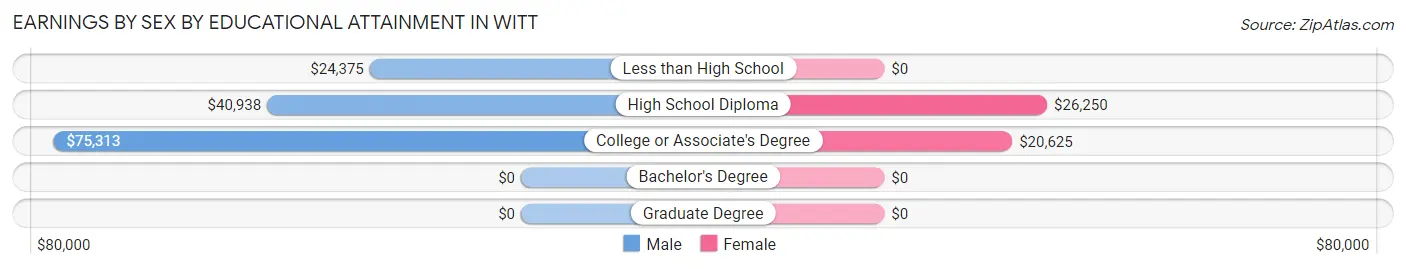
Earnings by Sex by Educational Attainment in Witt
Average earnings in Witt are $36,250 for men and $21,458 for women, a difference of 40.8%. Men with an educational attainment of college or associate's degree enjoy the highest average annual earnings of $75,313, while those with less than high school education earn the least with $24,375. Women with an educational attainment of high school diploma earn the most with the average annual earnings of $26,250, while those with college or associate's degree education have the smallest earnings of $20,625.
| Educational Attainment | Male Income | Female Income |
| Less than High School | $24,375 | $0 |
| High School Diploma | $40,938 | $26,250 |
| College or Associate's Degree | $75,313 | $20,625 |
| Bachelor's Degree | - | - |
| Graduate Degree | - | - |
| Total | $36,250 | $21,458 |
Family Income in Witt
Family Income Brackets in Witt
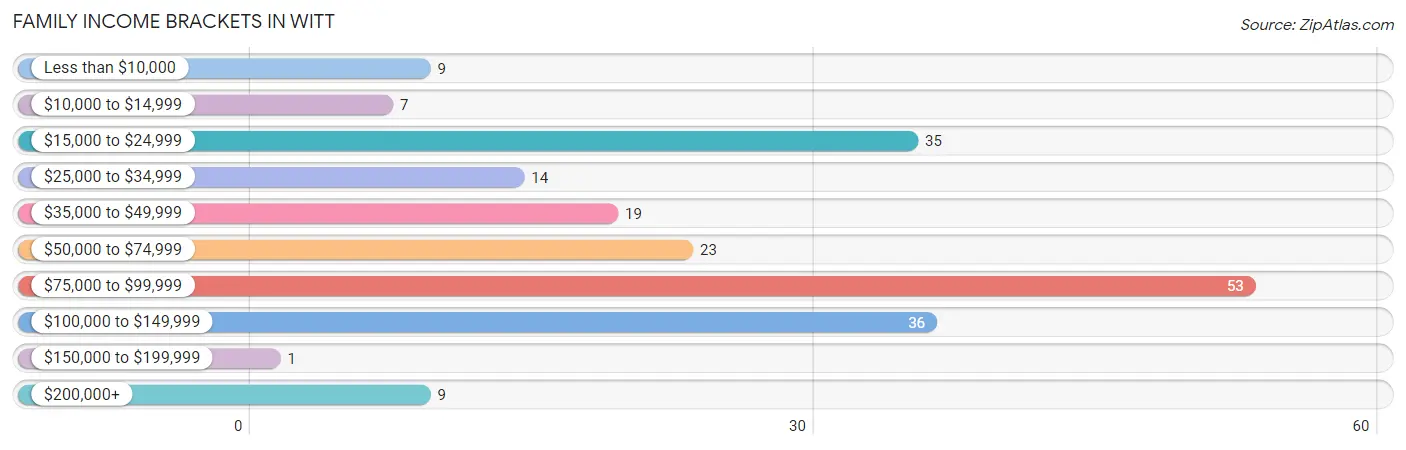
According to the Witt family income data, there are 53 families falling into the $75,000 to $99,999 income range, which is the most common income bracket and makes up 25.7% of all families. Conversely, the $150,000 to $199,999 income bracket is the least frequent group with only 1 families (0.5%) belonging to this category.
| Income Bracket | # Families | % Families |
| Less than $10,000 | 9 | 4.4% |
| $10,000 to $14,999 | 7 | 3.4% |
| $15,000 to $24,999 | 35 | 17.0% |
| $25,000 to $34,999 | 14 | 6.8% |
| $35,000 to $49,999 | 19 | 9.2% |
| $50,000 to $74,999 | 23 | 11.2% |
| $75,000 to $99,999 | 53 | 25.7% |
| $100,000 to $149,999 | 36 | 17.5% |
| $150,000 to $199,999 | 1 | 0.5% |
| $200,000+ | 9 | 4.4% |
Family Income by Famaliy Size in Witt
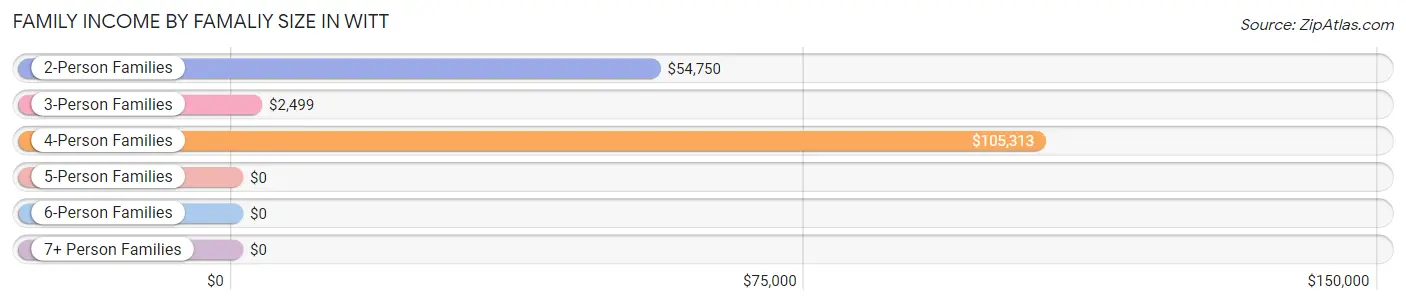
4-person families (21 | 10.2%) account for the highest median family income in Witt with $105,313 per family, while 2-person families (122 | 59.2%) have the highest median income of $27,375 per family member.
| Income Bracket | # Families | Median Income |
| 2-Person Families | 122 (59.2%) | $54,750 |
| 3-Person Families | 9 (4.4%) | $2,499 |
| 4-Person Families | 21 (10.2%) | $105,313 |
| 5-Person Families | 21 (10.2%) | $0 |
| 6-Person Families | 12 (5.8%) | $0 |
| 7+ Person Families | 21 (10.2%) | $0 |
| Total | 206 (100.0%) | $74,000 |
Family Income by Number of Earners in Witt
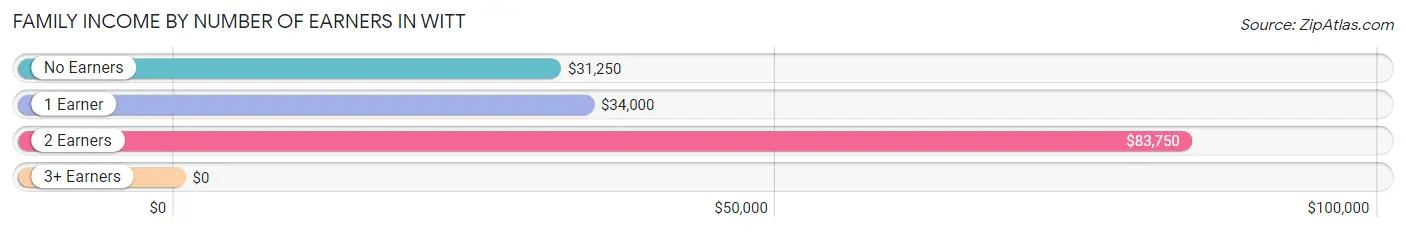
| Number of Earners | # Families | Median Income |
| No Earners | 34 (16.5%) | $31,250 |
| 1 Earner | 64 (31.1%) | $34,000 |
| 2 Earners | 90 (43.7%) | $83,750 |
| 3+ Earners | 18 (8.7%) | $0 |
| Total | 206 (100.0%) | $74,000 |
Household Income in Witt
Household Income Brackets in Witt
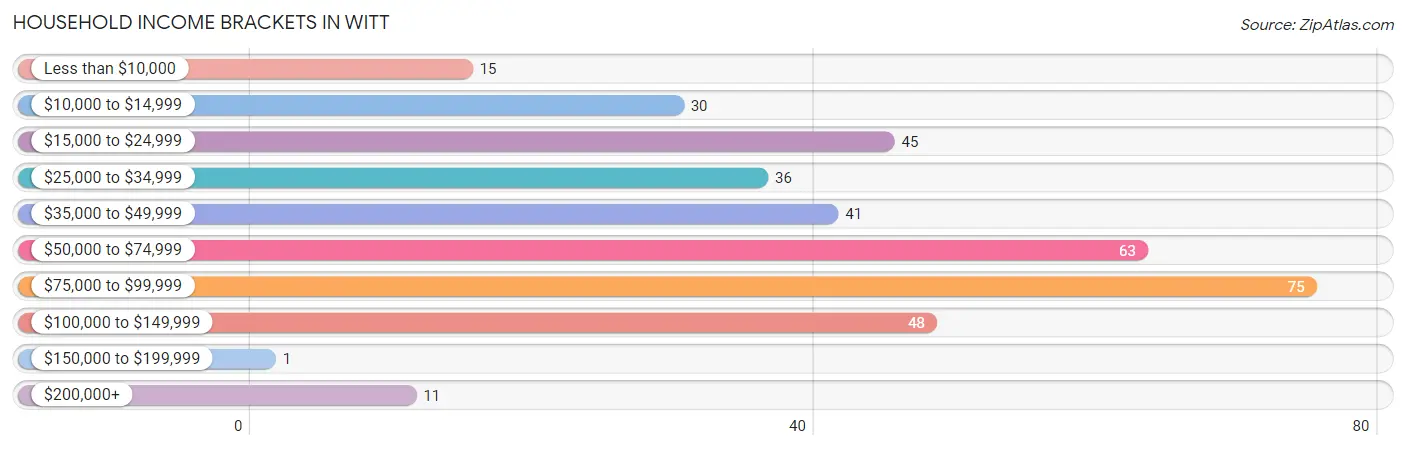
With 75 households falling in the category, the $75,000 to $99,999 income range is the most frequent in Witt, accounting for 20.5% of all households. In contrast, only 1 households (0.3%) fall into the $150,000 to $199,999 income bracket, making it the least populous group.
| Income Bracket | # Households | % Households |
| Less than $10,000 | 15 | 4.1% |
| $10,000 to $14,999 | 30 | 8.2% |
| $15,000 to $24,999 | 45 | 12.3% |
| $25,000 to $34,999 | 36 | 9.9% |
| $35,000 to $49,999 | 41 | 11.2% |
| $50,000 to $74,999 | 63 | 17.3% |
| $75,000 to $99,999 | 75 | 20.5% |
| $100,000 to $149,999 | 48 | 13.2% |
| $150,000 to $199,999 | 1 | 0.3% |
| $200,000+ | 11 | 3.0% |
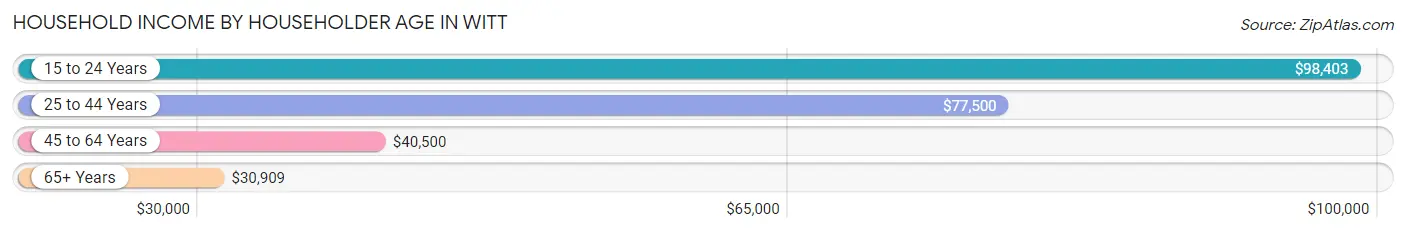
Household Income by Householder Age in Witt
The median household income in Witt is $53,301, with the highest median household income of $98,403 found in the 15 to 24 years age bracket for the primary householder. A total of 37 households (10.1%) fall into this category. Meanwhile, the 65+ years age bracket for the primary householder has the lowest median household income of $30,909, with 108 households (29.6%) in this group.
| Income Bracket | # Households | Median Income |
| 15 to 24 Years | 37 (10.1%) | $98,403 |
| 25 to 44 Years | 80 (21.9%) | $77,500 |
| 45 to 64 Years | 140 (38.4%) | $40,500 |
| 65+ Years | 108 (29.6%) | $30,909 |
| Total | 365 (100.0%) | $53,301 |
Poverty in Witt
Income Below Poverty by Sex and Age in Witt
With 21.2% poverty level for males and 25.2% for females among the residents of Witt, 15 year old males and 25 to 34 year old females are the most vulnerable to poverty, with 15 males (88.2%) and 19 females (48.7%) in their respective age groups living below the poverty level.
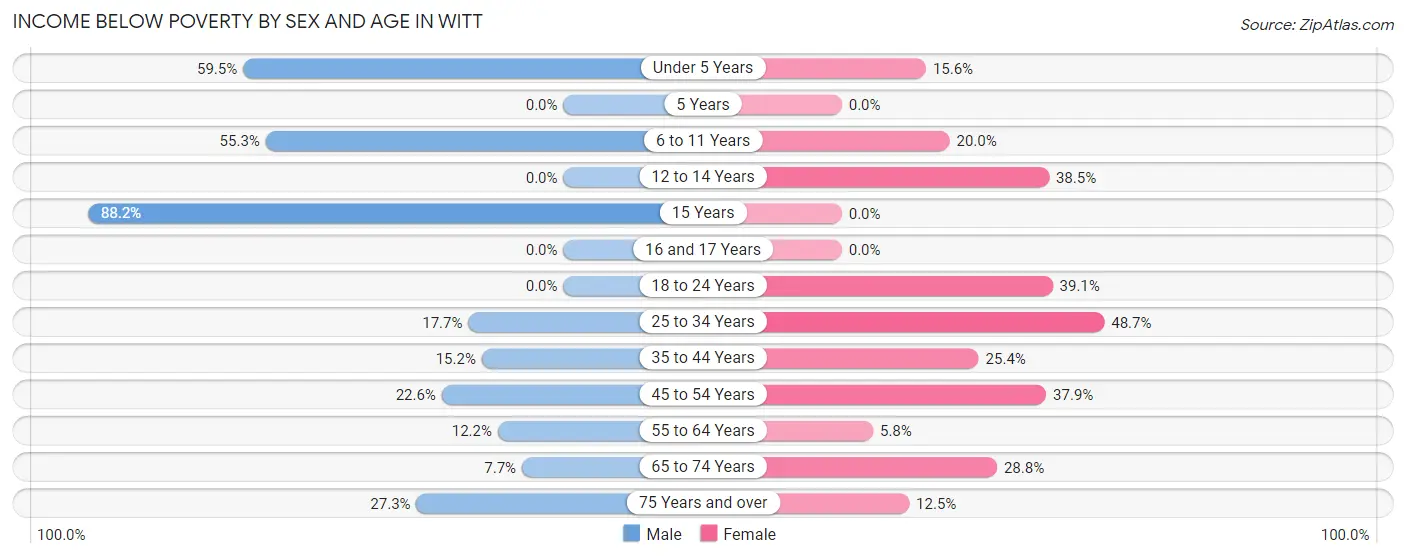
| Age Bracket | Male | Female |
| Under 5 Years | 22 (59.5%) | 5 (15.6%) |
| 5 Years | 0 (0.0%) | 0 (0.0%) |
| 6 to 11 Years | 21 (55.3%) | 15 (20.0%) |
| 12 to 14 Years | 0 (0.0%) | 5 (38.5%) |
| 15 Years | 15 (88.2%) | 0 (0.0%) |
| 16 and 17 Years | 0 (0.0%) | 0 (0.0%) |
| 18 to 24 Years | 0 (0.0%) | 18 (39.1%) |
| 25 to 34 Years | 9 (17.6%) | 19 (48.7%) |
| 35 to 44 Years | 5 (15.1%) | 16 (25.4%) |
| 45 to 54 Years | 14 (22.6%) | 11 (37.9%) |
| 55 to 64 Years | 9 (12.2%) | 4 (5.8%) |
| 65 to 74 Years | 3 (7.7%) | 17 (28.8%) |
| 75 Years and over | 6 (27.3%) | 2 (12.5%) |
| Total | 104 (21.2%) | 112 (25.2%) |
Income Above Poverty by Sex and Age in Witt
According to the poverty statistics in Witt, males aged 5 years and females aged 16 and 17 years are the age groups that are most secure financially, with 100.0% of males and 100.0% of females in these age groups living above the poverty line.
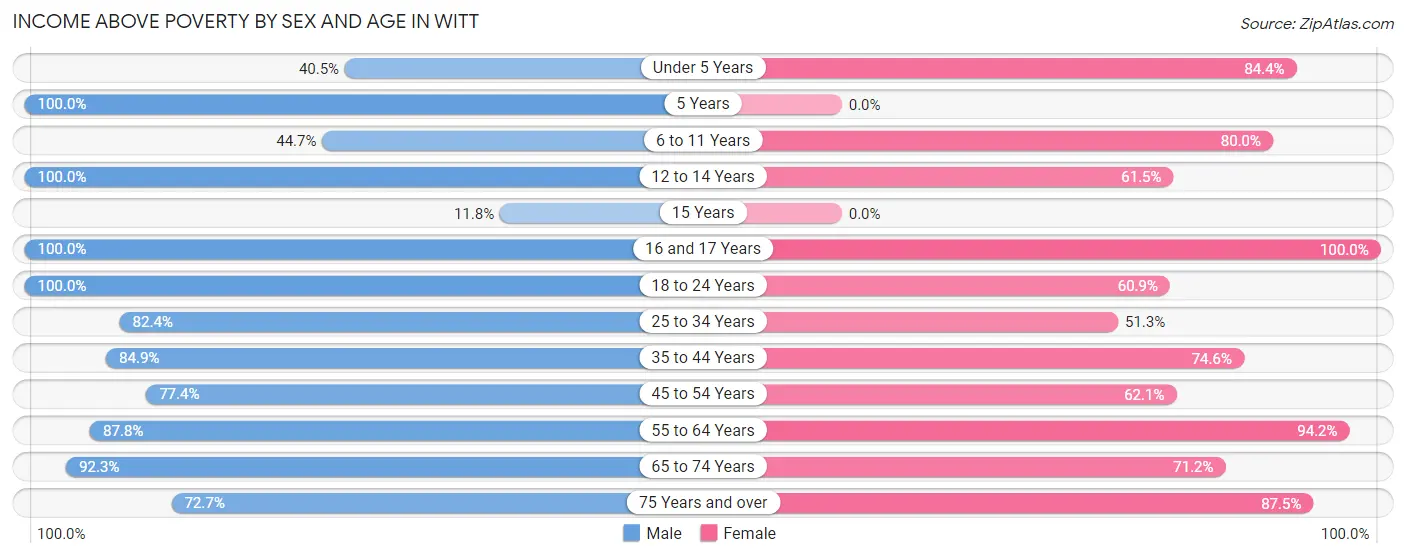
| Age Bracket | Male | Female |
| Under 5 Years | 15 (40.5%) | 27 (84.4%) |
| 5 Years | 2 (100.0%) | 0 (0.0%) |
| 6 to 11 Years | 17 (44.7%) | 60 (80.0%) |
| 12 to 14 Years | 13 (100.0%) | 8 (61.5%) |
| 15 Years | 2 (11.8%) | 0 (0.0%) |
| 16 and 17 Years | 4 (100.0%) | 3 (100.0%) |
| 18 to 24 Years | 99 (100.0%) | 28 (60.9%) |
| 25 to 34 Years | 42 (82.4%) | 20 (51.3%) |
| 35 to 44 Years | 28 (84.9%) | 47 (74.6%) |
| 45 to 54 Years | 48 (77.4%) | 18 (62.1%) |
| 55 to 64 Years | 65 (87.8%) | 65 (94.2%) |
| 65 to 74 Years | 36 (92.3%) | 42 (71.2%) |
| 75 Years and over | 16 (72.7%) | 14 (87.5%) |
| Total | 387 (78.8%) | 332 (74.8%) |
Income Below Poverty Among Married-Couple Families in Witt
The poverty statistics for married-couple families in Witt show that 5.2% or 7 of the total 135 families live below the poverty line. Families with 1 or 2 children have the highest poverty rate of 27.8%, comprising of 5 families. On the other hand, families with 3 or 4 children have the lowest poverty rate of 0.0%, which includes 0 families.
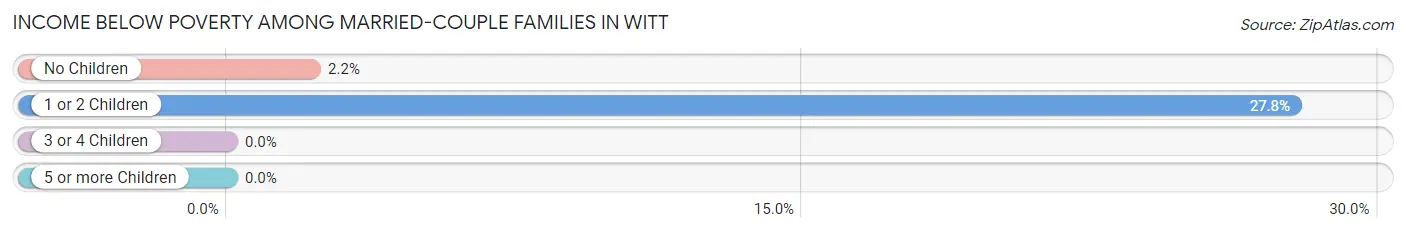
| Children | Above Poverty | Below Poverty |
| No Children | 90 (97.8%) | 2 (2.2%) |
| 1 or 2 Children | 13 (72.2%) | 5 (27.8%) |
| 3 or 4 Children | 19 (100.0%) | 0 (0.0%) |
| 5 or more Children | 6 (100.0%) | 0 (0.0%) |
| Total | 128 (94.8%) | 7 (5.2%) |
Income Below Poverty Among Single-Parent Households in Witt
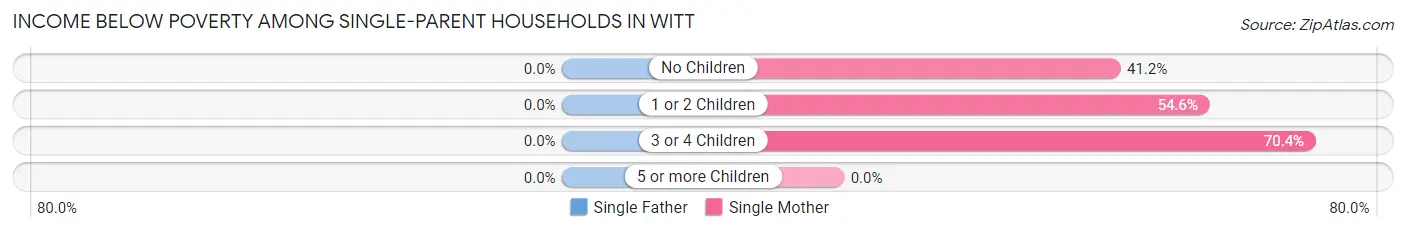
| Children | Single Father | Single Mother |
| No Children | 0 (0.0%) | 7 (41.2%) |
| 1 or 2 Children | 0 (0.0%) | 6 (54.5%) |
| 3 or 4 Children | 0 (0.0%) | 19 (70.4%) |
| 5 or more Children | 0 (0.0%) | 0 (0.0%) |
| Total | 0 (0.0%) | 32 (58.2%) |
Income Below Poverty Among Married-Couple vs Single-Parent Households in Witt
The poverty data for Witt shows that 7 of the married-couple family households (5.2%) and 32 of the single-parent households (45.1%) are living below the poverty level. Within the married-couple family households, those with 1 or 2 children have the highest poverty rate, with 5 households (27.8%) falling below the poverty line. Among the single-parent households, those with 3 or 4 children have the highest poverty rate, with 19 household (70.4%) living below poverty.
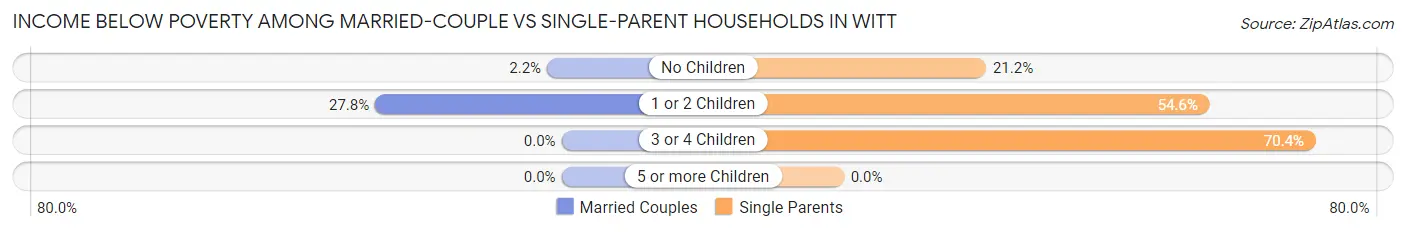
| Children | Married-Couple Families | Single-Parent Households |
| No Children | 2 (2.2%) | 7 (21.2%) |
| 1 or 2 Children | 5 (27.8%) | 6 (54.5%) |
| 3 or 4 Children | 0 (0.0%) | 19 (70.4%) |
| 5 or more Children | 0 (0.0%) | 0 (0.0%) |
| Total | 7 (5.2%) | 32 (45.1%) |
Race in Witt
The most populous races in Witt are White / Caucasian (905 | 96.8%), Two or more Races (14 | 1.5%), and Black / African American (13 | 1.4%).
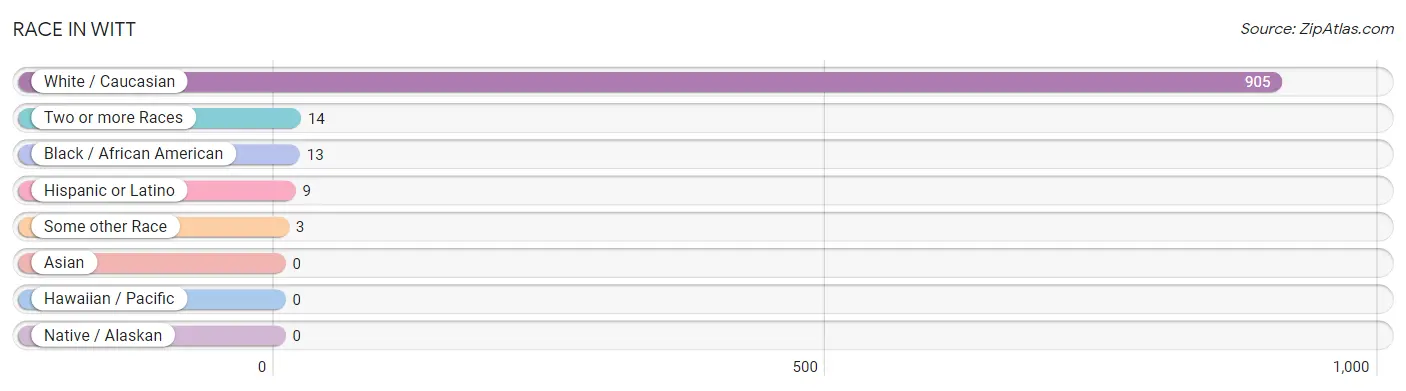
| Race | # Population | % Population |
| Asian | 0 | 0.0% |
| Black / African American | 13 | 1.4% |
| Hawaiian / Pacific | 0 | 0.0% |
| Hispanic or Latino | 9 | 1.0% |
| Native / Alaskan | 0 | 0.0% |
| White / Caucasian | 905 | 96.8% |
| Two or more Races | 14 | 1.5% |
| Some other Race | 3 | 0.3% |
| Total | 935 | 100.0% |
Ancestry in Witt
The most populous ancestries reported in Witt are German (273 | 29.2%), American (162 | 17.3%), Italian (99 | 10.6%), Irish (91 | 9.7%), and English (57 | 6.1%), together accounting for 72.9% of all Witt residents.
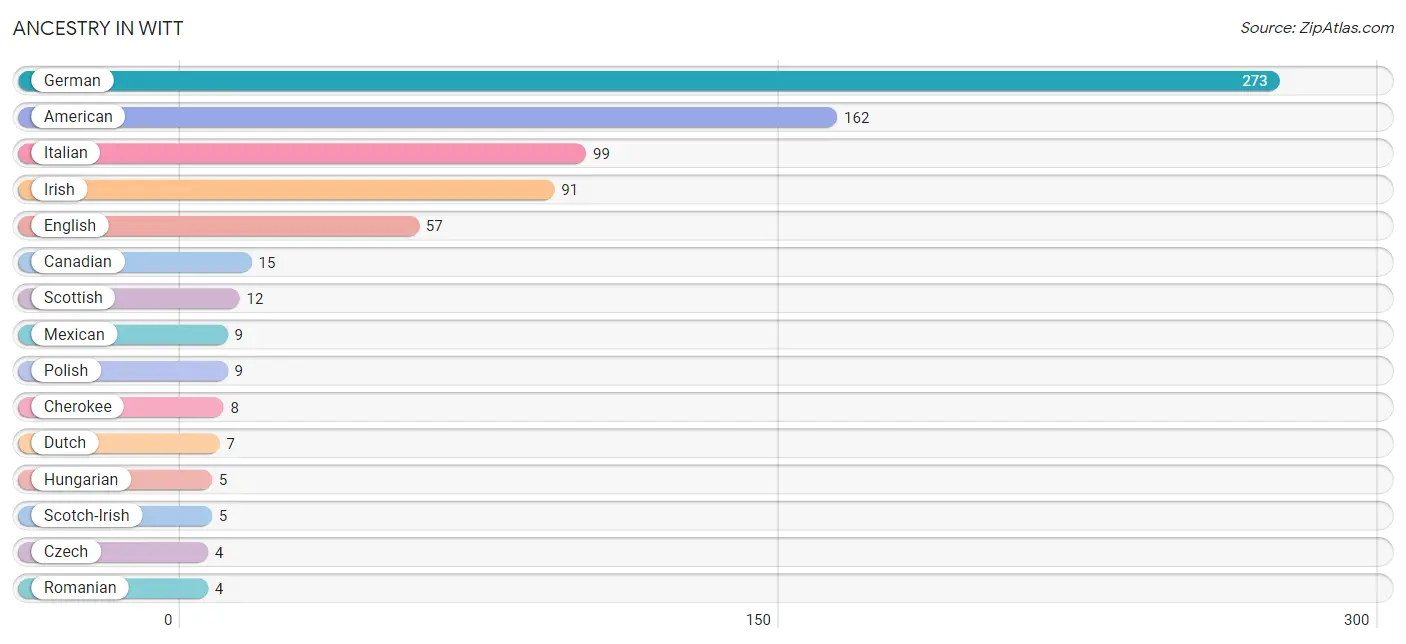
| Ancestry | # Population | % Population |
| American | 162 | 17.3% |
| Canadian | 15 | 1.6% |
| Cherokee | 8 | 0.9% |
| Czech | 4 | 0.4% |
| Dutch | 7 | 0.7% |
| English | 57 | 6.1% |
| French | 1 | 0.1% |
| German | 273 | 29.2% |
| Hungarian | 5 | 0.5% |
| Irish | 91 | 9.7% |
| Italian | 99 | 10.6% |
| Mexican | 9 | 1.0% |
| Polish | 9 | 1.0% |
| Romanian | 4 | 0.4% |
| Scotch-Irish | 5 | 0.5% |
| Scottish | 12 | 1.3% |
| Slovak | 2 | 0.2% |
| Swedish | 4 | 0.4% | View All 18 Rows |
Immigrants in Witt

| Immigration Origin | # Population | % Population | View All 0 Rows |
Sex and Age in Witt
Sex and Age in Witt
The most populous age groups in Witt are 15 to 19 Years (90 | 18.3%) for men and 5 to 9 Years (51 | 11.5%) for women.
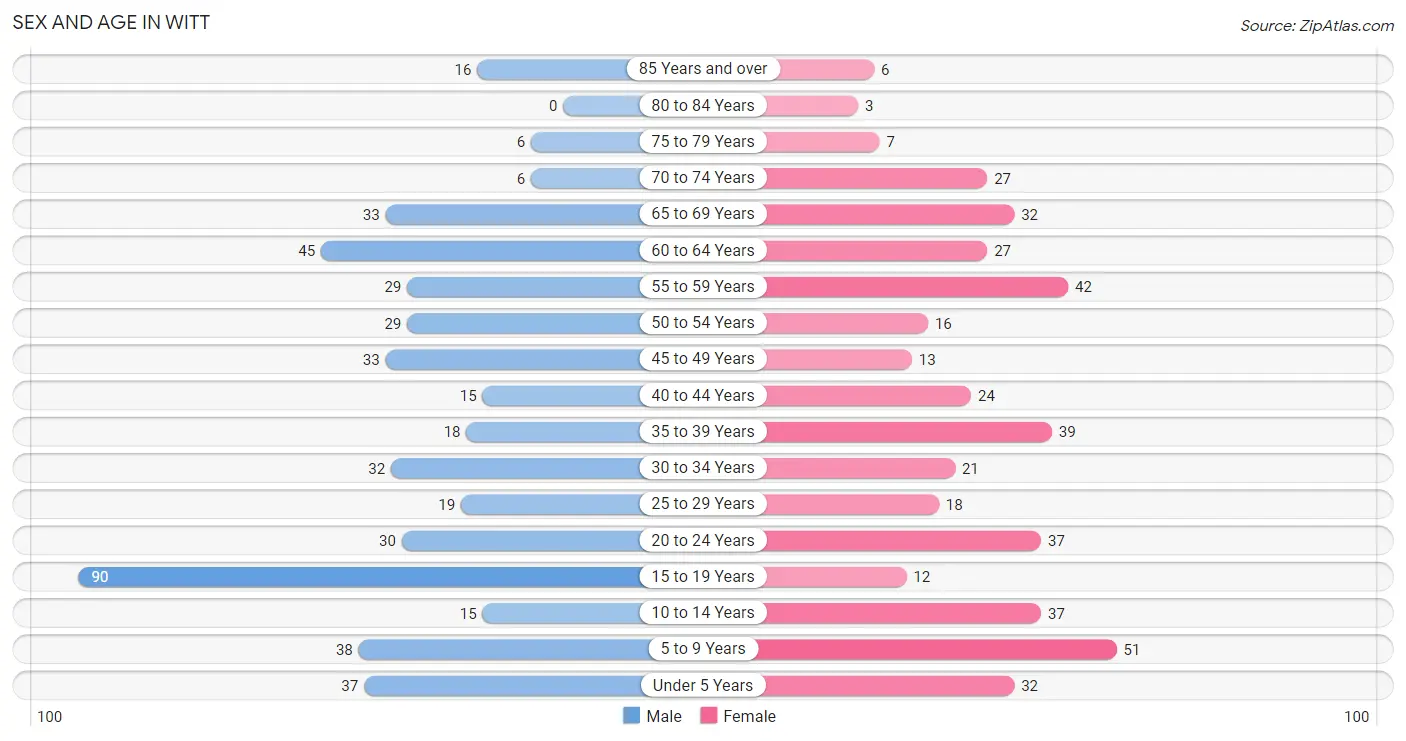
| Age Bracket | Male | Female |
| Under 5 Years | 37 (7.5%) | 32 (7.2%) |
| 5 to 9 Years | 38 (7.7%) | 51 (11.5%) |
| 10 to 14 Years | 15 (3.0%) | 37 (8.3%) |
| 15 to 19 Years | 90 (18.3%) | 12 (2.7%) |
| 20 to 24 Years | 30 (6.1%) | 37 (8.3%) |
| 25 to 29 Years | 19 (3.9%) | 18 (4.1%) |
| 30 to 34 Years | 32 (6.5%) | 21 (4.7%) |
| 35 to 39 Years | 18 (3.7%) | 39 (8.8%) |
| 40 to 44 Years | 15 (3.0%) | 24 (5.4%) |
| 45 to 49 Years | 33 (6.7%) | 13 (2.9%) |
| 50 to 54 Years | 29 (5.9%) | 16 (3.6%) |
| 55 to 59 Years | 29 (5.9%) | 42 (9.5%) |
| 60 to 64 Years | 45 (9.2%) | 27 (6.1%) |
| 65 to 69 Years | 33 (6.7%) | 32 (7.2%) |
| 70 to 74 Years | 6 (1.2%) | 27 (6.1%) |
| 75 to 79 Years | 6 (1.2%) | 7 (1.6%) |
| 80 to 84 Years | 0 (0.0%) | 3 (0.7%) |
| 85 Years and over | 16 (3.3%) | 6 (1.3%) |
| Total | 491 (100.0%) | 444 (100.0%) |
Families and Households in Witt
Median Family Size in Witt
The median family size in Witt is 3.27 persons per family, with single female/mother families (55 | 26.7%) accounting for the largest median family size of 3.8 persons per family. On the other hand, single male/father families (16 | 7.8%) represent the smallest median family size with 2.00 persons per family.
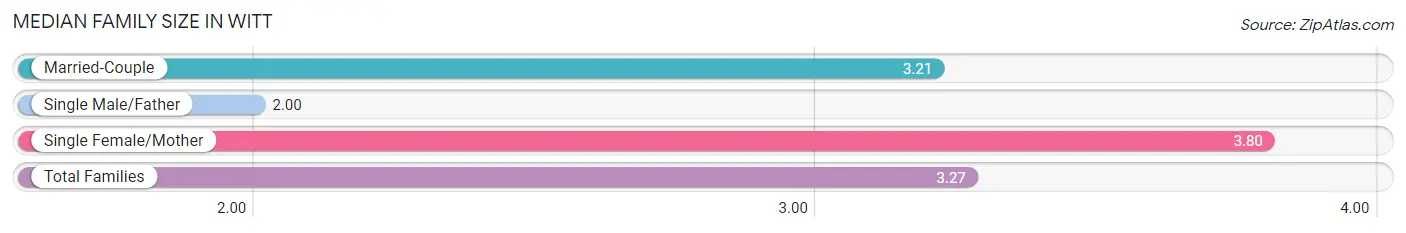
| Family Type | # Families | Family Size |
| Married-Couple | 135 (65.5%) | 3.21 |
| Single Male/Father | 16 (7.8%) | 2.00 |
| Single Female/Mother | 55 (26.7%) | 3.80 |
| Total Families | 206 (100.0%) | 3.27 |
Median Household Size in Witt
The median household size in Witt is 2.56 persons per household, with single female/mother households (55 | 15.1%) accounting for the largest median household size of 4.49 persons per household. non-family households (159 | 43.6%) represent the smallest median household size with 1.37 persons per household.
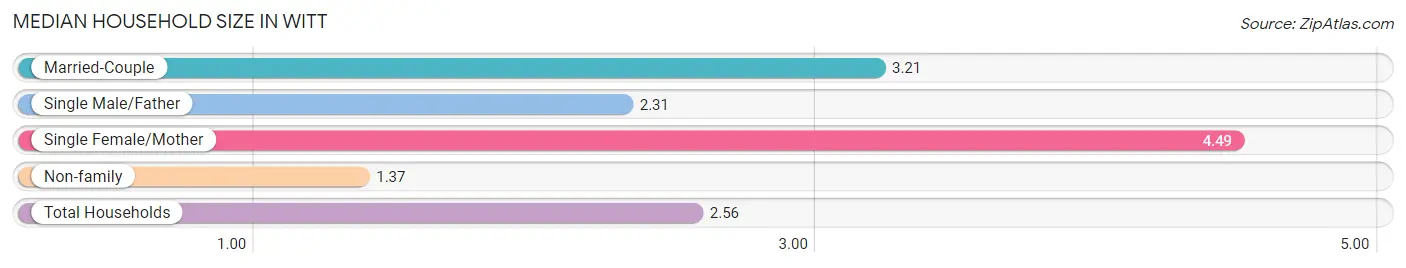
| Household Type | # Households | Household Size |
| Married-Couple | 135 (37.0%) | 3.21 |
| Single Male/Father | 16 (4.4%) | 2.31 |
| Single Female/Mother | 55 (15.1%) | 4.49 |
| Non-family | 159 (43.6%) | 1.37 |
| Total Households | 365 (100.0%) | 2.56 |
Household Size by Marriage Status in Witt
Out of a total of 365 households in Witt, 206 (56.4%) are family households, while 159 (43.6%) are nonfamily households. The most numerous type of family households are 2-person households, comprising 114, and the most common type of nonfamily households are 1-person households, comprising 125.
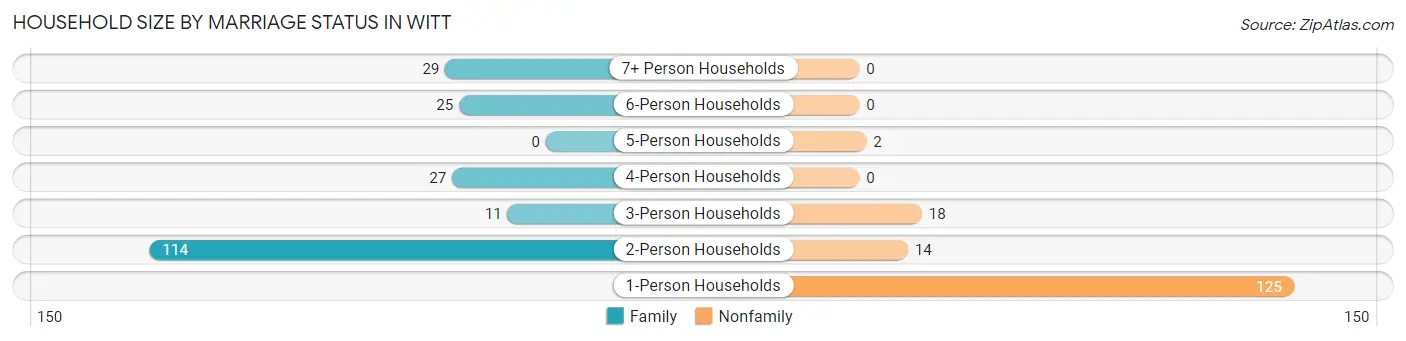
| Household Size | Family Households | Nonfamily Households |
| 1-Person Households | - | 125 (34.3%) |
| 2-Person Households | 114 (31.2%) | 14 (3.8%) |
| 3-Person Households | 11 (3.0%) | 18 (4.9%) |
| 4-Person Households | 27 (7.4%) | 0 (0.0%) |
| 5-Person Households | 0 (0.0%) | 2 (0.5%) |
| 6-Person Households | 25 (6.9%) | 0 (0.0%) |
| 7+ Person Households | 29 (8.0%) | 0 (0.0%) |
| Total | 206 (56.4%) | 159 (43.6%) |
Female Fertility in Witt
Fertility by Age in Witt
Average fertility rate in Witt is 110.0 births per 1,000 women. Women in the age bracket of 20 to 34 years have the highest fertility rate with 237.0 births per 1,000 women. Women in the age bracket of 20 to 34 years acount for 100.0% of all women with births.
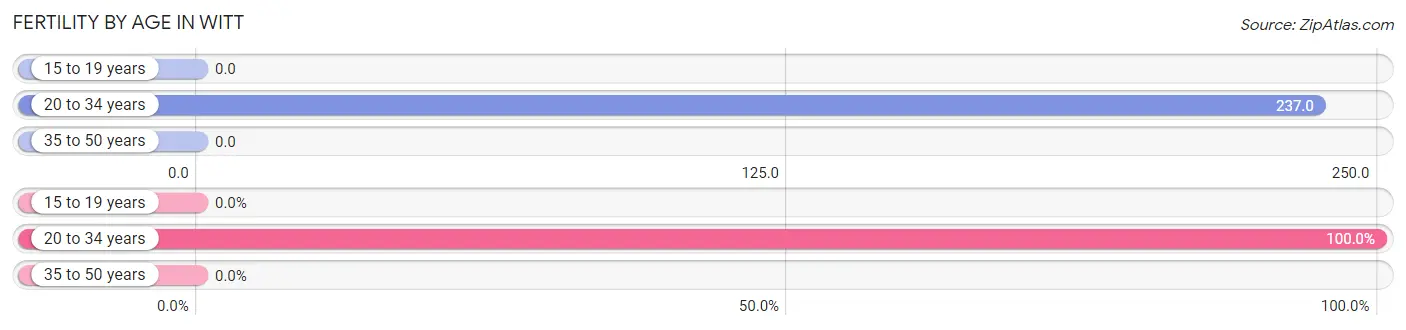
| Age Bracket | Women with Births | Births / 1,000 Women |
| 15 to 19 years | 0 (0.0%) | 0.0 |
| 20 to 34 years | 18 (100.0%) | 237.0 |
| 35 to 50 years | 0 (0.0%) | 0.0 |
| Total | 18 (100.0%) | 110.0 |
Fertility by Age by Marriage Status in Witt
66.7% of women with births (18) in Witt are married. The highest percentage of unmarried women with births falls into 20 to 34 years age bracket with 33.3% of them unmarried at the time of birth, while the lowest percentage of unmarried women with births belong to 20 to 34 years age bracket with 33.3% of them unmarried.
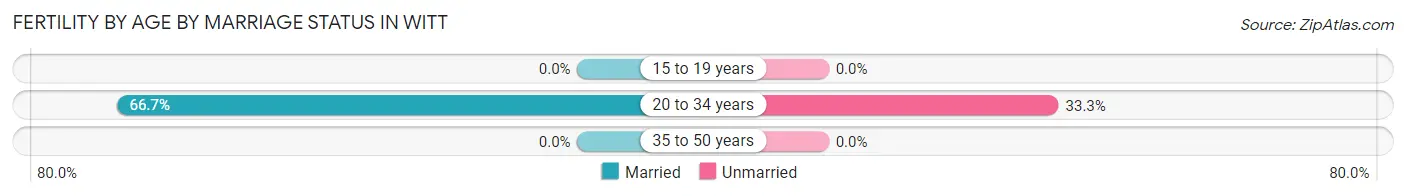
| Age Bracket | Married | Unmarried |
| 15 to 19 years | 0 (0.0%) | 0 (0.0%) |
| 20 to 34 years | 12 (66.7%) | 6 (33.3%) |
| 35 to 50 years | 0 (0.0%) | 0 (0.0%) |
| Total | 12 (66.7%) | 6 (33.3%) |
Fertility by Education in Witt
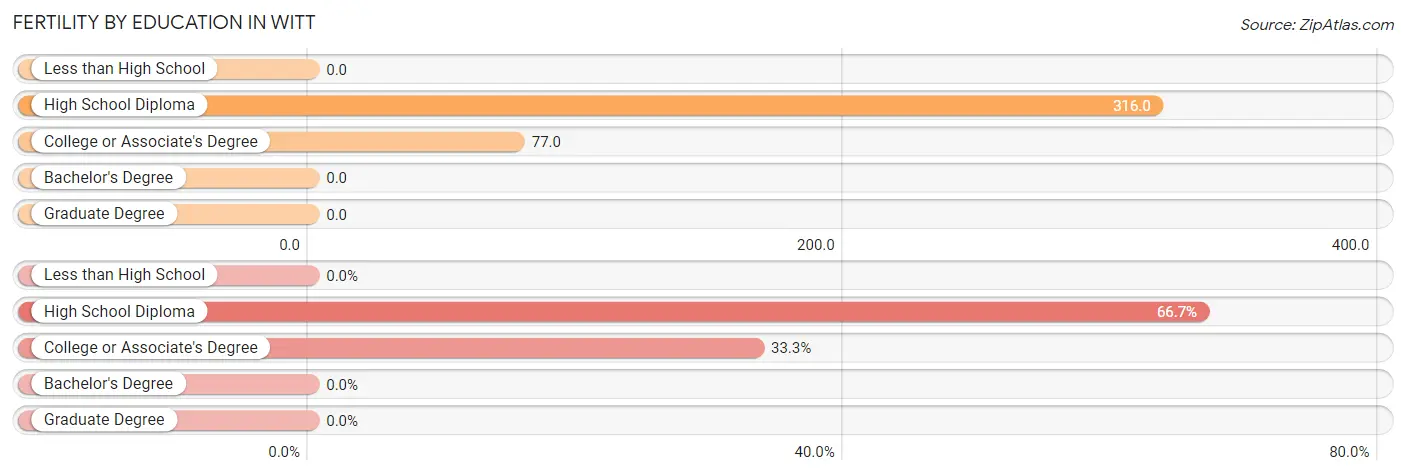
| Educational Attainment | Women with Births | Births / 1,000 Women |
| Less than High School | 0 (0.0%) | 0.0 |
| High School Diploma | 12 (66.7%) | 316.0 |
| College or Associate's Degree | 6 (33.3%) | 77.0 |
| Bachelor's Degree | 0 (0.0%) | 0.0 |
| Graduate Degree | 0 (0.0%) | 0.0 |
| Total | 18 (100.0%) | 110.0 |
Fertility by Education by Marriage Status in Witt
33.3% of women with births in Witt are unmarried. Women with the educational attainment of high school diploma are most likely to be married with 100.0% of them married at childbirth, while women with the educational attainment of college or associate's degree are least likely to be married with 100.0% of them unmarried at childbirth.
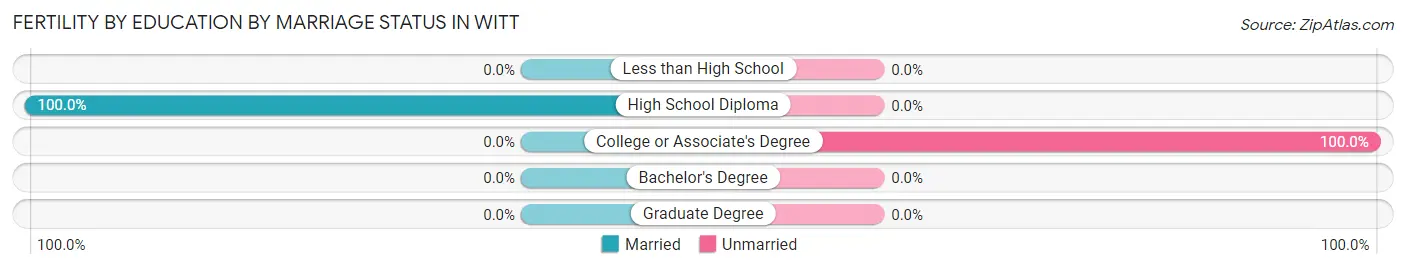
| Educational Attainment | Married | Unmarried |
| Less than High School | 0 (0.0%) | 0 (0.0%) |
| High School Diploma | 12 (100.0%) | 0 (0.0%) |
| College or Associate's Degree | 0 (0.0%) | 6 (100.0%) |
| Bachelor's Degree | 0 (0.0%) | 0 (0.0%) |
| Graduate Degree | 0 (0.0%) | 0 (0.0%) |
| Total | 12 (66.7%) | 6 (33.3%) |
Employment Characteristics in Witt
Employment by Class of Employer in Witt
Among the 371 employed individuals in Witt, private company employees (265 | 71.4%), not-for-profit organizations (45 | 12.1%), and state government employees (27 | 7.3%) make up the most common classes of employment.
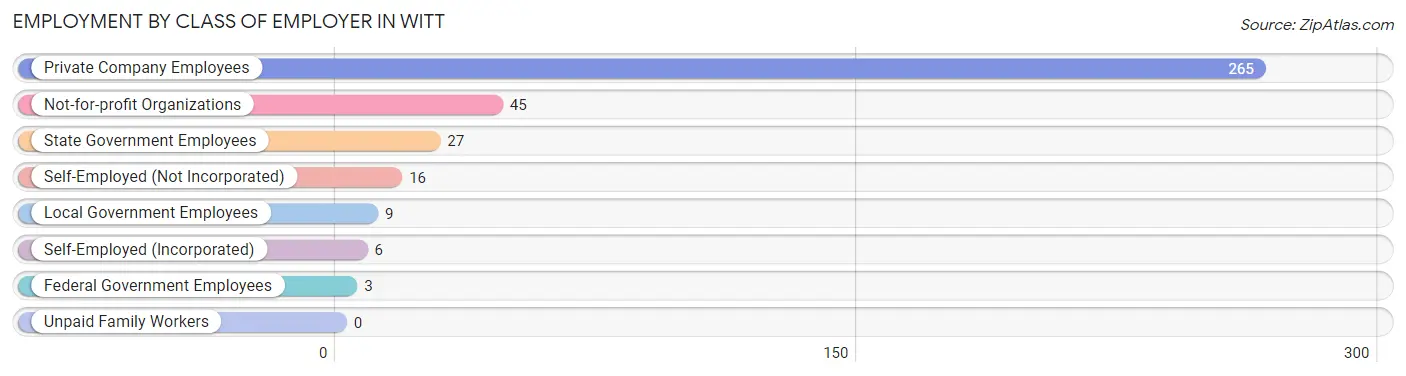
| Employer Class | # Employees | % Employees |
| Private Company Employees | 265 | 71.4% |
| Self-Employed (Incorporated) | 6 | 1.6% |
| Self-Employed (Not Incorporated) | 16 | 4.3% |
| Not-for-profit Organizations | 45 | 12.1% |
| Local Government Employees | 9 | 2.4% |
| State Government Employees | 27 | 7.3% |
| Federal Government Employees | 3 | 0.8% |
| Unpaid Family Workers | 0 | 0.0% |
| Total | 371 | 100.0% |
Employment Status by Age in Witt
According to the labor force statistics for Witt, out of the total population over 16 years of age (708), 58.1% or 411 individuals are in the labor force, with 9.7% or 40 of them unemployed. The age group with the highest labor force participation rate is 25 to 29 years, with 100.0% or 37 individuals in the labor force. Within the labor force, the 30 to 34 years age range has the highest percentage of unemployed individuals, with 27.5% or 14 of them being unemployed.
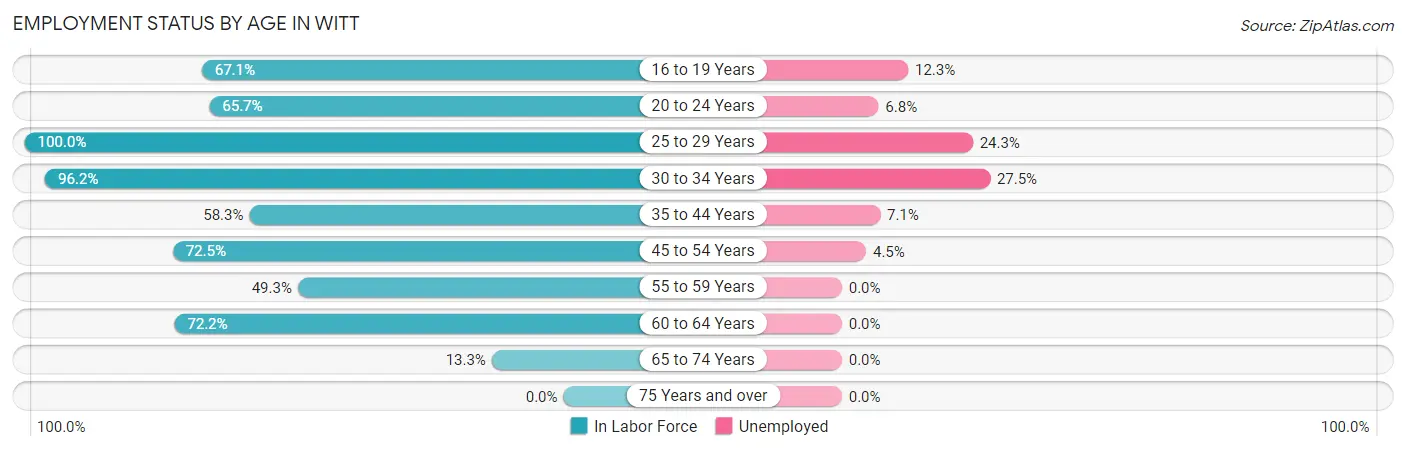
| Age Bracket | In Labor Force | Unemployed |
| 16 to 19 Years | 57 (67.1%) | 7 (12.3%) |
| 20 to 24 Years | 44 (65.7%) | 3 (6.8%) |
| 25 to 29 Years | 37 (100.0%) | 9 (24.3%) |
| 30 to 34 Years | 51 (96.2%) | 14 (27.5%) |
| 35 to 44 Years | 56 (58.3%) | 4 (7.1%) |
| 45 to 54 Years | 66 (72.5%) | 3 (4.5%) |
| 55 to 59 Years | 35 (49.3%) | 0 (0.0%) |
| 60 to 64 Years | 52 (72.2%) | 0 (0.0%) |
| 65 to 74 Years | 13 (13.3%) | 0 (0.0%) |
| 75 Years and over | 0 (0.0%) | 0 (0.0%) |
| Total | 411 (58.1%) | 40 (9.7%) |
Employment Status by Educational Attainment in Witt
According to labor force statistics for Witt, 70.7% of individuals (297) out of the total population between 25 and 64 years of age (420) are in the labor force, with 10.1% or 30 of them being unemployed. The group with the highest labor force participation rate are those with the educational attainment of less than high school, with 80.0% or 64 individuals in the labor force. Within the labor force, individuals with less than high school education have the highest percentage of unemployment, with 25.0% or 16 of them being unemployed.
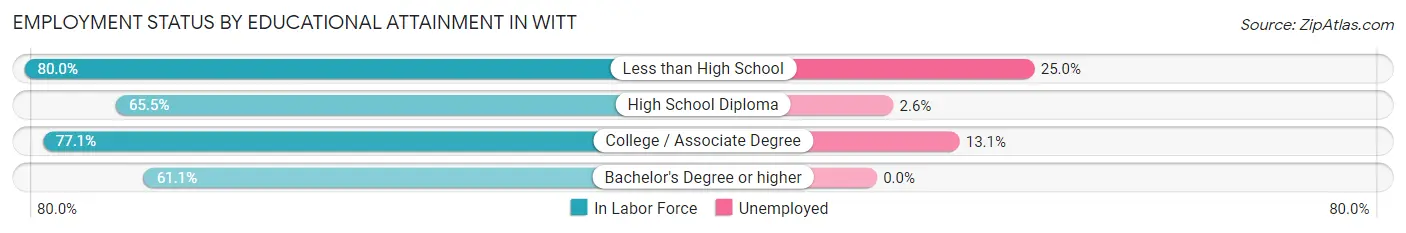
| Educational Attainment | In Labor Force | Unemployed |
| Less than High School | 64 (80.0%) | 20 (25.0%) |
| High School Diploma | 116 (65.5%) | 5 (2.6%) |
| College / Associate Degree | 84 (77.1%) | 14 (13.1%) |
| Bachelor's Degree or higher | 33 (61.1%) | 0 (0.0%) |
| Total | 297 (70.7%) | 42 (10.1%) |
Employment Occupations by Sex in Witt
Management, Business, Science and Arts Occupations
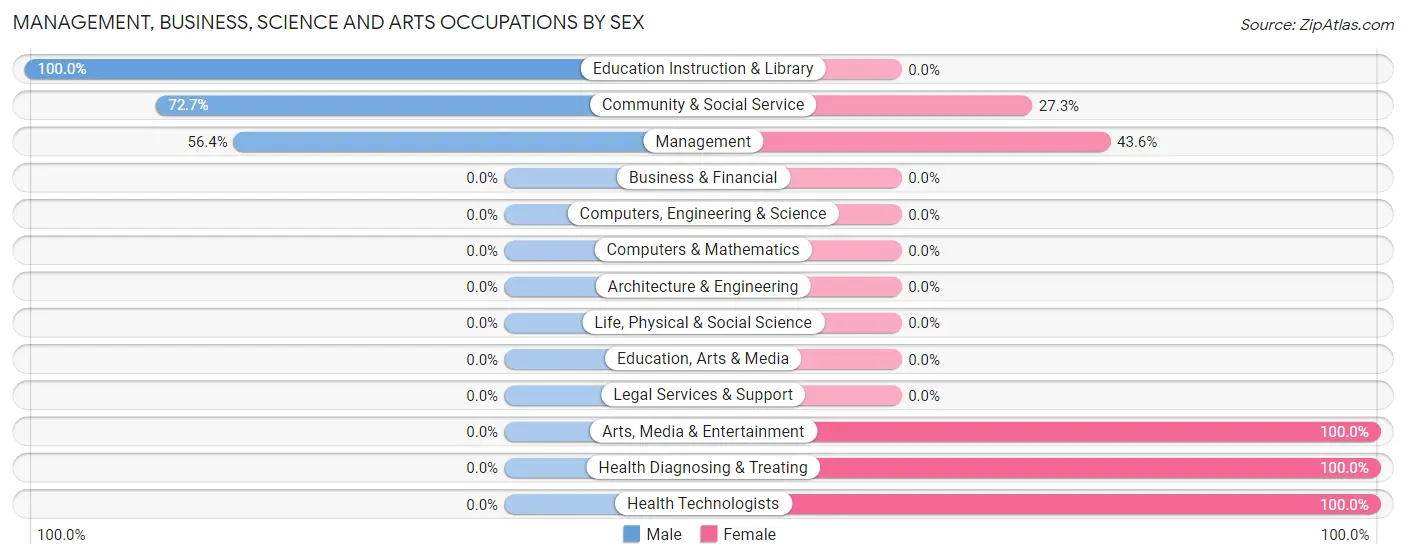
The most common Management, Business, Science and Arts occupations in Witt are Management (39 | 10.5%), Health Diagnosing & Treating (31 | 8.4%), Health Technologists (23 | 6.2%), Community & Social Service (11 | 3.0%), and Education Instruction & Library (8 | 2.2%).
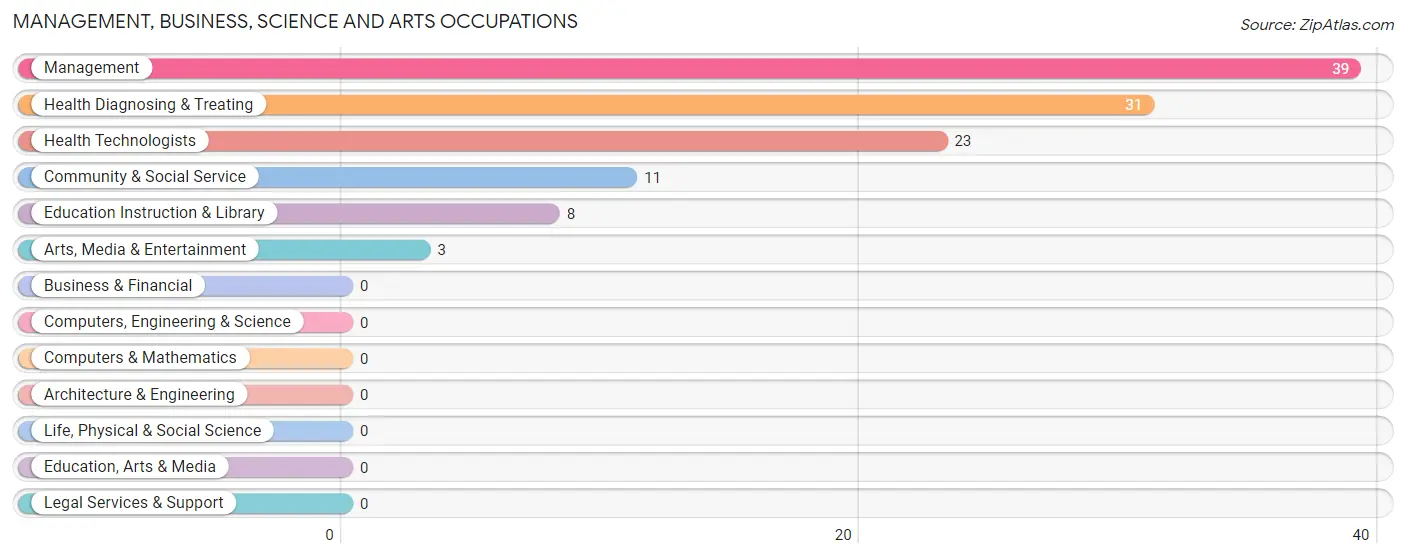
Management, Business, Science and Arts Occupations by Sex
Within the Management, Business, Science and Arts occupations in Witt, the most male-oriented occupations are Education Instruction & Library (100.0%), Community & Social Service (72.7%), and Management (56.4%), while the most female-oriented occupations are Arts, Media & Entertainment (100.0%), Health Diagnosing & Treating (100.0%), and Health Technologists (100.0%).
| Occupation | Male | Female |
| Management | 22 (56.4%) | 17 (43.6%) |
| Business & Financial | 0 (0.0%) | 0 (0.0%) |
| Computers, Engineering & Science | 0 (0.0%) | 0 (0.0%) |
| Computers & Mathematics | 0 (0.0%) | 0 (0.0%) |
| Architecture & Engineering | 0 (0.0%) | 0 (0.0%) |
| Life, Physical & Social Science | 0 (0.0%) | 0 (0.0%) |
| Community & Social Service | 8 (72.7%) | 3 (27.3%) |
| Education, Arts & Media | 0 (0.0%) | 0 (0.0%) |
| Legal Services & Support | 0 (0.0%) | 0 (0.0%) |
| Education Instruction & Library | 8 (100.0%) | 0 (0.0%) |
| Arts, Media & Entertainment | 0 (0.0%) | 3 (100.0%) |
| Health Diagnosing & Treating | 0 (0.0%) | 31 (100.0%) |
| Health Technologists | 0 (0.0%) | 23 (100.0%) |
| Total (Category) | 30 (37.0%) | 51 (63.0%) |
| Total (Overall) | 243 (65.5%) | 128 (34.5%) |
Services Occupations
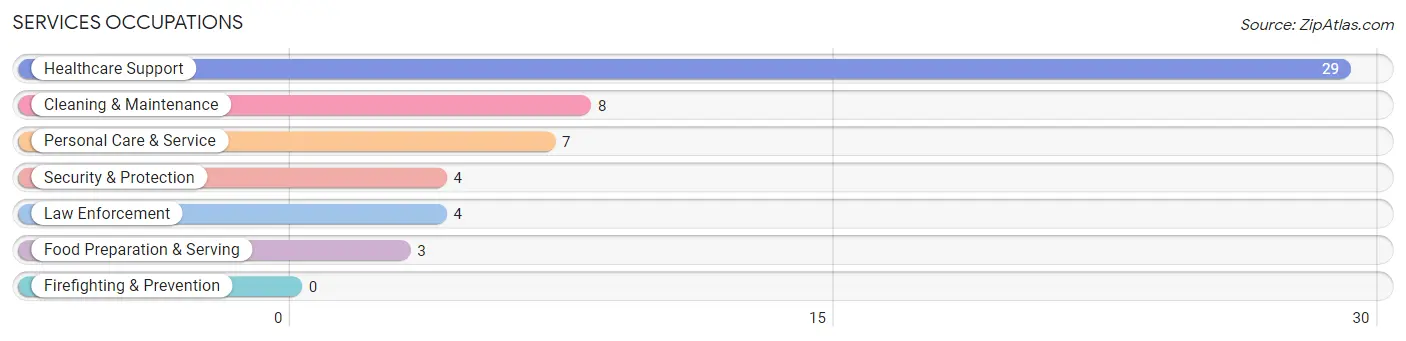
The most common Services occupations in Witt are Healthcare Support (29 | 7.8%), Cleaning & Maintenance (8 | 2.2%), Personal Care & Service (7 | 1.9%), Security & Protection (4 | 1.1%), and Law Enforcement (4 | 1.1%).
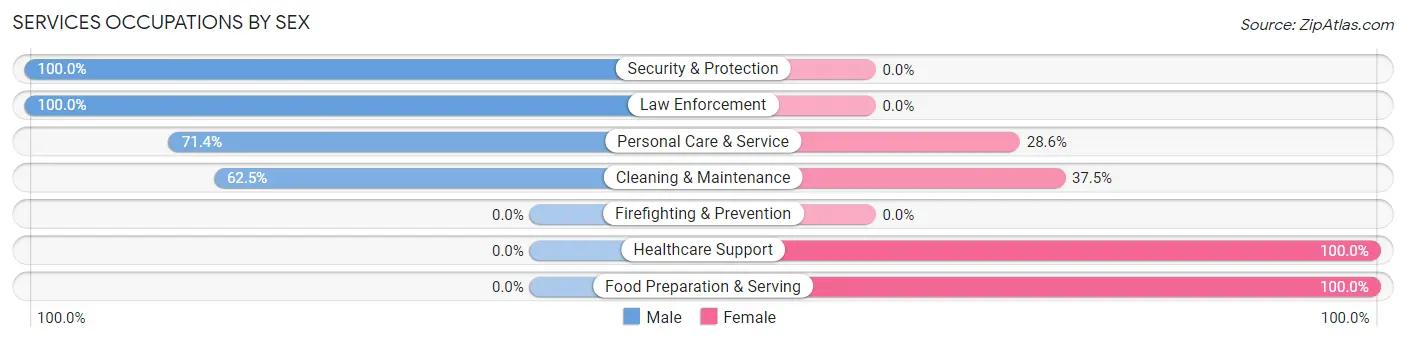
Services Occupations by Sex
Within the Services occupations in Witt, the most male-oriented occupations are Security & Protection (100.0%), Law Enforcement (100.0%), and Personal Care & Service (71.4%), while the most female-oriented occupations are Healthcare Support (100.0%), Food Preparation & Serving (100.0%), and Cleaning & Maintenance (37.5%).
| Occupation | Male | Female |
| Healthcare Support | 0 (0.0%) | 29 (100.0%) |
| Security & Protection | 4 (100.0%) | 0 (0.0%) |
| Firefighting & Prevention | 0 (0.0%) | 0 (0.0%) |
| Law Enforcement | 4 (100.0%) | 0 (0.0%) |
| Food Preparation & Serving | 0 (0.0%) | 3 (100.0%) |
| Cleaning & Maintenance | 5 (62.5%) | 3 (37.5%) |
| Personal Care & Service | 5 (71.4%) | 2 (28.6%) |
| Total (Category) | 14 (27.5%) | 37 (72.6%) |
| Total (Overall) | 243 (65.5%) | 128 (34.5%) |
Sales and Office Occupations
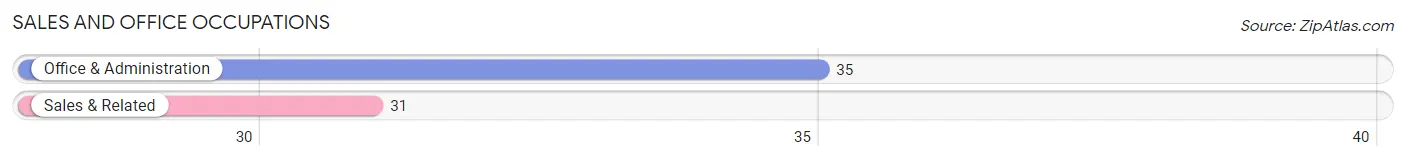
The most common Sales and Office occupations in Witt are Office & Administration (35 | 9.4%), and Sales & Related (31 | 8.4%).
Sales and Office Occupations by Sex
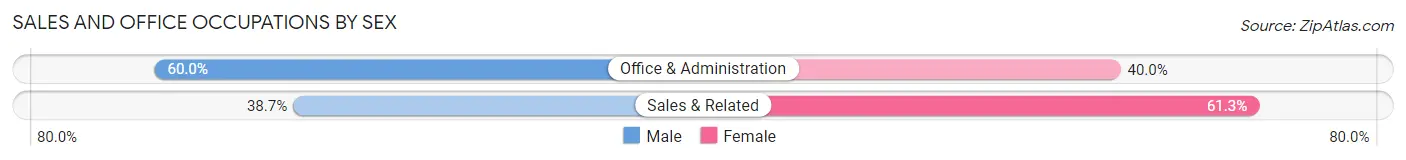
| Occupation | Male | Female |
| Sales & Related | 12 (38.7%) | 19 (61.3%) |
| Office & Administration | 21 (60.0%) | 14 (40.0%) |
| Total (Category) | 33 (50.0%) | 33 (50.0%) |
| Total (Overall) | 243 (65.5%) | 128 (34.5%) |
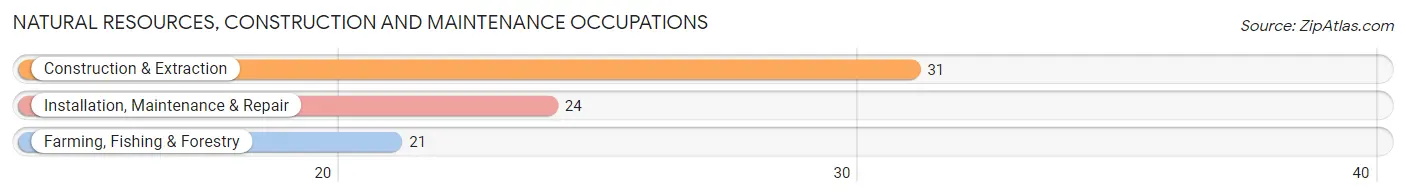
Natural Resources, Construction and Maintenance Occupations
The most common Natural Resources, Construction and Maintenance occupations in Witt are Construction & Extraction (31 | 8.4%), Installation, Maintenance & Repair (24 | 6.5%), and Farming, Fishing & Forestry (21 | 5.7%).
Natural Resources, Construction and Maintenance Occupations by Sex
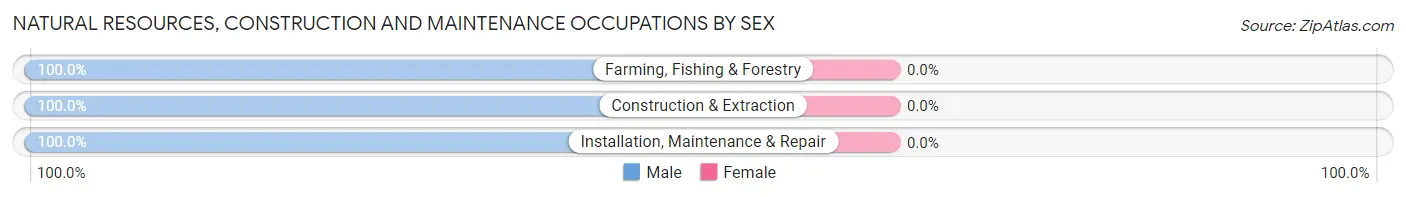
| Occupation | Male | Female |
| Farming, Fishing & Forestry | 21 (100.0%) | 0 (0.0%) |
| Construction & Extraction | 31 (100.0%) | 0 (0.0%) |
| Installation, Maintenance & Repair | 24 (100.0%) | 0 (0.0%) |
| Total (Category) | 76 (100.0%) | 0 (0.0%) |
| Total (Overall) | 243 (65.5%) | 128 (34.5%) |
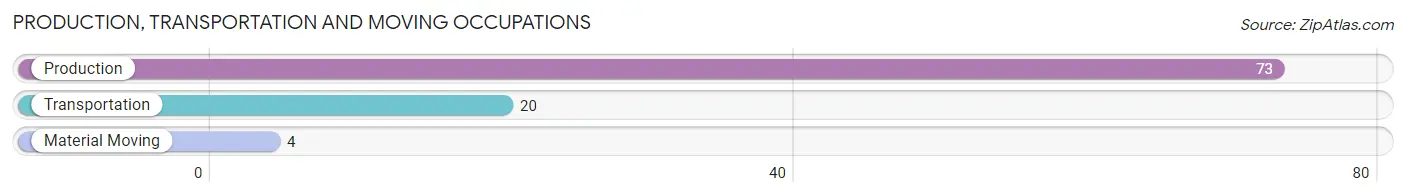
Production, Transportation and Moving Occupations
The most common Production, Transportation and Moving occupations in Witt are Production (73 | 19.7%), Transportation (20 | 5.4%), and Material Moving (4 | 1.1%).
Production, Transportation and Moving Occupations by Sex
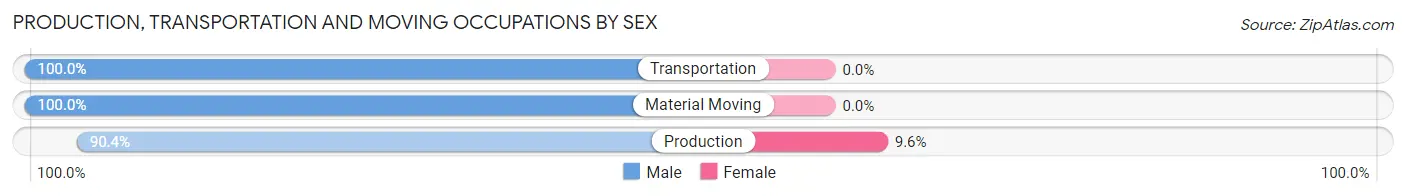
| Occupation | Male | Female |
| Production | 66 (90.4%) | 7 (9.6%) |
| Transportation | 20 (100.0%) | 0 (0.0%) |
| Material Moving | 4 (100.0%) | 0 (0.0%) |
| Total (Category) | 90 (92.8%) | 7 (7.2%) |
| Total (Overall) | 243 (65.5%) | 128 (34.5%) |
Employment Industries by Sex in Witt
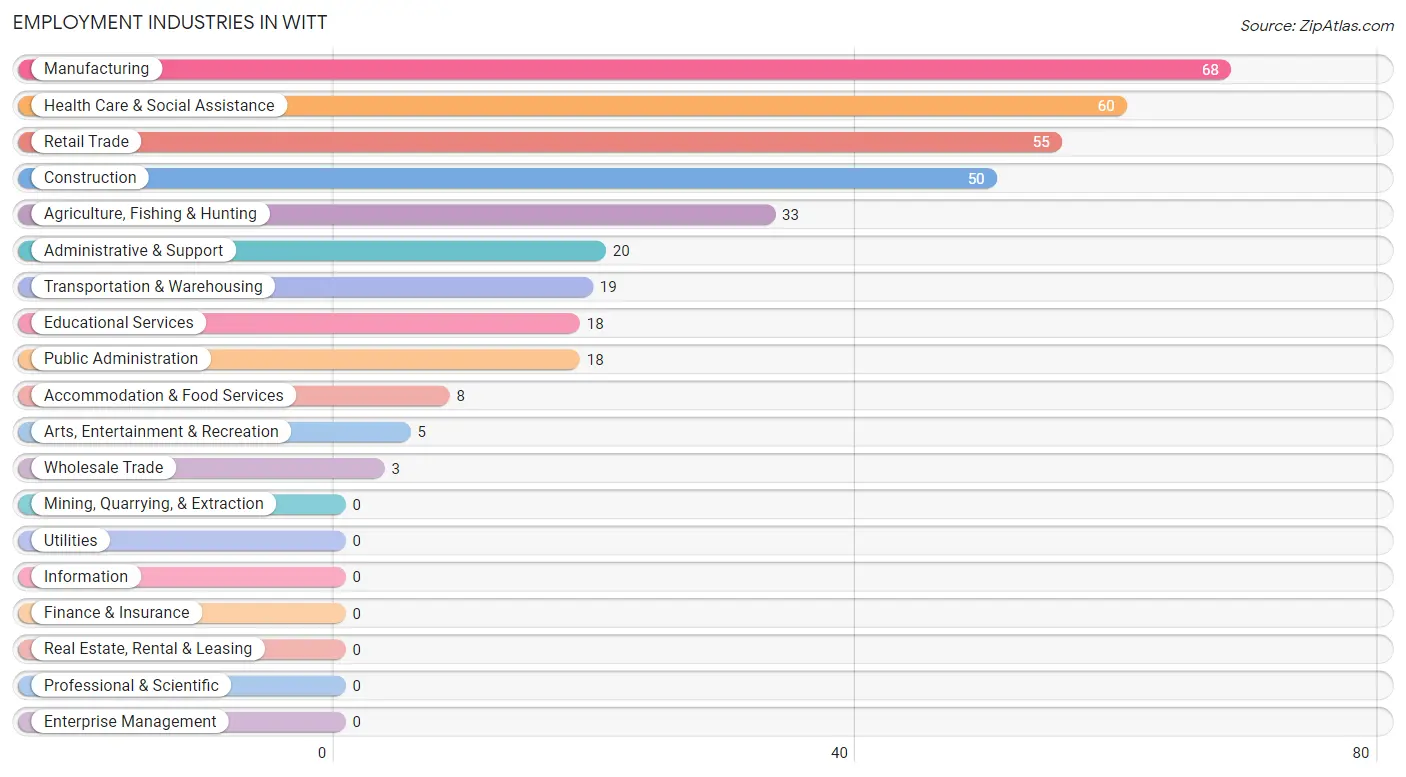
Employment Industries in Witt
The major employment industries in Witt include Manufacturing (68 | 18.3%), Health Care & Social Assistance (60 | 16.2%), Retail Trade (55 | 14.8%), Construction (50 | 13.5%), and Agriculture, Fishing & Hunting (33 | 8.9%).
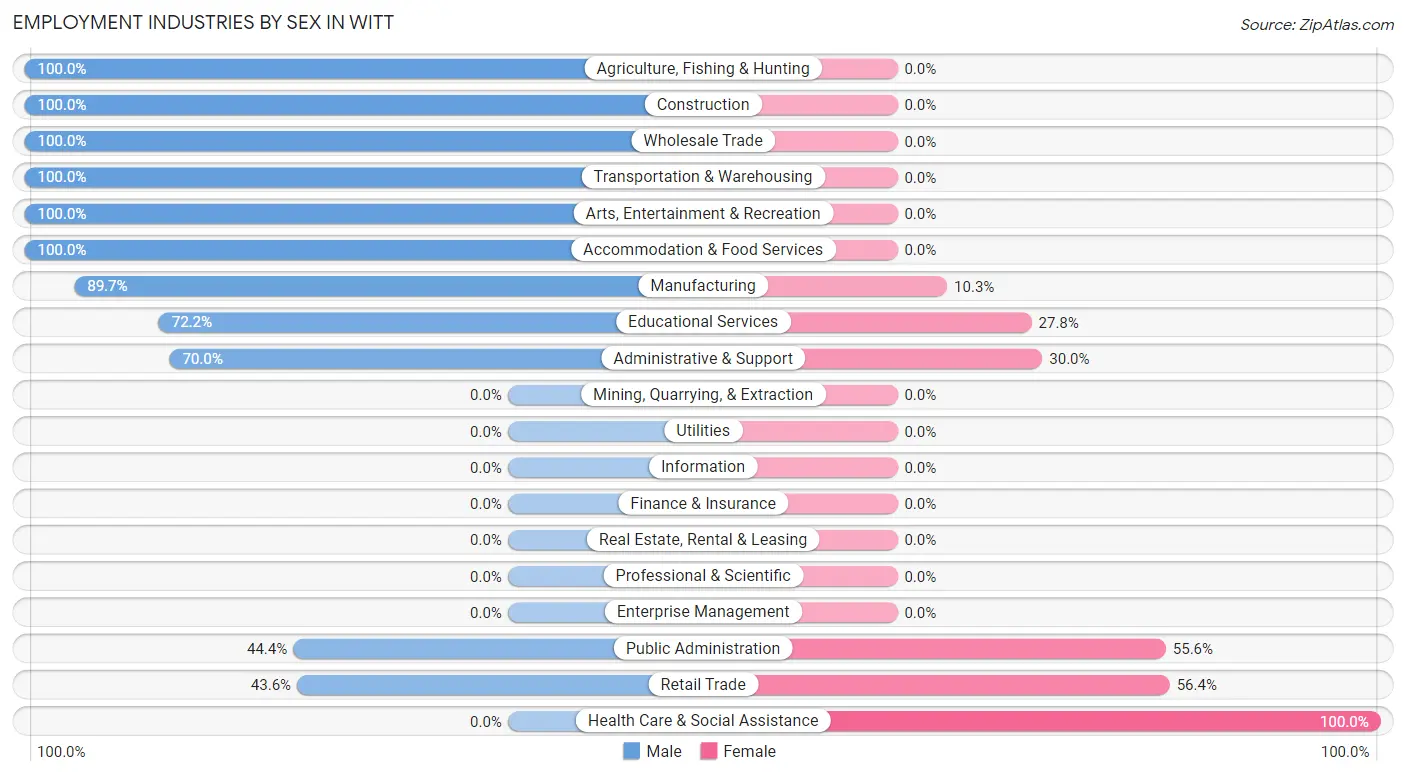
Employment Industries by Sex in Witt
The Witt industries that see more men than women are Agriculture, Fishing & Hunting (100.0%), Construction (100.0%), and Wholesale Trade (100.0%), whereas the industries that tend to have a higher number of women are Health Care & Social Assistance (100.0%), Retail Trade (56.4%), and Public Administration (55.6%).
| Industry | Male | Female |
| Agriculture, Fishing & Hunting | 33 (100.0%) | 0 (0.0%) |
| Mining, Quarrying, & Extraction | 0 (0.0%) | 0 (0.0%) |
| Construction | 50 (100.0%) | 0 (0.0%) |
| Manufacturing | 61 (89.7%) | 7 (10.3%) |
| Wholesale Trade | 3 (100.0%) | 0 (0.0%) |
| Retail Trade | 24 (43.6%) | 31 (56.4%) |
| Transportation & Warehousing | 19 (100.0%) | 0 (0.0%) |
| Utilities | 0 (0.0%) | 0 (0.0%) |
| Information | 0 (0.0%) | 0 (0.0%) |
| Finance & Insurance | 0 (0.0%) | 0 (0.0%) |
| Real Estate, Rental & Leasing | 0 (0.0%) | 0 (0.0%) |
| Professional & Scientific | 0 (0.0%) | 0 (0.0%) |
| Enterprise Management | 0 (0.0%) | 0 (0.0%) |
| Administrative & Support | 14 (70.0%) | 6 (30.0%) |
| Educational Services | 13 (72.2%) | 5 (27.8%) |
| Health Care & Social Assistance | 0 (0.0%) | 60 (100.0%) |
| Arts, Entertainment & Recreation | 5 (100.0%) | 0 (0.0%) |
| Accommodation & Food Services | 8 (100.0%) | 0 (0.0%) |
| Public Administration | 8 (44.4%) | 10 (55.6%) |
| Total | 243 (65.5%) | 128 (34.5%) |
Education in Witt
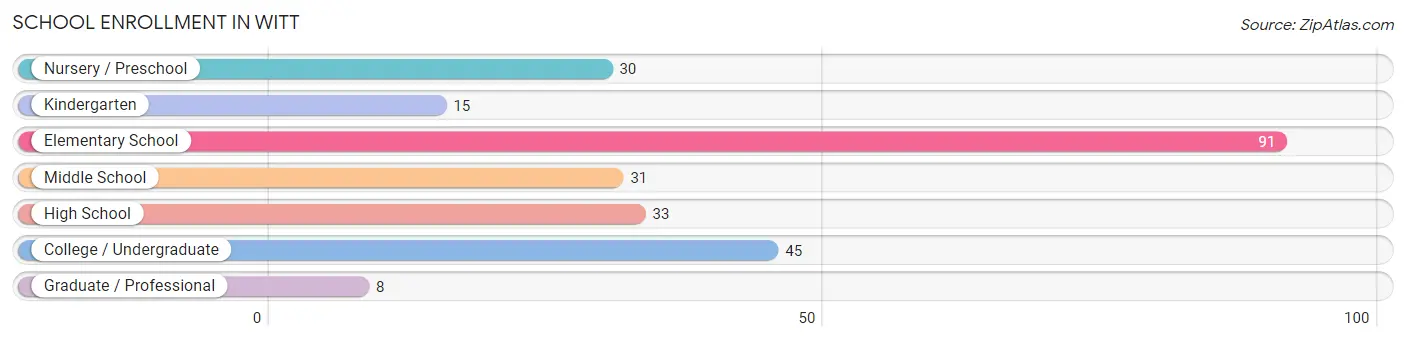
School Enrollment in Witt
The most common levels of schooling among the 253 students in Witt are elementary school (91 | 36.0%), college / undergraduate (45 | 17.8%), and high school (33 | 13.0%).
| School Level | # Students | % Students |
| Nursery / Preschool | 30 | 11.9% |
| Kindergarten | 15 | 5.9% |
| Elementary School | 91 | 36.0% |
| Middle School | 31 | 12.2% |
| High School | 33 | 13.0% |
| College / Undergraduate | 45 | 17.8% |
| Graduate / Professional | 8 | 3.2% |
| Total | 253 | 100.0% |
School Enrollment by Age by Funding Source in Witt
Out of a total of 253 students who are enrolled in schools in Witt, 64 (25.3%) attend a private institution, while the remaining 189 (74.7%) are enrolled in public schools. The age group of 10 to 14 year olds has the highest likelihood of being enrolled in private schools, with 25 (48.1% in the age bracket) enrolled. Conversely, the age group of 15 to 17 year olds has the lowest likelihood of being enrolled in a private school, with 24 (100.0% in the age bracket) attending a public institution.
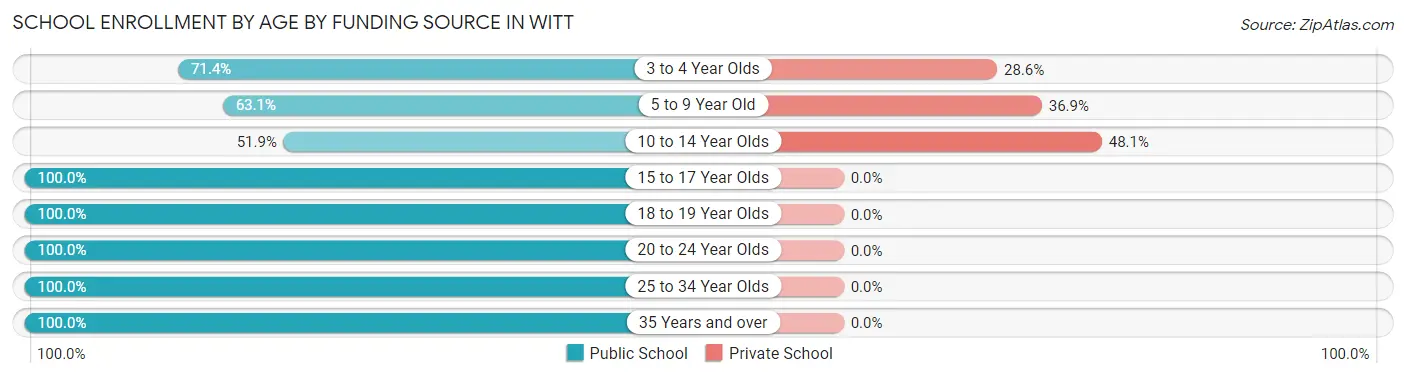
| Age Bracket | Public School | Private School |
| 3 to 4 Year Olds | 20 (71.4%) | 8 (28.6%) |
| 5 to 9 Year Old | 53 (63.1%) | 31 (36.9%) |
| 10 to 14 Year Olds | 27 (51.9%) | 25 (48.1%) |
| 15 to 17 Year Olds | 24 (100.0%) | 0 (0.0%) |
| 18 to 19 Year Olds | 25 (100.0%) | 0 (0.0%) |
| 20 to 24 Year Olds | 5 (100.0%) | 0 (0.0%) |
| 25 to 34 Year Olds | 27 (100.0%) | 0 (0.0%) |
| 35 Years and over | 8 (100.0%) | 0 (0.0%) |
| Total | 189 (74.7%) | 64 (25.3%) |
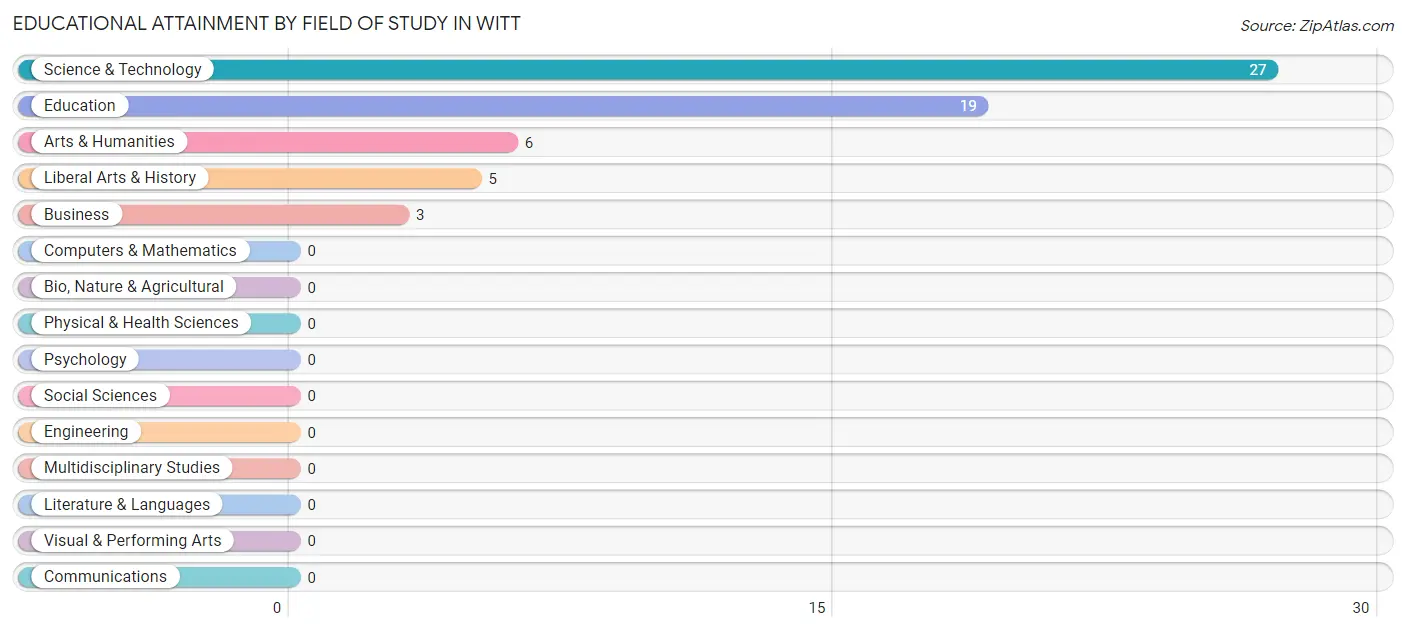
Educational Attainment by Field of Study in Witt
Science & technology (27 | 45.0%), education (19 | 31.7%), arts & humanities (6 | 10.0%), liberal arts & history (5 | 8.3%), and business (3 | 5.0%) are the most common fields of study among 60 individuals in Witt who have obtained a bachelor's degree or higher.
| Field of Study | # Graduates | % Graduates |
| Computers & Mathematics | 0 | 0.0% |
| Bio, Nature & Agricultural | 0 | 0.0% |
| Physical & Health Sciences | 0 | 0.0% |
| Psychology | 0 | 0.0% |
| Social Sciences | 0 | 0.0% |
| Engineering | 0 | 0.0% |
| Multidisciplinary Studies | 0 | 0.0% |
| Science & Technology | 27 | 45.0% |
| Business | 3 | 5.0% |
| Education | 19 | 31.7% |
| Literature & Languages | 0 | 0.0% |
| Liberal Arts & History | 5 | 8.3% |
| Visual & Performing Arts | 0 | 0.0% |
| Communications | 0 | 0.0% |
| Arts & Humanities | 6 | 10.0% |
| Total | 60 | 100.0% |
Transportation & Commute in Witt
Vehicle Availability by Sex in Witt
The most prevalent vehicle ownership categories in Witt are males with 2 vehicles (89, accounting for 36.6%) and females with 2 vehicles (60, making up 69.5%).
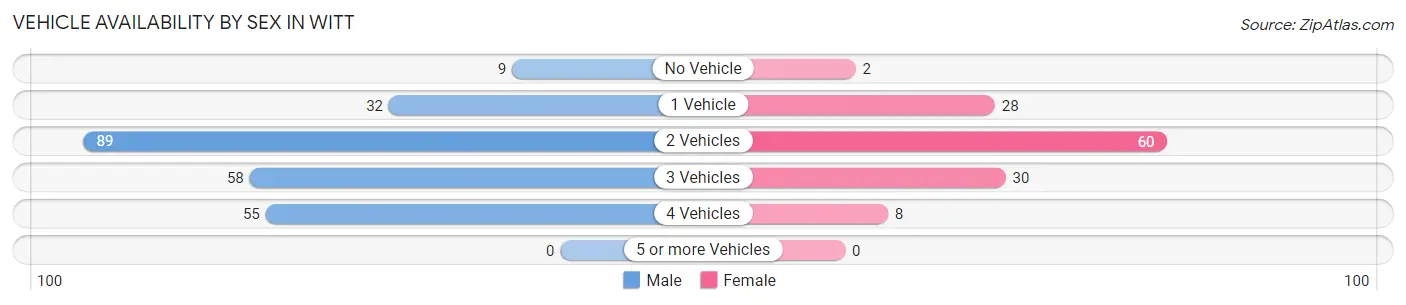
| Vehicles Available | Male | Female |
| No Vehicle | 9 (3.7%) | 2 (1.6%) |
| 1 Vehicle | 32 (13.2%) | 28 (21.9%) |
| 2 Vehicles | 89 (36.6%) | 60 (46.9%) |
| 3 Vehicles | 58 (23.9%) | 30 (23.4%) |
| 4 Vehicles | 55 (22.6%) | 8 (6.2%) |
| 5 or more Vehicles | 0 (0.0%) | 0 (0.0%) |
| Total | 243 (100.0%) | 128 (100.0%) |
Commute Time in Witt
The most frequently occuring commute durations in Witt are 60 to 89 minutes (64 commuters, 18.7%), 45 to 59 minutes (58 commuters, 17.0%), and 20 to 24 minutes (48 commuters, 14.0%).
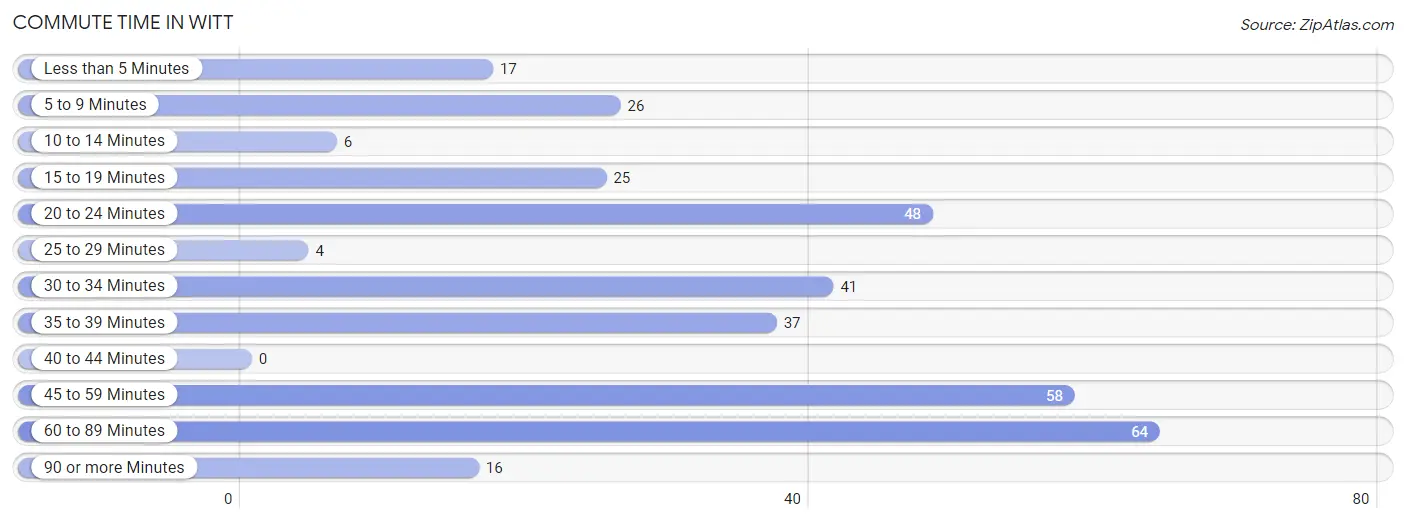
| Commute Time | # Commuters | % Commuters |
| Less than 5 Minutes | 17 | 5.0% |
| 5 to 9 Minutes | 26 | 7.6% |
| 10 to 14 Minutes | 6 | 1.8% |
| 15 to 19 Minutes | 25 | 7.3% |
| 20 to 24 Minutes | 48 | 14.0% |
| 25 to 29 Minutes | 4 | 1.2% |
| 30 to 34 Minutes | 41 | 12.0% |
| 35 to 39 Minutes | 37 | 10.8% |
| 40 to 44 Minutes | 0 | 0.0% |
| 45 to 59 Minutes | 58 | 17.0% |
| 60 to 89 Minutes | 64 | 18.7% |
| 90 or more Minutes | 16 | 4.7% |
Commute Time by Sex in Witt
The most common commute times in Witt are 45 to 59 minutes (46 commuters, 21.4%) for males and 60 to 89 minutes (43 commuters, 33.9%) for females.
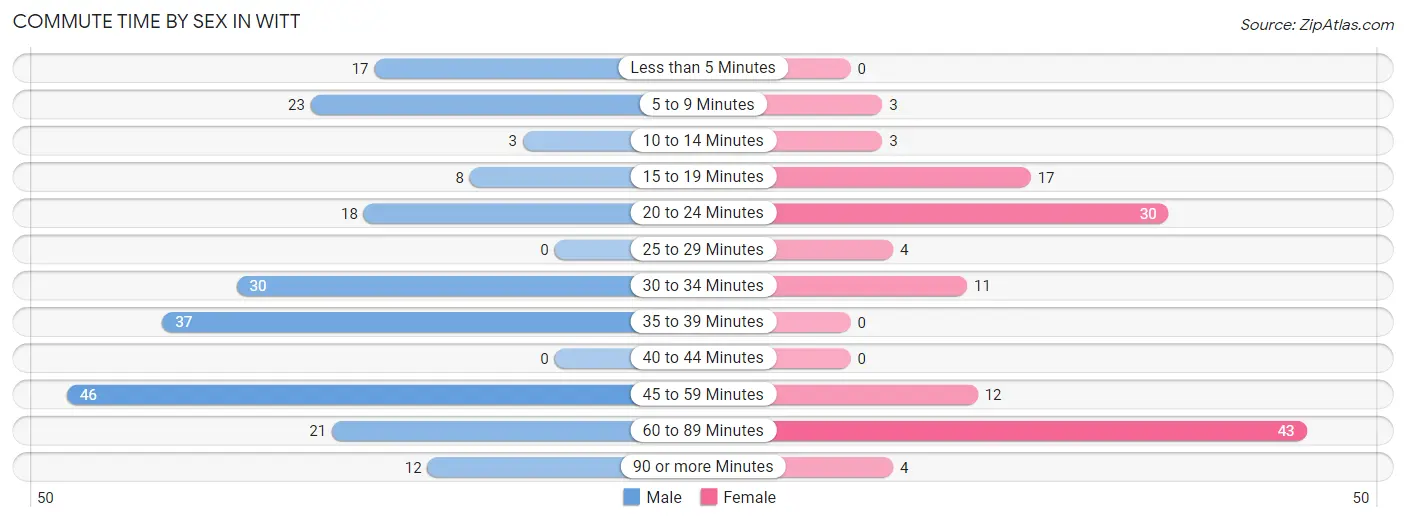
| Commute Time | Male | Female |
| Less than 5 Minutes | 17 (7.9%) | 0 (0.0%) |
| 5 to 9 Minutes | 23 (10.7%) | 3 (2.4%) |
| 10 to 14 Minutes | 3 (1.4%) | 3 (2.4%) |
| 15 to 19 Minutes | 8 (3.7%) | 17 (13.4%) |
| 20 to 24 Minutes | 18 (8.4%) | 30 (23.6%) |
| 25 to 29 Minutes | 0 (0.0%) | 4 (3.2%) |
| 30 to 34 Minutes | 30 (14.0%) | 11 (8.7%) |
| 35 to 39 Minutes | 37 (17.2%) | 0 (0.0%) |
| 40 to 44 Minutes | 0 (0.0%) | 0 (0.0%) |
| 45 to 59 Minutes | 46 (21.4%) | 12 (9.5%) |
| 60 to 89 Minutes | 21 (9.8%) | 43 (33.9%) |
| 90 or more Minutes | 12 (5.6%) | 4 (3.2%) |
Time of Departure to Work by Sex in Witt
The most frequent times of departure to work in Witt are 5:30 AM to 5:59 AM (52, 24.2%) for males and 5:00 AM to 5:29 AM (22, 17.3%) for females.
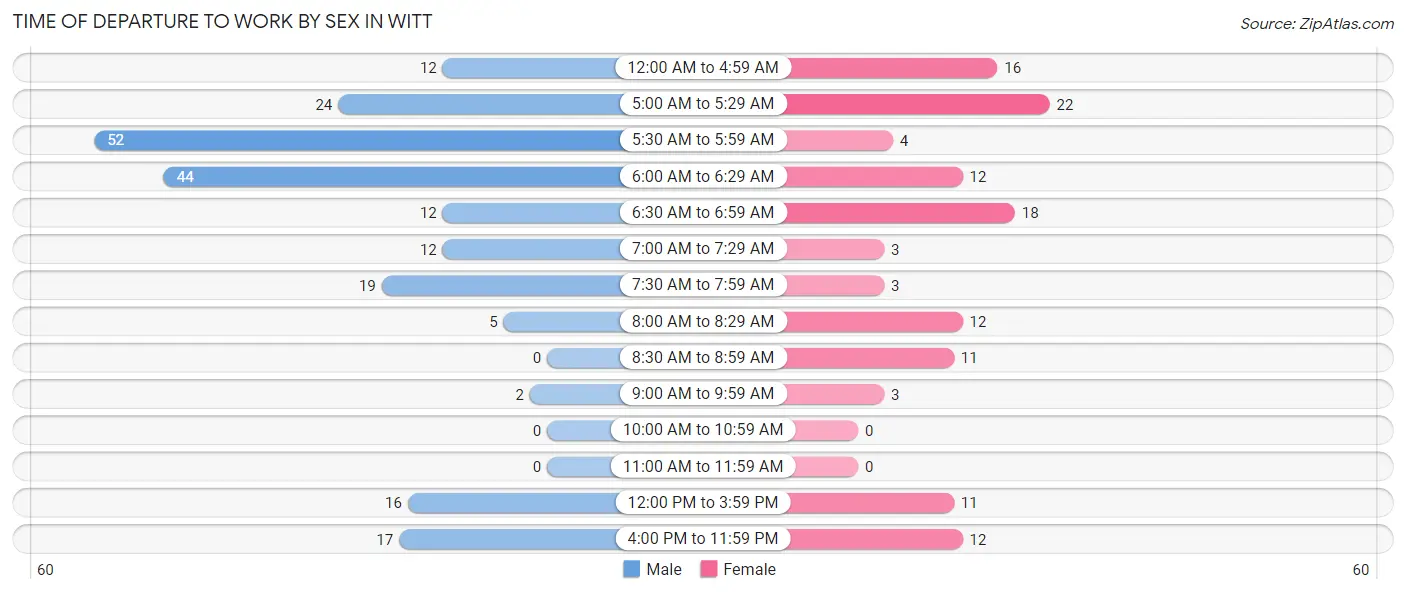
| Time of Departure | Male | Female |
| 12:00 AM to 4:59 AM | 12 (5.6%) | 16 (12.6%) |
| 5:00 AM to 5:29 AM | 24 (11.2%) | 22 (17.3%) |
| 5:30 AM to 5:59 AM | 52 (24.2%) | 4 (3.2%) |
| 6:00 AM to 6:29 AM | 44 (20.5%) | 12 (9.5%) |
| 6:30 AM to 6:59 AM | 12 (5.6%) | 18 (14.2%) |
| 7:00 AM to 7:29 AM | 12 (5.6%) | 3 (2.4%) |
| 7:30 AM to 7:59 AM | 19 (8.8%) | 3 (2.4%) |
| 8:00 AM to 8:29 AM | 5 (2.3%) | 12 (9.5%) |
| 8:30 AM to 8:59 AM | 0 (0.0%) | 11 (8.7%) |
| 9:00 AM to 9:59 AM | 2 (0.9%) | 3 (2.4%) |
| 10:00 AM to 10:59 AM | 0 (0.0%) | 0 (0.0%) |
| 11:00 AM to 11:59 AM | 0 (0.0%) | 0 (0.0%) |
| 12:00 PM to 3:59 PM | 16 (7.4%) | 11 (8.7%) |
| 4:00 PM to 11:59 PM | 17 (7.9%) | 12 (9.5%) |
| Total | 215 (100.0%) | 127 (100.0%) |
Housing Occupancy in Witt
Occupancy by Ownership in Witt
Of the total 365 dwellings in Witt, owner-occupied units account for 258 (70.7%), while renter-occupied units make up 107 (29.3%).
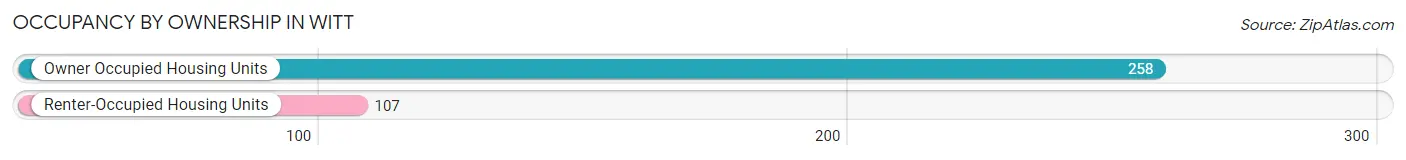
| Occupancy | # Housing Units | % Housing Units |
| Owner Occupied Housing Units | 258 | 70.7% |
| Renter-Occupied Housing Units | 107 | 29.3% |
| Total Occupied Housing Units | 365 | 100.0% |
Occupancy by Household Size in Witt
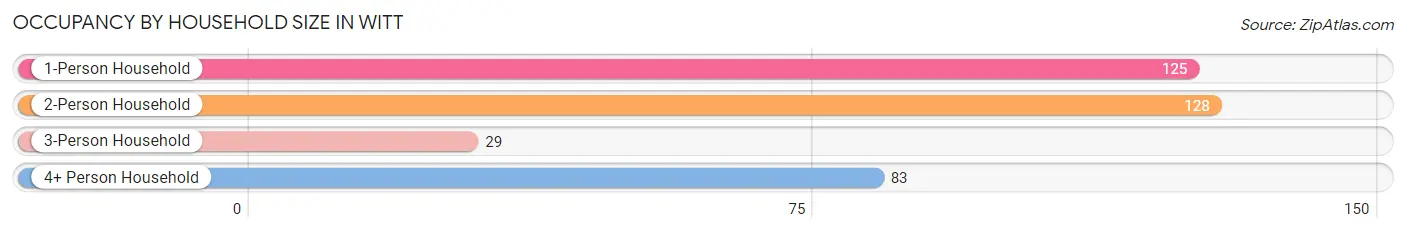
| Household Size | # Housing Units | % Housing Units |
| 1-Person Household | 125 | 34.3% |
| 2-Person Household | 128 | 35.1% |
| 3-Person Household | 29 | 8.0% |
| 4+ Person Household | 83 | 22.7% |
| Total Housing Units | 365 | 100.0% |
Occupancy by Ownership by Household Size in Witt
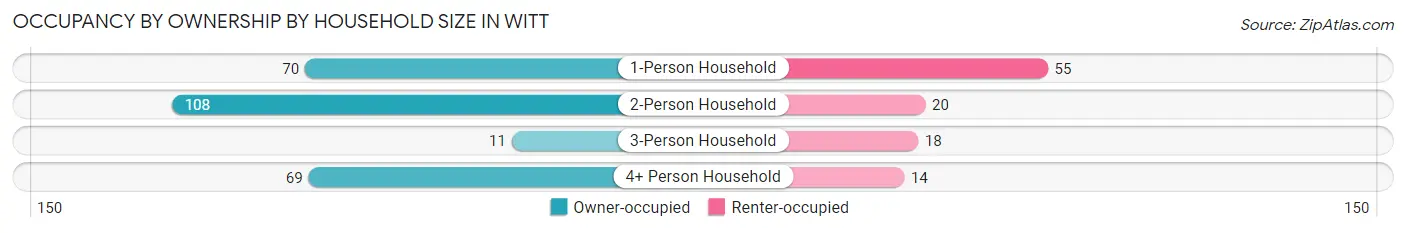
| Household Size | Owner-occupied | Renter-occupied |
| 1-Person Household | 70 (56.0%) | 55 (44.0%) |
| 2-Person Household | 108 (84.4%) | 20 (15.6%) |
| 3-Person Household | 11 (37.9%) | 18 (62.1%) |
| 4+ Person Household | 69 (83.1%) | 14 (16.9%) |
| Total Housing Units | 258 (70.7%) | 107 (29.3%) |
Occupancy by Educational Attainment in Witt
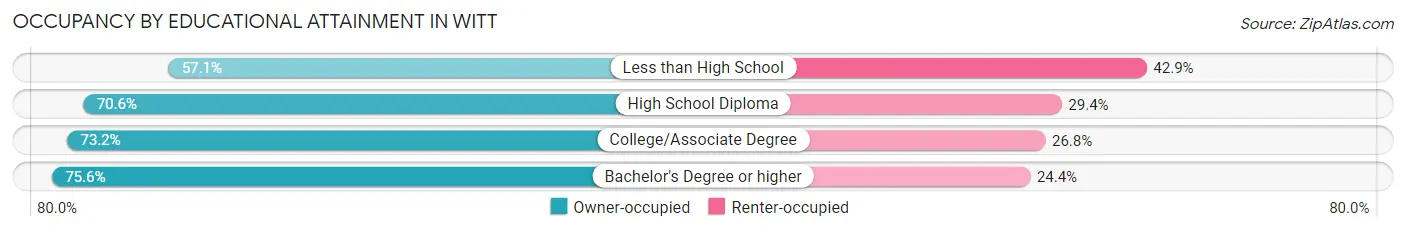
| Household Size | Owner-occupied | Renter-occupied |
| Less than High School | 20 (57.1%) | 15 (42.9%) |
| High School Diploma | 125 (70.6%) | 52 (29.4%) |
| College/Associate Degree | 82 (73.2%) | 30 (26.8%) |
| Bachelor's Degree or higher | 31 (75.6%) | 10 (24.4%) |
Occupancy by Age of Householder in Witt
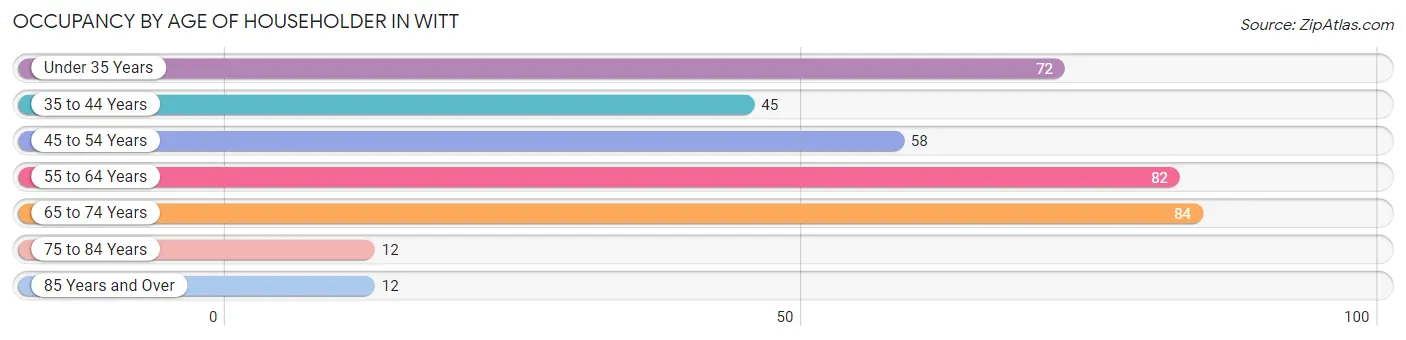
| Age Bracket | # Households | % Households |
| Under 35 Years | 72 | 19.7% |
| 35 to 44 Years | 45 | 12.3% |
| 45 to 54 Years | 58 | 15.9% |
| 55 to 64 Years | 82 | 22.5% |
| 65 to 74 Years | 84 | 23.0% |
| 75 to 84 Years | 12 | 3.3% |
| 85 Years and Over | 12 | 3.3% |
| Total | 365 | 100.0% |
Housing Finances in Witt
Median Income by Occupancy in Witt
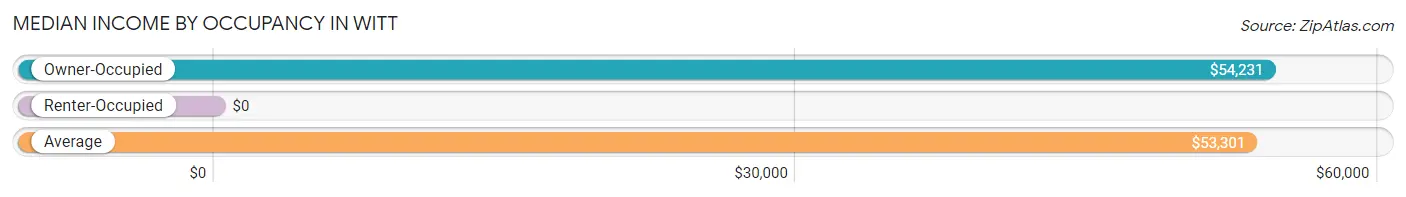
| Occupancy Type | # Households | Median Income |
| Owner-Occupied | 258 (70.7%) | $54,231 |
| Renter-Occupied | 107 (29.3%) | $0 |
| Average | 365 (100.0%) | $53,301 |
Occupancy by Householder Income Bracket in Witt
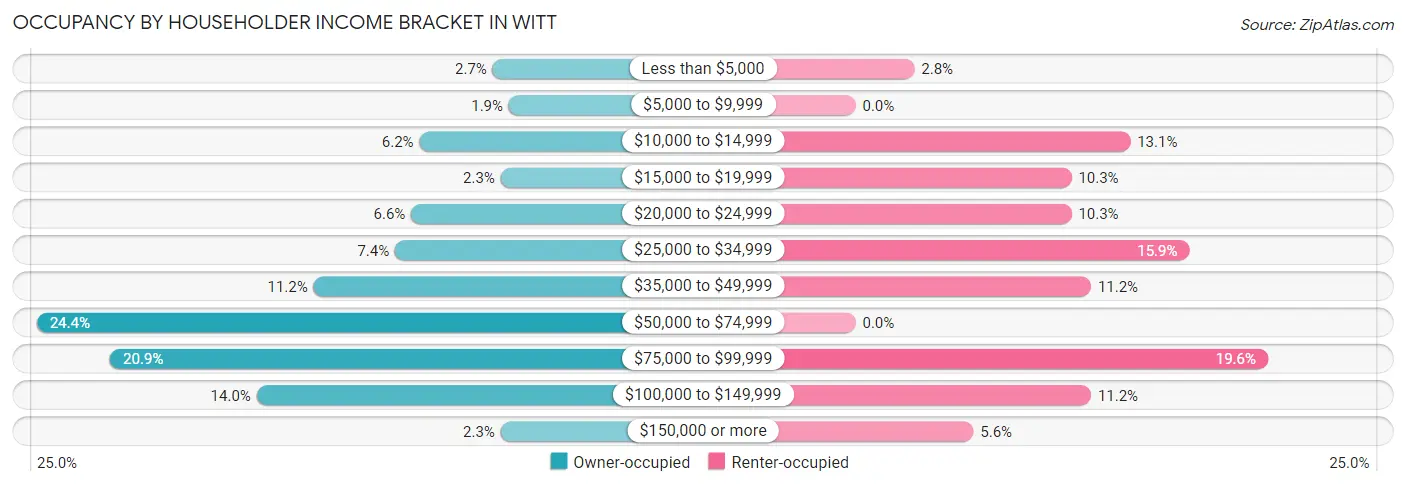
| Income Bracket | Owner-occupied | Renter-occupied |
| Less than $5,000 | 7 (2.7%) | 3 (2.8%) |
| $5,000 to $9,999 | 5 (1.9%) | 0 (0.0%) |
| $10,000 to $14,999 | 16 (6.2%) | 14 (13.1%) |
| $15,000 to $19,999 | 6 (2.3%) | 11 (10.3%) |
| $20,000 to $24,999 | 17 (6.6%) | 11 (10.3%) |
| $25,000 to $34,999 | 19 (7.4%) | 17 (15.9%) |
| $35,000 to $49,999 | 29 (11.2%) | 12 (11.2%) |
| $50,000 to $74,999 | 63 (24.4%) | 0 (0.0%) |
| $75,000 to $99,999 | 54 (20.9%) | 21 (19.6%) |
| $100,000 to $149,999 | 36 (14.0%) | 12 (11.2%) |
| $150,000 or more | 6 (2.3%) | 6 (5.6%) |
| Total | 258 (100.0%) | 107 (100.0%) |
Monthly Housing Cost Tiers in Witt
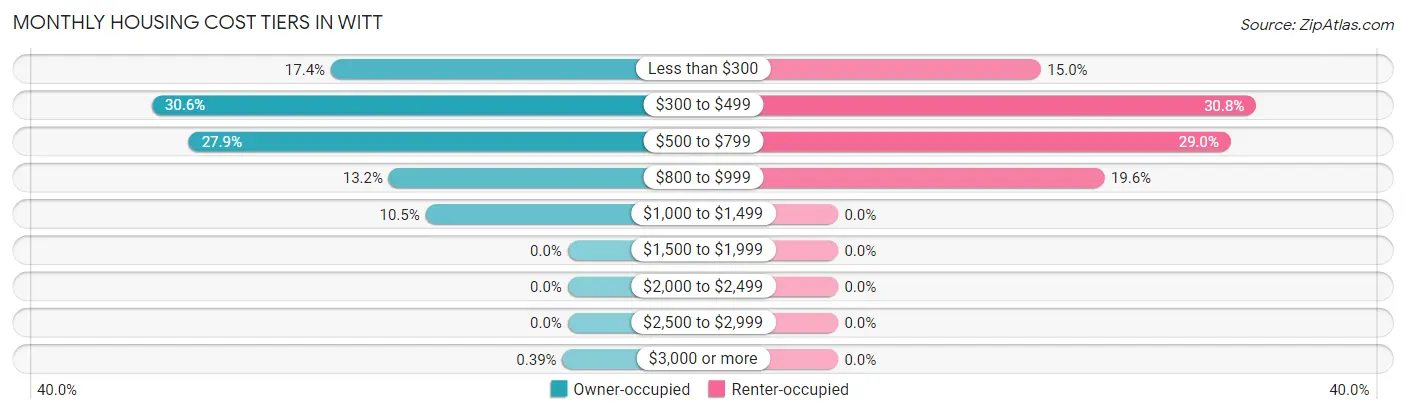
| Monthly Cost | Owner-occupied | Renter-occupied |
| Less than $300 | 45 (17.4%) | 16 (14.9%) |
| $300 to $499 | 79 (30.6%) | 33 (30.8%) |
| $500 to $799 | 72 (27.9%) | 31 (29.0%) |
| $800 to $999 | 34 (13.2%) | 21 (19.6%) |
| $1,000 to $1,499 | 27 (10.5%) | 0 (0.0%) |
| $1,500 to $1,999 | 0 (0.0%) | 0 (0.0%) |
| $2,000 to $2,499 | 0 (0.0%) | 0 (0.0%) |
| $2,500 to $2,999 | 0 (0.0%) | 0 (0.0%) |
| $3,000 or more | 1 (0.4%) | 0 (0.0%) |
| Total | 258 (100.0%) | 107 (100.0%) |
Physical Housing Characteristics in Witt
Housing Structures in Witt
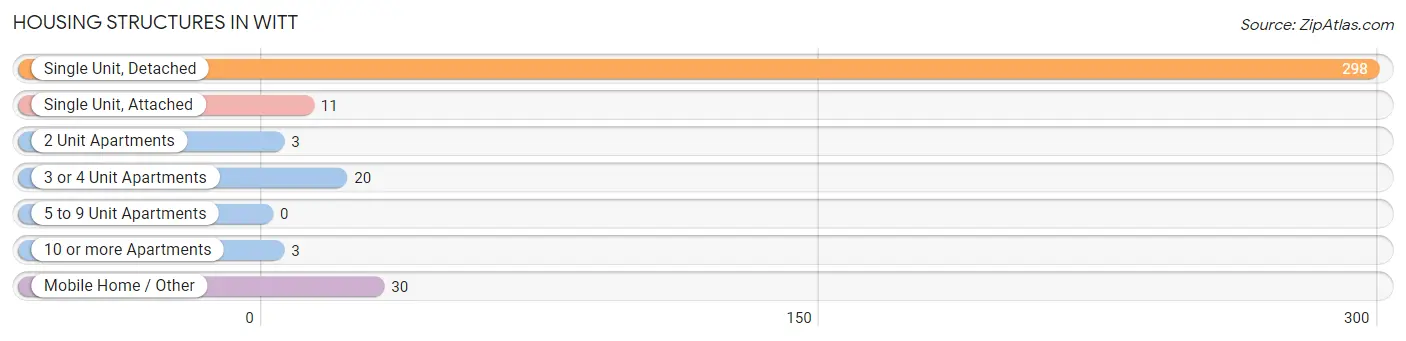
| Structure Type | # Housing Units | % Housing Units |
| Single Unit, Detached | 298 | 81.6% |
| Single Unit, Attached | 11 | 3.0% |
| 2 Unit Apartments | 3 | 0.8% |
| 3 or 4 Unit Apartments | 20 | 5.5% |
| 5 to 9 Unit Apartments | 0 | 0.0% |
| 10 or more Apartments | 3 | 0.8% |
| Mobile Home / Other | 30 | 8.2% |
| Total | 365 | 100.0% |
Housing Structures by Occupancy in Witt
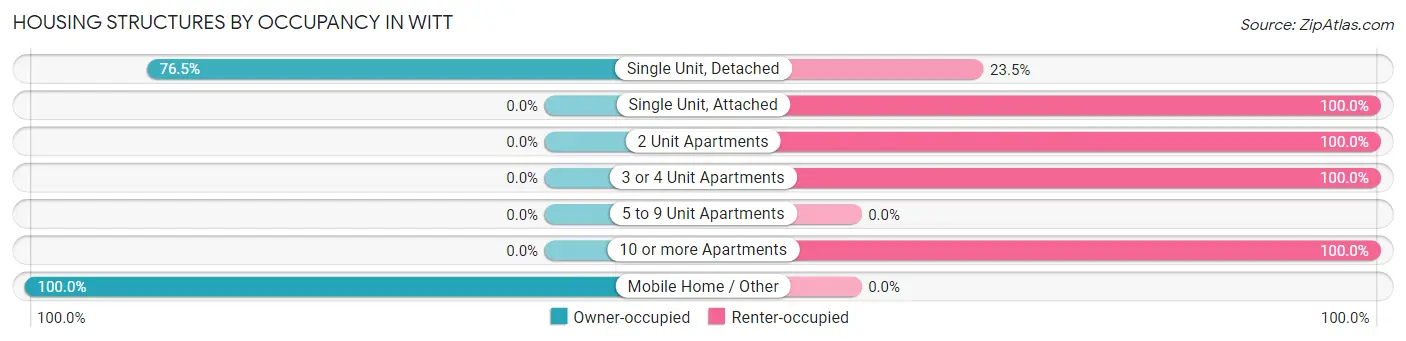
| Structure Type | Owner-occupied | Renter-occupied |
| Single Unit, Detached | 228 (76.5%) | 70 (23.5%) |
| Single Unit, Attached | 0 (0.0%) | 11 (100.0%) |
| 2 Unit Apartments | 0 (0.0%) | 3 (100.0%) |
| 3 or 4 Unit Apartments | 0 (0.0%) | 20 (100.0%) |
| 5 to 9 Unit Apartments | 0 (0.0%) | 0 (0.0%) |
| 10 or more Apartments | 0 (0.0%) | 3 (100.0%) |
| Mobile Home / Other | 30 (100.0%) | 0 (0.0%) |
| Total | 258 (70.7%) | 107 (29.3%) |
Housing Structures by Number of Rooms in Witt
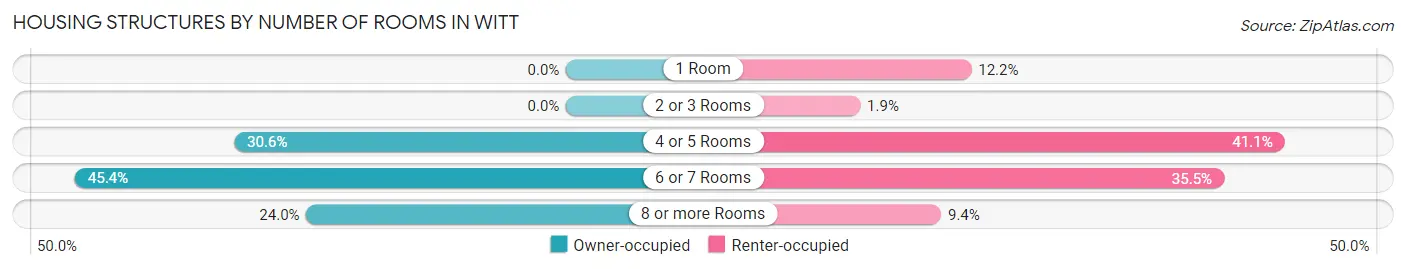
| Number of Rooms | Owner-occupied | Renter-occupied |
| 1 Room | 0 (0.0%) | 13 (12.1%) |
| 2 or 3 Rooms | 0 (0.0%) | 2 (1.9%) |
| 4 or 5 Rooms | 79 (30.6%) | 44 (41.1%) |
| 6 or 7 Rooms | 117 (45.4%) | 38 (35.5%) |
| 8 or more Rooms | 62 (24.0%) | 10 (9.3%) |
| Total | 258 (100.0%) | 107 (100.0%) |
Housing Structure by Heating Type in Witt
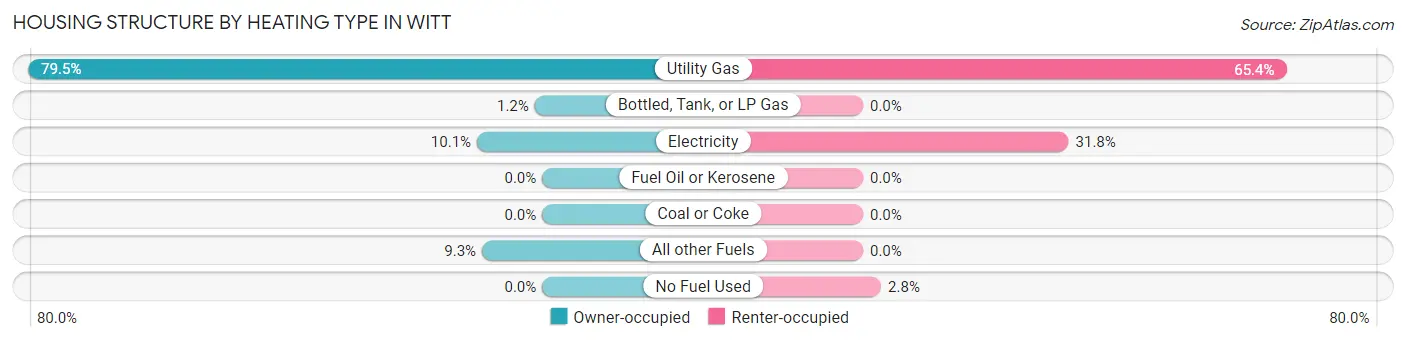
| Heating Type | Owner-occupied | Renter-occupied |
| Utility Gas | 205 (79.5%) | 70 (65.4%) |
| Bottled, Tank, or LP Gas | 3 (1.2%) | 0 (0.0%) |
| Electricity | 26 (10.1%) | 34 (31.8%) |
| Fuel Oil or Kerosene | 0 (0.0%) | 0 (0.0%) |
| Coal or Coke | 0 (0.0%) | 0 (0.0%) |
| All other Fuels | 24 (9.3%) | 0 (0.0%) |
| No Fuel Used | 0 (0.0%) | 3 (2.8%) |
| Total | 258 (100.0%) | 107 (100.0%) |
Household Vehicle Usage in Witt
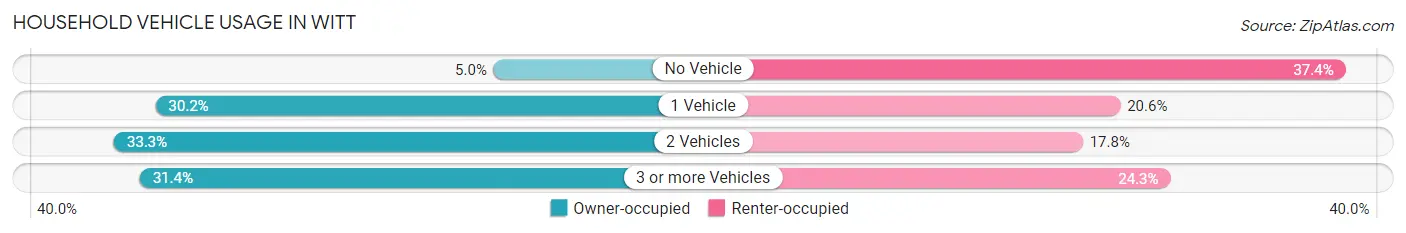
| Vehicles per Household | Owner-occupied | Renter-occupied |
| No Vehicle | 13 (5.0%) | 40 (37.4%) |
| 1 Vehicle | 78 (30.2%) | 22 (20.6%) |
| 2 Vehicles | 86 (33.3%) | 19 (17.8%) |
| 3 or more Vehicles | 81 (31.4%) | 26 (24.3%) |
| Total | 258 (100.0%) | 107 (100.0%) |
Real Estate & Mortgages in Witt
Real Estate and Mortgage Overview in Witt
| Characteristic | Without Mortgage | With Mortgage |
| Housing Units | 170 | 88 |
| Median Property Value | $32,200 | $57,700 |
| Median Household Income | $46,250 | $3 |
| Monthly Housing Costs | $348 | $0 |
| Real Estate Taxes | $554 | $0 |
Property Value by Mortgage Status in Witt
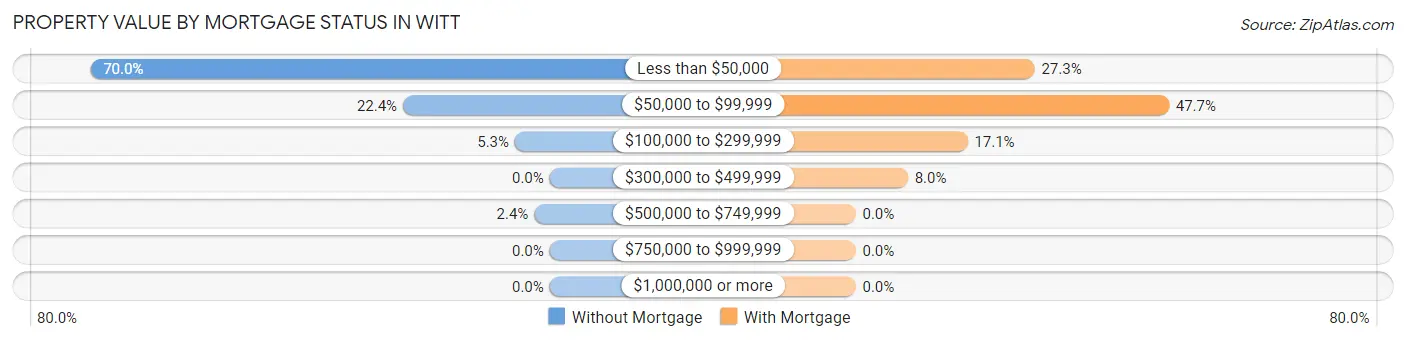
| Property Value | Without Mortgage | With Mortgage |
| Less than $50,000 | 119 (70.0%) | 24 (27.3%) |
| $50,000 to $99,999 | 38 (22.4%) | 42 (47.7%) |
| $100,000 to $299,999 | 9 (5.3%) | 15 (17.1%) |
| $300,000 to $499,999 | 0 (0.0%) | 7 (8.0%) |
| $500,000 to $749,999 | 4 (2.4%) | 0 (0.0%) |
| $750,000 to $999,999 | 0 (0.0%) | 0 (0.0%) |
| $1,000,000 or more | 0 (0.0%) | 0 (0.0%) |
| Total | 170 (100.0%) | 88 (100.0%) |
Household Income by Mortgage Status in Witt
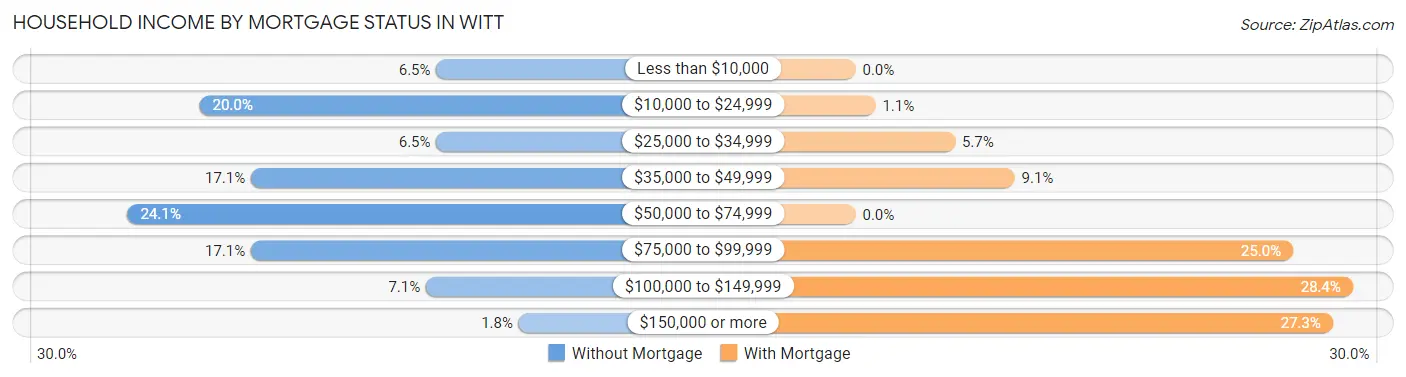
| Household Income | Without Mortgage | With Mortgage |
| Less than $10,000 | 11 (6.5%) | 0 (0.0%) |
| $10,000 to $24,999 | 34 (20.0%) | 1 (1.1%) |
| $25,000 to $34,999 | 11 (6.5%) | 5 (5.7%) |
| $35,000 to $49,999 | 29 (17.1%) | 8 (9.1%) |
| $50,000 to $74,999 | 41 (24.1%) | 0 (0.0%) |
| $75,000 to $99,999 | 29 (17.1%) | 22 (25.0%) |
| $100,000 to $149,999 | 12 (7.1%) | 25 (28.4%) |
| $150,000 or more | 3 (1.8%) | 24 (27.3%) |
| Total | 170 (100.0%) | 88 (100.0%) |
Property Value to Household Income Ratio in Witt
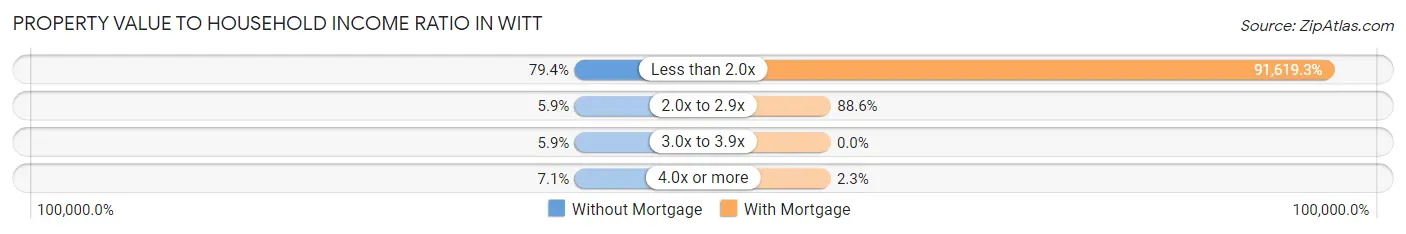
| Value-to-Income Ratio | Without Mortgage | With Mortgage |
| Less than 2.0x | 135 (79.4%) | 80,625 (91,619.3%) |
| 2.0x to 2.9x | 10 (5.9%) | 78 (88.6%) |
| 3.0x to 3.9x | 10 (5.9%) | 0 (0.0%) |
| 4.0x or more | 12 (7.1%) | 2 (2.3%) |
| Total | 170 (100.0%) | 88 (100.0%) |
Real Estate Taxes by Mortgage Status in Witt
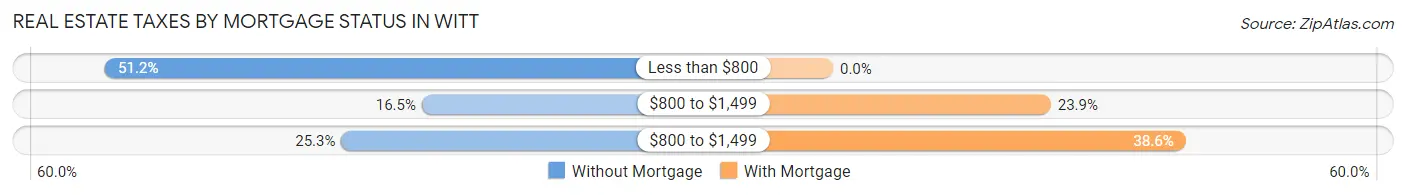
| Property Taxes | Without Mortgage | With Mortgage |
| Less than $800 | 87 (51.2%) | 0 (0.0%) |
| $800 to $1,499 | 28 (16.5%) | 21 (23.9%) |
| $800 to $1,499 | 43 (25.3%) | 34 (38.6%) |
| Total | 170 (100.0%) | 88 (100.0%) |
Health & Disability in Witt
Health Insurance Coverage by Age in Witt
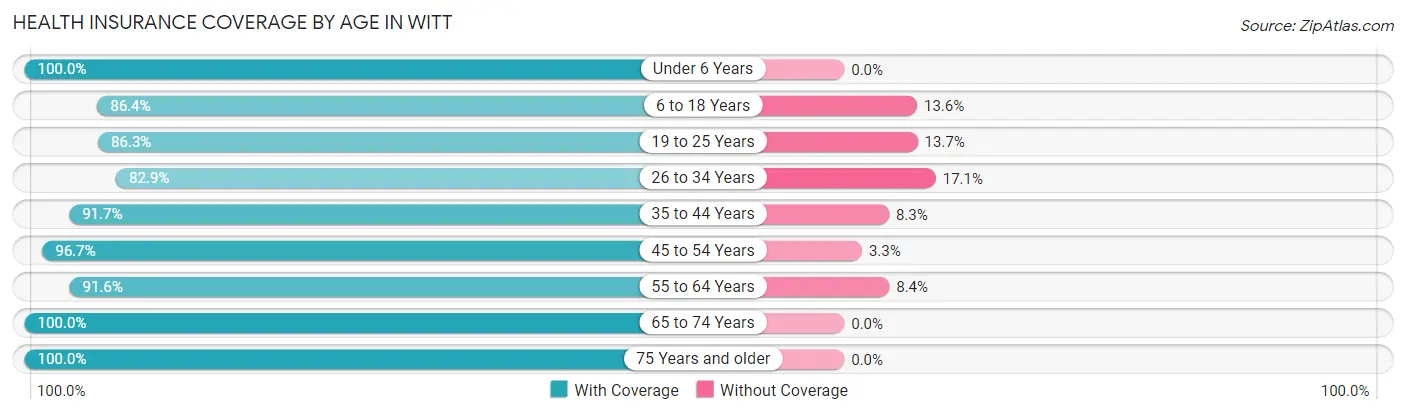
| Age Bracket | With Coverage | Without Coverage |
| Under 6 Years | 71 (100.0%) | 0 (0.0%) |
| 6 to 18 Years | 172 (86.4%) | 27 (13.6%) |
| 19 to 25 Years | 101 (86.3%) | 16 (13.7%) |
| 26 to 34 Years | 68 (82.9%) | 14 (17.1%) |
| 35 to 44 Years | 88 (91.7%) | 8 (8.3%) |
| 45 to 54 Years | 88 (96.7%) | 3 (3.3%) |
| 55 to 64 Years | 131 (91.6%) | 12 (8.4%) |
| 65 to 74 Years | 98 (100.0%) | 0 (0.0%) |
| 75 Years and older | 38 (100.0%) | 0 (0.0%) |
| Total | 855 (91.4%) | 80 (8.6%) |
Health Insurance Coverage by Citizenship Status in Witt
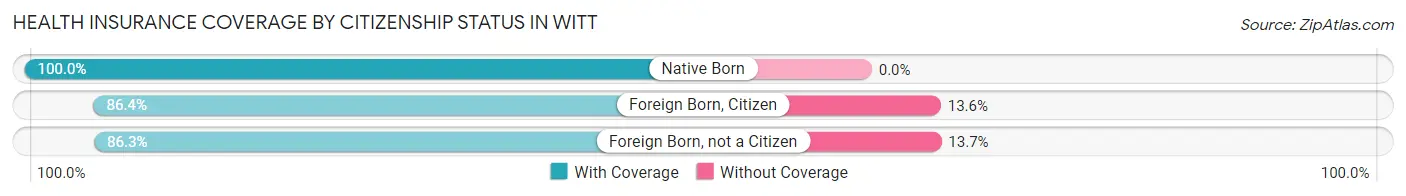
| Citizenship Status | With Coverage | Without Coverage |
| Native Born | 71 (100.0%) | 0 (0.0%) |
| Foreign Born, Citizen | 172 (86.4%) | 27 (13.6%) |
| Foreign Born, not a Citizen | 101 (86.3%) | 16 (13.7%) |
Health Insurance Coverage by Household Income in Witt
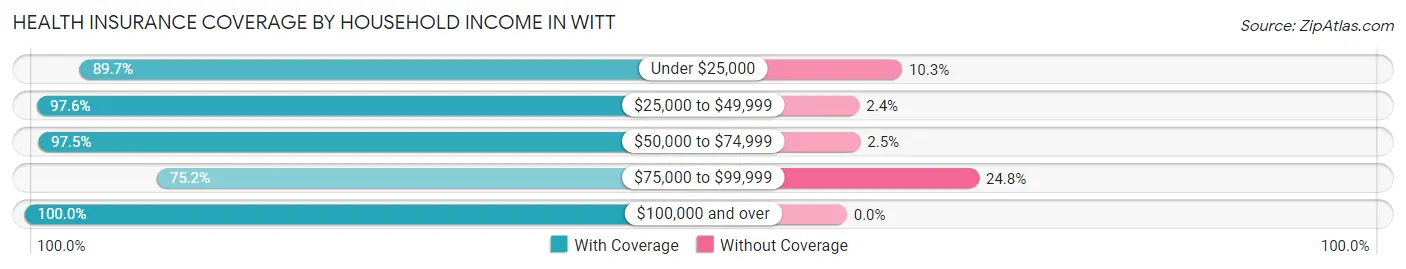
| Household Income | With Coverage | Without Coverage |
| Under $25,000 | 130 (89.7%) | 15 (10.3%) |
| $25,000 to $49,999 | 124 (97.6%) | 3 (2.4%) |
| $50,000 to $74,999 | 192 (97.5%) | 5 (2.5%) |
| $75,000 to $99,999 | 173 (75.2%) | 57 (24.8%) |
| $100,000 and over | 236 (100.0%) | 0 (0.0%) |
Public vs Private Health Insurance Coverage by Age in Witt
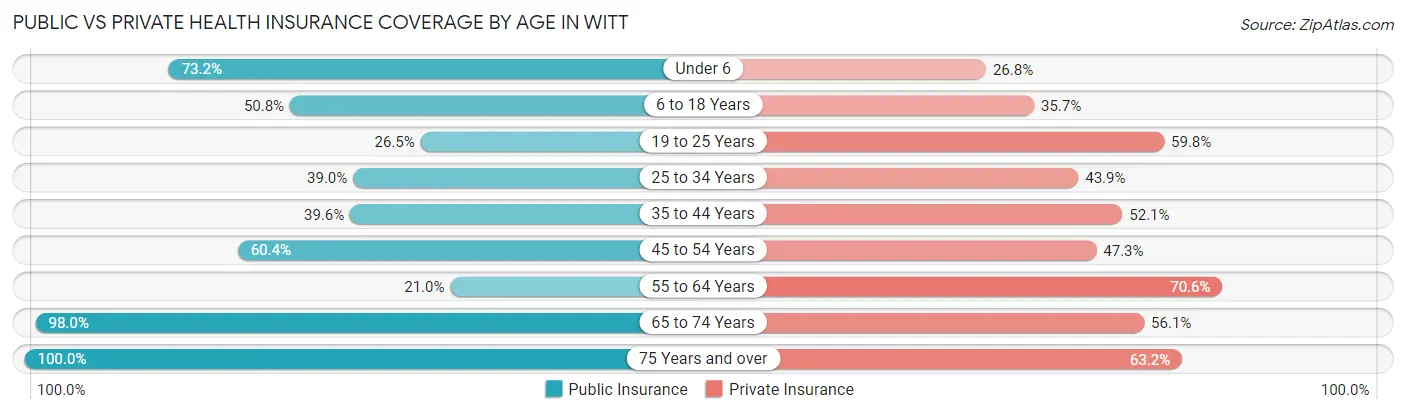
| Age Bracket | Public Insurance | Private Insurance |
| Under 6 | 52 (73.2%) | 19 (26.8%) |
| 6 to 18 Years | 101 (50.7%) | 71 (35.7%) |
| 19 to 25 Years | 31 (26.5%) | 70 (59.8%) |
| 25 to 34 Years | 32 (39.0%) | 36 (43.9%) |
| 35 to 44 Years | 38 (39.6%) | 50 (52.1%) |
| 45 to 54 Years | 55 (60.4%) | 43 (47.2%) |
| 55 to 64 Years | 30 (21.0%) | 101 (70.6%) |
| 65 to 74 Years | 96 (98.0%) | 55 (56.1%) |
| 75 Years and over | 38 (100.0%) | 24 (63.2%) |
| Total | 473 (50.6%) | 469 (50.2%) |
Disability Status by Sex by Age in Witt
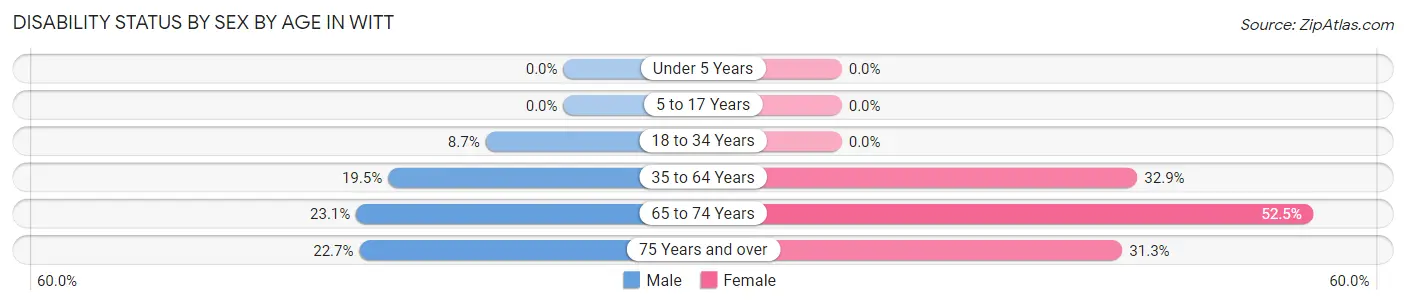
| Age Bracket | Male | Female |
| Under 5 Years | 0 (0.0%) | 0 (0.0%) |
| 5 to 17 Years | 0 (0.0%) | 0 (0.0%) |
| 18 to 34 Years | 13 (8.7%) | 0 (0.0%) |
| 35 to 64 Years | 33 (19.5%) | 53 (32.9%) |
| 65 to 74 Years | 9 (23.1%) | 31 (52.5%) |
| 75 Years and over | 5 (22.7%) | 5 (31.2%) |
Disability Class by Sex by Age in Witt
Disability Class: Hearing Difficulty
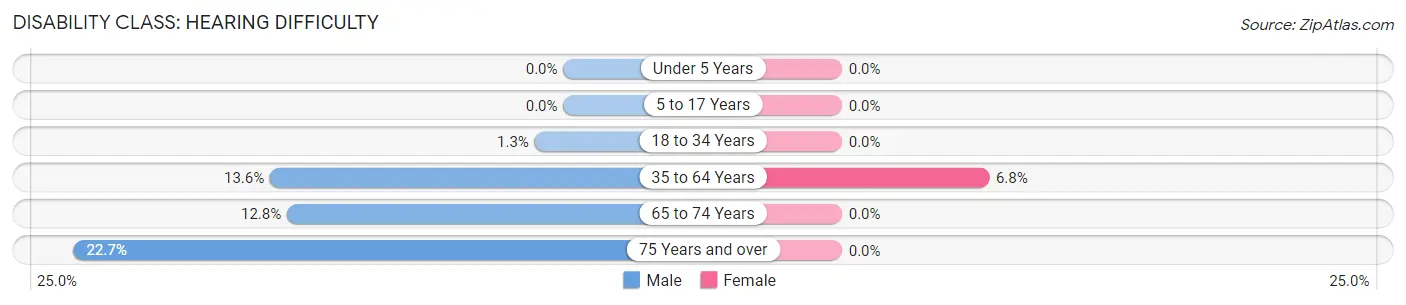
| Age Bracket | Male | Female |
| Under 5 Years | 0 (0.0%) | 0 (0.0%) |
| 5 to 17 Years | 0 (0.0%) | 0 (0.0%) |
| 18 to 34 Years | 2 (1.3%) | 0 (0.0%) |
| 35 to 64 Years | 23 (13.6%) | 11 (6.8%) |
| 65 to 74 Years | 5 (12.8%) | 0 (0.0%) |
| 75 Years and over | 5 (22.7%) | 0 (0.0%) |
Disability Class: Vision Difficulty
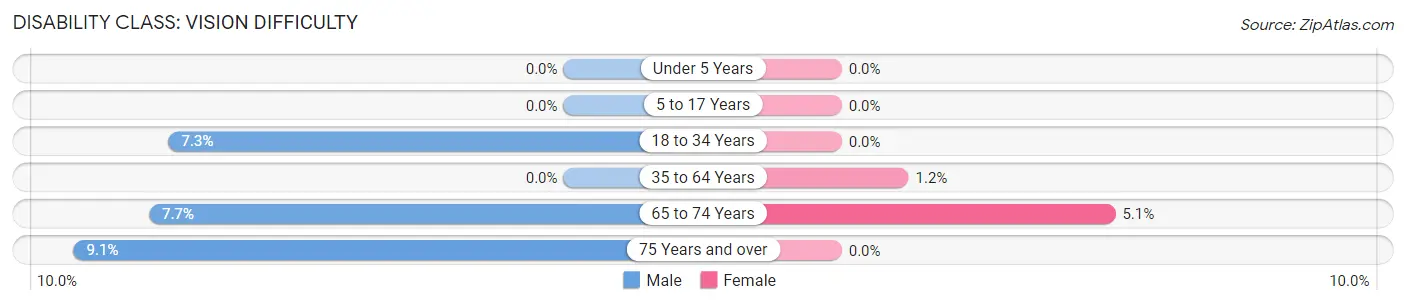
| Age Bracket | Male | Female |
| Under 5 Years | 0 (0.0%) | 0 (0.0%) |
| 5 to 17 Years | 0 (0.0%) | 0 (0.0%) |
| 18 to 34 Years | 11 (7.3%) | 0 (0.0%) |
| 35 to 64 Years | 0 (0.0%) | 2 (1.2%) |
| 65 to 74 Years | 3 (7.7%) | 3 (5.1%) |
| 75 Years and over | 2 (9.1%) | 0 (0.0%) |
Disability Class: Cognitive Difficulty
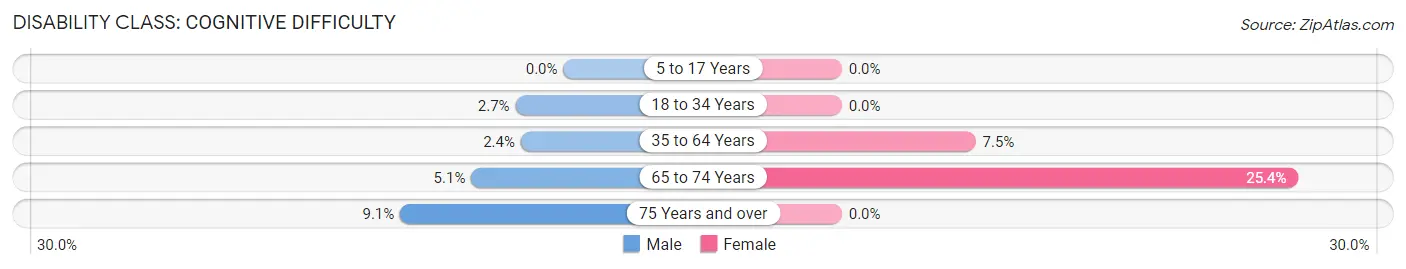
| Age Bracket | Male | Female |
| 5 to 17 Years | 0 (0.0%) | 0 (0.0%) |
| 18 to 34 Years | 4 (2.7%) | 0 (0.0%) |
| 35 to 64 Years | 4 (2.4%) | 12 (7.4%) |
| 65 to 74 Years | 2 (5.1%) | 15 (25.4%) |
| 75 Years and over | 2 (9.1%) | 0 (0.0%) |
Disability Class: Ambulatory Difficulty
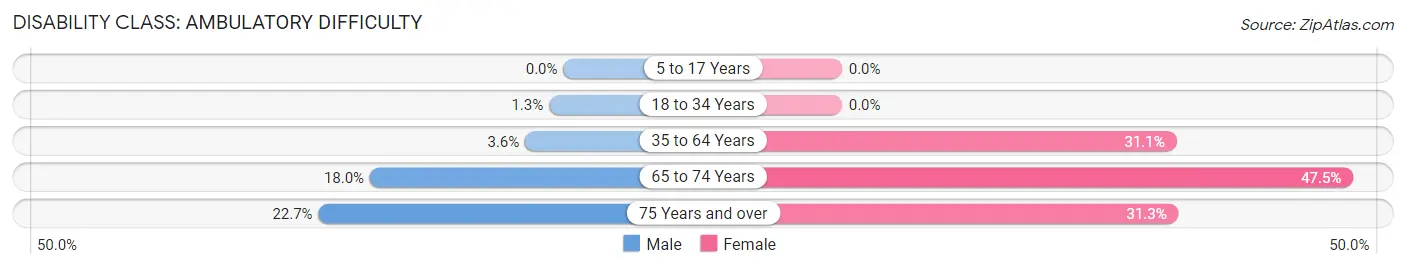
| Age Bracket | Male | Female |
| 5 to 17 Years | 0 (0.0%) | 0 (0.0%) |
| 18 to 34 Years | 2 (1.3%) | 0 (0.0%) |
| 35 to 64 Years | 6 (3.5%) | 50 (31.1%) |
| 65 to 74 Years | 7 (17.9%) | 28 (47.5%) |
| 75 Years and over | 5 (22.7%) | 5 (31.2%) |
Disability Class: Self-Care Difficulty
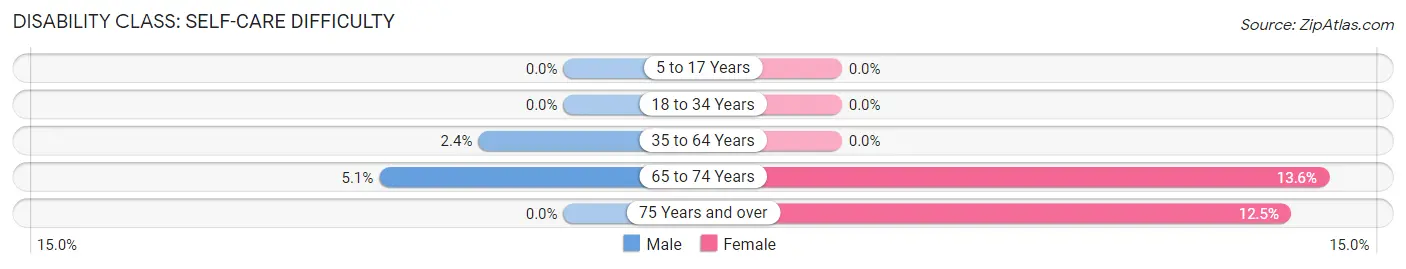
| Age Bracket | Male | Female |
| 5 to 17 Years | 0 (0.0%) | 0 (0.0%) |
| 18 to 34 Years | 0 (0.0%) | 0 (0.0%) |
| 35 to 64 Years | 4 (2.4%) | 0 (0.0%) |
| 65 to 74 Years | 2 (5.1%) | 8 (13.6%) |
| 75 Years and over | 0 (0.0%) | 2 (12.5%) |
Technology Access in Witt
Computing Device Access in Witt
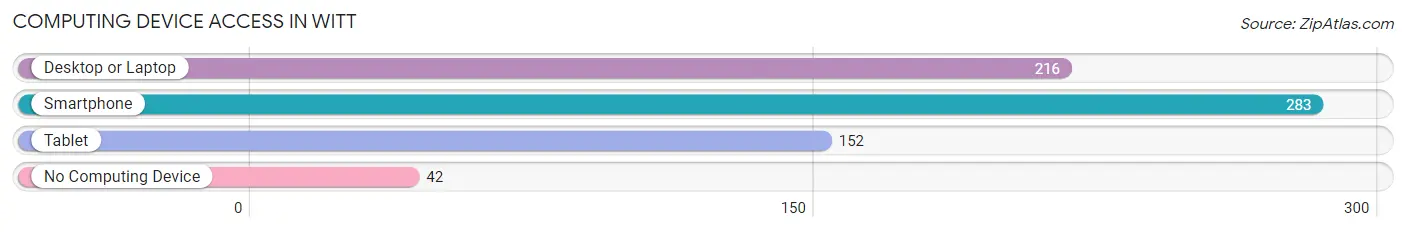
| Device Type | # Households | % Households |
| Desktop or Laptop | 216 | 59.2% |
| Smartphone | 283 | 77.5% |
| Tablet | 152 | 41.6% |
| No Computing Device | 42 | 11.5% |
| Total | 365 | 100.0% |
Internet Access in Witt
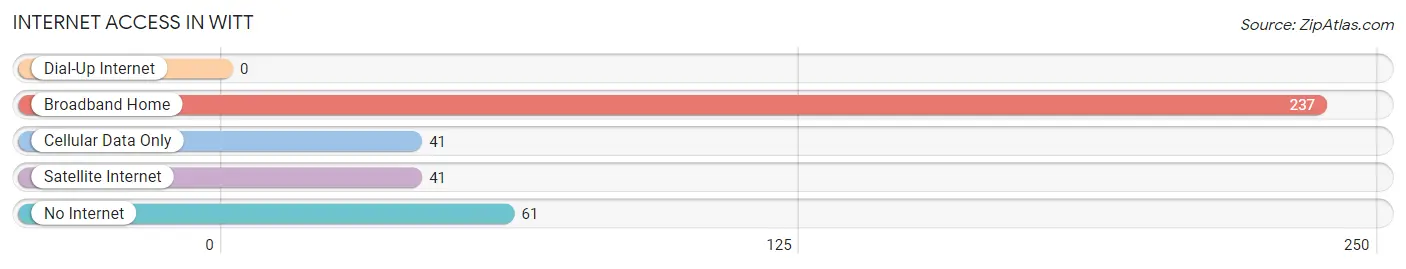
| Internet Type | # Households | % Households |
| Dial-Up Internet | 0 | 0.0% |
| Broadband Home | 237 | 64.9% |
| Cellular Data Only | 41 | 11.2% |
| Satellite Internet | 41 | 11.2% |
| No Internet | 61 | 16.7% |
| Total | 365 | 100.0% |
Witt Summary
Witt, Illinois is a small village located in Montgomery County, Illinois. It is situated on the banks of the Kaskaskia River, about 25 miles northeast of St. Louis, Missouri. The village has a population of approximately 1,000 people and covers an area of 0.6 square miles.
History
The area that is now Witt was first settled in the early 1800s by German immigrants. The village was originally known as “Kaskaskia” and was later renamed “Witt” in honor of the first settler, John Witt. The village was officially incorporated in 1872.
In the late 1800s, Witt was a thriving agricultural community. The village was home to several grain elevators, a flour mill, a sawmill, and a brickyard. The village also had a railroad station, which connected it to the larger cities of St. Louis and Chicago.
Geography
Witt is located in the Central Till Plains region of Illinois. The village is situated on the banks of the Kaskaskia River, which flows through the village and provides a source of recreation for the residents. The village is surrounded by rolling hills and farmland.
The climate in Witt is typical of the Midwest, with hot summers and cold winters. The average temperature in the summer is around 80 degrees Fahrenheit, while the average temperature in the winter is around 30 degrees Fahrenheit.
Economy
The economy of Witt is largely based on agriculture. The village is home to several grain elevators, a flour mill, and a sawmill. The village also has a few small businesses, including a grocery store, a hardware store, and a few restaurants.
The village is also home to a few manufacturing companies, including a plastics factory and a metal fabrication plant. The village also has a few small service businesses, such as a gas station and a car repair shop.
Demographics
As of the 2010 census, the population of Witt was 1,000 people. The racial makeup of the village was 97.2% White, 0.7% African American, 0.3% Native American, 0.3% Asian, and 1.5% from other races. The median household income in Witt was $45,000, and the median age was 40 years.
Conclusion
Witt, Illinois is a small village located in Montgomery County, Illinois. It is situated on the banks of the Kaskaskia River, about 25 miles northeast of St. Louis, Missouri. The village has a population of approximately 1,000 people and covers an area of 0.6 square miles. The economy of Witt is largely based on agriculture, and the village is home to several grain elevators, a flour mill, and a sawmill. The racial makeup of the village is 97.2% White, 0.7% African American, 0.3% Native American, 0.3% Asian, and 1.5% from other races. The median household income in Witt was $45,000, and the median age was 40 years.
Common Questions
What is Per Capita Income in Witt?
Per Capita income in Witt is $24,338.
What is the Median Family Income in Witt?
Median Family Income in Witt is $74,000.
What is the Median Household income in Witt?
Median Household Income in Witt is $53,301.
What is Income or Wage Gap in Witt?
Income or Wage Gap in Witt is 50.1%.
Women in Witt earn 49.9 cents for every dollar earned by a man.
What is Inequality or Gini Index in Witt?
Inequality or Gini Index in Witt is 0.40.
What is the Total Population of Witt?
Total Population of Witt is 935.
What is the Total Male Population of Witt?
Total Male Population of Witt is 491.
What is the Total Female Population of Witt?
Total Female Population of Witt is 444.
What is the Ratio of Males per 100 Females in Witt?
There are 110.59 Males per 100 Females in Witt.
What is the Ratio of Females per 100 Males in Witt?
There are 90.43 Females per 100 Males in Witt.
What is the Median Population Age in Witt?
Median Population Age in Witt is 33.9 Years.
What is the Average Family Size in Witt
Average Family Size in Witt is 3.3 People.
What is the Average Household Size in Witt
Average Household Size in Witt is 2.6 People.
How Large is the Labor Force in Witt?
There are 411 People in the Labor Forcein in Witt.
What is the Percentage of People in the Labor Force in Witt?
58.1% of People are in the Labor Force in Witt.
What is the Unemployment Rate in Witt?
Unemployment Rate in Witt is 9.7%.