Wilmington, IL Map & Demographics
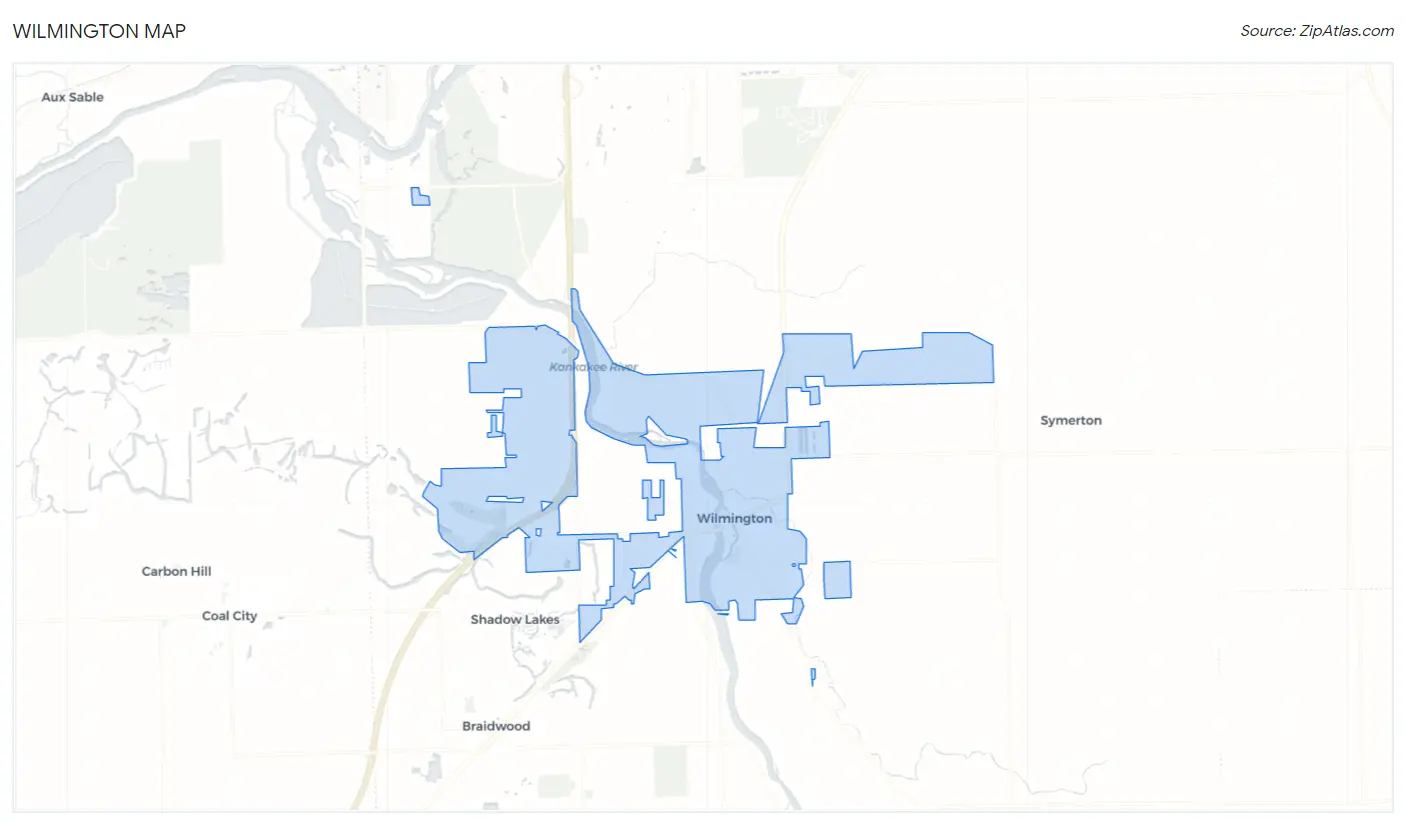
Wilmington Map
Wilmington Overview
$36,538
PER CAPITA INCOME
$94,745
AVG FAMILY INCOME
$66,538
AVG HOUSEHOLD INCOME
40.7%
WAGE / INCOME GAP [ % ]
59.3¢/ $1
WAGE / INCOME GAP [ $ ]
$8,352
FAMILY INCOME DEFICIT
0.42
INEQUALITY / GINI INDEX
5,525
TOTAL POPULATION
2,701
MALE POPULATION
2,824
FEMALE POPULATION
95.64
MALES / 100 FEMALES
104.55
FEMALES / 100 MALES
43.9
MEDIAN AGE
3.1
AVG FAMILY SIZE
2.3
AVG HOUSEHOLD SIZE
3,011
LABOR FORCE [ PEOPLE ]
63.9%
PERCENT IN LABOR FORCE
4.2%
UNEMPLOYMENT RATE
Wilmington Zip Codes
Income in Wilmington
Income Overview in Wilmington
Per Capita Income in Wilmington is $36,538, while median incomes of families and households are $94,745 and $66,538 respectively.
| Characteristic | Number | Measure |
| Per Capita Income | 5,525 | $36,538 |
| Median Family Income | 1,248 | $94,745 |
| Mean Family Income | 1,248 | $105,463 |
| Median Household Income | 2,330 | $66,538 |
| Mean Household Income | 2,330 | $83,631 |
| Income Deficit | 1,248 | $8,352 |
| Wage / Income Gap (%) | 5,525 | 40.66% |
| Wage / Income Gap ($) | 5,525 | 59.34¢ per $1 |
| Gini / Inequality Index | 5,525 | 0.42 |
Earnings by Sex in Wilmington
Average Earnings in Wilmington are $41,144, $52,619 for men and $31,224 for women, a difference of 40.7%.
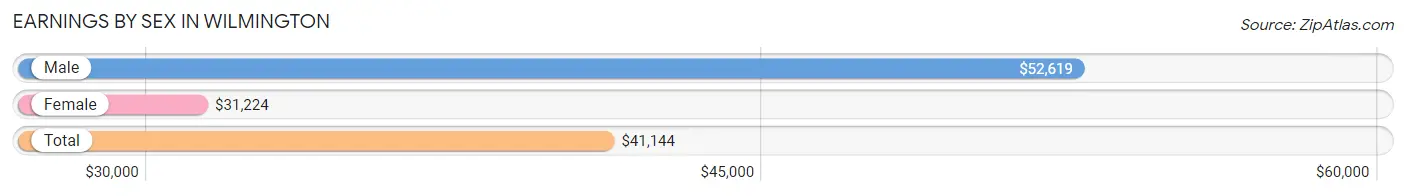
| Sex | Number | Average Earnings |
| Male | 1,510 (49.1%) | $52,619 |
| Female | 1,562 (50.8%) | $31,224 |
| Total | 3,072 (100.0%) | $41,144 |
Earnings by Sex by Income Bracket in Wilmington
The most common earnings brackets in Wilmington are $100,000+ for men (225 | 14.9%) and $35,000 to $39,999 for women (137 | 8.8%).
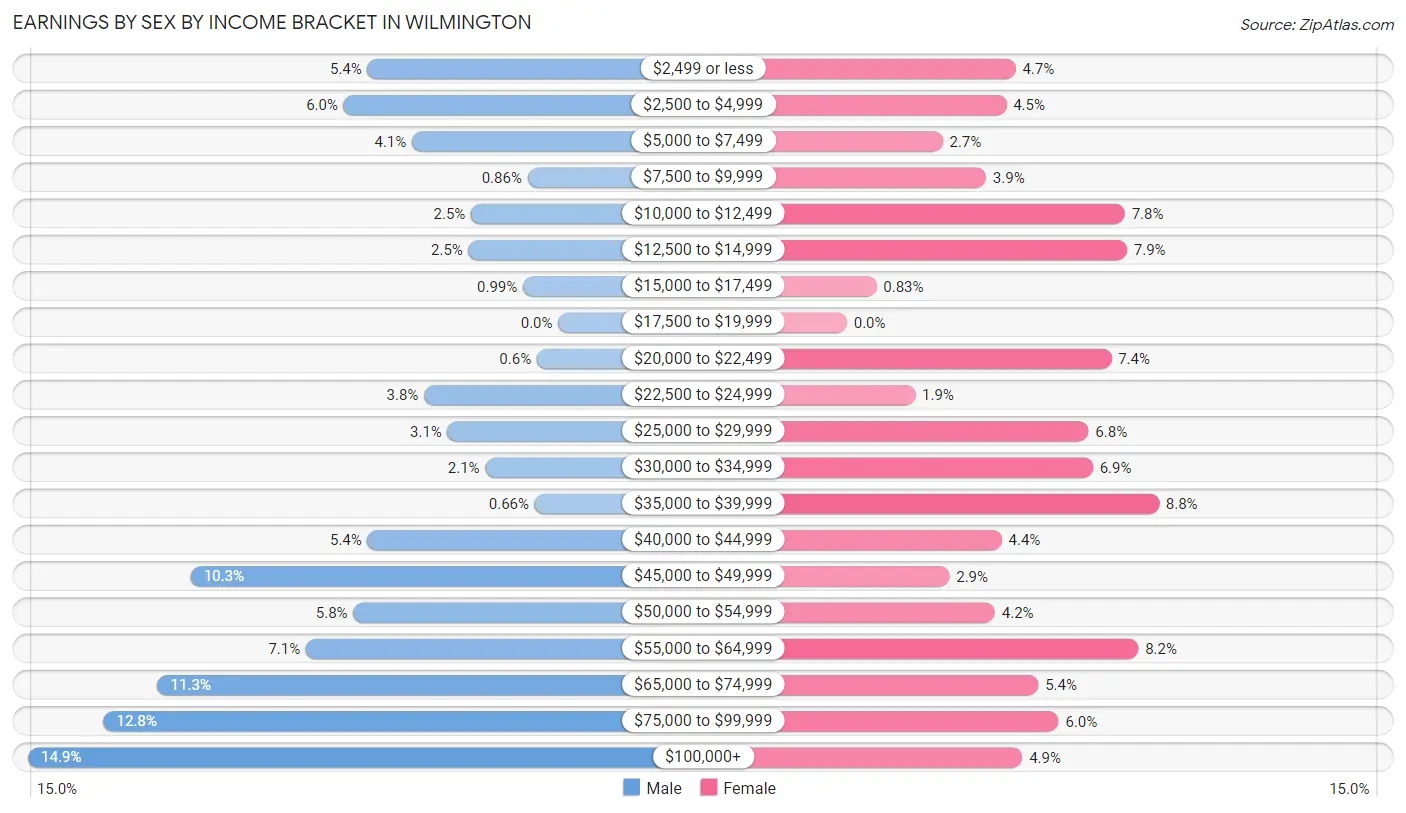
| Income | Male | Female |
| $2,499 or less | 81 (5.4%) | 74 (4.7%) |
| $2,500 to $4,999 | 91 (6.0%) | 70 (4.5%) |
| $5,000 to $7,499 | 62 (4.1%) | 42 (2.7%) |
| $7,500 to $9,999 | 13 (0.9%) | 61 (3.9%) |
| $10,000 to $12,499 | 37 (2.5%) | 122 (7.8%) |
| $12,500 to $14,999 | 38 (2.5%) | 123 (7.9%) |
| $15,000 to $17,499 | 15 (1.0%) | 13 (0.8%) |
| $17,500 to $19,999 | 0 (0.0%) | 0 (0.0%) |
| $20,000 to $22,499 | 9 (0.6%) | 116 (7.4%) |
| $22,500 to $24,999 | 57 (3.8%) | 30 (1.9%) |
| $25,000 to $29,999 | 47 (3.1%) | 106 (6.8%) |
| $30,000 to $34,999 | 31 (2.1%) | 108 (6.9%) |
| $35,000 to $39,999 | 10 (0.7%) | 137 (8.8%) |
| $40,000 to $44,999 | 81 (5.4%) | 68 (4.3%) |
| $45,000 to $49,999 | 156 (10.3%) | 45 (2.9%) |
| $50,000 to $54,999 | 87 (5.8%) | 65 (4.2%) |
| $55,000 to $64,999 | 107 (7.1%) | 128 (8.2%) |
| $65,000 to $74,999 | 170 (11.3%) | 84 (5.4%) |
| $75,000 to $99,999 | 193 (12.8%) | 93 (5.9%) |
| $100,000+ | 225 (14.9%) | 77 (4.9%) |
| Total | 1,510 (100.0%) | 1,562 (100.0%) |
Earnings by Sex by Educational Attainment in Wilmington
Average earnings in Wilmington are $61,321 for men and $35,619 for women, a difference of 41.9%. Men with an educational attainment of bachelor's degree enjoy the highest average annual earnings of $85,313, while those with less than high school education earn the least with $36,250. Women with an educational attainment of graduate degree earn the most with the average annual earnings of $51,486, while those with college or associate's degree education have the smallest earnings of $33,203.
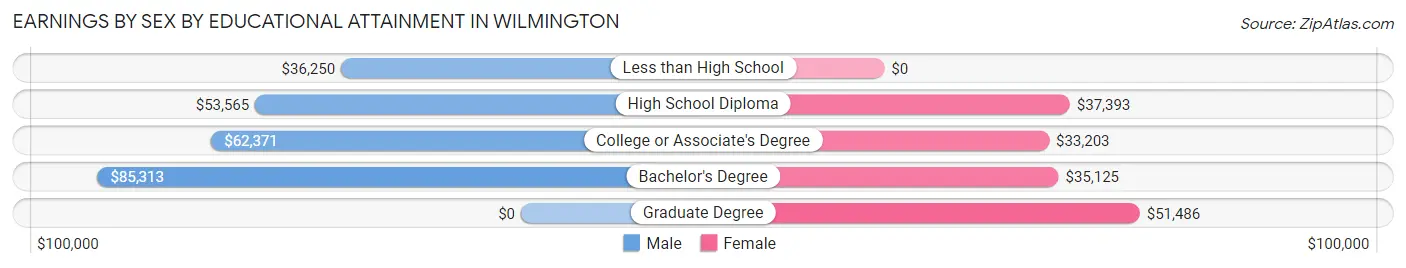
| Educational Attainment | Male Income | Female Income |
| Less than High School | $36,250 | $0 |
| High School Diploma | $53,565 | $37,393 |
| College or Associate's Degree | $62,371 | $33,203 |
| Bachelor's Degree | $85,313 | $35,125 |
| Graduate Degree | - | - |
| Total | $61,321 | $35,619 |
Family Income in Wilmington
Family Income Brackets in Wilmington
According to the Wilmington family income data, there are 403 families falling into the $100,000 to $149,999 income range, which is the most common income bracket and makes up 32.3% of all families. Conversely, the $15,000 to $24,999 income bracket is the least frequent group with only 9 families (0.7%) belonging to this category.
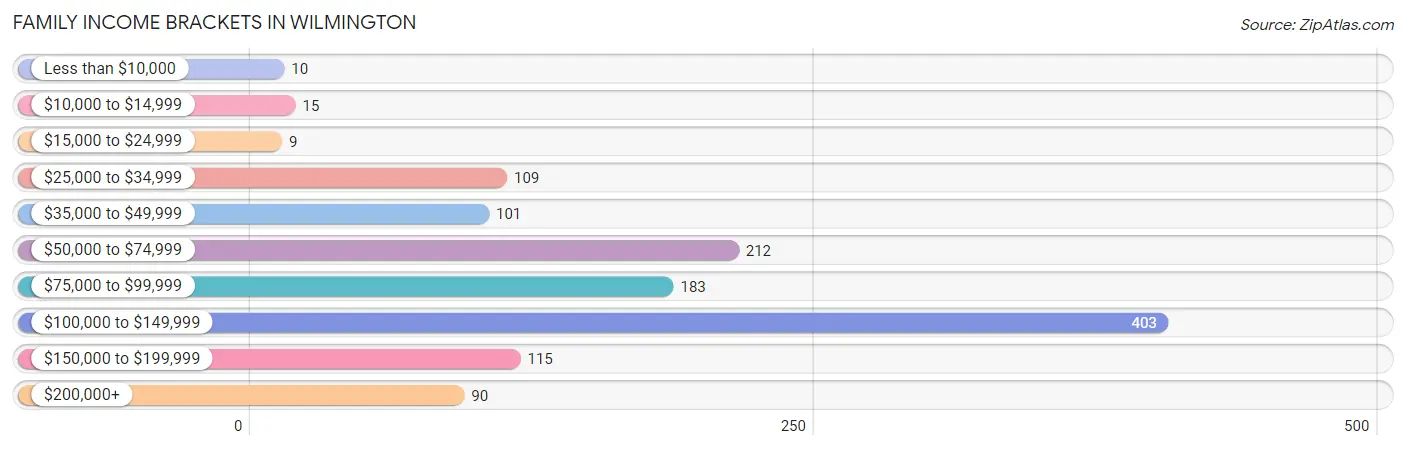
| Income Bracket | # Families | % Families |
| Less than $10,000 | 10 | 0.8% |
| $10,000 to $14,999 | 15 | 1.2% |
| $15,000 to $24,999 | 9 | 0.7% |
| $25,000 to $34,999 | 109 | 8.7% |
| $35,000 to $49,999 | 101 | 8.1% |
| $50,000 to $74,999 | 212 | 17.0% |
| $75,000 to $99,999 | 183 | 14.7% |
| $100,000 to $149,999 | 403 | 32.3% |
| $150,000 to $199,999 | 115 | 9.2% |
| $200,000+ | 90 | 7.2% |
Family Income by Famaliy Size in Wilmington
4-person families (284 | 22.8%) account for the highest median family income in Wilmington with $137,667 per family, while 2-person families (560 | 44.9%) have the highest median income of $35,694 per family member.
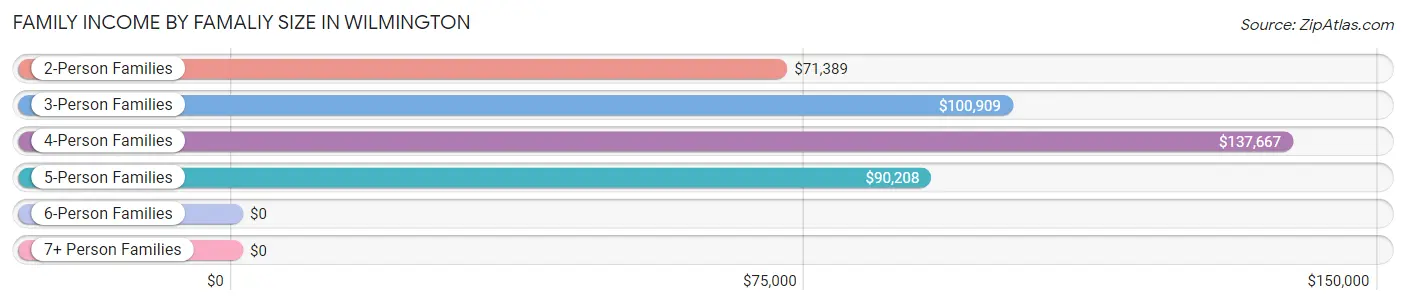
| Income Bracket | # Families | Median Income |
| 2-Person Families | 560 (44.9%) | $71,389 |
| 3-Person Families | 344 (27.6%) | $100,909 |
| 4-Person Families | 284 (22.8%) | $137,667 |
| 5-Person Families | 41 (3.3%) | $90,208 |
| 6-Person Families | 0 (0.0%) | $0 |
| 7+ Person Families | 19 (1.5%) | $0 |
| Total | 1,248 (100.0%) | $94,745 |
Family Income by Number of Earners in Wilmington
The median family income in Wilmington is $94,745, with families comprising 3+ earners (156) having the highest median family income of $139,000, while families with no earners (202) have the lowest median family income of $39,231, accounting for 12.5% and 16.2% of families, respectively.
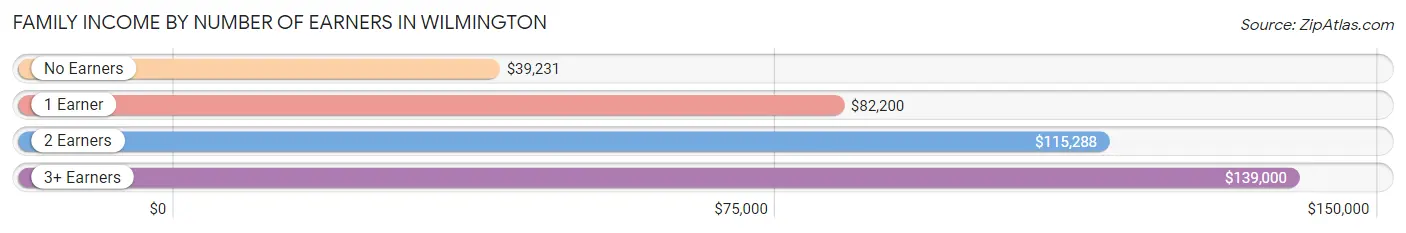
| Number of Earners | # Families | Median Income |
| No Earners | 202 (16.2%) | $39,231 |
| 1 Earner | 392 (31.4%) | $82,200 |
| 2 Earners | 498 (39.9%) | $115,288 |
| 3+ Earners | 156 (12.5%) | $139,000 |
| Total | 1,248 (100.0%) | $94,745 |
Household Income in Wilmington
Household Income Brackets in Wilmington
With 485 households falling in the category, the $100,000 to $149,999 income range is the most frequent in Wilmington, accounting for 20.8% of all households. In contrast, only 105 households (4.5%) fall into the $10,000 to $14,999 income bracket, making it the least populous group.
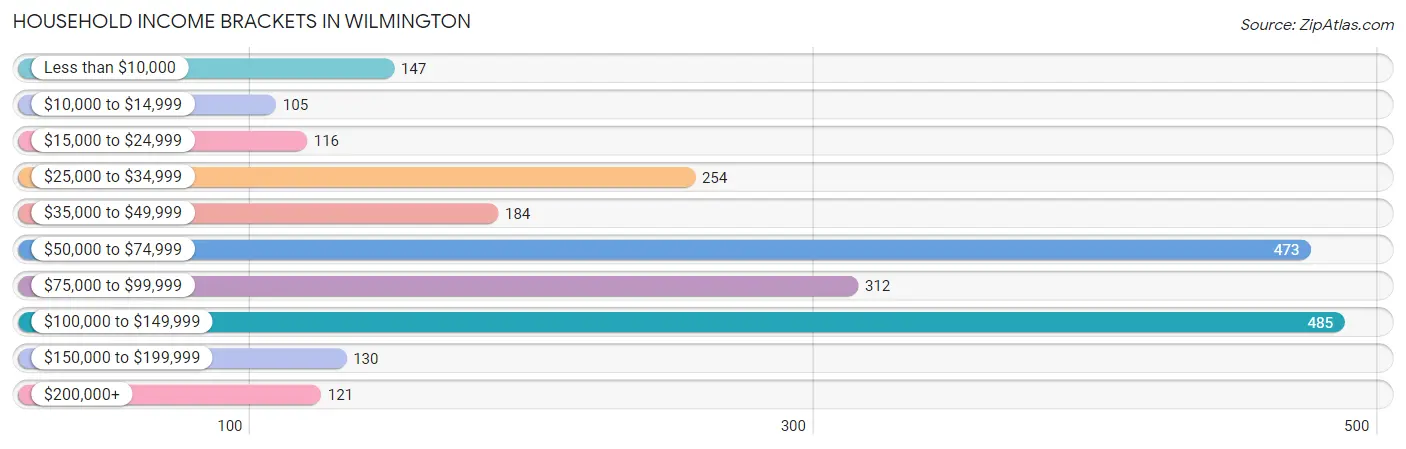
| Income Bracket | # Households | % Households |
| Less than $10,000 | 147 | 6.3% |
| $10,000 to $14,999 | 105 | 4.5% |
| $15,000 to $24,999 | 116 | 5.0% |
| $25,000 to $34,999 | 254 | 10.9% |
| $35,000 to $49,999 | 184 | 7.9% |
| $50,000 to $74,999 | 473 | 20.3% |
| $75,000 to $99,999 | 312 | 13.4% |
| $100,000 to $149,999 | 485 | 20.8% |
| $150,000 to $199,999 | 130 | 5.6% |
| $200,000+ | 121 | 5.2% |
Household Income by Householder Age in Wilmington
The median household income in Wilmington is $66,538, with the highest median household income of $92,837 found in the 25 to 44 years age bracket for the primary householder. A total of 577 households (24.8%) fall into this category. Meanwhile, the 65+ years age bracket for the primary householder has the lowest median household income of $39,890, with 752 households (32.3%) in this group.
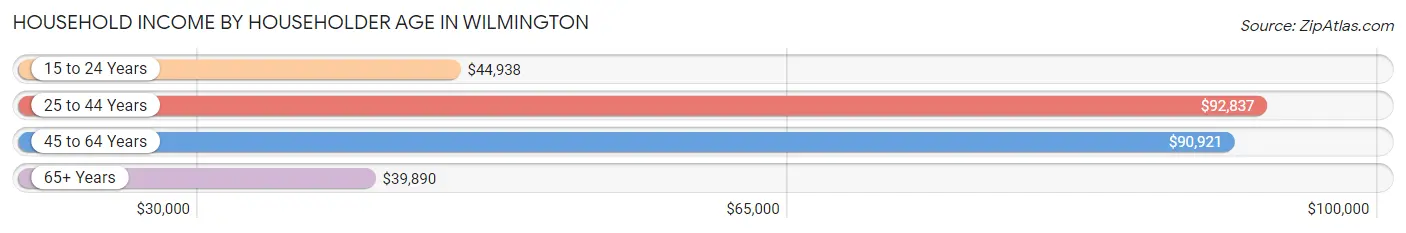
| Income Bracket | # Households | Median Income |
| 15 to 24 Years | 143 (6.1%) | $44,938 |
| 25 to 44 Years | 577 (24.8%) | $92,837 |
| 45 to 64 Years | 858 (36.8%) | $90,921 |
| 65+ Years | 752 (32.3%) | $39,890 |
| Total | 2,330 (100.0%) | $66,538 |
Poverty in Wilmington
Income Below Poverty by Sex and Age in Wilmington
With 10.0% poverty level for males and 10.6% for females among the residents of Wilmington, 16 and 17 year old males and 18 to 24 year old females are the most vulnerable to poverty, with 20 males (29.0%) and 100 females (44.6%) in their respective age groups living below the poverty level.
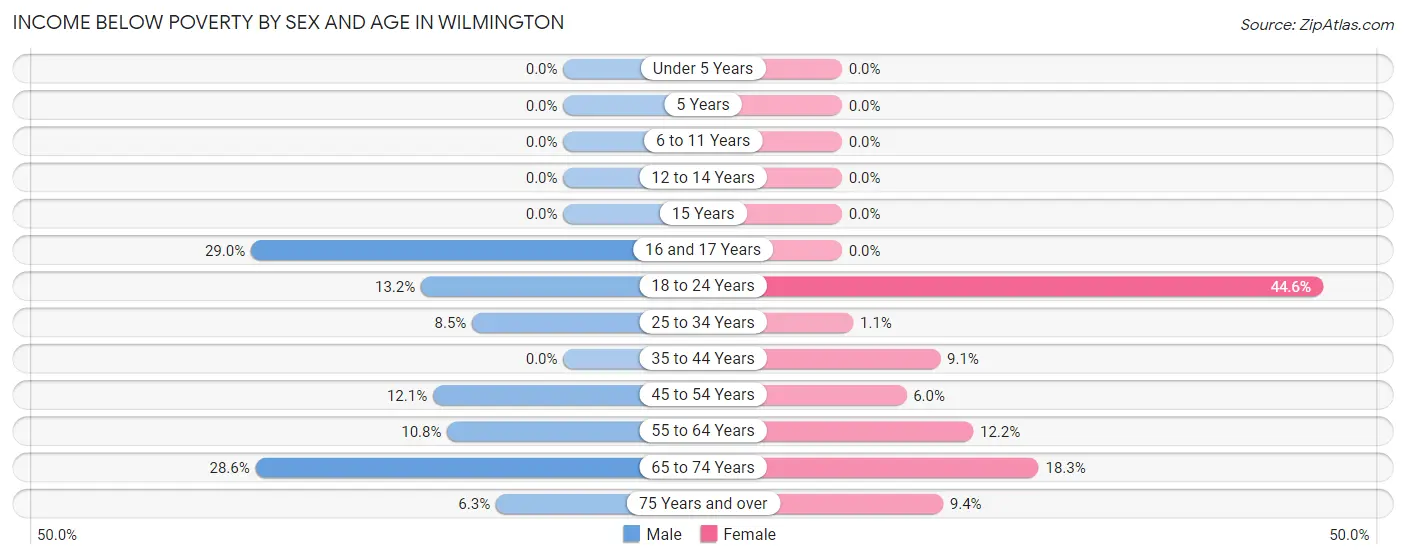
| Age Bracket | Male | Female |
| Under 5 Years | 0 (0.0%) | 0 (0.0%) |
| 5 Years | 0 (0.0%) | 0 (0.0%) |
| 6 to 11 Years | 0 (0.0%) | 0 (0.0%) |
| 12 to 14 Years | 0 (0.0%) | 0 (0.0%) |
| 15 Years | 0 (0.0%) | 0 (0.0%) |
| 16 and 17 Years | 20 (29.0%) | 0 (0.0%) |
| 18 to 24 Years | 44 (13.2%) | 100 (44.6%) |
| 25 to 34 Years | 34 (8.5%) | 4 (1.1%) |
| 35 to 44 Years | 0 (0.0%) | 28 (9.1%) |
| 45 to 54 Years | 42 (12.1%) | 21 (6.0%) |
| 55 to 64 Years | 39 (10.8%) | 57 (12.2%) |
| 65 to 74 Years | 72 (28.6%) | 40 (18.3%) |
| 75 Years and over | 10 (6.2%) | 38 (9.4%) |
| Total | 261 (10.0%) | 288 (10.6%) |
Income Above Poverty by Sex and Age in Wilmington
According to the poverty statistics in Wilmington, males aged under 5 years and females aged under 5 years are the age groups that are most secure financially, with 100.0% of males and 100.0% of females in these age groups living above the poverty line.
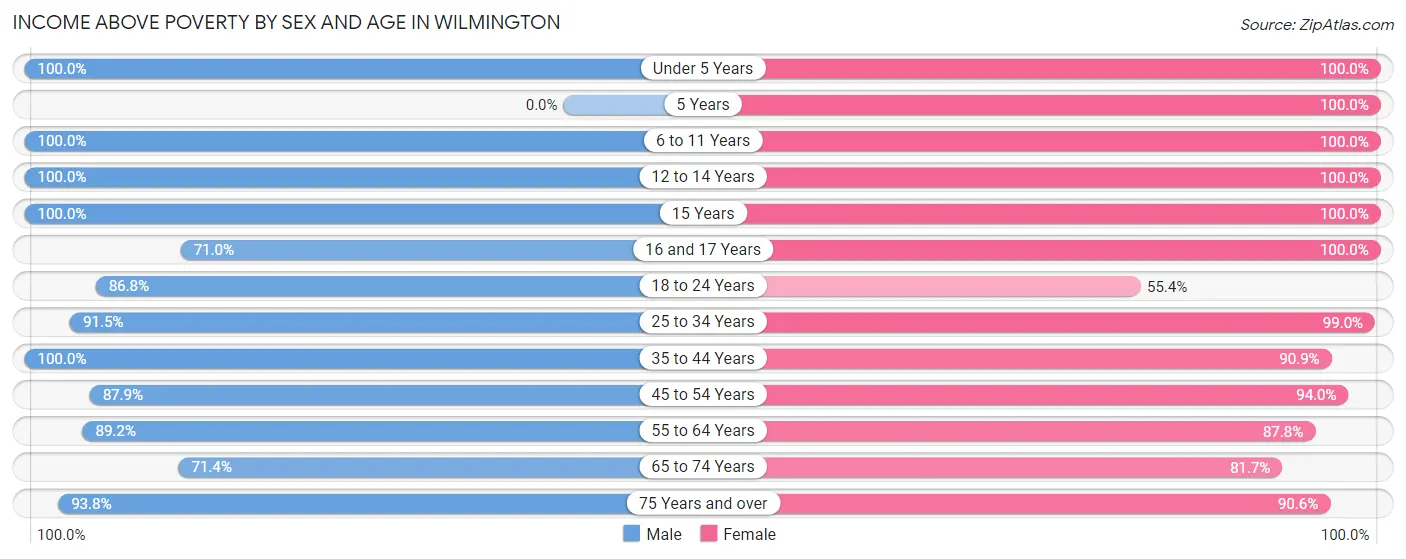
| Age Bracket | Male | Female |
| Under 5 Years | 268 (100.0%) | 126 (100.0%) |
| 5 Years | 0 (0.0%) | 25 (100.0%) |
| 6 to 11 Years | 149 (100.0%) | 74 (100.0%) |
| 12 to 14 Years | 38 (100.0%) | 80 (100.0%) |
| 15 Years | 18 (100.0%) | 12 (100.0%) |
| 16 and 17 Years | 49 (71.0%) | 44 (100.0%) |
| 18 to 24 Years | 289 (86.8%) | 124 (55.4%) |
| 25 to 34 Years | 368 (91.5%) | 377 (99.0%) |
| 35 to 44 Years | 215 (100.0%) | 279 (90.9%) |
| 45 to 54 Years | 305 (87.9%) | 330 (94.0%) |
| 55 to 64 Years | 323 (89.2%) | 411 (87.8%) |
| 65 to 74 Years | 180 (71.4%) | 179 (81.7%) |
| 75 Years and over | 150 (93.8%) | 367 (90.6%) |
| Total | 2,352 (90.0%) | 2,428 (89.4%) |
Income Below Poverty Among Married-Couple Families in Wilmington
The poverty statistics for married-couple families in Wilmington show that 3.0% or 29 of the total 980 families live below the poverty line. Families with no children have the highest poverty rate of 4.5%, comprising of 29 families. On the other hand, families with 1 or 2 children have the lowest poverty rate of 0.0%, which includes 0 families.
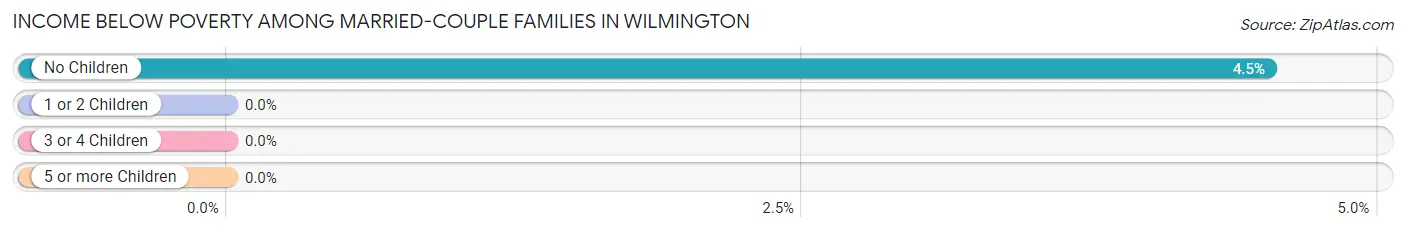
| Children | Above Poverty | Below Poverty |
| No Children | 613 (95.5%) | 29 (4.5%) |
| 1 or 2 Children | 323 (100.0%) | 0 (0.0%) |
| 3 or 4 Children | 15 (100.0%) | 0 (0.0%) |
| 5 or more Children | 0 (0.0%) | 0 (0.0%) |
| Total | 951 (97.0%) | 29 (3.0%) |
Income Below Poverty Among Single-Parent Households in Wilmington
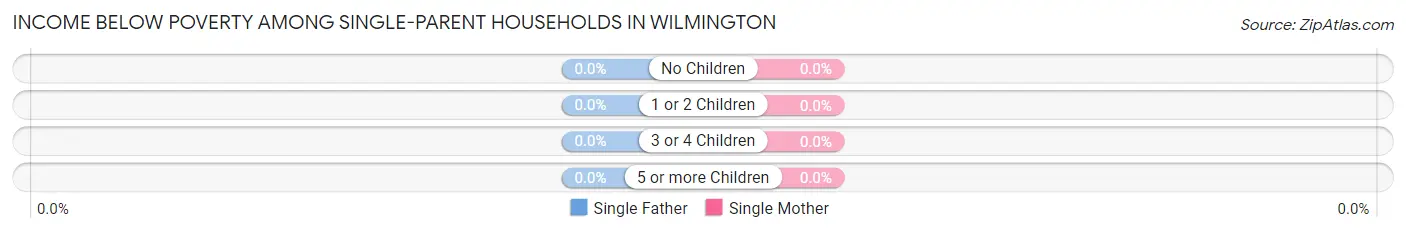
| Children | Single Father | Single Mother |
| No Children | 0 (0.0%) | 0 (0.0%) |
| 1 or 2 Children | 0 (0.0%) | 0 (0.0%) |
| 3 or 4 Children | 0 (0.0%) | 0 (0.0%) |
| 5 or more Children | 0 (0.0%) | 0 (0.0%) |
| Total | 0 (0.0%) | 0 (0.0%) |
Income Below Poverty Among Married-Couple vs Single-Parent Households in Wilmington
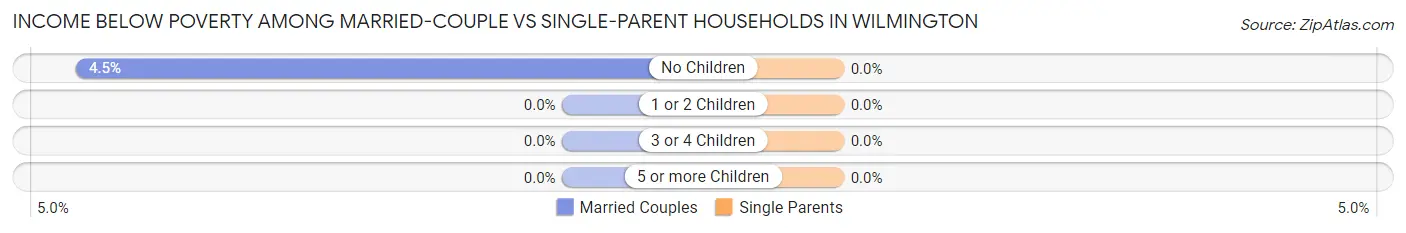
| Children | Married-Couple Families | Single-Parent Households |
| No Children | 29 (4.5%) | 0 (0.0%) |
| 1 or 2 Children | 0 (0.0%) | 0 (0.0%) |
| 3 or 4 Children | 0 (0.0%) | 0 (0.0%) |
| 5 or more Children | 0 (0.0%) | 0 (0.0%) |
| Total | 29 (3.0%) | 0 (0.0%) |
Race in Wilmington
The most populous races in Wilmington are White / Caucasian (5,081 | 92.0%), Hispanic or Latino (513 | 9.3%), and Two or more Races (197 | 3.6%).
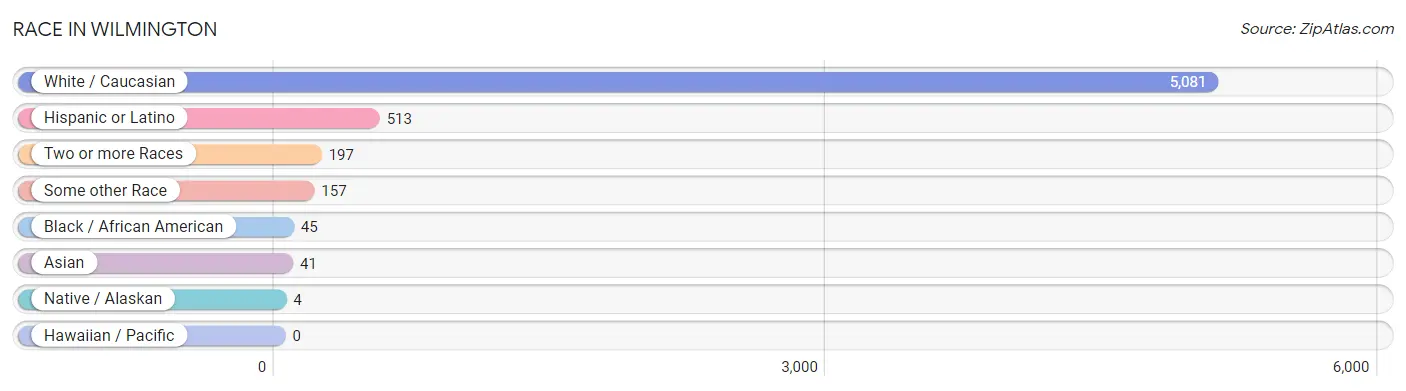
| Race | # Population | % Population |
| Asian | 41 | 0.7% |
| Black / African American | 45 | 0.8% |
| Hawaiian / Pacific | 0 | 0.0% |
| Hispanic or Latino | 513 | 9.3% |
| Native / Alaskan | 4 | 0.1% |
| White / Caucasian | 5,081 | 92.0% |
| Two or more Races | 197 | 3.6% |
| Some other Race | 157 | 2.8% |
| Total | 5,525 | 100.0% |
Ancestry in Wilmington
The most populous ancestries reported in Wilmington are German (1,188 | 21.5%), Irish (954 | 17.3%), Italian (606 | 11.0%), English (509 | 9.2%), and Mexican (399 | 7.2%), together accounting for 66.2% of all Wilmington residents.
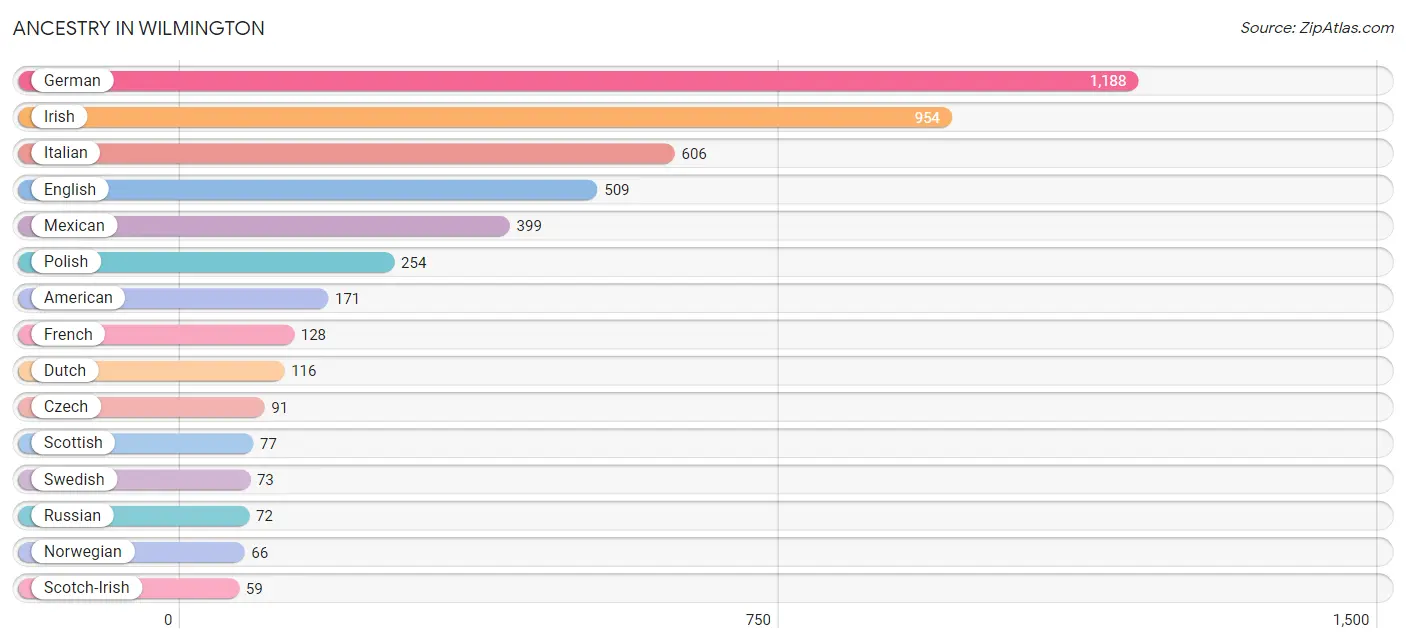
| Ancestry | # Population | % Population |
| American | 171 | 3.1% |
| Arab | 47 | 0.9% |
| Austrian | 16 | 0.3% |
| Belgian | 17 | 0.3% |
| Bhutanese | 4 | 0.1% |
| British | 40 | 0.7% |
| Croatian | 51 | 0.9% |
| Czech | 91 | 1.7% |
| Czechoslovakian | 35 | 0.6% |
| Dutch | 116 | 2.1% |
| Eastern European | 15 | 0.3% |
| English | 509 | 9.2% |
| European | 43 | 0.8% |
| Finnish | 27 | 0.5% |
| French | 128 | 2.3% |
| German | 1,188 | 21.5% |
| Greek | 33 | 0.6% |
| Guamanian / Chamorro | 11 | 0.2% |
| Haitian | 30 | 0.5% |
| Irish | 954 | 17.3% |
| Italian | 606 | 11.0% |
| Korean | 53 | 1.0% |
| Latvian | 4 | 0.1% |
| Lebanese | 8 | 0.1% |
| Lithuanian | 52 | 0.9% |
| Mexican | 399 | 7.2% |
| Norwegian | 66 | 1.2% |
| Polish | 254 | 4.6% |
| Puerto Rican | 6 | 0.1% |
| Russian | 72 | 1.3% |
| Scotch-Irish | 59 | 1.1% |
| Scottish | 77 | 1.4% |
| Serbian | 10 | 0.2% |
| Sioux | 4 | 0.1% |
| Slovak | 8 | 0.1% |
| Slovene | 22 | 0.4% |
| Spanish | 23 | 0.4% |
| Swedish | 73 | 1.3% |
| Syrian | 39 | 0.7% |
| Ukrainian | 9 | 0.2% |
| Welsh | 32 | 0.6% |
| Yugoslavian | 18 | 0.3% | View All 42 Rows |
Immigrants in Wilmington
The most numerous immigrant groups reported in Wilmington came from Europe (59 | 1.1%), Asia (42 | 0.8%), Philippines (42 | 0.8%), South Eastern Asia (42 | 0.8%), and Central America (37 | 0.7%), together accounting for 4.0% of all Wilmington residents.
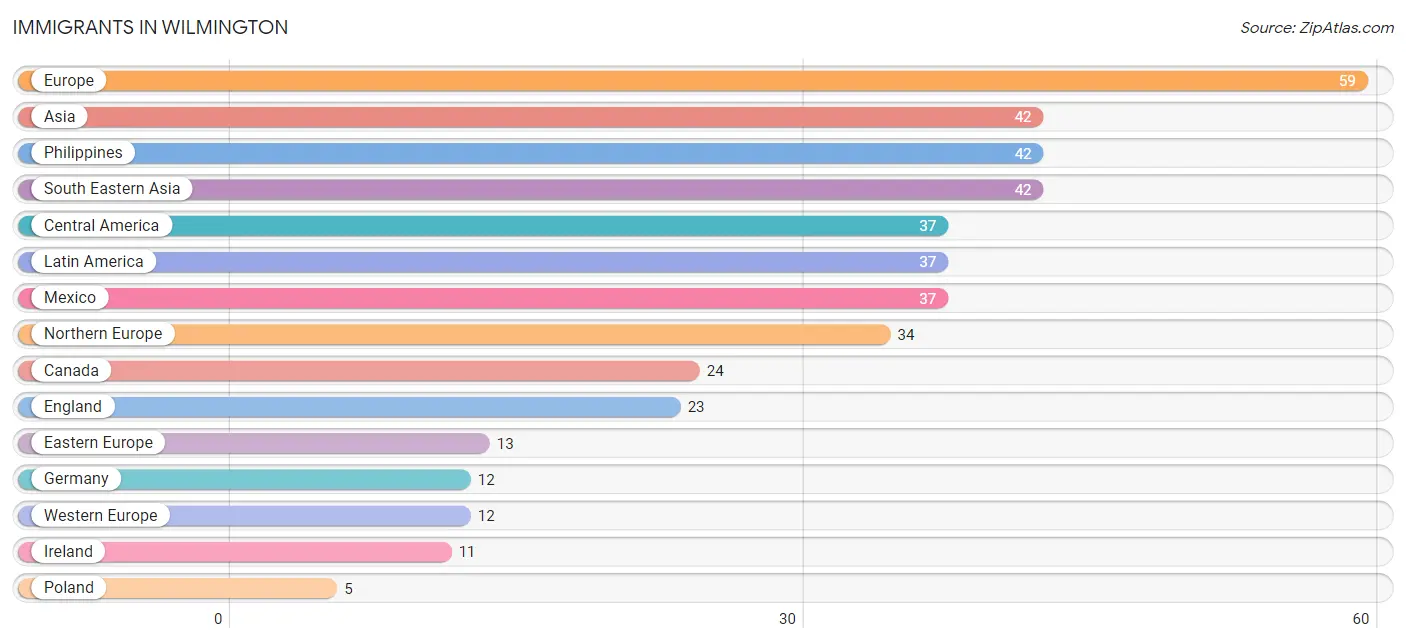
| Immigration Origin | # Population | % Population |
| Asia | 42 | 0.8% |
| Canada | 24 | 0.4% |
| Central America | 37 | 0.7% |
| Eastern Europe | 13 | 0.2% |
| England | 23 | 0.4% |
| Europe | 59 | 1.1% |
| Germany | 12 | 0.2% |
| Ireland | 11 | 0.2% |
| Latin America | 37 | 0.7% |
| Latvia | 4 | 0.1% |
| Mexico | 37 | 0.7% |
| Northern Europe | 34 | 0.6% |
| Philippines | 42 | 0.8% |
| Poland | 5 | 0.1% |
| Russia | 4 | 0.1% |
| South Eastern Asia | 42 | 0.8% |
| Western Europe | 12 | 0.2% | View All 17 Rows |
Sex and Age in Wilmington
Sex and Age in Wilmington
The most populous age groups in Wilmington are 20 to 24 Years (309 | 11.4%) for men and 55 to 59 Years (244 | 8.6%) for women.
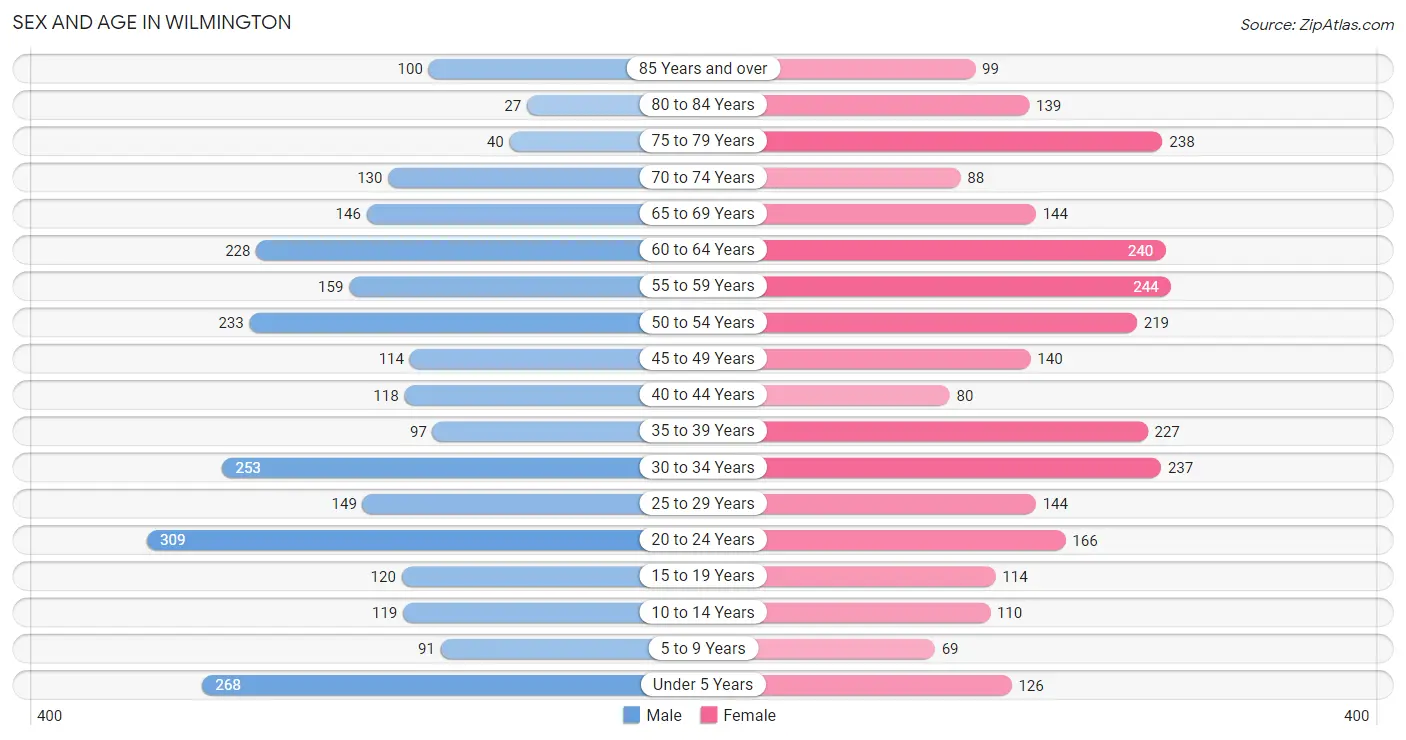
| Age Bracket | Male | Female |
| Under 5 Years | 268 (9.9%) | 126 (4.5%) |
| 5 to 9 Years | 91 (3.4%) | 69 (2.4%) |
| 10 to 14 Years | 119 (4.4%) | 110 (3.9%) |
| 15 to 19 Years | 120 (4.4%) | 114 (4.0%) |
| 20 to 24 Years | 309 (11.4%) | 166 (5.9%) |
| 25 to 29 Years | 149 (5.5%) | 144 (5.1%) |
| 30 to 34 Years | 253 (9.4%) | 237 (8.4%) |
| 35 to 39 Years | 97 (3.6%) | 227 (8.0%) |
| 40 to 44 Years | 118 (4.4%) | 80 (2.8%) |
| 45 to 49 Years | 114 (4.2%) | 140 (5.0%) |
| 50 to 54 Years | 233 (8.6%) | 219 (7.7%) |
| 55 to 59 Years | 159 (5.9%) | 244 (8.6%) |
| 60 to 64 Years | 228 (8.4%) | 240 (8.5%) |
| 65 to 69 Years | 146 (5.4%) | 144 (5.1%) |
| 70 to 74 Years | 130 (4.8%) | 88 (3.1%) |
| 75 to 79 Years | 40 (1.5%) | 238 (8.4%) |
| 80 to 84 Years | 27 (1.0%) | 139 (4.9%) |
| 85 Years and over | 100 (3.7%) | 99 (3.5%) |
| Total | 2,701 (100.0%) | 2,824 (100.0%) |
Families and Households in Wilmington
Median Family Size in Wilmington
The median family size in Wilmington is 3.08 persons per family, with single female/mother families (232 | 18.6%) accounting for the largest median family size of 3.86 persons per family. On the other hand, married-couple families (980 | 78.5%) represent the smallest median family size with 2.90 persons per family.
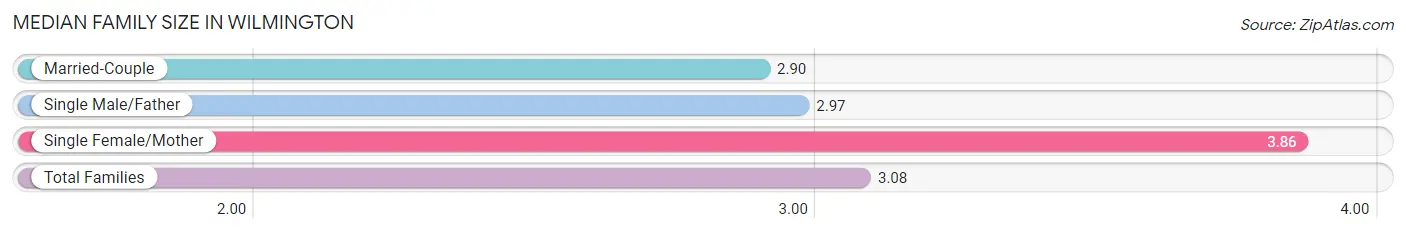
| Family Type | # Families | Family Size |
| Married-Couple | 980 (78.5%) | 2.90 |
| Single Male/Father | 36 (2.9%) | 2.97 |
| Single Female/Mother | 232 (18.6%) | 3.86 |
| Total Families | 1,248 (100.0%) | 3.08 |
Median Household Size in Wilmington
The median household size in Wilmington is 2.29 persons per household, with single female/mother households (232 | 10.0%) accounting for the largest median household size of 3.99 persons per household. non-family households (1,082 | 46.4%) represent the smallest median household size with 1.31 persons per household.
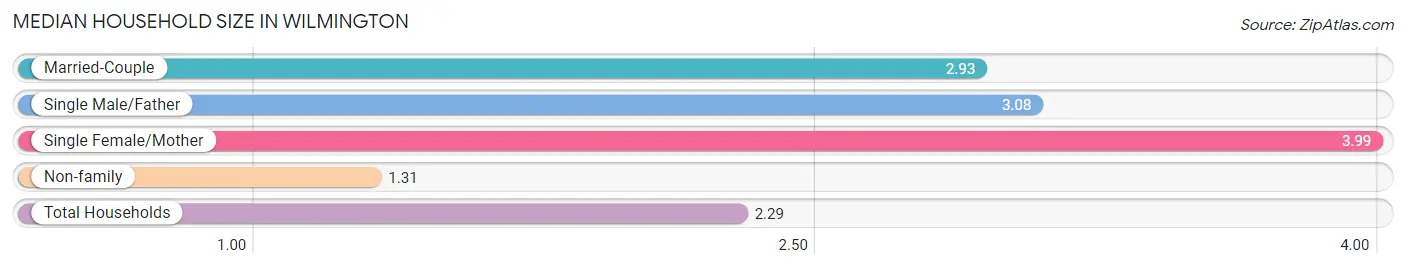
| Household Type | # Households | Household Size |
| Married-Couple | 980 (42.1%) | 2.93 |
| Single Male/Father | 36 (1.5%) | 3.08 |
| Single Female/Mother | 232 (10.0%) | 3.99 |
| Non-family | 1,082 (46.4%) | 1.31 |
| Total Households | 2,330 (100.0%) | 2.29 |
Household Size by Marriage Status in Wilmington
Out of a total of 2,330 households in Wilmington, 1,248 (53.6%) are family households, while 1,082 (46.4%) are nonfamily households. The most numerous type of family households are 2-person households, comprising 555, and the most common type of nonfamily households are 1-person households, comprising 820.
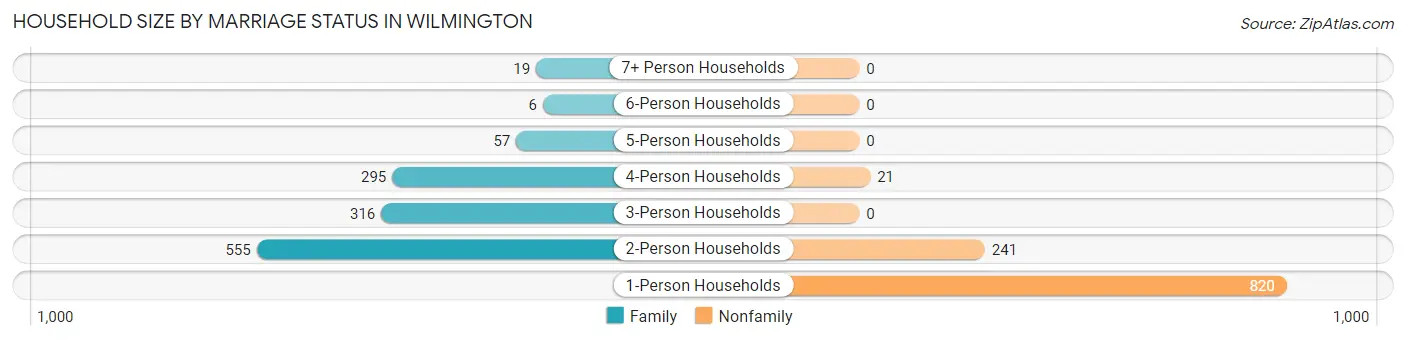
| Household Size | Family Households | Nonfamily Households |
| 1-Person Households | - | 820 (35.2%) |
| 2-Person Households | 555 (23.8%) | 241 (10.3%) |
| 3-Person Households | 316 (13.6%) | 0 (0.0%) |
| 4-Person Households | 295 (12.7%) | 21 (0.9%) |
| 5-Person Households | 57 (2.5%) | 0 (0.0%) |
| 6-Person Households | 6 (0.3%) | 0 (0.0%) |
| 7+ Person Households | 19 (0.8%) | 0 (0.0%) |
| Total | 1,248 (53.6%) | 1,082 (46.4%) |
Female Fertility in Wilmington
Fertility by Age in Wilmington
Average fertility rate in Wilmington is 76.0 births per 1,000 women. Women in the age bracket of 20 to 34 years have the highest fertility rate with 141.0 births per 1,000 women. Women in the age bracket of 20 to 34 years acount for 88.5% of all women with births.
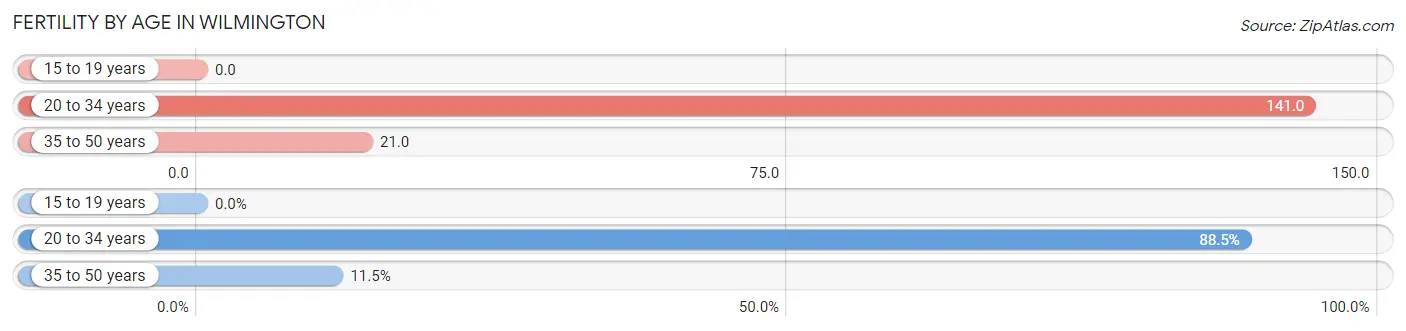
| Age Bracket | Women with Births | Births / 1,000 Women |
| 15 to 19 years | 0 (0.0%) | 0.0 |
| 20 to 34 years | 77 (88.5%) | 141.0 |
| 35 to 50 years | 10 (11.5%) | 21.0 |
| Total | 87 (100.0%) | 76.0 |
Fertility by Age by Marriage Status in Wilmington
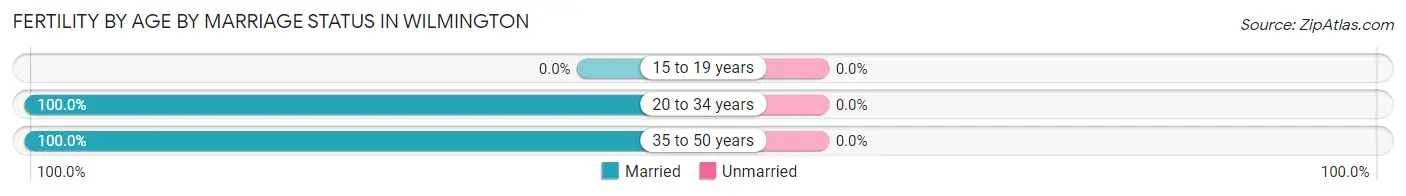
| Age Bracket | Married | Unmarried |
| 15 to 19 years | 0 (0.0%) | 0 (0.0%) |
| 20 to 34 years | 77 (100.0%) | 0 (0.0%) |
| 35 to 50 years | 10 (100.0%) | 0 (0.0%) |
| Total | 87 (100.0%) | 0 (0.0%) |
Fertility by Education in Wilmington
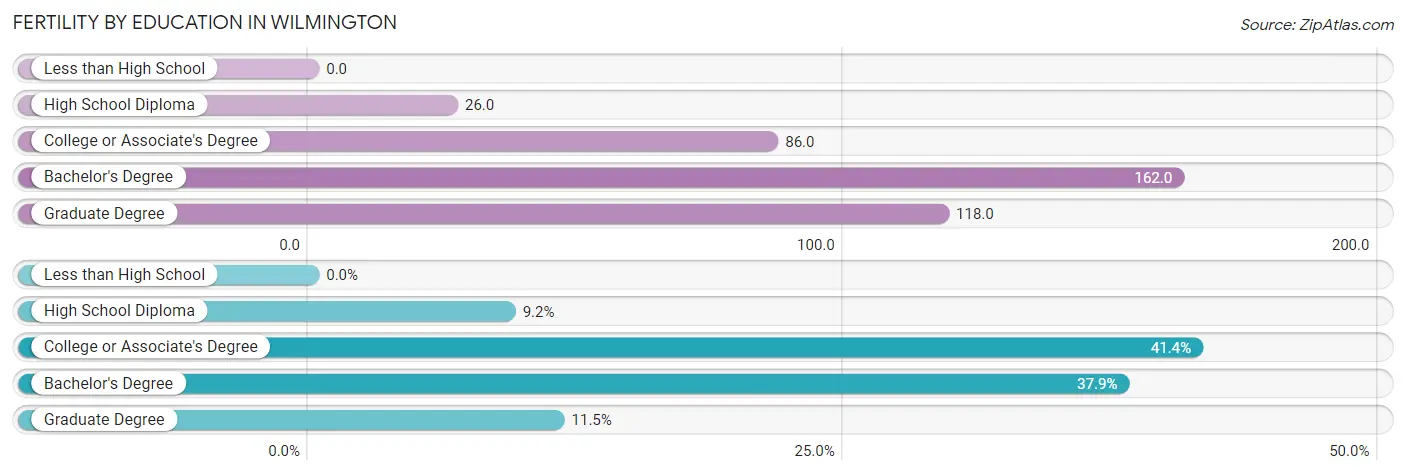
| Educational Attainment | Women with Births | Births / 1,000 Women |
| Less than High School | 0 (0.0%) | 0.0 |
| High School Diploma | 8 (9.2%) | 26.0 |
| College or Associate's Degree | 36 (41.4%) | 86.0 |
| Bachelor's Degree | 33 (37.9%) | 162.0 |
| Graduate Degree | 10 (11.5%) | 118.0 |
| Total | 87 (100.0%) | 76.0 |
Fertility by Education by Marriage Status in Wilmington
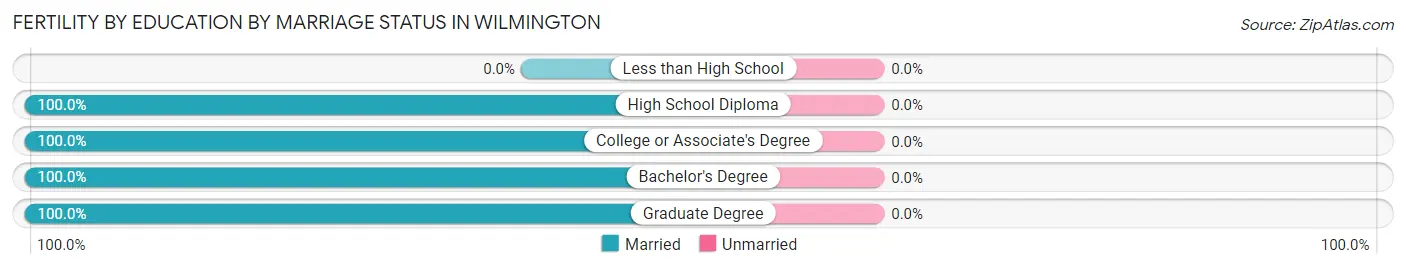
| Educational Attainment | Married | Unmarried |
| Less than High School | 0 (0.0%) | 0 (0.0%) |
| High School Diploma | 8 (100.0%) | 0 (0.0%) |
| College or Associate's Degree | 36 (100.0%) | 0 (0.0%) |
| Bachelor's Degree | 33 (100.0%) | 0 (0.0%) |
| Graduate Degree | 10 (100.0%) | 0 (0.0%) |
| Total | 87 (100.0%) | 0 (0.0%) |
Employment Characteristics in Wilmington
Employment by Class of Employer in Wilmington
Among the 2,826 employed individuals in Wilmington, private company employees (2,148 | 76.0%), local government employees (332 | 11.7%), and not-for-profit organizations (176 | 6.2%) make up the most common classes of employment.
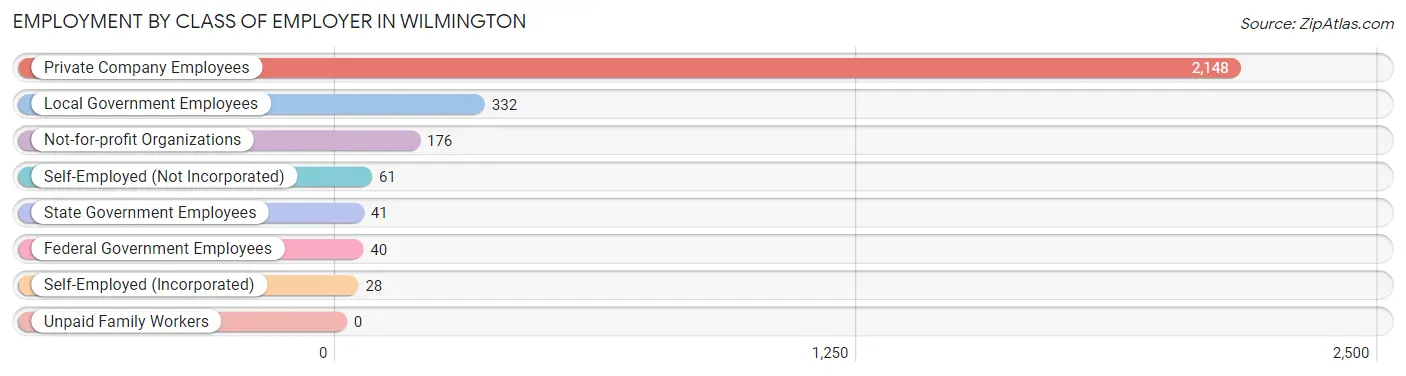
| Employer Class | # Employees | % Employees |
| Private Company Employees | 2,148 | 76.0% |
| Self-Employed (Incorporated) | 28 | 1.0% |
| Self-Employed (Not Incorporated) | 61 | 2.2% |
| Not-for-profit Organizations | 176 | 6.2% |
| Local Government Employees | 332 | 11.7% |
| State Government Employees | 41 | 1.5% |
| Federal Government Employees | 40 | 1.4% |
| Unpaid Family Workers | 0 | 0.0% |
| Total | 2,826 | 100.0% |
Employment Status by Age in Wilmington
According to the labor force statistics for Wilmington, out of the total population over 16 years of age (4,712), 63.9% or 3,011 individuals are in the labor force, with 4.2% or 126 of them unemployed. The age group with the highest labor force participation rate is 25 to 29 years, with 97.3% or 285 individuals in the labor force. Within the labor force, the 65 to 74 years age range has the highest percentage of unemployed individuals, with 19.0% or 28 of them being unemployed.
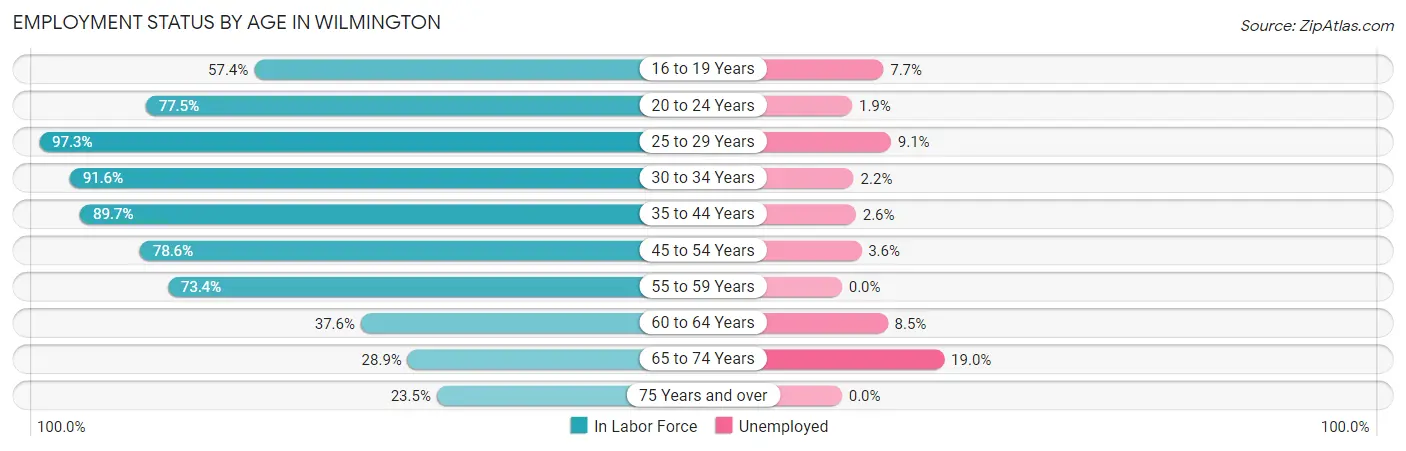
| Age Bracket | In Labor Force | Unemployed |
| 16 to 19 Years | 117 (57.4%) | 9 (7.7%) |
| 20 to 24 Years | 368 (77.5%) | 7 (1.9%) |
| 25 to 29 Years | 285 (97.3%) | 26 (9.1%) |
| 30 to 34 Years | 449 (91.6%) | 10 (2.2%) |
| 35 to 44 Years | 468 (89.7%) | 12 (2.6%) |
| 45 to 54 Years | 555 (78.6%) | 20 (3.6%) |
| 55 to 59 Years | 296 (73.4%) | 0 (0.0%) |
| 60 to 64 Years | 176 (37.6%) | 15 (8.5%) |
| 65 to 74 Years | 147 (28.9%) | 28 (19.0%) |
| 75 Years and over | 151 (23.5%) | 0 (0.0%) |
| Total | 3,011 (63.9%) | 126 (4.2%) |
Employment Status by Educational Attainment in Wilmington
According to labor force statistics for Wilmington, 77.3% of individuals (2,228) out of the total population between 25 and 64 years of age (2,882) are in the labor force, with 3.7% or 82 of them being unemployed. The group with the highest labor force participation rate are those with the educational attainment of high school diploma, with 81.6% or 889 individuals in the labor force. Within the labor force, individuals with bachelor's degree or higher education have the highest percentage of unemployment, with 8.7% or 45 of them being unemployed.
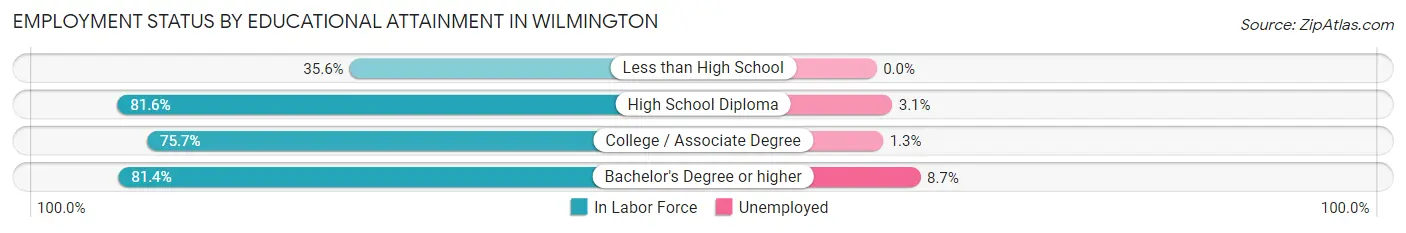
| Educational Attainment | In Labor Force | Unemployed |
| Less than High School | 47 (35.6%) | 0 (0.0%) |
| High School Diploma | 889 (81.6%) | 34 (3.1%) |
| College / Associate Degree | 777 (75.7%) | 13 (1.3%) |
| Bachelor's Degree or higher | 516 (81.4%) | 55 (8.7%) |
| Total | 2,228 (77.3%) | 107 (3.7%) |
Employment Occupations by Sex in Wilmington
Management, Business, Science and Arts Occupations
The most common Management, Business, Science and Arts occupations in Wilmington are Community & Social Service (304 | 10.5%), Management (242 | 8.4%), Education Instruction & Library (230 | 8.0%), Health Diagnosing & Treating (158 | 5.5%), and Business & Financial (119 | 4.1%).
Management, Business, Science and Arts Occupations by Sex
Within the Management, Business, Science and Arts occupations in Wilmington, the most male-oriented occupations are Computers & Mathematics (77.3%), Management (70.7%), and Computers, Engineering & Science (64.4%), while the most female-oriented occupations are Health Diagnosing & Treating (96.8%), Health Technologists (95.1%), and Education Instruction & Library (87.8%).
| Occupation | Male | Female |
| Management | 171 (70.7%) | 71 (29.3%) |
| Business & Financial | 47 (39.5%) | 72 (60.5%) |
| Computers, Engineering & Science | 38 (64.4%) | 21 (35.6%) |
| Computers & Mathematics | 34 (77.3%) | 10 (22.7%) |
| Architecture & Engineering | 0 (0.0%) | 0 (0.0%) |
| Life, Physical & Social Science | 4 (26.7%) | 11 (73.3%) |
| Community & Social Service | 56 (18.4%) | 248 (81.6%) |
| Education, Arts & Media | 11 (42.3%) | 15 (57.7%) |
| Legal Services & Support | 6 (35.3%) | 11 (64.7%) |
| Education Instruction & Library | 28 (12.2%) | 202 (87.8%) |
| Arts, Media & Entertainment | 11 (35.5%) | 20 (64.5%) |
| Health Diagnosing & Treating | 5 (3.2%) | 153 (96.8%) |
| Health Technologists | 5 (4.9%) | 97 (95.1%) |
| Total (Category) | 317 (35.9%) | 565 (64.1%) |
| Total (Overall) | 1,421 (49.2%) | 1,464 (50.7%) |
Services Occupations
The most common Services occupations in Wilmington are Food Preparation & Serving (220 | 7.6%), Healthcare Support (133 | 4.6%), Personal Care & Service (74 | 2.6%), Security & Protection (71 | 2.5%), and Cleaning & Maintenance (63 | 2.2%).
Services Occupations by Sex
Within the Services occupations in Wilmington, the most male-oriented occupations are Law Enforcement (100.0%), Security & Protection (88.7%), and Firefighting & Prevention (82.6%), while the most female-oriented occupations are Healthcare Support (100.0%), Personal Care & Service (91.9%), and Cleaning & Maintenance (55.6%).
| Occupation | Male | Female |
| Healthcare Support | 0 (0.0%) | 133 (100.0%) |
| Security & Protection | 63 (88.7%) | 8 (11.3%) |
| Firefighting & Prevention | 38 (82.6%) | 8 (17.4%) |
| Law Enforcement | 25 (100.0%) | 0 (0.0%) |
| Food Preparation & Serving | 106 (48.2%) | 114 (51.8%) |
| Cleaning & Maintenance | 28 (44.4%) | 35 (55.6%) |
| Personal Care & Service | 6 (8.1%) | 68 (91.9%) |
| Total (Category) | 203 (36.2%) | 358 (63.8%) |
| Total (Overall) | 1,421 (49.2%) | 1,464 (50.7%) |
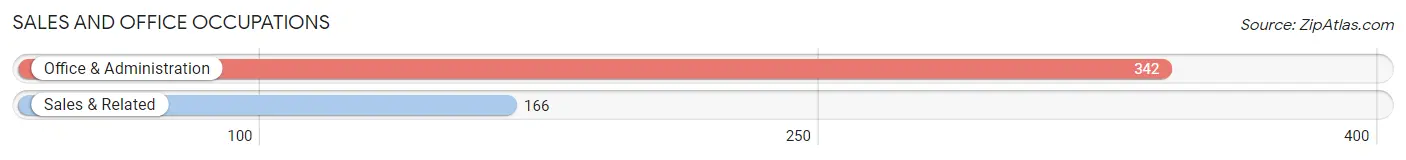
Sales and Office Occupations
The most common Sales and Office occupations in Wilmington are Office & Administration (342 | 11.8%), and Sales & Related (166 | 5.8%).
Sales and Office Occupations by Sex
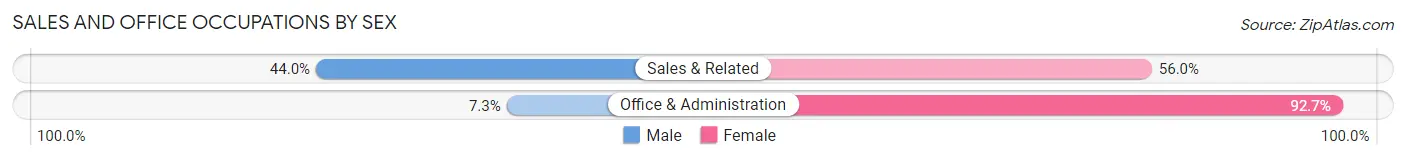
| Occupation | Male | Female |
| Sales & Related | 73 (44.0%) | 93 (56.0%) |
| Office & Administration | 25 (7.3%) | 317 (92.7%) |
| Total (Category) | 98 (19.3%) | 410 (80.7%) |
| Total (Overall) | 1,421 (49.2%) | 1,464 (50.7%) |
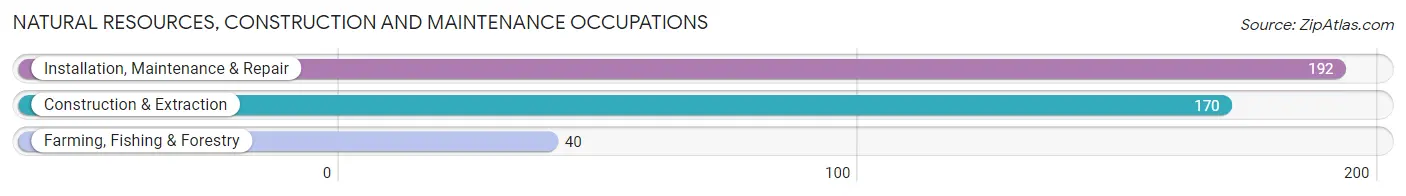
Natural Resources, Construction and Maintenance Occupations
The most common Natural Resources, Construction and Maintenance occupations in Wilmington are Installation, Maintenance & Repair (192 | 6.7%), Construction & Extraction (170 | 5.9%), and Farming, Fishing & Forestry (40 | 1.4%).
Natural Resources, Construction and Maintenance Occupations by Sex
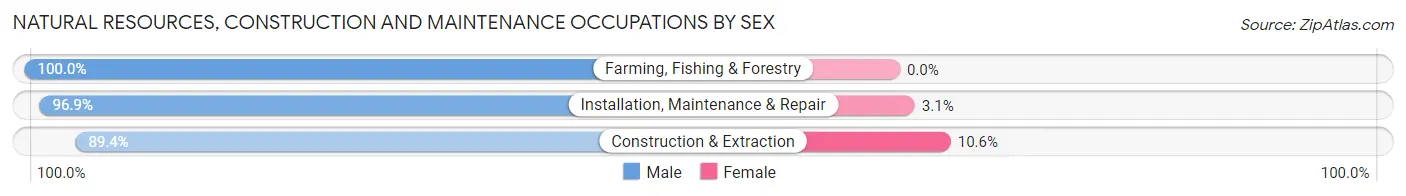
| Occupation | Male | Female |
| Farming, Fishing & Forestry | 40 (100.0%) | 0 (0.0%) |
| Construction & Extraction | 152 (89.4%) | 18 (10.6%) |
| Installation, Maintenance & Repair | 186 (96.9%) | 6 (3.1%) |
| Total (Category) | 378 (94.0%) | 24 (6.0%) |
| Total (Overall) | 1,421 (49.2%) | 1,464 (50.7%) |
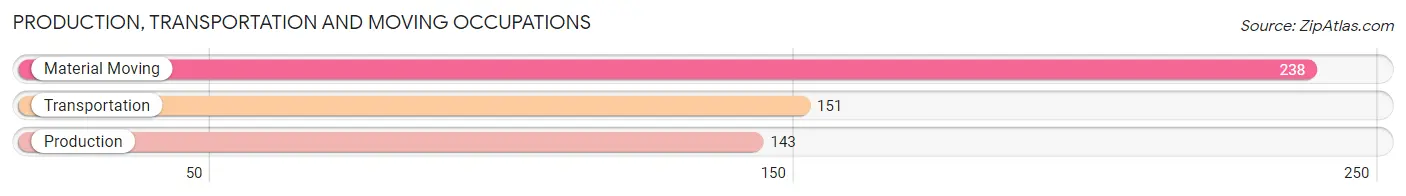
Production, Transportation and Moving Occupations
The most common Production, Transportation and Moving occupations in Wilmington are Material Moving (238 | 8.3%), Transportation (151 | 5.2%), and Production (143 | 5.0%).
Production, Transportation and Moving Occupations by Sex
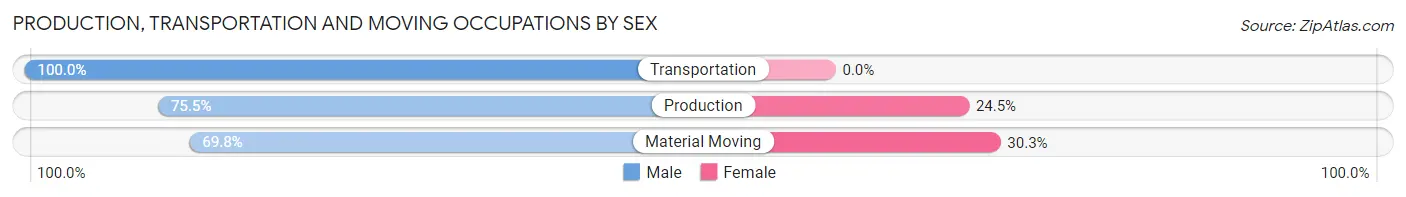
| Occupation | Male | Female |
| Production | 108 (75.5%) | 35 (24.5%) |
| Transportation | 151 (100.0%) | 0 (0.0%) |
| Material Moving | 166 (69.8%) | 72 (30.2%) |
| Total (Category) | 425 (79.9%) | 107 (20.1%) |
| Total (Overall) | 1,421 (49.2%) | 1,464 (50.7%) |
Employment Industries by Sex in Wilmington
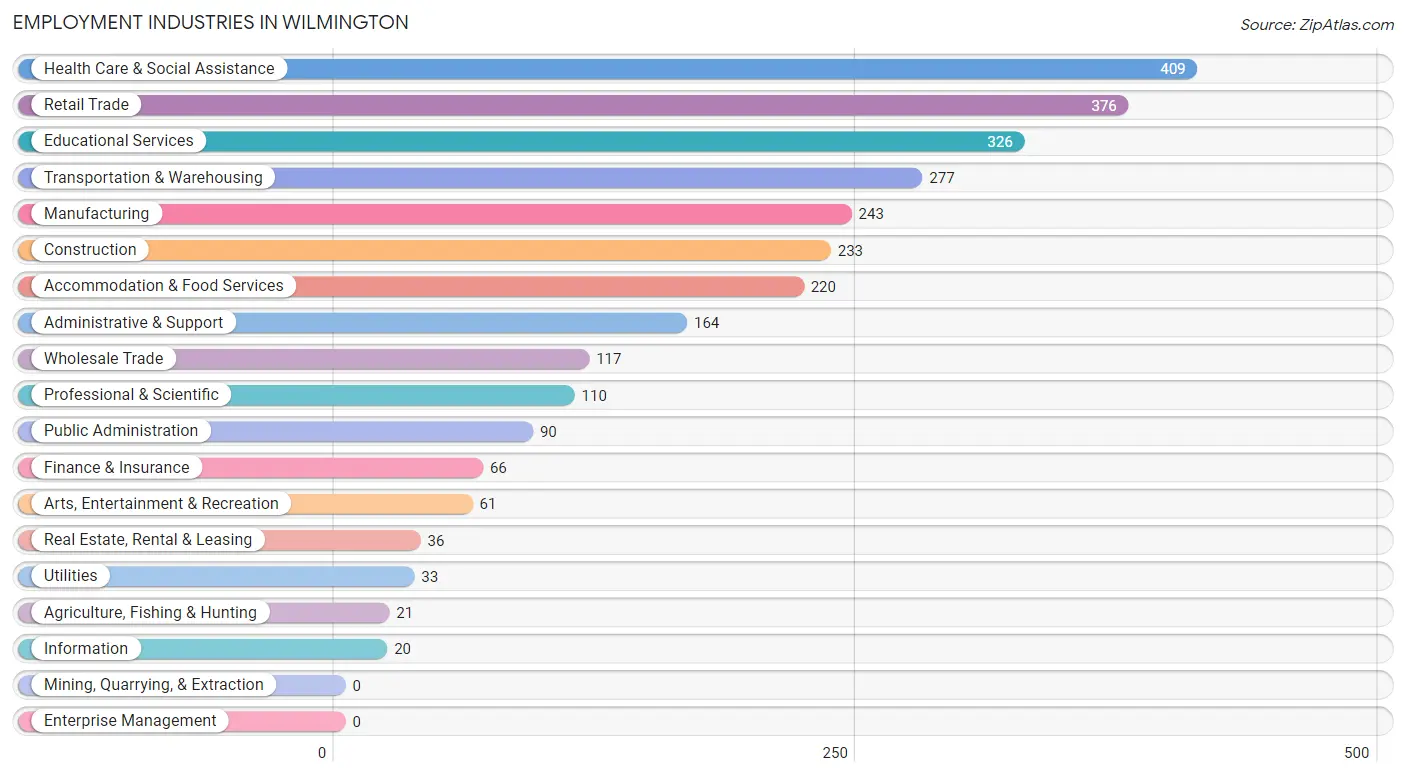
Employment Industries in Wilmington
The major employment industries in Wilmington include Health Care & Social Assistance (409 | 14.2%), Retail Trade (376 | 13.0%), Educational Services (326 | 11.3%), Transportation & Warehousing (277 | 9.6%), and Manufacturing (243 | 8.4%).
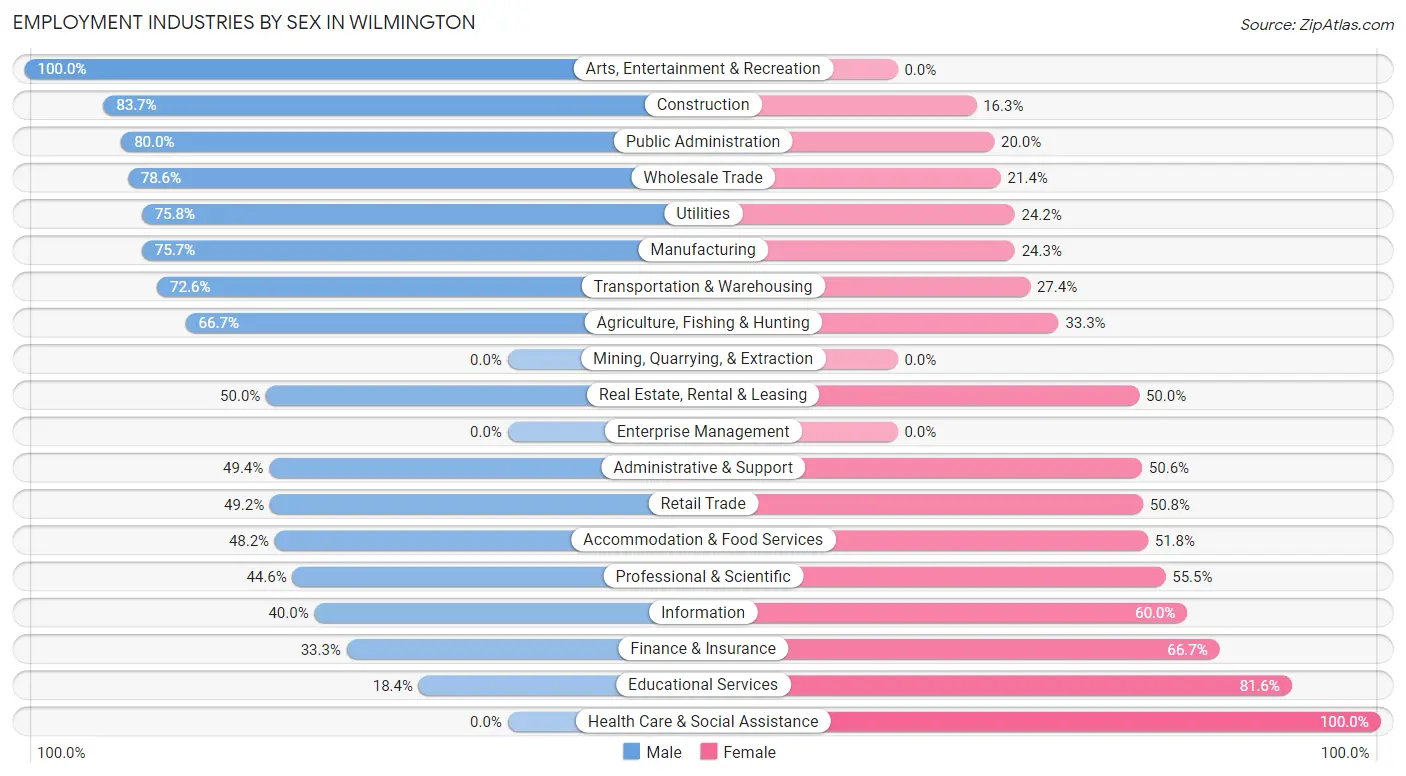
Employment Industries by Sex in Wilmington
The Wilmington industries that see more men than women are Arts, Entertainment & Recreation (100.0%), Construction (83.7%), and Public Administration (80.0%), whereas the industries that tend to have a higher number of women are Health Care & Social Assistance (100.0%), Educational Services (81.6%), and Finance & Insurance (66.7%).
| Industry | Male | Female |
| Agriculture, Fishing & Hunting | 14 (66.7%) | 7 (33.3%) |
| Mining, Quarrying, & Extraction | 0 (0.0%) | 0 (0.0%) |
| Construction | 195 (83.7%) | 38 (16.3%) |
| Manufacturing | 184 (75.7%) | 59 (24.3%) |
| Wholesale Trade | 92 (78.6%) | 25 (21.4%) |
| Retail Trade | 185 (49.2%) | 191 (50.8%) |
| Transportation & Warehousing | 201 (72.6%) | 76 (27.4%) |
| Utilities | 25 (75.8%) | 8 (24.2%) |
| Information | 8 (40.0%) | 12 (60.0%) |
| Finance & Insurance | 22 (33.3%) | 44 (66.7%) |
| Real Estate, Rental & Leasing | 18 (50.0%) | 18 (50.0%) |
| Professional & Scientific | 49 (44.6%) | 61 (55.4%) |
| Enterprise Management | 0 (0.0%) | 0 (0.0%) |
| Administrative & Support | 81 (49.4%) | 83 (50.6%) |
| Educational Services | 60 (18.4%) | 266 (81.6%) |
| Health Care & Social Assistance | 0 (0.0%) | 409 (100.0%) |
| Arts, Entertainment & Recreation | 61 (100.0%) | 0 (0.0%) |
| Accommodation & Food Services | 106 (48.2%) | 114 (51.8%) |
| Public Administration | 72 (80.0%) | 18 (20.0%) |
| Total | 1,421 (49.2%) | 1,464 (50.7%) |
Education in Wilmington
School Enrollment in Wilmington
The most common levels of schooling among the 927 students in Wilmington are college / undergraduate (221 | 23.8%), high school (219 | 23.6%), and middle school (190 | 20.5%).

| School Level | # Students | % Students |
| Nursery / Preschool | 63 | 6.8% |
| Kindergarten | 37 | 4.0% |
| Elementary School | 128 | 13.8% |
| Middle School | 190 | 20.5% |
| High School | 219 | 23.6% |
| College / Undergraduate | 221 | 23.8% |
| Graduate / Professional | 69 | 7.4% |
| Total | 927 | 100.0% |
School Enrollment by Age by Funding Source in Wilmington
Out of a total of 927 students who are enrolled in schools in Wilmington, 35 (3.8%) attend a private institution, while the remaining 892 (96.2%) are enrolled in public schools. The age group of 25 to 34 year olds has the highest likelihood of being enrolled in private schools, with 5 (14.3% in the age bracket) enrolled. Conversely, the age group of 10 to 14 year olds has the lowest likelihood of being enrolled in a private school, with 229 (100.0% in the age bracket) attending a public institution.
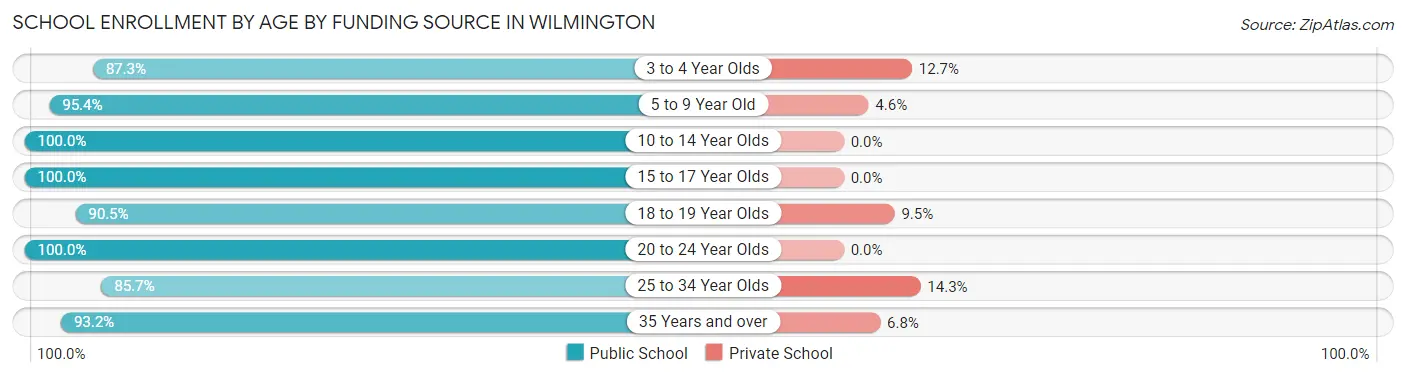
| Age Bracket | Public School | Private School |
| 3 to 4 Year Olds | 55 (87.3%) | 8 (12.7%) |
| 5 to 9 Year Old | 145 (95.4%) | 7 (4.6%) |
| 10 to 14 Year Olds | 229 (100.0%) | 0 (0.0%) |
| 15 to 17 Year Olds | 143 (100.0%) | 0 (0.0%) |
| 18 to 19 Year Olds | 67 (90.5%) | 7 (9.5%) |
| 20 to 24 Year Olds | 113 (100.0%) | 0 (0.0%) |
| 25 to 34 Year Olds | 30 (85.7%) | 5 (14.3%) |
| 35 Years and over | 110 (93.2%) | 8 (6.8%) |
| Total | 892 (96.2%) | 35 (3.8%) |
Educational Attainment by Field of Study in Wilmington
Education (147 | 17.0%), business (141 | 16.3%), science & technology (100 | 11.6%), arts & humanities (75 | 8.7%), and bio, nature & agricultural (74 | 8.6%) are the most common fields of study among 863 individuals in Wilmington who have obtained a bachelor's degree or higher.
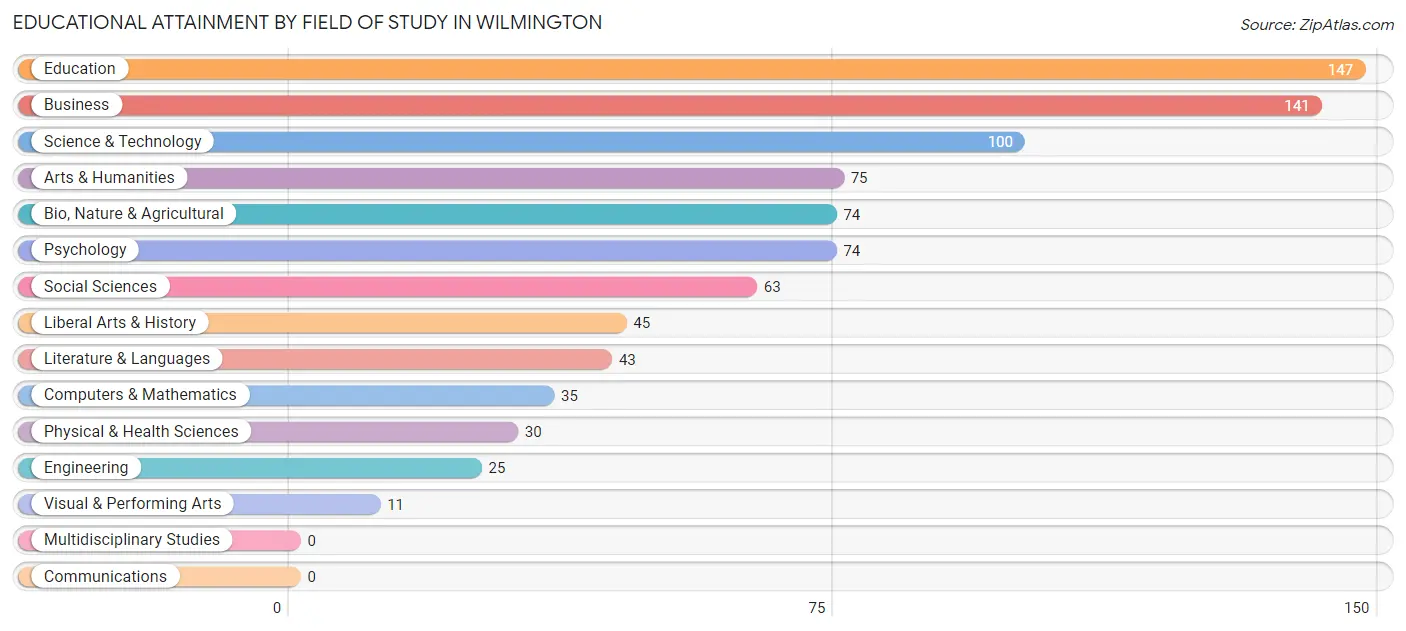
| Field of Study | # Graduates | % Graduates |
| Computers & Mathematics | 35 | 4.1% |
| Bio, Nature & Agricultural | 74 | 8.6% |
| Physical & Health Sciences | 30 | 3.5% |
| Psychology | 74 | 8.6% |
| Social Sciences | 63 | 7.3% |
| Engineering | 25 | 2.9% |
| Multidisciplinary Studies | 0 | 0.0% |
| Science & Technology | 100 | 11.6% |
| Business | 141 | 16.3% |
| Education | 147 | 17.0% |
| Literature & Languages | 43 | 5.0% |
| Liberal Arts & History | 45 | 5.2% |
| Visual & Performing Arts | 11 | 1.3% |
| Communications | 0 | 0.0% |
| Arts & Humanities | 75 | 8.7% |
| Total | 863 | 100.0% |
Transportation & Commute in Wilmington
Vehicle Availability by Sex in Wilmington
The most prevalent vehicle ownership categories in Wilmington are males with 2 vehicles (617, accounting for 44.7%) and females with 2 vehicles (499, making up 42.8%).
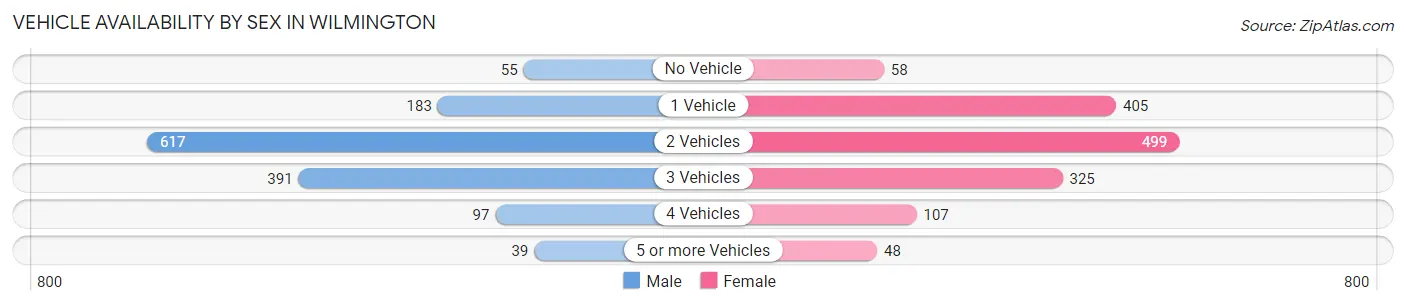
| Vehicles Available | Male | Female |
| No Vehicle | 55 (4.0%) | 58 (4.0%) |
| 1 Vehicle | 183 (13.2%) | 405 (28.1%) |
| 2 Vehicles | 617 (44.7%) | 499 (34.6%) |
| 3 Vehicles | 391 (28.3%) | 325 (22.5%) |
| 4 Vehicles | 97 (7.0%) | 107 (7.4%) |
| 5 or more Vehicles | 39 (2.8%) | 48 (3.3%) |
| Total | 1,382 (100.0%) | 1,442 (100.0%) |
Commute Time in Wilmington
The most frequently occuring commute durations in Wilmington are 5 to 9 minutes (415 commuters, 15.7%), 30 to 34 minutes (358 commuters, 13.5%), and 10 to 14 minutes (348 commuters, 13.2%).
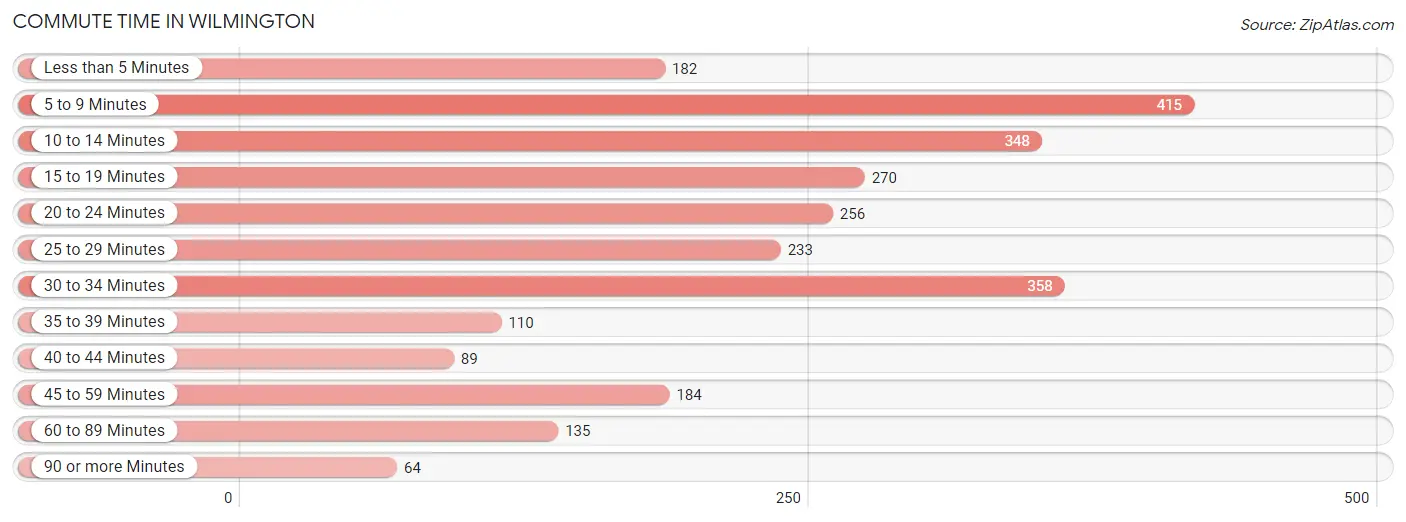
| Commute Time | # Commuters | % Commuters |
| Less than 5 Minutes | 182 | 6.9% |
| 5 to 9 Minutes | 415 | 15.7% |
| 10 to 14 Minutes | 348 | 13.2% |
| 15 to 19 Minutes | 270 | 10.2% |
| 20 to 24 Minutes | 256 | 9.7% |
| 25 to 29 Minutes | 233 | 8.8% |
| 30 to 34 Minutes | 358 | 13.5% |
| 35 to 39 Minutes | 110 | 4.2% |
| 40 to 44 Minutes | 89 | 3.4% |
| 45 to 59 Minutes | 184 | 7.0% |
| 60 to 89 Minutes | 135 | 5.1% |
| 90 or more Minutes | 64 | 2.4% |
Commute Time by Sex in Wilmington
The most common commute times in Wilmington are 10 to 14 minutes (252 commuters, 19.2%) for males and 30 to 34 minutes (277 commuters, 20.8%) for females.
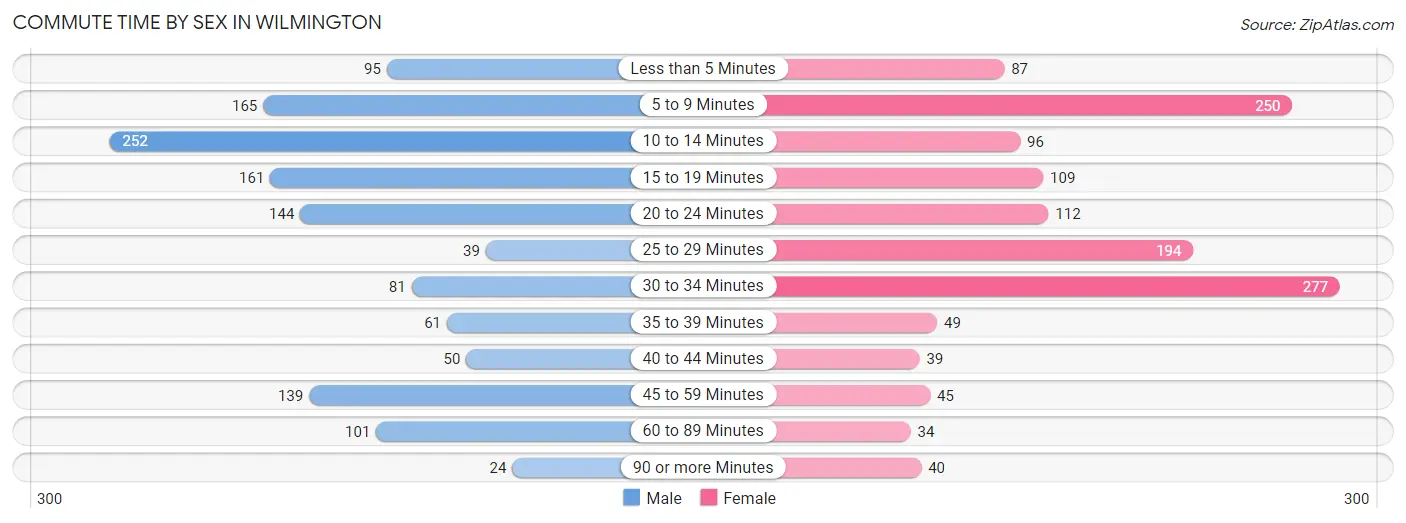
| Commute Time | Male | Female |
| Less than 5 Minutes | 95 (7.2%) | 87 (6.5%) |
| 5 to 9 Minutes | 165 (12.6%) | 250 (18.8%) |
| 10 to 14 Minutes | 252 (19.2%) | 96 (7.2%) |
| 15 to 19 Minutes | 161 (12.3%) | 109 (8.2%) |
| 20 to 24 Minutes | 144 (11.0%) | 112 (8.4%) |
| 25 to 29 Minutes | 39 (3.0%) | 194 (14.6%) |
| 30 to 34 Minutes | 81 (6.2%) | 277 (20.8%) |
| 35 to 39 Minutes | 61 (4.6%) | 49 (3.7%) |
| 40 to 44 Minutes | 50 (3.8%) | 39 (2.9%) |
| 45 to 59 Minutes | 139 (10.6%) | 45 (3.4%) |
| 60 to 89 Minutes | 101 (7.7%) | 34 (2.5%) |
| 90 or more Minutes | 24 (1.8%) | 40 (3.0%) |
Time of Departure to Work by Sex in Wilmington
The most frequent times of departure to work in Wilmington are 5:30 AM to 5:59 AM (166, 12.7%) for males and 7:00 AM to 7:29 AM (264, 19.8%) for females.
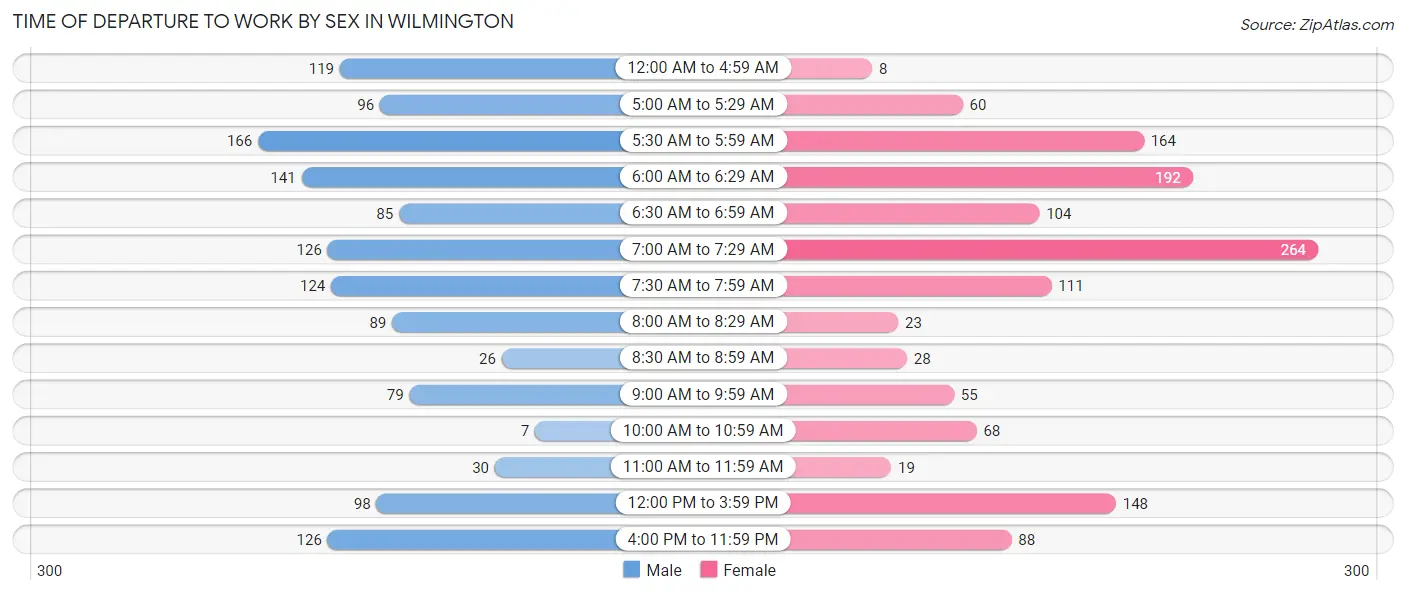
| Time of Departure | Male | Female |
| 12:00 AM to 4:59 AM | 119 (9.1%) | 8 (0.6%) |
| 5:00 AM to 5:29 AM | 96 (7.3%) | 60 (4.5%) |
| 5:30 AM to 5:59 AM | 166 (12.7%) | 164 (12.3%) |
| 6:00 AM to 6:29 AM | 141 (10.7%) | 192 (14.4%) |
| 6:30 AM to 6:59 AM | 85 (6.5%) | 104 (7.8%) |
| 7:00 AM to 7:29 AM | 126 (9.6%) | 264 (19.8%) |
| 7:30 AM to 7:59 AM | 124 (9.5%) | 111 (8.3%) |
| 8:00 AM to 8:29 AM | 89 (6.8%) | 23 (1.7%) |
| 8:30 AM to 8:59 AM | 26 (2.0%) | 28 (2.1%) |
| 9:00 AM to 9:59 AM | 79 (6.0%) | 55 (4.1%) |
| 10:00 AM to 10:59 AM | 7 (0.5%) | 68 (5.1%) |
| 11:00 AM to 11:59 AM | 30 (2.3%) | 19 (1.4%) |
| 12:00 PM to 3:59 PM | 98 (7.5%) | 148 (11.1%) |
| 4:00 PM to 11:59 PM | 126 (9.6%) | 88 (6.6%) |
| Total | 1,312 (100.0%) | 1,332 (100.0%) |
Housing Occupancy in Wilmington
Occupancy by Ownership in Wilmington
Of the total 2,330 dwellings in Wilmington, owner-occupied units account for 1,474 (63.3%), while renter-occupied units make up 856 (36.7%).
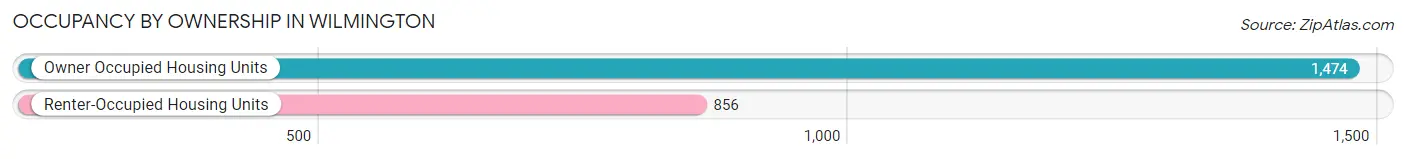
| Occupancy | # Housing Units | % Housing Units |
| Owner Occupied Housing Units | 1,474 | 63.3% |
| Renter-Occupied Housing Units | 856 | 36.7% |
| Total Occupied Housing Units | 2,330 | 100.0% |
Occupancy by Household Size in Wilmington
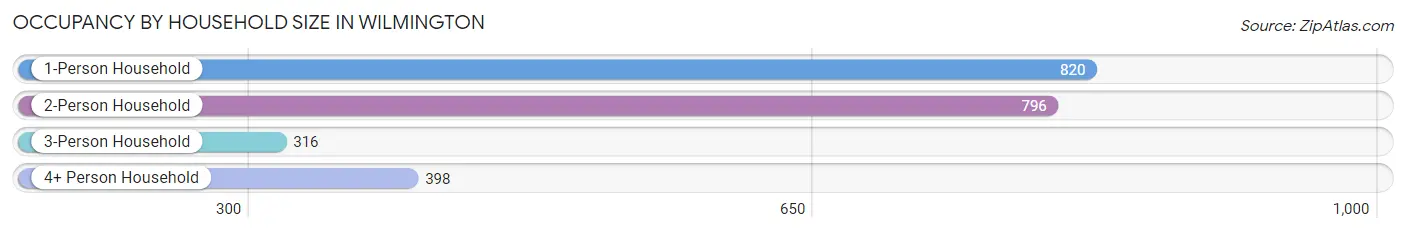
| Household Size | # Housing Units | % Housing Units |
| 1-Person Household | 820 | 35.2% |
| 2-Person Household | 796 | 34.2% |
| 3-Person Household | 316 | 13.6% |
| 4+ Person Household | 398 | 17.1% |
| Total Housing Units | 2,330 | 100.0% |
Occupancy by Ownership by Household Size in Wilmington
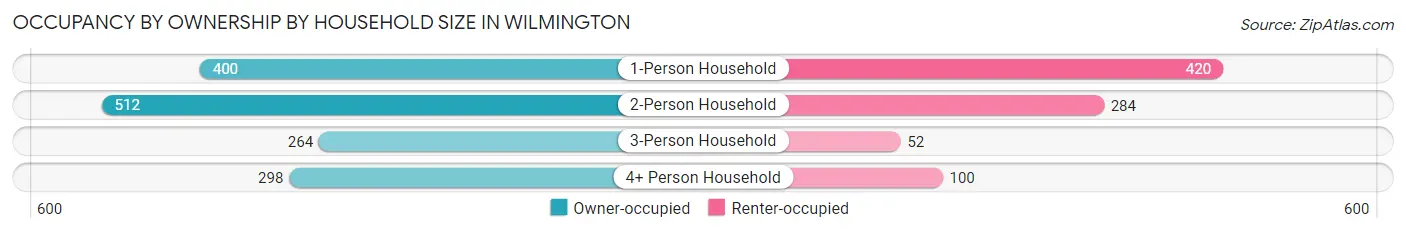
| Household Size | Owner-occupied | Renter-occupied |
| 1-Person Household | 400 (48.8%) | 420 (51.2%) |
| 2-Person Household | 512 (64.3%) | 284 (35.7%) |
| 3-Person Household | 264 (83.5%) | 52 (16.5%) |
| 4+ Person Household | 298 (74.9%) | 100 (25.1%) |
| Total Housing Units | 1,474 (63.3%) | 856 (36.7%) |
Occupancy by Educational Attainment in Wilmington
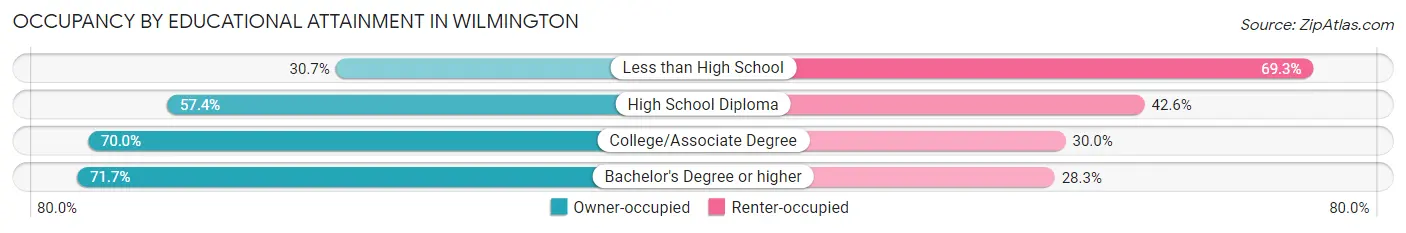
| Household Size | Owner-occupied | Renter-occupied |
| Less than High School | 46 (30.7%) | 104 (69.3%) |
| High School Diploma | 480 (57.4%) | 356 (42.6%) |
| College/Associate Degree | 624 (70.0%) | 268 (30.0%) |
| Bachelor's Degree or higher | 324 (71.7%) | 128 (28.3%) |
Occupancy by Age of Householder in Wilmington
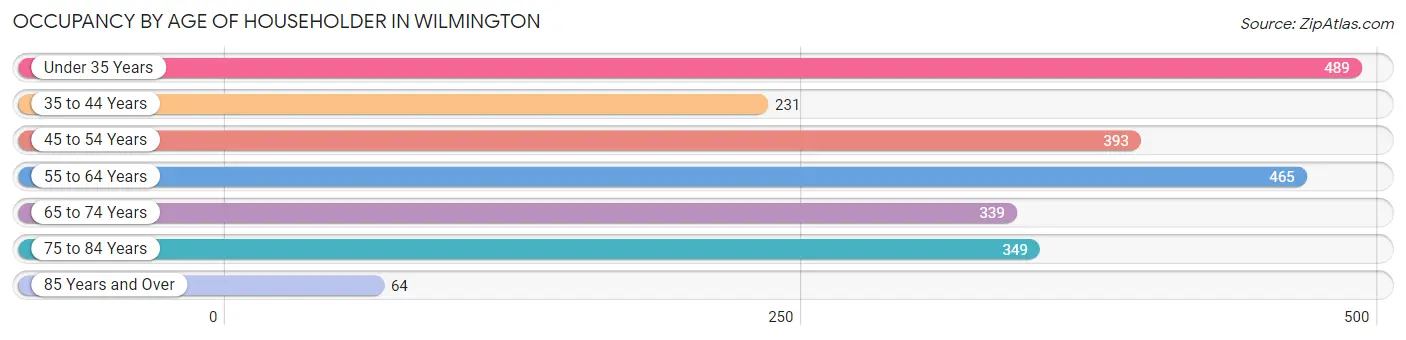
| Age Bracket | # Households | % Households |
| Under 35 Years | 489 | 21.0% |
| 35 to 44 Years | 231 | 9.9% |
| 45 to 54 Years | 393 | 16.9% |
| 55 to 64 Years | 465 | 20.0% |
| 65 to 74 Years | 339 | 14.5% |
| 75 to 84 Years | 349 | 15.0% |
| 85 Years and Over | 64 | 2.8% |
| Total | 2,330 | 100.0% |
Housing Finances in Wilmington
Median Income by Occupancy in Wilmington
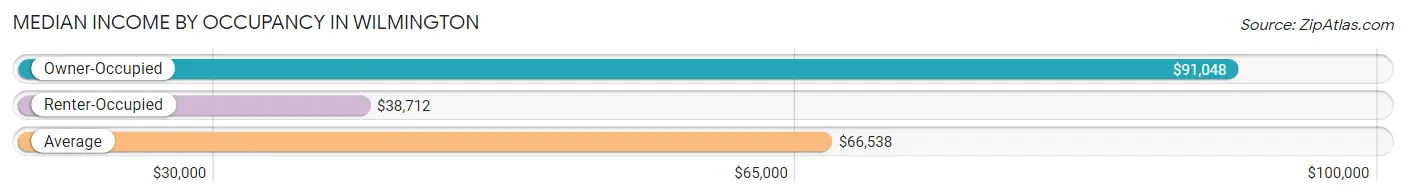
| Occupancy Type | # Households | Median Income |
| Owner-Occupied | 1,474 (63.3%) | $91,048 |
| Renter-Occupied | 856 (36.7%) | $38,712 |
| Average | 2,330 (100.0%) | $66,538 |
Occupancy by Householder Income Bracket in Wilmington
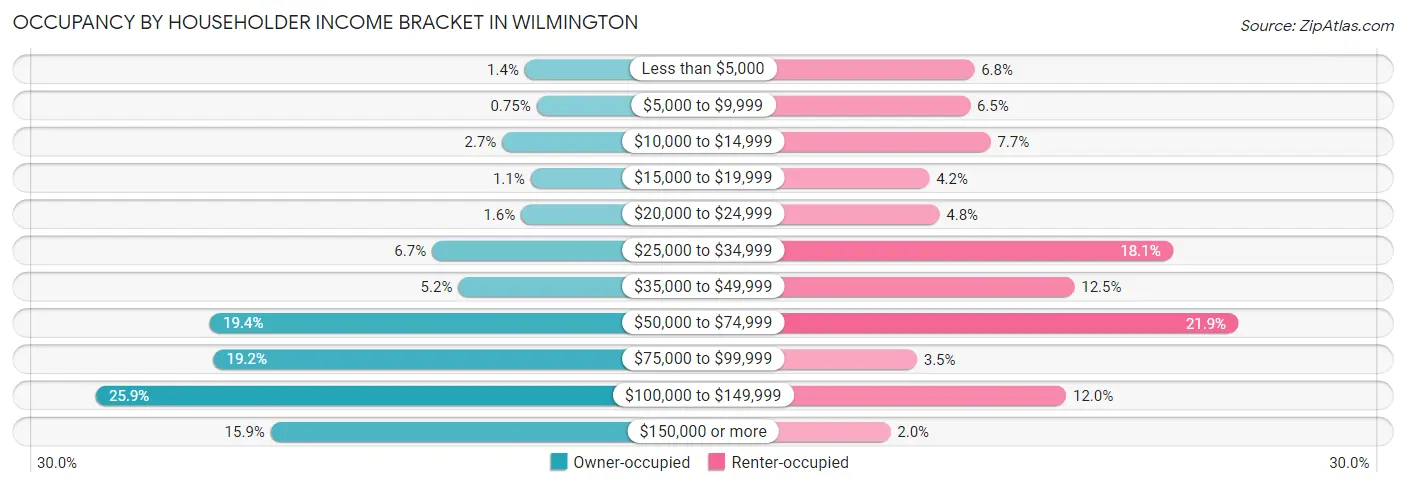
| Income Bracket | Owner-occupied | Renter-occupied |
| Less than $5,000 | 21 (1.4%) | 58 (6.8%) |
| $5,000 to $9,999 | 11 (0.7%) | 56 (6.5%) |
| $10,000 to $14,999 | 40 (2.7%) | 66 (7.7%) |
| $15,000 to $19,999 | 16 (1.1%) | 36 (4.2%) |
| $20,000 to $24,999 | 24 (1.6%) | 41 (4.8%) |
| $25,000 to $34,999 | 99 (6.7%) | 155 (18.1%) |
| $35,000 to $49,999 | 77 (5.2%) | 107 (12.5%) |
| $50,000 to $74,999 | 286 (19.4%) | 187 (21.8%) |
| $75,000 to $99,999 | 283 (19.2%) | 30 (3.5%) |
| $100,000 to $149,999 | 382 (25.9%) | 103 (12.0%) |
| $150,000 or more | 235 (15.9%) | 17 (2.0%) |
| Total | 1,474 (100.0%) | 856 (100.0%) |
Monthly Housing Cost Tiers in Wilmington
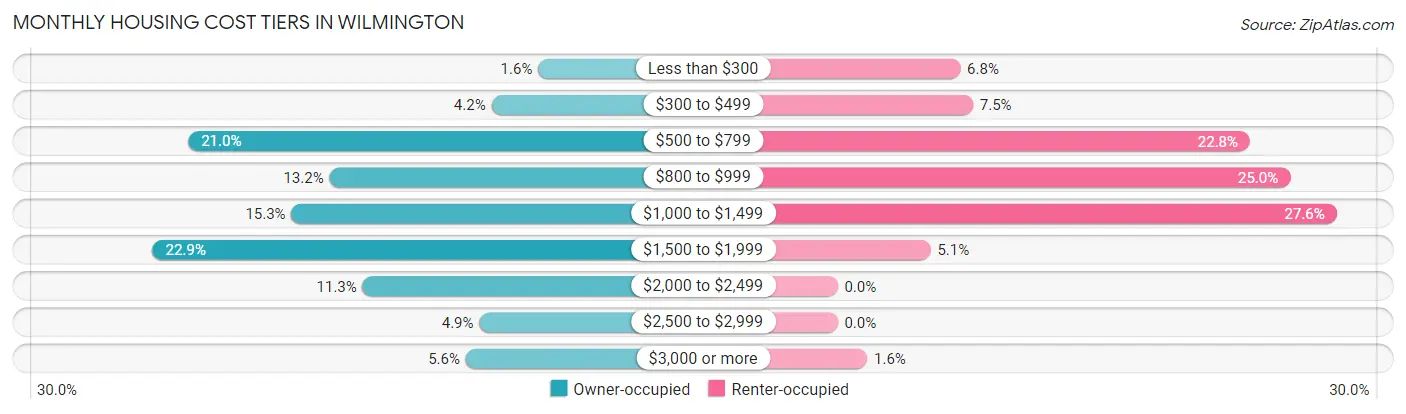
| Monthly Cost | Owner-occupied | Renter-occupied |
| Less than $300 | 24 (1.6%) | 58 (6.8%) |
| $300 to $499 | 62 (4.2%) | 64 (7.5%) |
| $500 to $799 | 309 (21.0%) | 195 (22.8%) |
| $800 to $999 | 194 (13.2%) | 214 (25.0%) |
| $1,000 to $1,499 | 225 (15.3%) | 236 (27.6%) |
| $1,500 to $1,999 | 338 (22.9%) | 44 (5.1%) |
| $2,000 to $2,499 | 167 (11.3%) | 0 (0.0%) |
| $2,500 to $2,999 | 72 (4.9%) | 0 (0.0%) |
| $3,000 or more | 83 (5.6%) | 14 (1.6%) |
| Total | 1,474 (100.0%) | 856 (100.0%) |
Physical Housing Characteristics in Wilmington
Housing Structures in Wilmington
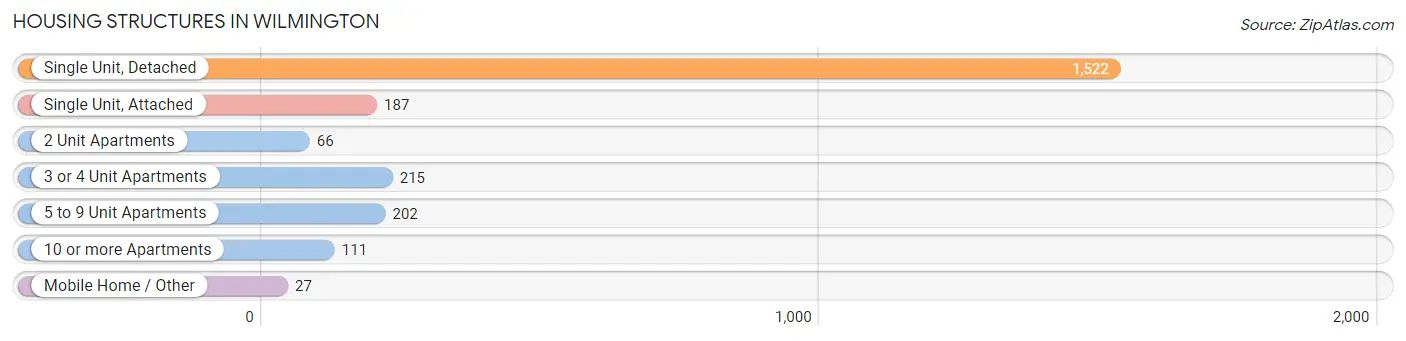
| Structure Type | # Housing Units | % Housing Units |
| Single Unit, Detached | 1,522 | 65.3% |
| Single Unit, Attached | 187 | 8.0% |
| 2 Unit Apartments | 66 | 2.8% |
| 3 or 4 Unit Apartments | 215 | 9.2% |
| 5 to 9 Unit Apartments | 202 | 8.7% |
| 10 or more Apartments | 111 | 4.8% |
| Mobile Home / Other | 27 | 1.2% |
| Total | 2,330 | 100.0% |
Housing Structures by Occupancy in Wilmington
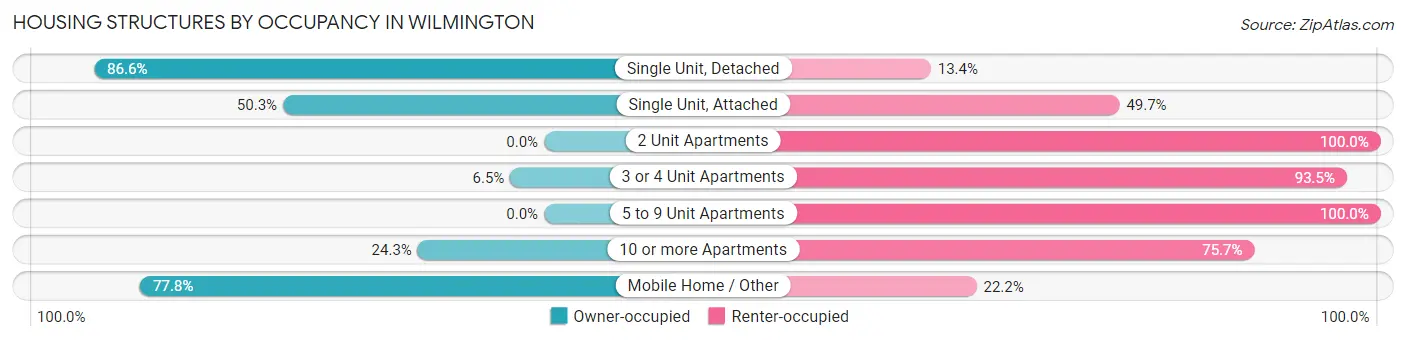
| Structure Type | Owner-occupied | Renter-occupied |
| Single Unit, Detached | 1,318 (86.6%) | 204 (13.4%) |
| Single Unit, Attached | 94 (50.3%) | 93 (49.7%) |
| 2 Unit Apartments | 0 (0.0%) | 66 (100.0%) |
| 3 or 4 Unit Apartments | 14 (6.5%) | 201 (93.5%) |
| 5 to 9 Unit Apartments | 0 (0.0%) | 202 (100.0%) |
| 10 or more Apartments | 27 (24.3%) | 84 (75.7%) |
| Mobile Home / Other | 21 (77.8%) | 6 (22.2%) |
| Total | 1,474 (63.3%) | 856 (36.7%) |
Housing Structures by Number of Rooms in Wilmington
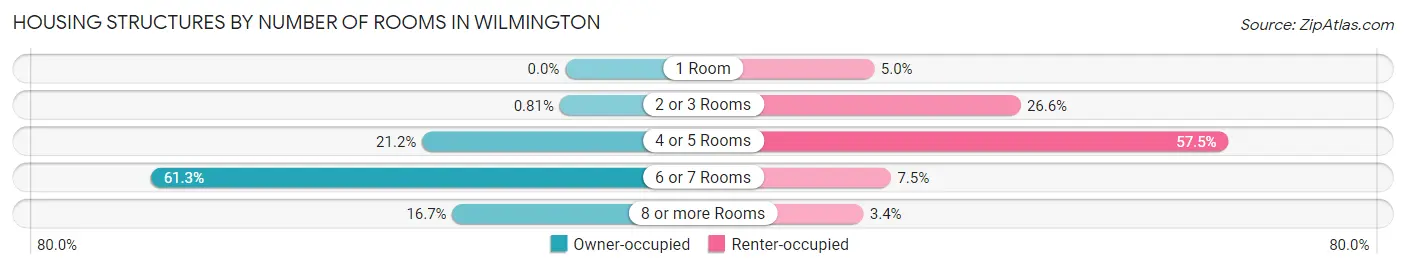
| Number of Rooms | Owner-occupied | Renter-occupied |
| 1 Room | 0 (0.0%) | 43 (5.0%) |
| 2 or 3 Rooms | 12 (0.8%) | 228 (26.6%) |
| 4 or 5 Rooms | 312 (21.2%) | 492 (57.5%) |
| 6 or 7 Rooms | 904 (61.3%) | 64 (7.5%) |
| 8 or more Rooms | 246 (16.7%) | 29 (3.4%) |
| Total | 1,474 (100.0%) | 856 (100.0%) |
Housing Structure by Heating Type in Wilmington
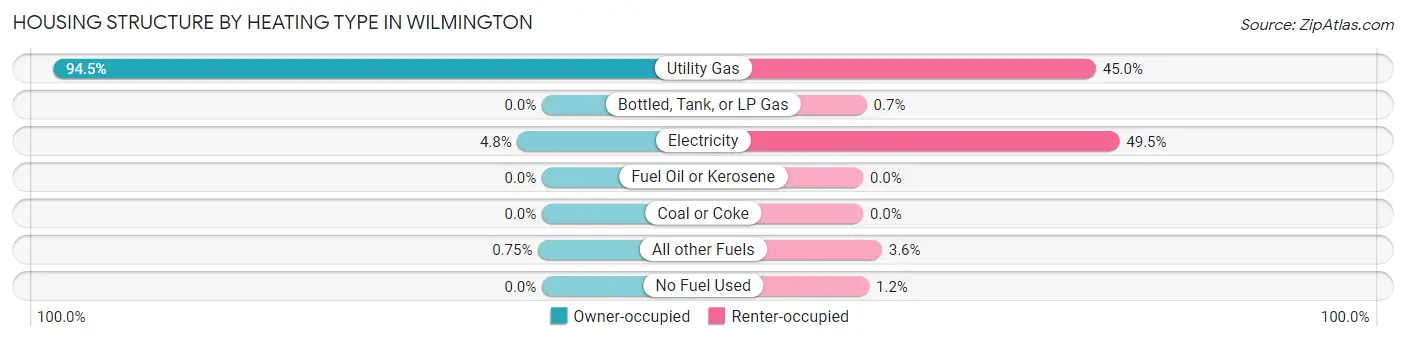
| Heating Type | Owner-occupied | Renter-occupied |
| Utility Gas | 1,393 (94.5%) | 385 (45.0%) |
| Bottled, Tank, or LP Gas | 0 (0.0%) | 6 (0.7%) |
| Electricity | 70 (4.8%) | 424 (49.5%) |
| Fuel Oil or Kerosene | 0 (0.0%) | 0 (0.0%) |
| Coal or Coke | 0 (0.0%) | 0 (0.0%) |
| All other Fuels | 11 (0.7%) | 31 (3.6%) |
| No Fuel Used | 0 (0.0%) | 10 (1.2%) |
| Total | 1,474 (100.0%) | 856 (100.0%) |
Household Vehicle Usage in Wilmington
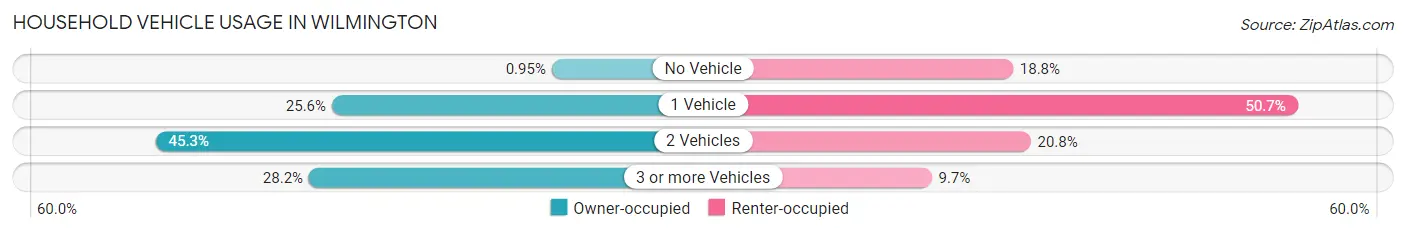
| Vehicles per Household | Owner-occupied | Renter-occupied |
| No Vehicle | 14 (0.9%) | 161 (18.8%) |
| 1 Vehicle | 377 (25.6%) | 434 (50.7%) |
| 2 Vehicles | 668 (45.3%) | 178 (20.8%) |
| 3 or more Vehicles | 415 (28.1%) | 83 (9.7%) |
| Total | 1,474 (100.0%) | 856 (100.0%) |
Real Estate & Mortgages in Wilmington
Real Estate and Mortgage Overview in Wilmington
| Characteristic | Without Mortgage | With Mortgage |
| Housing Units | 581 | 893 |
| Median Property Value | $178,400 | $207,400 |
| Median Household Income | $51,776 | $186 |
| Monthly Housing Costs | $691 | $83 |
| Real Estate Taxes | $3,408 | $15 |
Property Value by Mortgage Status in Wilmington
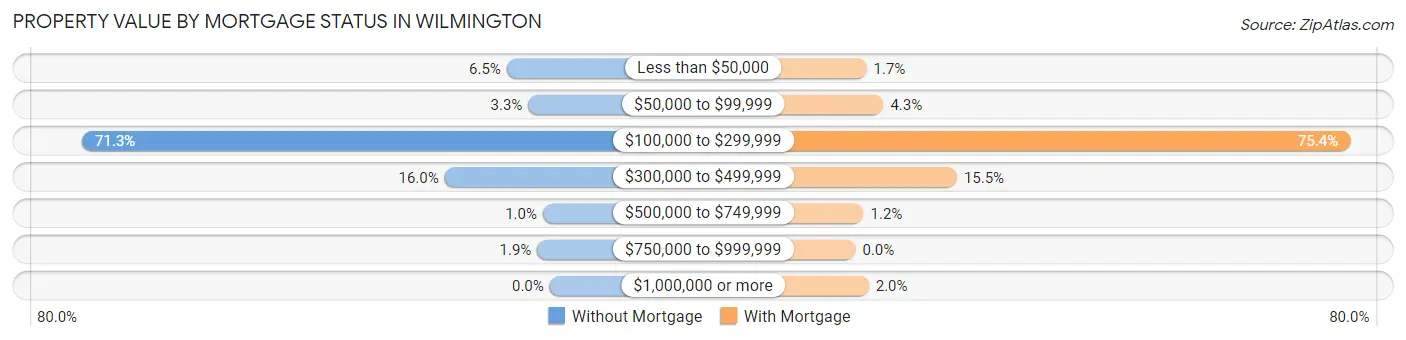
| Property Value | Without Mortgage | With Mortgage |
| Less than $50,000 | 38 (6.5%) | 15 (1.7%) |
| $50,000 to $99,999 | 19 (3.3%) | 38 (4.3%) |
| $100,000 to $299,999 | 414 (71.3%) | 673 (75.4%) |
| $300,000 to $499,999 | 93 (16.0%) | 138 (15.4%) |
| $500,000 to $749,999 | 6 (1.0%) | 11 (1.2%) |
| $750,000 to $999,999 | 11 (1.9%) | 0 (0.0%) |
| $1,000,000 or more | 0 (0.0%) | 18 (2.0%) |
| Total | 581 (100.0%) | 893 (100.0%) |
Household Income by Mortgage Status in Wilmington
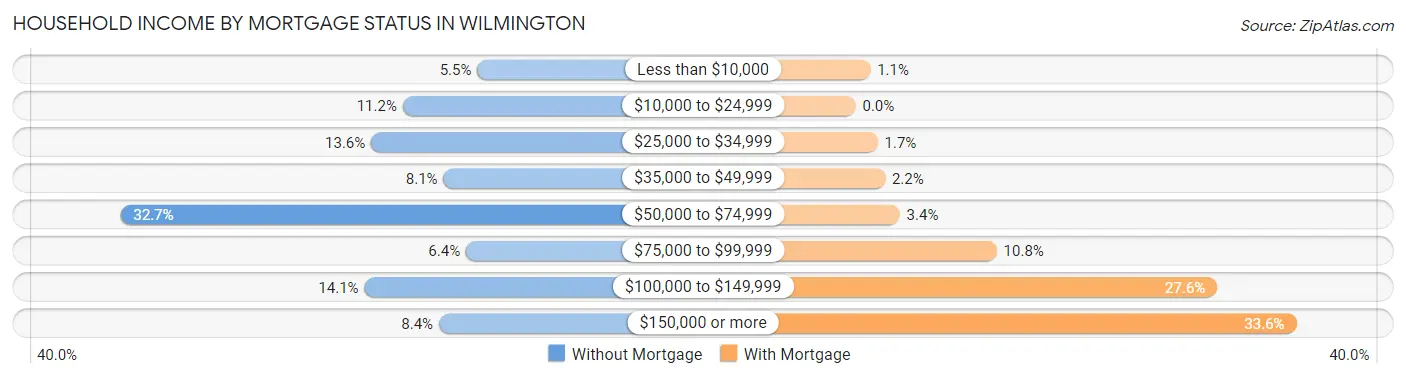
| Household Income | Without Mortgage | With Mortgage |
| Less than $10,000 | 32 (5.5%) | 10 (1.1%) |
| $10,000 to $24,999 | 65 (11.2%) | 0 (0.0%) |
| $25,000 to $34,999 | 79 (13.6%) | 15 (1.7%) |
| $35,000 to $49,999 | 47 (8.1%) | 20 (2.2%) |
| $50,000 to $74,999 | 190 (32.7%) | 30 (3.4%) |
| $75,000 to $99,999 | 37 (6.4%) | 96 (10.7%) |
| $100,000 to $149,999 | 82 (14.1%) | 246 (27.6%) |
| $150,000 or more | 49 (8.4%) | 300 (33.6%) |
| Total | 581 (100.0%) | 893 (100.0%) |
Property Value to Household Income Ratio in Wilmington
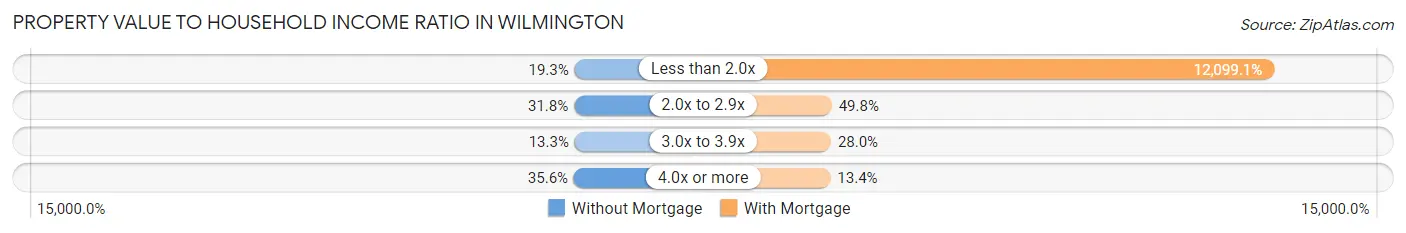
| Value-to-Income Ratio | Without Mortgage | With Mortgage |
| Less than 2.0x | 112 (19.3%) | 108,045 (12,099.1%) |
| 2.0x to 2.9x | 185 (31.8%) | 445 (49.8%) |
| 3.0x to 3.9x | 77 (13.3%) | 250 (28.0%) |
| 4.0x or more | 207 (35.6%) | 120 (13.4%) |
| Total | 581 (100.0%) | 893 (100.0%) |
Real Estate Taxes by Mortgage Status in Wilmington
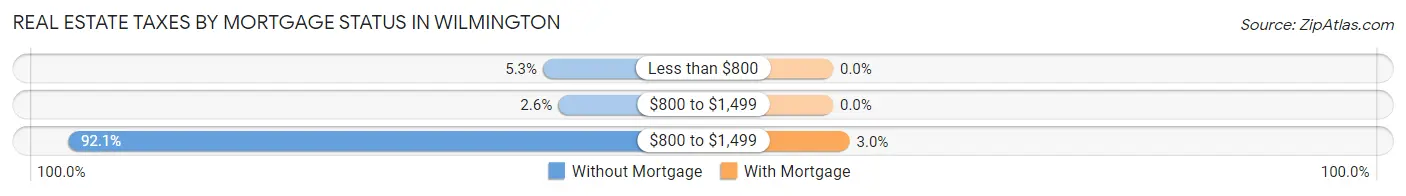
| Property Taxes | Without Mortgage | With Mortgage |
| Less than $800 | 31 (5.3%) | 0 (0.0%) |
| $800 to $1,499 | 15 (2.6%) | 0 (0.0%) |
| $800 to $1,499 | 535 (92.1%) | 27 (3.0%) |
| Total | 581 (100.0%) | 893 (100.0%) |
Health & Disability in Wilmington
Health Insurance Coverage by Age in Wilmington
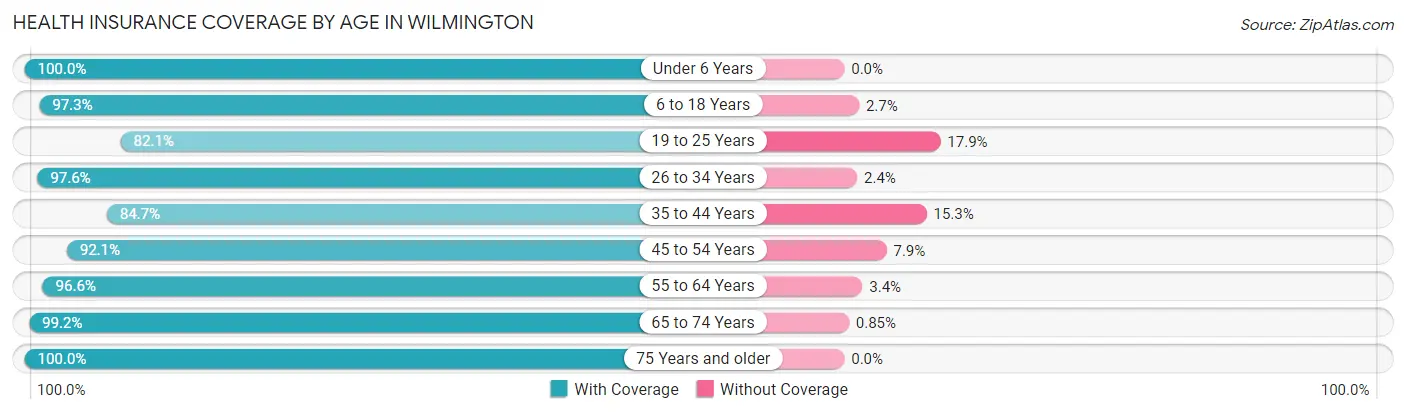
| Age Bracket | With Coverage | Without Coverage |
| Under 6 Years | 419 (100.0%) | 0 (0.0%) |
| 6 to 18 Years | 533 (97.3%) | 15 (2.7%) |
| 19 to 25 Years | 449 (82.1%) | 98 (17.9%) |
| 26 to 34 Years | 734 (97.6%) | 18 (2.4%) |
| 35 to 44 Years | 442 (84.7%) | 80 (15.3%) |
| 45 to 54 Years | 643 (92.1%) | 55 (7.9%) |
| 55 to 64 Years | 802 (96.6%) | 28 (3.4%) |
| 65 to 74 Years | 467 (99.2%) | 4 (0.9%) |
| 75 Years and older | 565 (100.0%) | 0 (0.0%) |
| Total | 5,054 (94.4%) | 298 (5.6%) |
Health Insurance Coverage by Citizenship Status in Wilmington
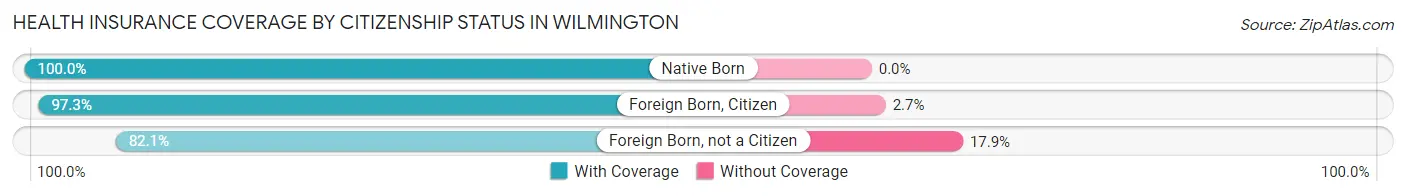
| Citizenship Status | With Coverage | Without Coverage |
| Native Born | 419 (100.0%) | 0 (0.0%) |
| Foreign Born, Citizen | 533 (97.3%) | 15 (2.7%) |
| Foreign Born, not a Citizen | 449 (82.1%) | 98 (17.9%) |
Health Insurance Coverage by Household Income in Wilmington
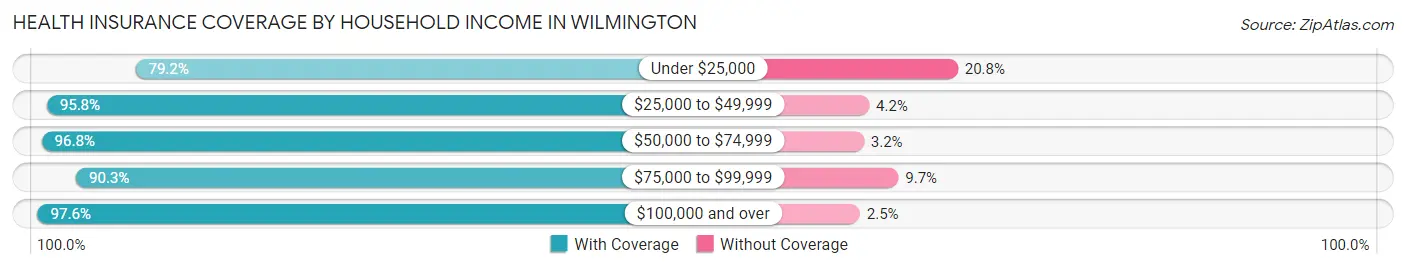
| Household Income | With Coverage | Without Coverage |
| Under $25,000 | 381 (79.2%) | 100 (20.8%) |
| $25,000 to $49,999 | 710 (95.8%) | 31 (4.2%) |
| $50,000 to $74,999 | 969 (96.8%) | 32 (3.2%) |
| $75,000 to $99,999 | 739 (90.3%) | 79 (9.7%) |
| $100,000 and over | 2,229 (97.6%) | 56 (2.5%) |
Public vs Private Health Insurance Coverage by Age in Wilmington
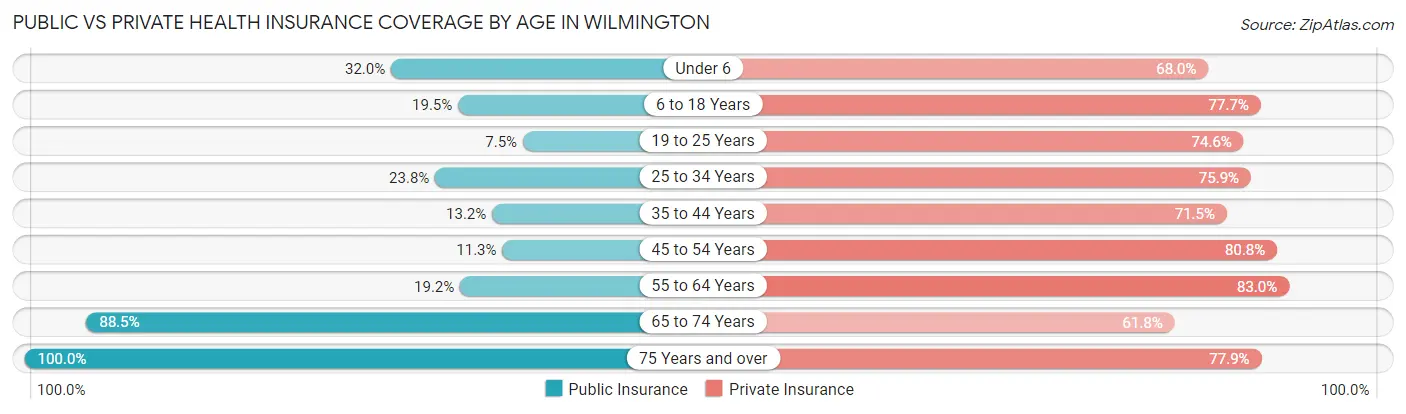
| Age Bracket | Public Insurance | Private Insurance |
| Under 6 | 134 (32.0%) | 285 (68.0%) |
| 6 to 18 Years | 107 (19.5%) | 426 (77.7%) |
| 19 to 25 Years | 41 (7.5%) | 408 (74.6%) |
| 25 to 34 Years | 179 (23.8%) | 571 (75.9%) |
| 35 to 44 Years | 69 (13.2%) | 373 (71.5%) |
| 45 to 54 Years | 79 (11.3%) | 564 (80.8%) |
| 55 to 64 Years | 159 (19.2%) | 689 (83.0%) |
| 65 to 74 Years | 417 (88.5%) | 291 (61.8%) |
| 75 Years and over | 565 (100.0%) | 440 (77.9%) |
| Total | 1,750 (32.7%) | 4,047 (75.6%) |
Disability Status by Sex by Age in Wilmington
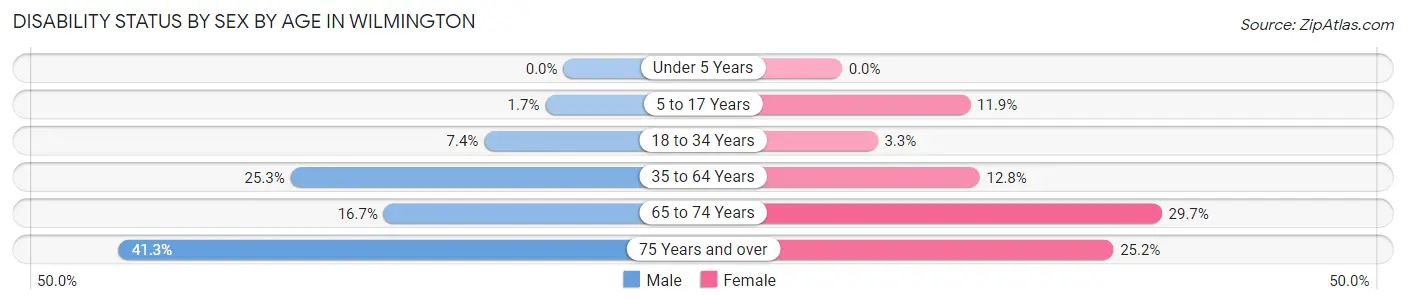
| Age Bracket | Male | Female |
| Under 5 Years | 0 (0.0%) | 0 (0.0%) |
| 5 to 17 Years | 5 (1.7%) | 28 (11.9%) |
| 18 to 34 Years | 54 (7.3%) | 20 (3.3%) |
| 35 to 64 Years | 234 (25.3%) | 144 (12.8%) |
| 65 to 74 Years | 42 (16.7%) | 65 (29.7%) |
| 75 Years and over | 66 (41.2%) | 102 (25.2%) |
Disability Class by Sex by Age in Wilmington
Disability Class: Hearing Difficulty
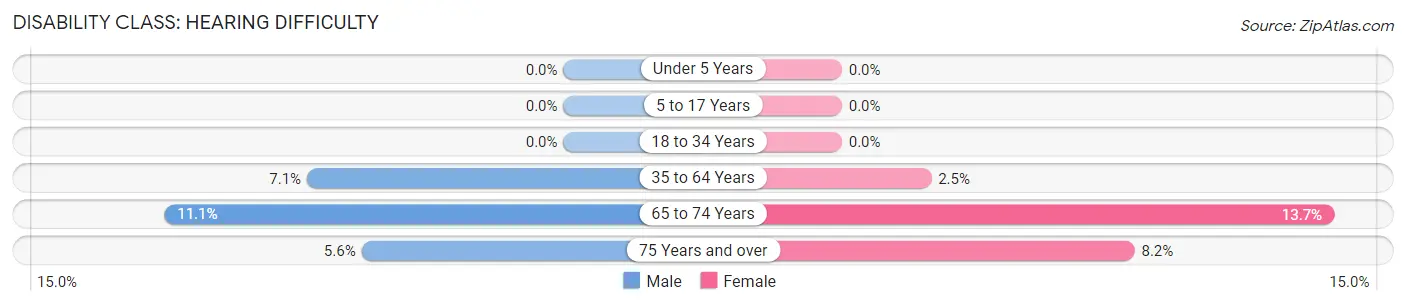
| Age Bracket | Male | Female |
| Under 5 Years | 0 (0.0%) | 0 (0.0%) |
| 5 to 17 Years | 0 (0.0%) | 0 (0.0%) |
| 18 to 34 Years | 0 (0.0%) | 0 (0.0%) |
| 35 to 64 Years | 66 (7.1%) | 28 (2.5%) |
| 65 to 74 Years | 28 (11.1%) | 30 (13.7%) |
| 75 Years and over | 9 (5.6%) | 33 (8.2%) |
Disability Class: Vision Difficulty
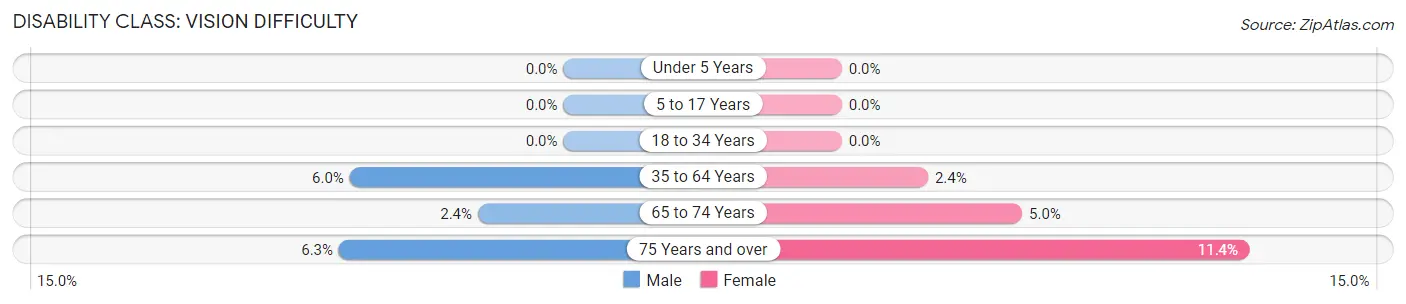
| Age Bracket | Male | Female |
| Under 5 Years | 0 (0.0%) | 0 (0.0%) |
| 5 to 17 Years | 0 (0.0%) | 0 (0.0%) |
| 18 to 34 Years | 0 (0.0%) | 0 (0.0%) |
| 35 to 64 Years | 55 (5.9%) | 27 (2.4%) |
| 65 to 74 Years | 6 (2.4%) | 11 (5.0%) |
| 75 Years and over | 10 (6.2%) | 46 (11.4%) |
Disability Class: Cognitive Difficulty
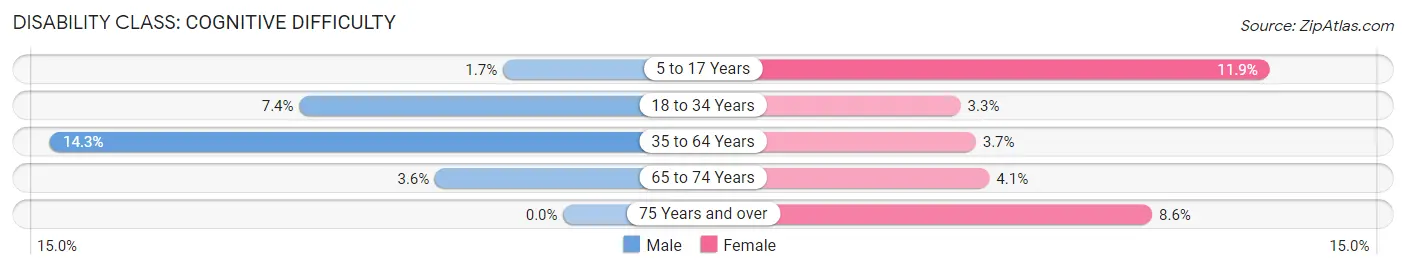
| Age Bracket | Male | Female |
| 5 to 17 Years | 5 (1.7%) | 28 (11.9%) |
| 18 to 34 Years | 54 (7.3%) | 20 (3.3%) |
| 35 to 64 Years | 132 (14.3%) | 42 (3.7%) |
| 65 to 74 Years | 9 (3.6%) | 9 (4.1%) |
| 75 Years and over | 0 (0.0%) | 35 (8.6%) |
Disability Class: Ambulatory Difficulty
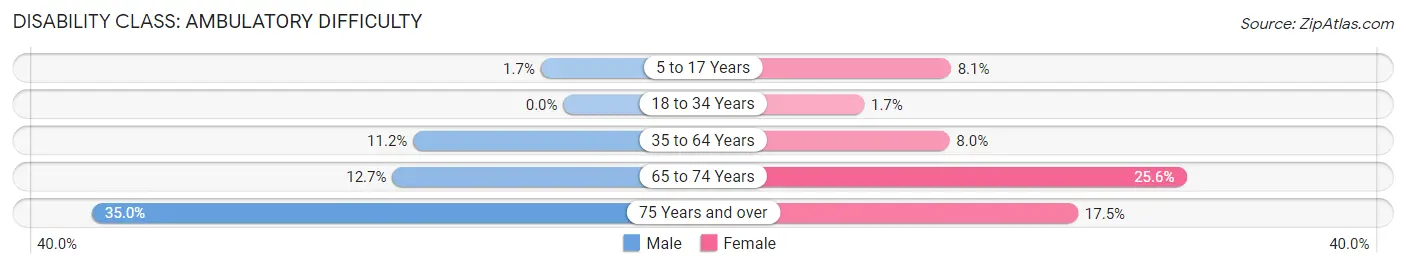
| Age Bracket | Male | Female |
| 5 to 17 Years | 5 (1.7%) | 19 (8.1%) |
| 18 to 34 Years | 0 (0.0%) | 10 (1.7%) |
| 35 to 64 Years | 103 (11.2%) | 90 (8.0%) |
| 65 to 74 Years | 32 (12.7%) | 56 (25.6%) |
| 75 Years and over | 56 (35.0%) | 71 (17.5%) |
Disability Class: Self-Care Difficulty
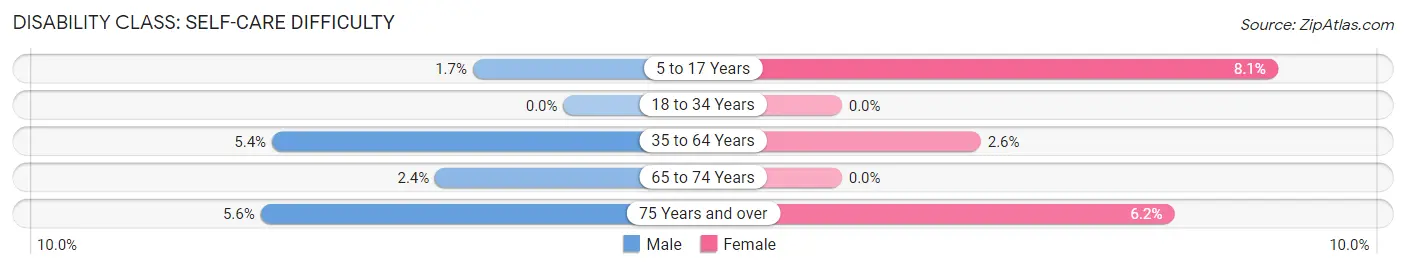
| Age Bracket | Male | Female |
| 5 to 17 Years | 5 (1.7%) | 19 (8.1%) |
| 18 to 34 Years | 0 (0.0%) | 0 (0.0%) |
| 35 to 64 Years | 50 (5.4%) | 29 (2.6%) |
| 65 to 74 Years | 6 (2.4%) | 0 (0.0%) |
| 75 Years and over | 9 (5.6%) | 25 (6.2%) |
Technology Access in Wilmington
Computing Device Access in Wilmington
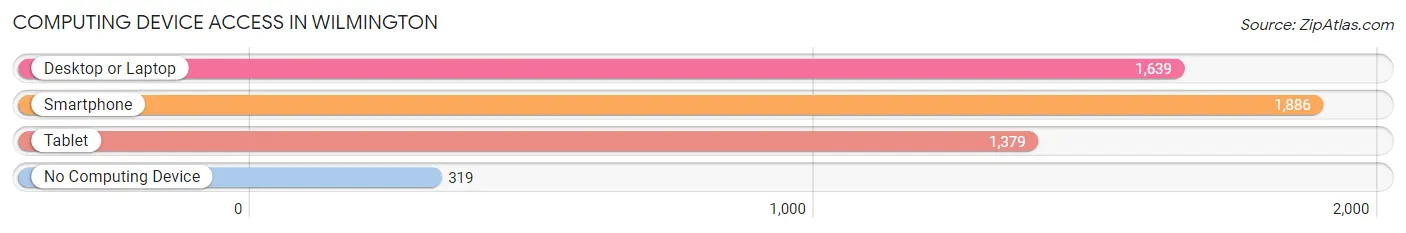
| Device Type | # Households | % Households |
| Desktop or Laptop | 1,639 | 70.3% |
| Smartphone | 1,886 | 80.9% |
| Tablet | 1,379 | 59.2% |
| No Computing Device | 319 | 13.7% |
| Total | 2,330 | 100.0% |
Internet Access in Wilmington
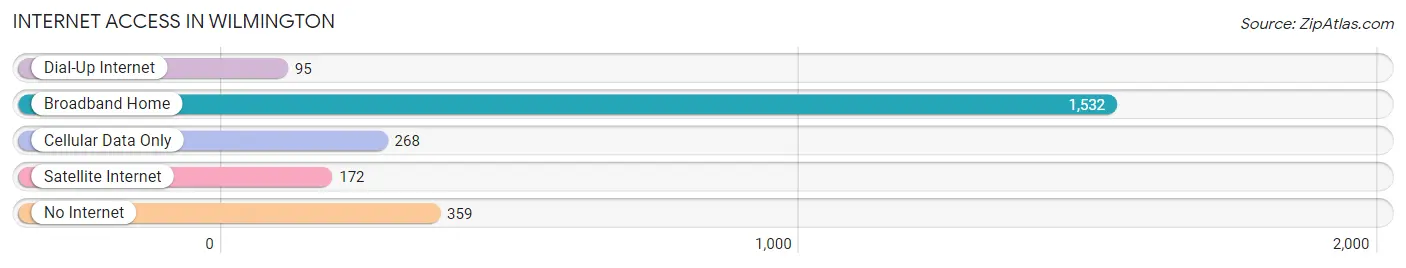
| Internet Type | # Households | % Households |
| Dial-Up Internet | 95 | 4.1% |
| Broadband Home | 1,532 | 65.7% |
| Cellular Data Only | 268 | 11.5% |
| Satellite Internet | 172 | 7.4% |
| No Internet | 359 | 15.4% |
| Total | 2,330 | 100.0% |
Wilmington Summary
Wilmington, Illinois is a small town located in Will County, Illinois, United States. It is situated on the banks of the Kankakee River, approximately 60 miles southwest of Chicago. The town has a population of approximately 5,000 people and is part of the Chicago metropolitan area.
History
The area that is now Wilmington was first settled in 1834 by a group of settlers from New York. The town was originally known as “Hardscrabble” and was later renamed “Wilmington” in 1836 after the town of Wilmington, New York. The town was officially incorporated in 1853.
In the late 19th century, Wilmington was a major stop on the Chicago and Alton Railroad. The railroad brought many new businesses and industries to the town, including a brickyard, a flour mill, and a lumber mill. The town also became a popular tourist destination, with many visitors coming to enjoy the nearby Kankakee River.
Geography
Wilmington is located in Will County, Illinois, approximately 60 miles southwest of Chicago. The town is situated on the banks of the Kankakee River, which is a tributary of the Illinois River. The town is surrounded by farmland and is located near the Kankakee River State Park.
The town has a total area of 2.2 square miles, all of which is land. The town has a humid continental climate, with hot summers and cold winters. The average annual temperature is around 50 degrees Fahrenheit.
Economy
Wilmington’s economy is largely based on agriculture and tourism. The town is home to several farms, which produce a variety of crops, including corn, soybeans, and wheat. The town is also home to several tourist attractions, including the Kankakee River State Park and the Wilmington Historical Museum.
The town is also home to several small businesses, including restaurants, retail stores, and service providers. The town is also home to several manufacturing companies, including a steel mill and a paper mill.
Demographics
As of the 2010 census, the town had a population of 5,064 people. The racial makeup of the town was 97.2% White, 0.7% African American, 0.3% Native American, 0.3% Asian, 0.1% Pacific Islander, 0.4% from other races, and 1.0% from two or more races. Hispanic or Latino of any race were 1.7% of the population.
The median income for a household in the town was $45,938, and the median income for a family was $51,938. The per capita income for the town was $20,938. About 8.2% of families and 10.2% of the population were below the poverty line, including 14.2% of those under age 18 and 6.2% of those age 65 or over.
Common Questions
What is Per Capita Income in Wilmington?
Per Capita income in Wilmington is $36,538.
What is the Median Family Income in Wilmington?
Median Family Income in Wilmington is $94,745.
What is the Median Household income in Wilmington?
Median Household Income in Wilmington is $66,538.
What is Income or Wage Gap in Wilmington?
Income or Wage Gap in Wilmington is 40.7%.
Women in Wilmington earn 59.3 cents for every dollar earned by a man.
What is Family Income Deficit in Wilmington?
Family Income Deficit in Wilmington is $8,352.
Families that are below poverty line in Wilmington earn $8,352 less on average than the poverty threshold level.
What is Inequality or Gini Index in Wilmington?
Inequality or Gini Index in Wilmington is 0.42.
What is the Total Population of Wilmington?
Total Population of Wilmington is 5,525.
What is the Total Male Population of Wilmington?
Total Male Population of Wilmington is 2,701.
What is the Total Female Population of Wilmington?
Total Female Population of Wilmington is 2,824.
What is the Ratio of Males per 100 Females in Wilmington?
There are 95.64 Males per 100 Females in Wilmington.
What is the Ratio of Females per 100 Males in Wilmington?
There are 104.55 Females per 100 Males in Wilmington.
What is the Median Population Age in Wilmington?
Median Population Age in Wilmington is 43.9 Years.
What is the Average Family Size in Wilmington
Average Family Size in Wilmington is 3.1 People.
What is the Average Household Size in Wilmington
Average Household Size in Wilmington is 2.3 People.
How Large is the Labor Force in Wilmington?
There are 3,011 People in the Labor Forcein in Wilmington.
What is the Percentage of People in the Labor Force in Wilmington?
63.9% of People are in the Labor Force in Wilmington.
What is the Unemployment Rate in Wilmington?
Unemployment Rate in Wilmington is 4.2%.