Wheeler, IL Map & Demographics
Wheeler Map
Wheeler Overview
$18,725
PER CAPITA INCOME
63.5%
WAGE / INCOME GAP [ % ]
36.5¢/ $1
WAGE / INCOME GAP [ $ ]
0.49
INEQUALITY / GINI INDEX
123
TOTAL POPULATION
63
MALE POPULATION
60
FEMALE POPULATION
105.00
MALES / 100 FEMALES
95.24
FEMALES / 100 MALES
33.1
MEDIAN AGE
4.9
AVG FAMILY SIZE
2.9
AVG HOUSEHOLD SIZE
53
LABOR FORCE [ PEOPLE ]
66.3%
PERCENT IN LABOR FORCE
7.5%
UNEMPLOYMENT RATE
Wheeler Zip Codes
Wheeler Area Codes
Income in Wheeler
Income Overview in Wheeler
| Characteristic | Number | Measure |
| Per Capita Income | 123 | $18,725 |
| Median Family Income | 19 | $0 |
| Mean Family Income | 19 | $32,284 |
| Median Household Income | 43 | $0 |
| Mean Household Income | 43 | $36,326 |
| Income Deficit | 19 | $0 |
| Wage / Income Gap (%) | 123 | 63.49% |
| Wage / Income Gap ($) | 123 | 36.51¢ per $1 |
| Gini / Inequality Index | 123 | 0.49 |
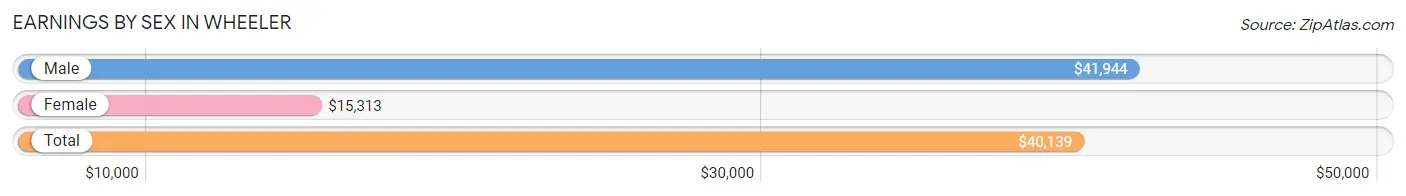
Earnings by Sex in Wheeler
Average Earnings in Wheeler are $40,139, $41,944 for men and $15,313 for women, a difference of 63.5%.
| Sex | Number | Average Earnings |
| Male | 36 (67.9%) | $41,944 |
| Female | 17 (32.1%) | $15,313 |
| Total | 53 (100.0%) | $40,139 |
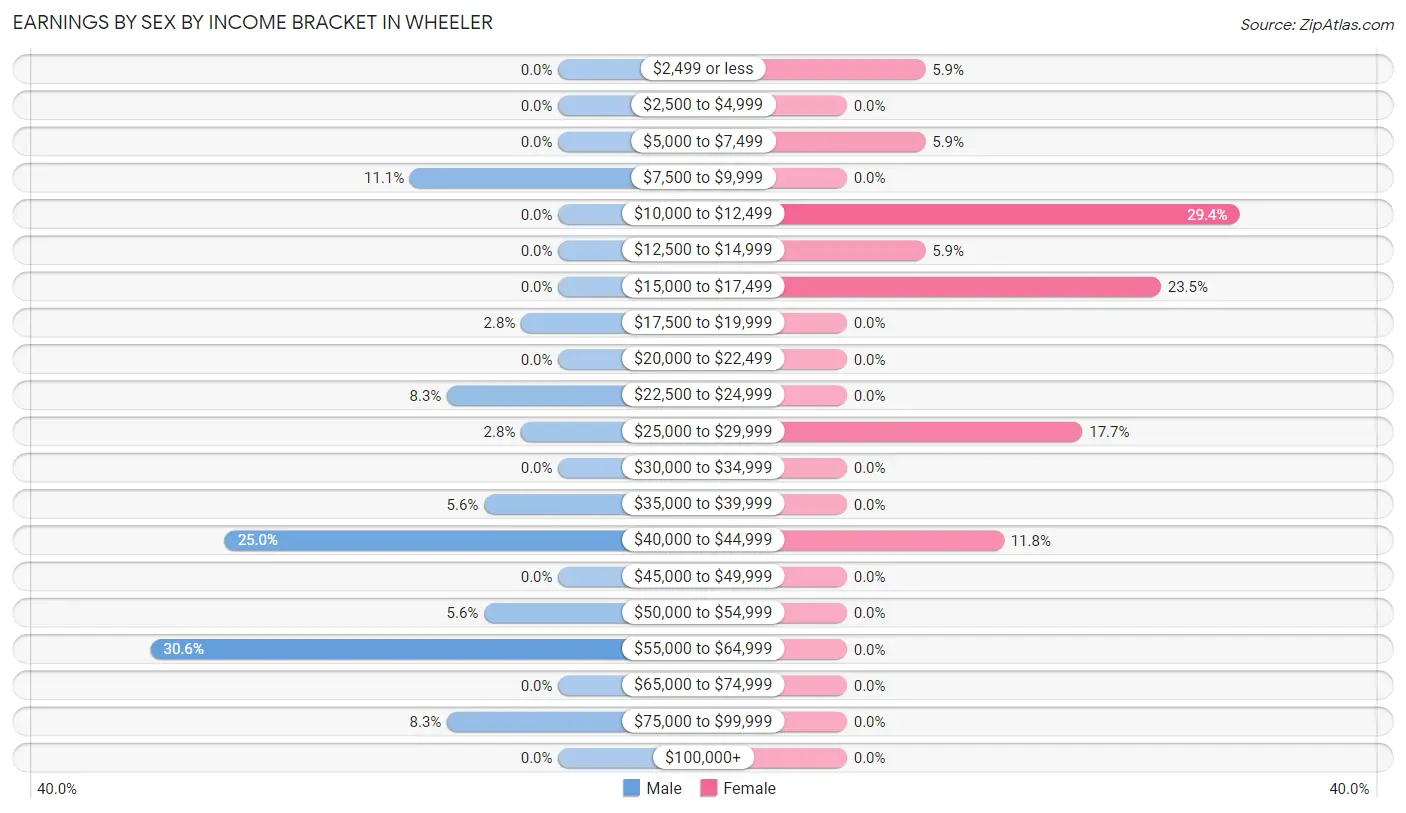
Earnings by Sex by Income Bracket in Wheeler
The most common earnings brackets in Wheeler are $55,000 to $64,999 for men (11 | 30.6%) and $10,000 to $12,499 for women (5 | 29.4%).
| Income | Male | Female |
| $2,499 or less | 0 (0.0%) | 1 (5.9%) |
| $2,500 to $4,999 | 0 (0.0%) | 0 (0.0%) |
| $5,000 to $7,499 | 0 (0.0%) | 1 (5.9%) |
| $7,500 to $9,999 | 4 (11.1%) | 0 (0.0%) |
| $10,000 to $12,499 | 0 (0.0%) | 5 (29.4%) |
| $12,500 to $14,999 | 0 (0.0%) | 1 (5.9%) |
| $15,000 to $17,499 | 0 (0.0%) | 4 (23.5%) |
| $17,500 to $19,999 | 1 (2.8%) | 0 (0.0%) |
| $20,000 to $22,499 | 0 (0.0%) | 0 (0.0%) |
| $22,500 to $24,999 | 3 (8.3%) | 0 (0.0%) |
| $25,000 to $29,999 | 1 (2.8%) | 3 (17.6%) |
| $30,000 to $34,999 | 0 (0.0%) | 0 (0.0%) |
| $35,000 to $39,999 | 2 (5.6%) | 0 (0.0%) |
| $40,000 to $44,999 | 9 (25.0%) | 2 (11.8%) |
| $45,000 to $49,999 | 0 (0.0%) | 0 (0.0%) |
| $50,000 to $54,999 | 2 (5.6%) | 0 (0.0%) |
| $55,000 to $64,999 | 11 (30.6%) | 0 (0.0%) |
| $65,000 to $74,999 | 0 (0.0%) | 0 (0.0%) |
| $75,000 to $99,999 | 3 (8.3%) | 0 (0.0%) |
| $100,000+ | 0 (0.0%) | 0 (0.0%) |
| Total | 36 (100.0%) | 17 (100.0%) |
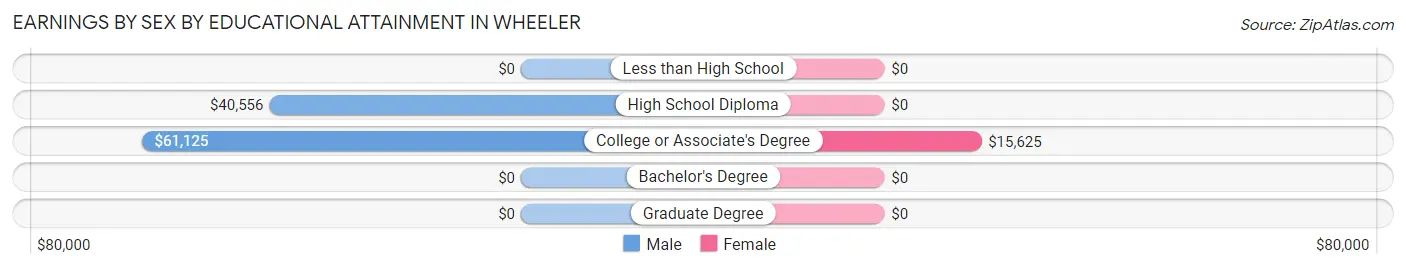
Earnings by Sex by Educational Attainment in Wheeler
Average earnings in Wheeler are $41,944 for men and $15,000 for women, a difference of 64.2%. Men with an educational attainment of college or associate's degree enjoy the highest average annual earnings of $61,125, while those with high school diploma education earn the least with $40,556. Women with an educational attainment of college or associate's degree earn the most with the average annual earnings of $15,625, while those with college or associate's degree education have the smallest earnings of $15,625.
| Educational Attainment | Male Income | Female Income |
| Less than High School | - | - |
| High School Diploma | $40,556 | $0 |
| College or Associate's Degree | $61,125 | $15,625 |
| Bachelor's Degree | - | - |
| Graduate Degree | - | - |
| Total | $41,944 | $15,000 |
Family Income in Wheeler
Family Income Brackets in Wheeler
According to the Wheeler family income data, there are 5 families falling into the $10,000 to $14,999 income range, which is the most common income bracket and makes up 26.3% of all families.
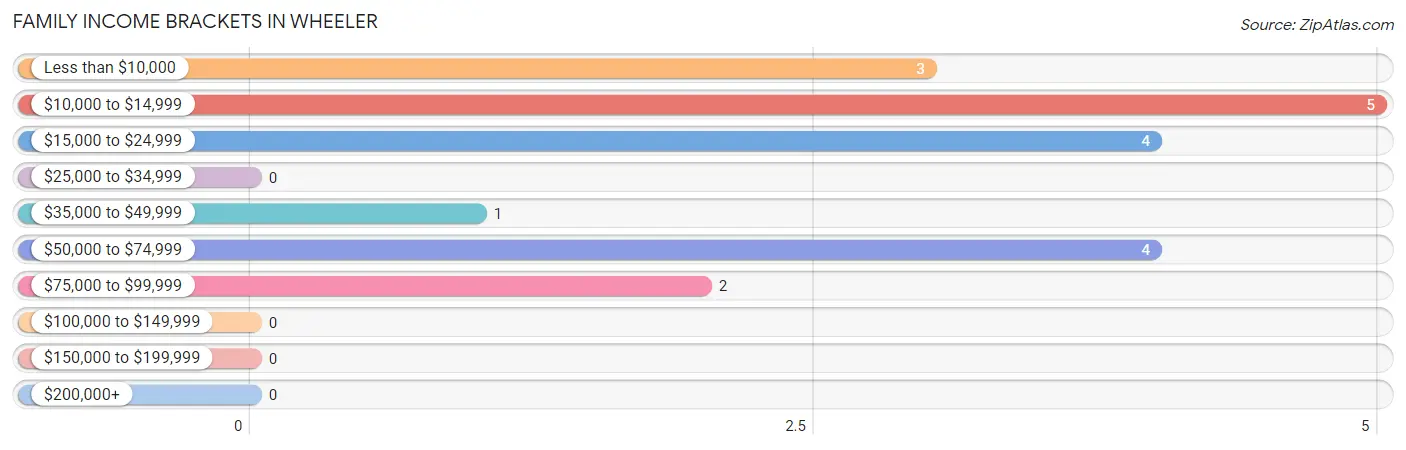
| Income Bracket | # Families | % Families |
| Less than $10,000 | 3 | 15.8% |
| $10,000 to $14,999 | 5 | 26.3% |
| $15,000 to $24,999 | 4 | 21.1% |
| $25,000 to $34,999 | 0 | 0.0% |
| $35,000 to $49,999 | 1 | 5.3% |
| $50,000 to $74,999 | 4 | 21.1% |
| $75,000 to $99,999 | 2 | 10.5% |
| $100,000 to $149,999 | 0 | 0.0% |
| $150,000 to $199,999 | 0 | 0.0% |
| $200,000+ | 0 | 0.0% |
Family Income by Famaliy Size in Wheeler
3-person families (3 | 15.8%) account for the highest median family income in Wheeler with $58,750 per family, while 3-person families (3 | 15.8%) have the highest median income of $19,583 per family member.
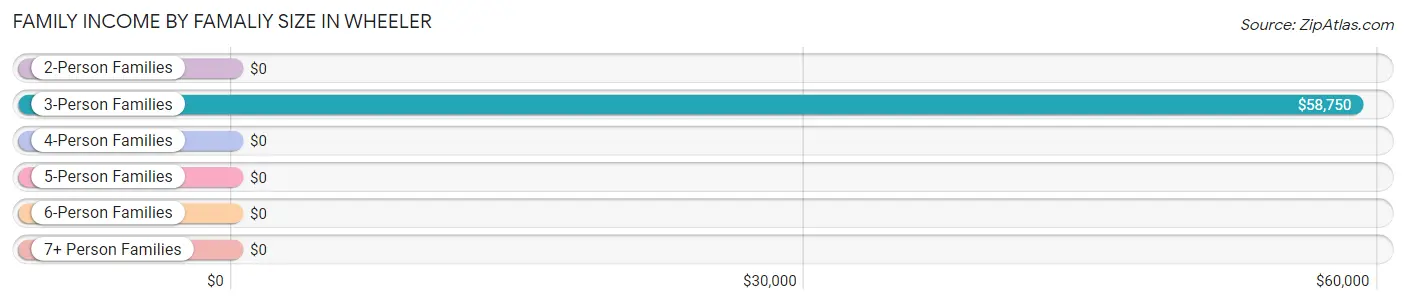
| Income Bracket | # Families | Median Income |
| 2-Person Families | 6 (31.6%) | $0 |
| 3-Person Families | 3 (15.8%) | $58,750 |
| 4-Person Families | 7 (36.8%) | $0 |
| 5-Person Families | 3 (15.8%) | $0 |
| 6-Person Families | 0 (0.0%) | $0 |
| 7+ Person Families | 0 (0.0%) | $0 |
| Total | 19 (100.0%) | $0 |
Family Income by Number of Earners in Wheeler
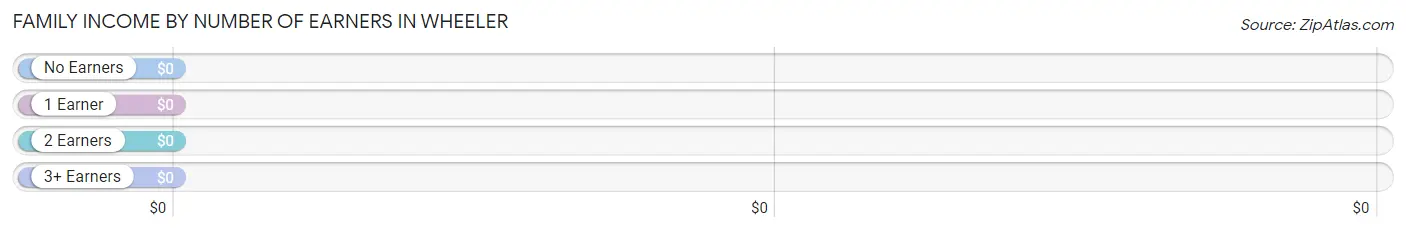
| Number of Earners | # Families | Median Income |
| No Earners | 1 (5.3%) | $0 |
| 1 Earner | 15 (78.9%) | $0 |
| 2 Earners | 2 (10.5%) | $0 |
| 3+ Earners | 1 (5.3%) | $0 |
| Total | 19 (100.0%) | $0 |
Household Income in Wheeler
Household Income Brackets in Wheeler
With 12 households falling in the category, the $35,000 to $49,999 income range is the most frequent in Wheeler, accounting for 27.9% of all households.
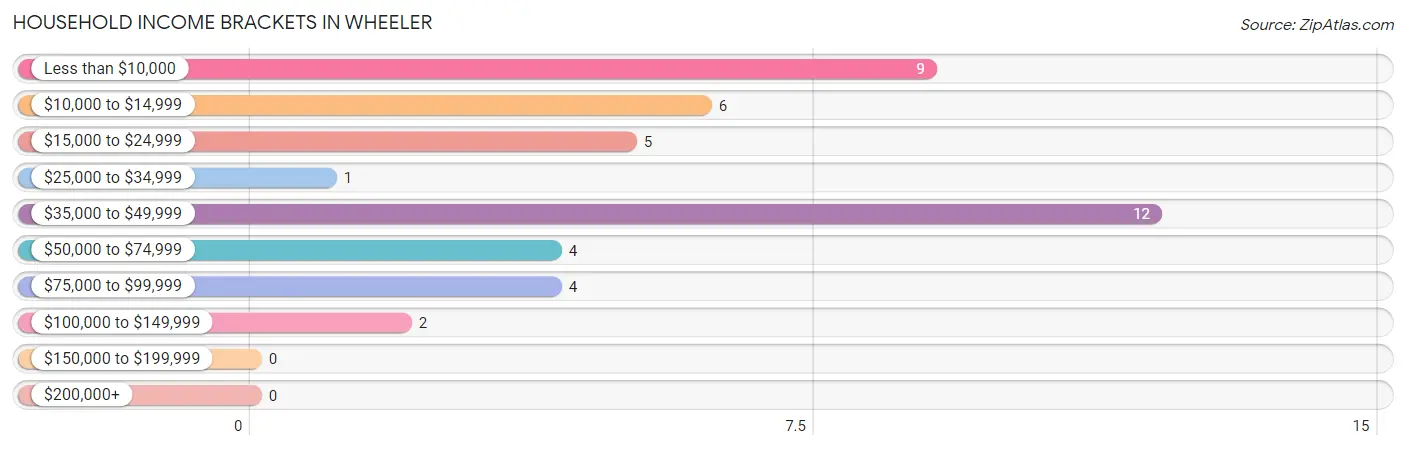
| Income Bracket | # Households | % Households |
| Less than $10,000 | 9 | 20.9% |
| $10,000 to $14,999 | 6 | 14.0% |
| $15,000 to $24,999 | 5 | 11.6% |
| $25,000 to $34,999 | 1 | 2.3% |
| $35,000 to $49,999 | 12 | 27.9% |
| $50,000 to $74,999 | 4 | 9.3% |
| $75,000 to $99,999 | 4 | 9.3% |
| $100,000 to $149,999 | 2 | 4.7% |
| $150,000 to $199,999 | 0 | 0.0% |
| $200,000+ | 0 | 0.0% |
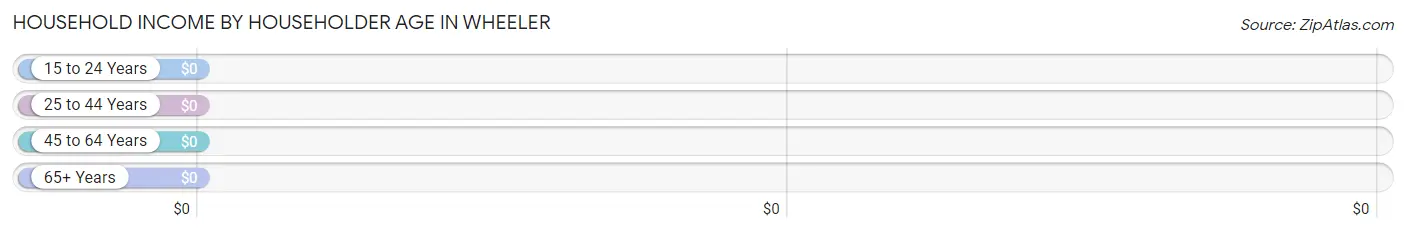
Household Income by Householder Age in Wheeler
| Income Bracket | # Households | Median Income |
| 15 to 24 Years | 0 (0.0%) | $0 |
| 25 to 44 Years | 26 (60.5%) | $0 |
| 45 to 64 Years | 9 (20.9%) | $0 |
| 65+ Years | 8 (18.6%) | $0 |
| Total | 43 (100.0%) | $0 |
Poverty in Wheeler
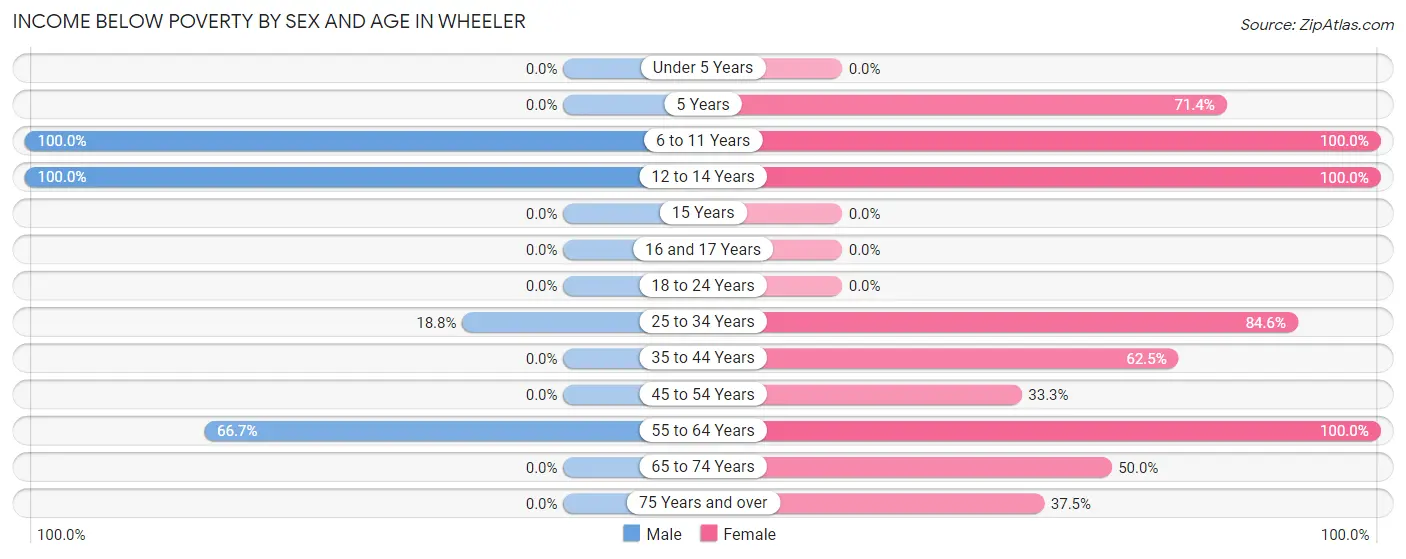
Income Below Poverty by Sex and Age in Wheeler
With 38.1% poverty level for males and 66.7% for females among the residents of Wheeler, 6 to 11 year old males and 6 to 11 year old females are the most vulnerable to poverty, with 11 males (100.0%) and 9 females (100.0%) in their respective age groups living below the poverty level.
| Age Bracket | Male | Female |
| Under 5 Years | 0 (0.0%) | 0 (0.0%) |
| 5 Years | 0 (0.0%) | 5 (71.4%) |
| 6 to 11 Years | 11 (100.0%) | 9 (100.0%) |
| 12 to 14 Years | 6 (100.0%) | 3 (100.0%) |
| 15 Years | 0 (0.0%) | 0 (0.0%) |
| 16 and 17 Years | 0 (0.0%) | 0 (0.0%) |
| 18 to 24 Years | 0 (0.0%) | 0 (0.0%) |
| 25 to 34 Years | 3 (18.8%) | 11 (84.6%) |
| 35 to 44 Years | 0 (0.0%) | 5 (62.5%) |
| 45 to 54 Years | 0 (0.0%) | 2 (33.3%) |
| 55 to 64 Years | 4 (66.7%) | 1 (100.0%) |
| 65 to 74 Years | 0 (0.0%) | 1 (50.0%) |
| 75 Years and over | 0 (0.0%) | 3 (37.5%) |
| Total | 24 (38.1%) | 40 (66.7%) |
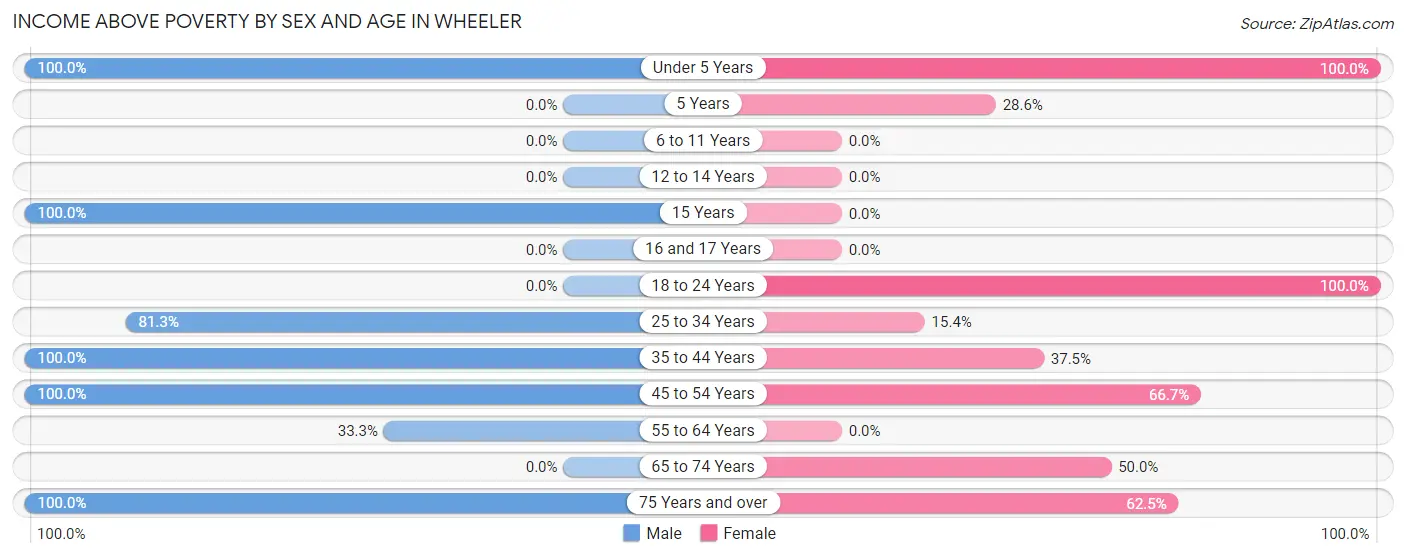
Income Above Poverty by Sex and Age in Wheeler
According to the poverty statistics in Wheeler, males aged under 5 years and females aged under 5 years are the age groups that are most secure financially, with 100.0% of males and 100.0% of females in these age groups living above the poverty line.
| Age Bracket | Male | Female |
| Under 5 Years | 3 (100.0%) | 2 (100.0%) |
| 5 Years | 0 (0.0%) | 2 (28.6%) |
| 6 to 11 Years | 0 (0.0%) | 0 (0.0%) |
| 12 to 14 Years | 0 (0.0%) | 0 (0.0%) |
| 15 Years | 2 (100.0%) | 0 (0.0%) |
| 16 and 17 Years | 0 (0.0%) | 0 (0.0%) |
| 18 to 24 Years | 0 (0.0%) | 1 (100.0%) |
| 25 to 34 Years | 13 (81.2%) | 2 (15.4%) |
| 35 to 44 Years | 12 (100.0%) | 3 (37.5%) |
| 45 to 54 Years | 6 (100.0%) | 4 (66.7%) |
| 55 to 64 Years | 2 (33.3%) | 0 (0.0%) |
| 65 to 74 Years | 0 (0.0%) | 1 (50.0%) |
| 75 Years and over | 1 (100.0%) | 5 (62.5%) |
| Total | 39 (61.9%) | 20 (33.3%) |
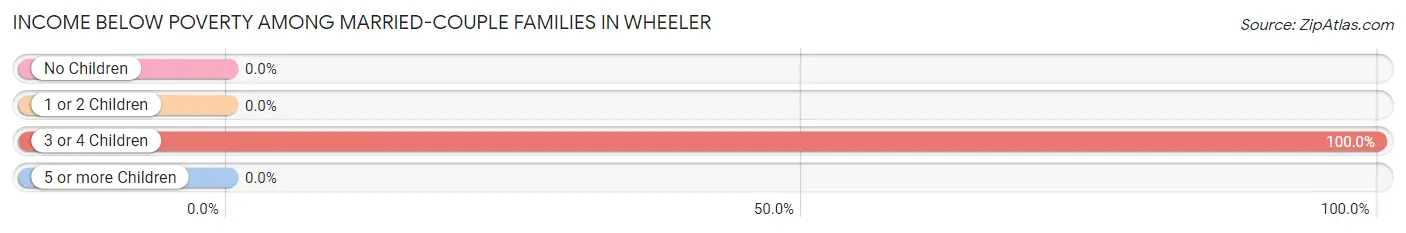
Income Below Poverty Among Married-Couple Families in Wheeler
The poverty statistics for married-couple families in Wheeler show that 30.0% or 3 of the total 10 families live below the poverty line. Families with 3 or 4 children have the highest poverty rate of 100.0%, comprising of 3 families. On the other hand, families with no children have the lowest poverty rate of 0.0%, which includes 0 families.
| Children | Above Poverty | Below Poverty |
| No Children | 3 (100.0%) | 0 (0.0%) |
| 1 or 2 Children | 4 (100.0%) | 0 (0.0%) |
| 3 or 4 Children | 0 (0.0%) | 3 (100.0%) |
| 5 or more Children | 0 (0.0%) | 0 (0.0%) |
| Total | 7 (70.0%) | 3 (30.0%) |
Income Below Poverty Among Single-Parent Households in Wheeler
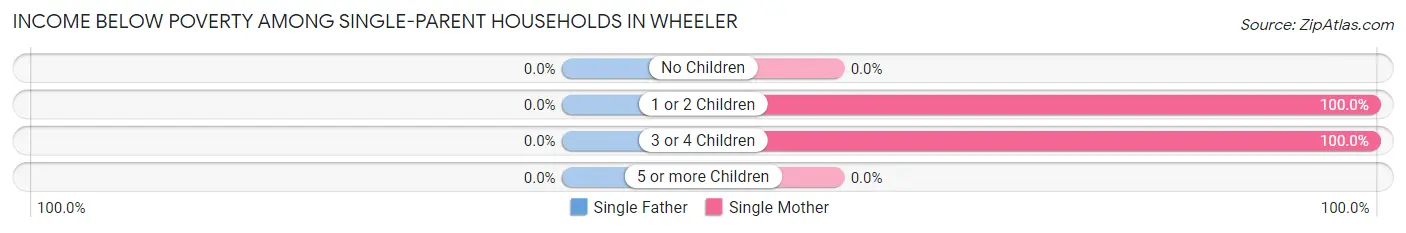
| Children | Single Father | Single Mother |
| No Children | 0 (0.0%) | 0 (0.0%) |
| 1 or 2 Children | 0 (0.0%) | 5 (100.0%) |
| 3 or 4 Children | 0 (0.0%) | 4 (100.0%) |
| 5 or more Children | 0 (0.0%) | 0 (0.0%) |
| Total | 0 (0.0%) | 9 (100.0%) |
Income Below Poverty Among Married-Couple vs Single-Parent Households in Wheeler
The poverty data for Wheeler shows that 3 of the married-couple family households (30.0%) and 9 of the single-parent households (100.0%) are living below the poverty level. Within the married-couple family households, those with 3 or 4 children have the highest poverty rate, with 3 households (100.0%) falling below the poverty line. Among the single-parent households, those with 1 or 2 children have the highest poverty rate, with 5 household (100.0%) living below poverty.
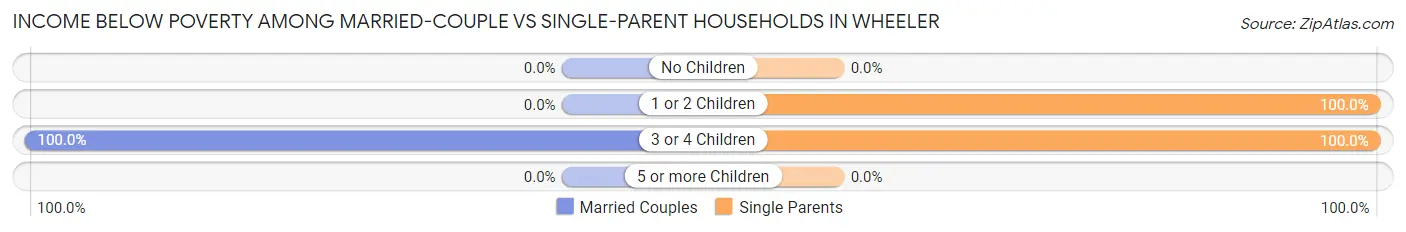
| Children | Married-Couple Families | Single-Parent Households |
| No Children | 0 (0.0%) | 0 (0.0%) |
| 1 or 2 Children | 0 (0.0%) | 5 (100.0%) |
| 3 or 4 Children | 3 (100.0%) | 4 (100.0%) |
| 5 or more Children | 0 (0.0%) | 0 (0.0%) |
| Total | 3 (30.0%) | 9 (100.0%) |
Race in Wheeler
The most populous races in Wheeler are White / Caucasian (111 | 90.2%), Two or more Races (12 | 9.8%), and Hispanic or Latino (6 | 4.9%).
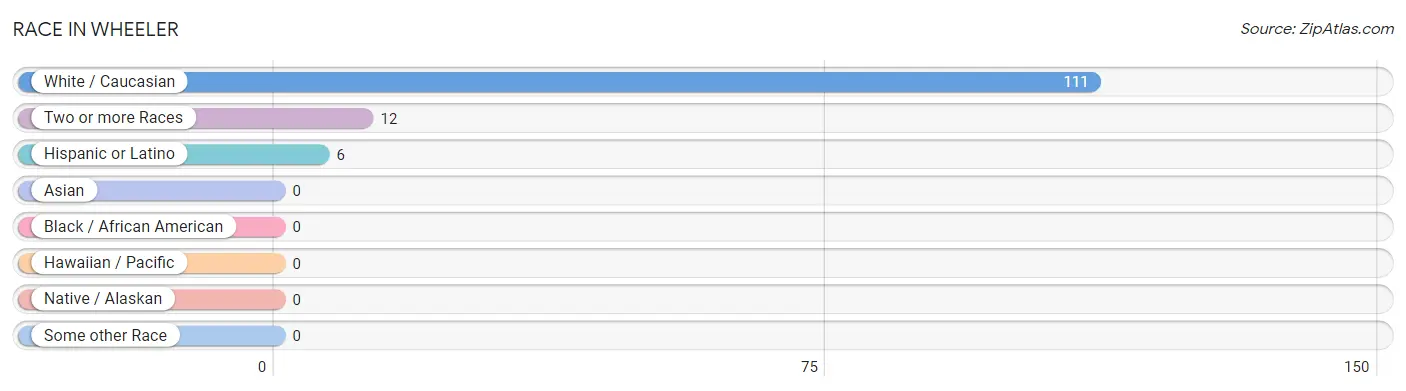
| Race | # Population | % Population |
| Asian | 0 | 0.0% |
| Black / African American | 0 | 0.0% |
| Hawaiian / Pacific | 0 | 0.0% |
| Hispanic or Latino | 6 | 4.9% |
| Native / Alaskan | 0 | 0.0% |
| White / Caucasian | 111 | 90.2% |
| Two or more Races | 12 | 9.8% |
| Some other Race | 0 | 0.0% |
| Total | 123 | 100.0% |
Ancestry in Wheeler
The most populous ancestries reported in Wheeler are Cherokee (7 | 5.7%), Mexican (6 | 4.9%), English (5 | 4.1%), German (5 | 4.1%), and Polish (3 | 2.4%), together accounting for 21.1% of all Wheeler residents.
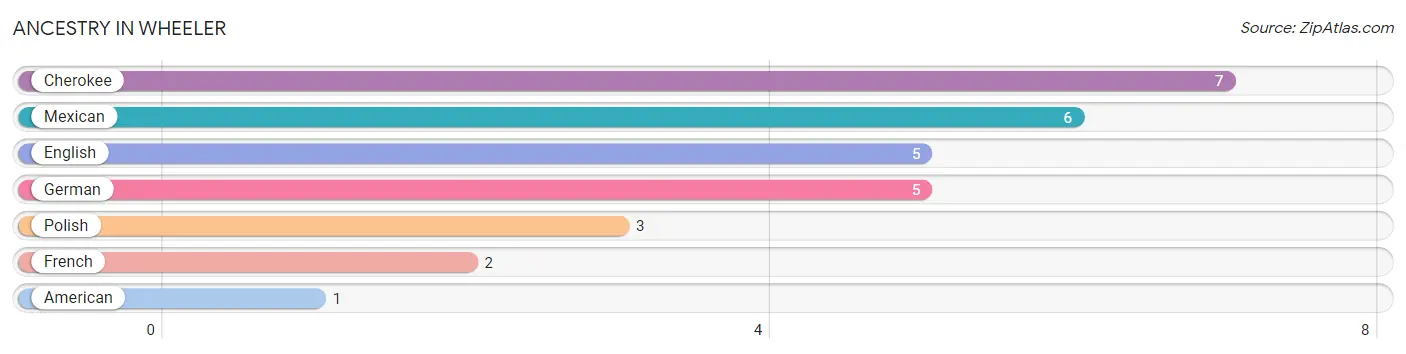
| Ancestry | # Population | % Population |
| American | 1 | 0.8% |
| Cherokee | 7 | 5.7% |
| English | 5 | 4.1% |
| French | 2 | 1.6% |
| German | 5 | 4.1% |
| Mexican | 6 | 4.9% |
| Polish | 3 | 2.4% | View All 7 Rows |
Immigrants in Wheeler

| Immigration Origin | # Population | % Population | View All 0 Rows |
Sex and Age in Wheeler
Sex and Age in Wheeler
The most populous age groups in Wheeler are 25 to 29 Years (12 | 19.1%) for men and 30 to 34 Years (13 | 21.7%) for women.
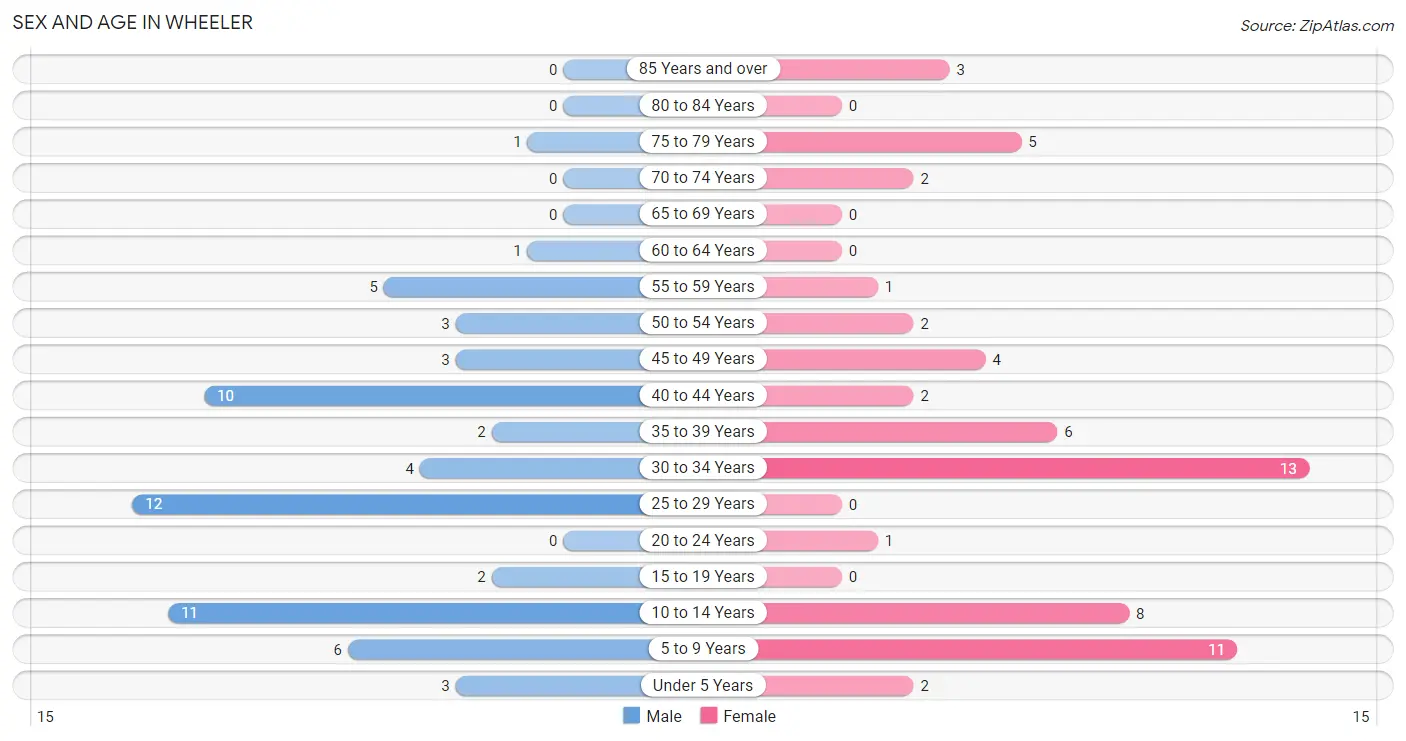
| Age Bracket | Male | Female |
| Under 5 Years | 3 (4.8%) | 2 (3.3%) |
| 5 to 9 Years | 6 (9.5%) | 11 (18.3%) |
| 10 to 14 Years | 11 (17.5%) | 8 (13.3%) |
| 15 to 19 Years | 2 (3.2%) | 0 (0.0%) |
| 20 to 24 Years | 0 (0.0%) | 1 (1.7%) |
| 25 to 29 Years | 12 (19.1%) | 0 (0.0%) |
| 30 to 34 Years | 4 (6.4%) | 13 (21.7%) |
| 35 to 39 Years | 2 (3.2%) | 6 (10.0%) |
| 40 to 44 Years | 10 (15.9%) | 2 (3.3%) |
| 45 to 49 Years | 3 (4.8%) | 4 (6.7%) |
| 50 to 54 Years | 3 (4.8%) | 2 (3.3%) |
| 55 to 59 Years | 5 (7.9%) | 1 (1.7%) |
| 60 to 64 Years | 1 (1.6%) | 0 (0.0%) |
| 65 to 69 Years | 0 (0.0%) | 0 (0.0%) |
| 70 to 74 Years | 0 (0.0%) | 2 (3.3%) |
| 75 to 79 Years | 1 (1.6%) | 5 (8.3%) |
| 80 to 84 Years | 0 (0.0%) | 0 (0.0%) |
| 85 Years and over | 0 (0.0%) | 3 (5.0%) |
| Total | 63 (100.0%) | 60 (100.0%) |
Families and Households in Wheeler
Median Family Size in Wheeler
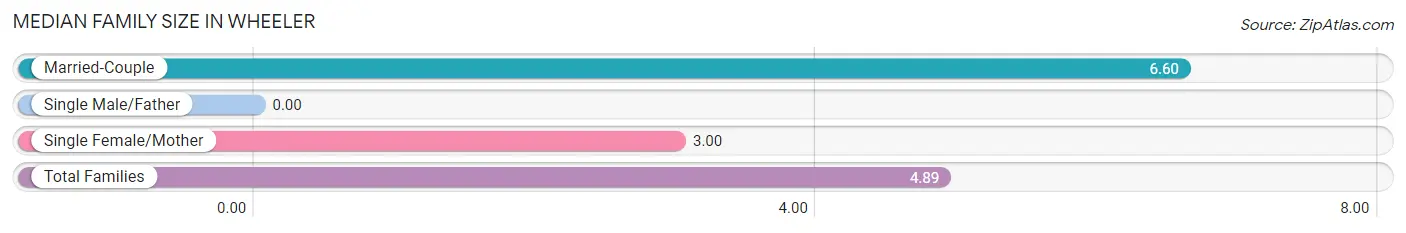
| Family Type | # Families | Family Size |
| Married-Couple | 10 (52.6%) | 6.60 |
| Single Male/Father | 0 (0.0%) | - |
| Single Female/Mother | 9 (47.4%) | 3.00 |
| Total Families | 19 (100.0%) | 4.89 |
Median Household Size in Wheeler
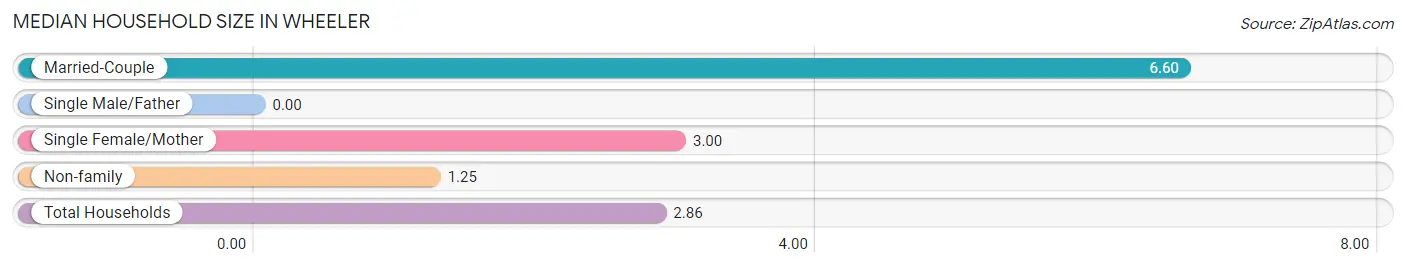
| Household Type | # Households | Household Size |
| Married-Couple | 10 (23.3%) | 6.60 |
| Single Male/Father | 0 (0.0%) | - |
| Single Female/Mother | 9 (20.9%) | 3.00 |
| Non-family | 24 (55.8%) | 1.25 |
| Total Households | 43 (100.0%) | 2.86 |
Household Size by Marriage Status in Wheeler
Out of a total of 43 households in Wheeler, 19 (44.2%) are family households, while 24 (55.8%) are nonfamily households. The most numerous type of family households are 4-person households, comprising 7, and the most common type of nonfamily households are 1-person households, comprising 20.
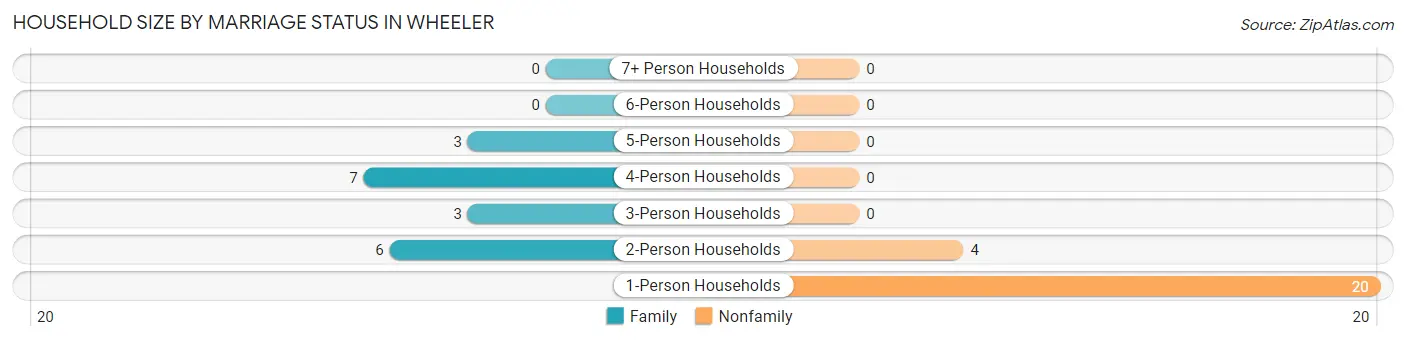
| Household Size | Family Households | Nonfamily Households |
| 1-Person Households | - | 20 (46.5%) |
| 2-Person Households | 6 (14.0%) | 4 (9.3%) |
| 3-Person Households | 3 (7.0%) | 0 (0.0%) |
| 4-Person Households | 7 (16.3%) | 0 (0.0%) |
| 5-Person Households | 3 (7.0%) | 0 (0.0%) |
| 6-Person Households | 0 (0.0%) | 0 (0.0%) |
| 7+ Person Households | 0 (0.0%) | 0 (0.0%) |
| Total | 19 (44.2%) | 24 (55.8%) |
Female Fertility in Wheeler
Fertility by Age in Wheeler
| Age Bracket | Women with Births | Births / 1,000 Women |
| 15 to 19 years | 0 (0.0%) | 0.0 |
| 20 to 34 years | 0 (0.0%) | 0.0 |
| 35 to 50 years | 0 (0.0%) | 0.0 |
| Total | 0 (0.0%) | 0.0 |
Fertility by Age by Marriage Status in Wheeler
| Age Bracket | Married | Unmarried |
| 15 to 19 years | 0 (0.0%) | 0 (0.0%) |
| 20 to 34 years | 0 (0.0%) | 0 (0.0%) |
| 35 to 50 years | 0 (0.0%) | 0 (0.0%) |
| Total | 0 (0.0%) | 0 (0.0%) |
Fertility by Education in Wheeler
| Educational Attainment | Women with Births | Births / 1,000 Women |
| Less than High School | 0 (0.0%) | 0.0 |
| High School Diploma | 0 (0.0%) | 0.0 |
| College or Associate's Degree | 0 (0.0%) | 0.0 |
| Bachelor's Degree | 0 (0.0%) | 0.0 |
| Graduate Degree | 0 (0.0%) | 0.0 |
| Total | 0 (0.0%) | 0.0 |
Fertility by Education by Marriage Status in Wheeler
| Educational Attainment | Married | Unmarried |
| Less than High School | 0 (0.0%) | 0 (0.0%) |
| High School Diploma | 0 (0.0%) | 0 (0.0%) |
| College or Associate's Degree | 0 (0.0%) | 0 (0.0%) |
| Bachelor's Degree | 0 (0.0%) | 0 (0.0%) |
| Graduate Degree | 0 (0.0%) | 0 (0.0%) |
| Total | 0 (0.0%) | 0 (0.0%) |
Employment Characteristics in Wheeler
Employment by Class of Employer in Wheeler
Among the 49 employed individuals in Wheeler, private company employees (40 | 81.6%), self-employed (not incorporated) (5 | 10.2%), and state government employees (4 | 8.2%) make up the most common classes of employment.
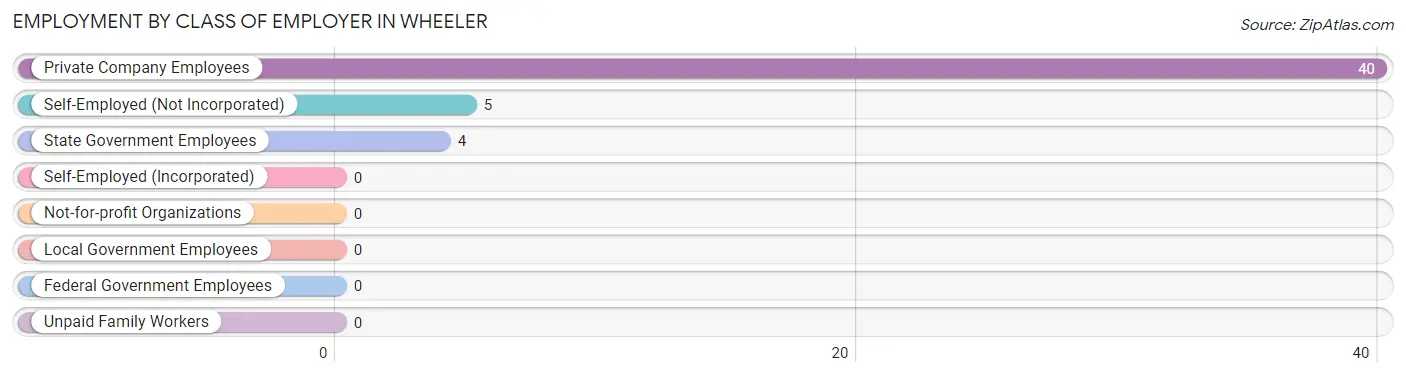
| Employer Class | # Employees | % Employees |
| Private Company Employees | 40 | 81.6% |
| Self-Employed (Incorporated) | 0 | 0.0% |
| Self-Employed (Not Incorporated) | 5 | 10.2% |
| Not-for-profit Organizations | 0 | 0.0% |
| Local Government Employees | 0 | 0.0% |
| State Government Employees | 4 | 8.2% |
| Federal Government Employees | 0 | 0.0% |
| Unpaid Family Workers | 0 | 0.0% |
| Total | 49 | 100.0% |
Employment Status by Age in Wheeler
According to the labor force statistics for Wheeler, out of the total population over 16 years of age (80), 66.3% or 53 individuals are in the labor force, with 7.5% or 4 of them unemployed. The age group with the highest labor force participation rate is 20 to 24 years, with 100.0% or 1 individuals in the labor force. Within the labor force, the 30 to 34 years age range has the highest percentage of unemployed individuals, with 37.5% or 3 of them being unemployed.
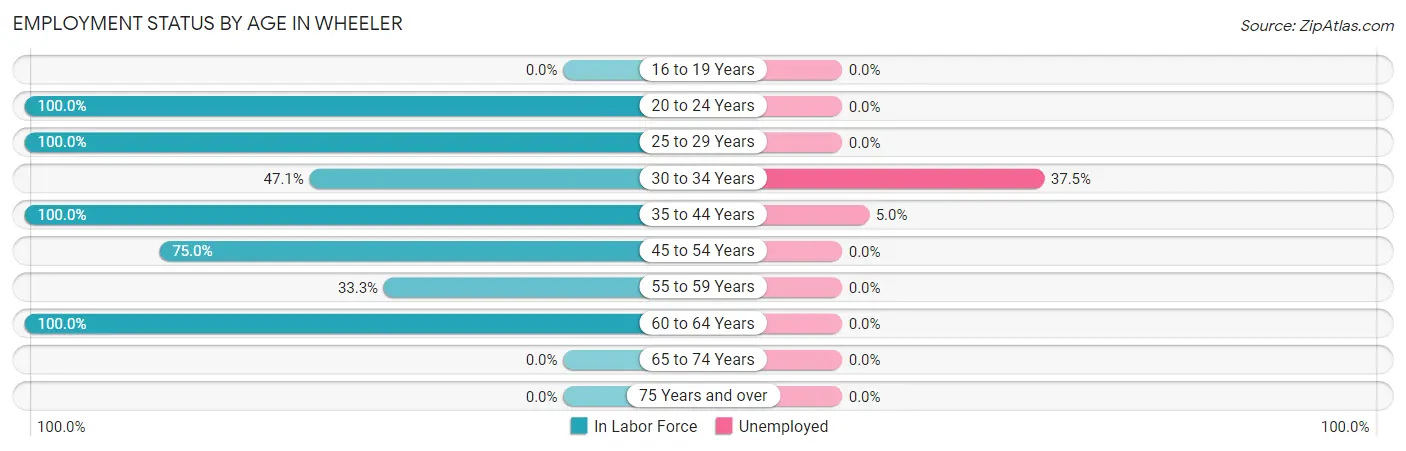
| Age Bracket | In Labor Force | Unemployed |
| 16 to 19 Years | 0 (0.0%) | 0 (0.0%) |
| 20 to 24 Years | 1 (100.0%) | 0 (0.0%) |
| 25 to 29 Years | 12 (100.0%) | 0 (0.0%) |
| 30 to 34 Years | 8 (47.1%) | 3 (37.5%) |
| 35 to 44 Years | 20 (100.0%) | 1 (5.0%) |
| 45 to 54 Years | 9 (75.0%) | 0 (0.0%) |
| 55 to 59 Years | 2 (33.3%) | 0 (0.0%) |
| 60 to 64 Years | 1 (100.0%) | 0 (0.0%) |
| 65 to 74 Years | 0 (0.0%) | 0 (0.0%) |
| 75 Years and over | 0 (0.0%) | 0 (0.0%) |
| Total | 53 (66.3%) | 4 (7.5%) |
Employment Status by Educational Attainment in Wheeler
According to labor force statistics for Wheeler, 76.5% of individuals (52) out of the total population between 25 and 64 years of age (68) are in the labor force, with 7.7% or 4 of them being unemployed. The group with the highest labor force participation rate are those with the educational attainment of high school diploma, with 93.5% or 29 individuals in the labor force. Within the labor force, individuals with high school diploma education have the highest percentage of unemployment, with 13.8% or 4 of them being unemployed.
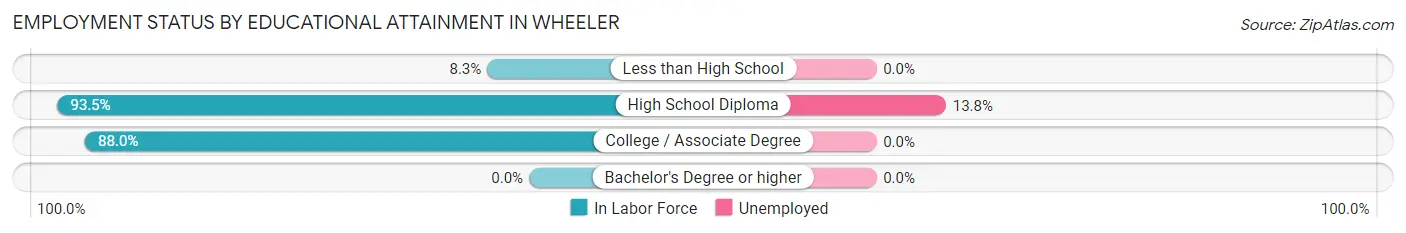
| Educational Attainment | In Labor Force | Unemployed |
| Less than High School | 1 (8.3%) | 0 (0.0%) |
| High School Diploma | 29 (93.5%) | 4 (13.8%) |
| College / Associate Degree | 22 (88.0%) | 0 (0.0%) |
| Bachelor's Degree or higher | 0 (0.0%) | 0 (0.0%) |
| Total | 52 (76.5%) | 5 (7.7%) |
Employment Occupations by Sex in Wheeler
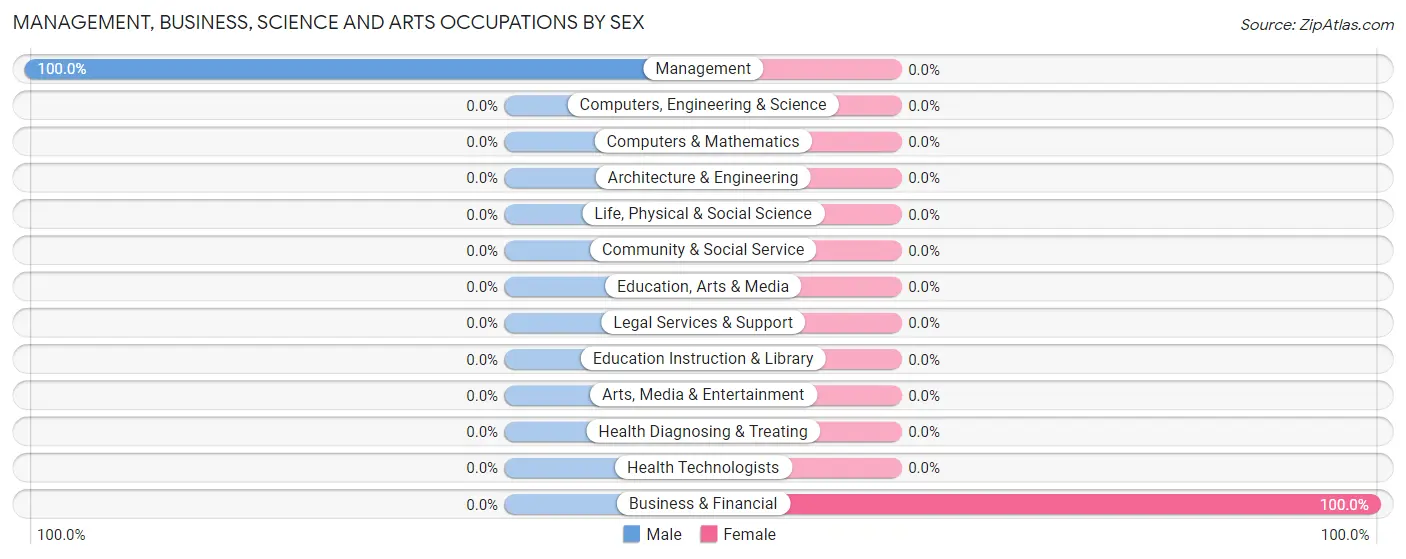
Management, Business, Science and Arts Occupations
The most common Management, Business, Science and Arts occupations in Wheeler are Management (2 | 4.1%), and Business & Financial (1 | 2.0%).
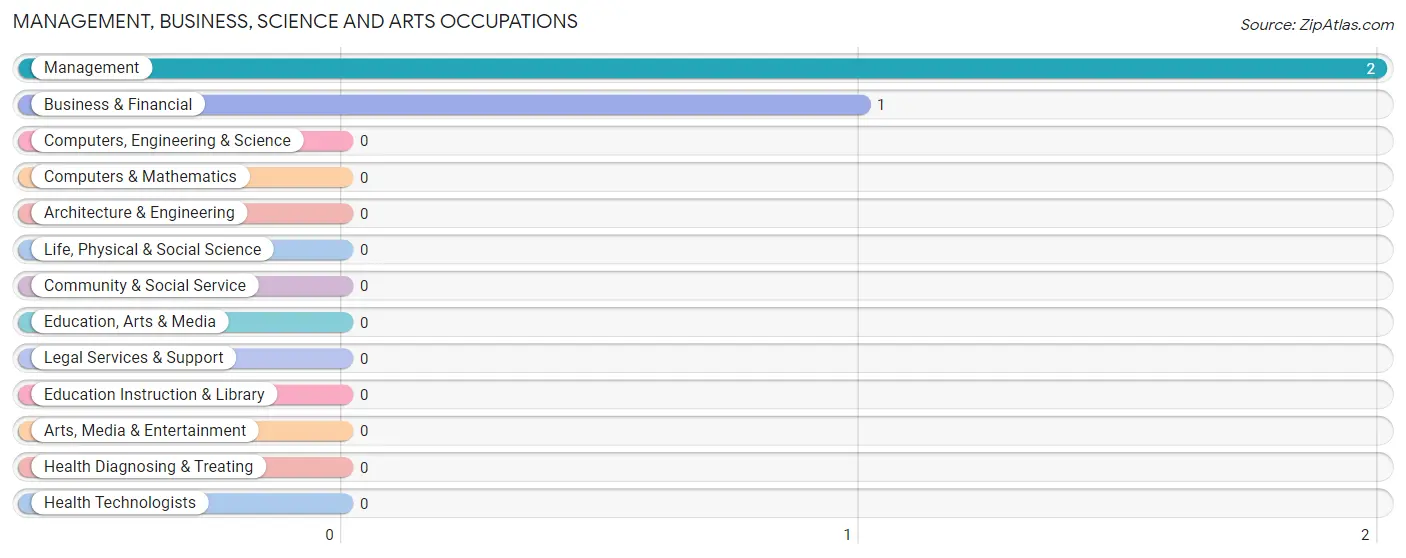
Management, Business, Science and Arts Occupations by Sex
| Occupation | Male | Female |
| Management | 2 (100.0%) | 0 (0.0%) |
| Business & Financial | 0 (0.0%) | 1 (100.0%) |
| Computers, Engineering & Science | 0 (0.0%) | 0 (0.0%) |
| Computers & Mathematics | 0 (0.0%) | 0 (0.0%) |
| Architecture & Engineering | 0 (0.0%) | 0 (0.0%) |
| Life, Physical & Social Science | 0 (0.0%) | 0 (0.0%) |
| Community & Social Service | 0 (0.0%) | 0 (0.0%) |
| Education, Arts & Media | 0 (0.0%) | 0 (0.0%) |
| Legal Services & Support | 0 (0.0%) | 0 (0.0%) |
| Education Instruction & Library | 0 (0.0%) | 0 (0.0%) |
| Arts, Media & Entertainment | 0 (0.0%) | 0 (0.0%) |
| Health Diagnosing & Treating | 0 (0.0%) | 0 (0.0%) |
| Health Technologists | 0 (0.0%) | 0 (0.0%) |
| Total (Category) | 2 (66.7%) | 1 (33.3%) |
| Total (Overall) | 33 (67.3%) | 16 (32.7%) |
Services Occupations
The most common Services occupations in Wheeler are Personal Care & Service (4 | 8.2%), and Healthcare Support (1 | 2.0%).
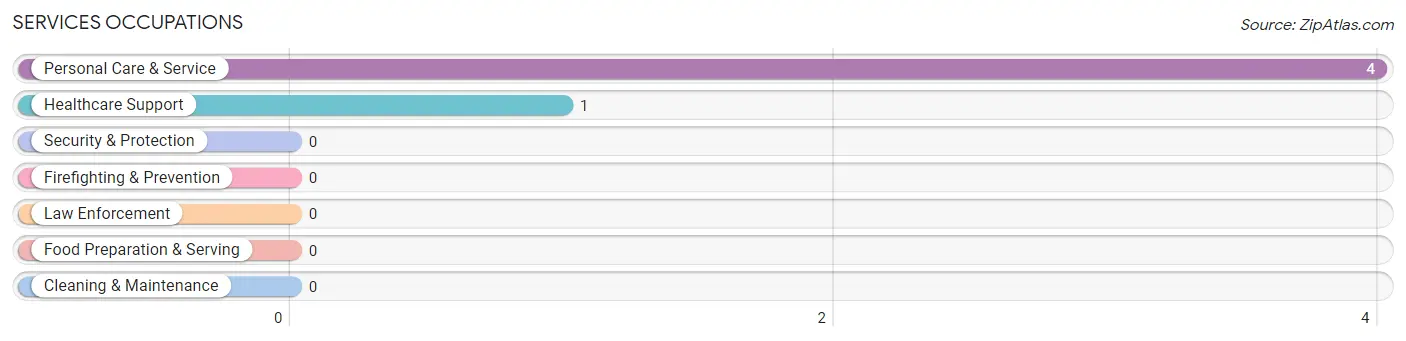
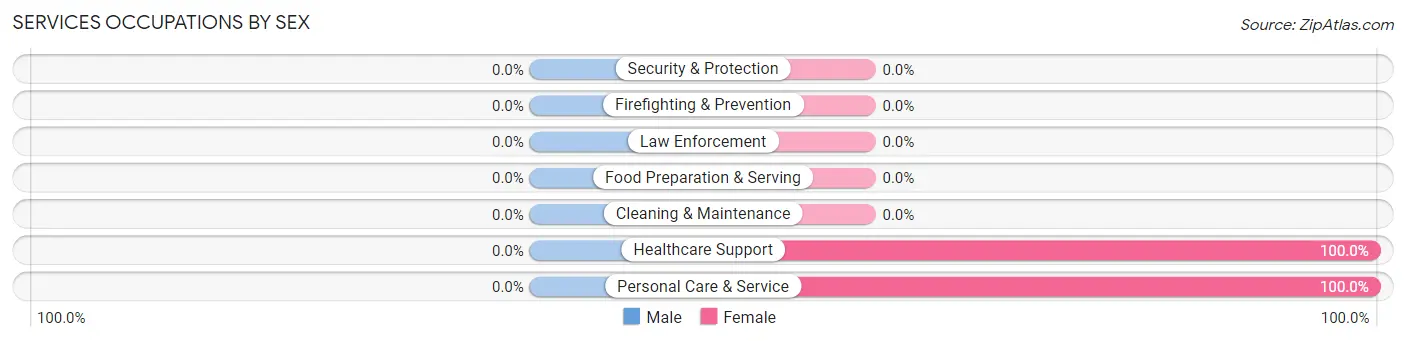
Services Occupations by Sex
| Occupation | Male | Female |
| Healthcare Support | 0 (0.0%) | 1 (100.0%) |
| Security & Protection | 0 (0.0%) | 0 (0.0%) |
| Firefighting & Prevention | 0 (0.0%) | 0 (0.0%) |
| Law Enforcement | 0 (0.0%) | 0 (0.0%) |
| Food Preparation & Serving | 0 (0.0%) | 0 (0.0%) |
| Cleaning & Maintenance | 0 (0.0%) | 0 (0.0%) |
| Personal Care & Service | 0 (0.0%) | 4 (100.0%) |
| Total (Category) | 0 (0.0%) | 5 (100.0%) |
| Total (Overall) | 33 (67.3%) | 16 (32.7%) |
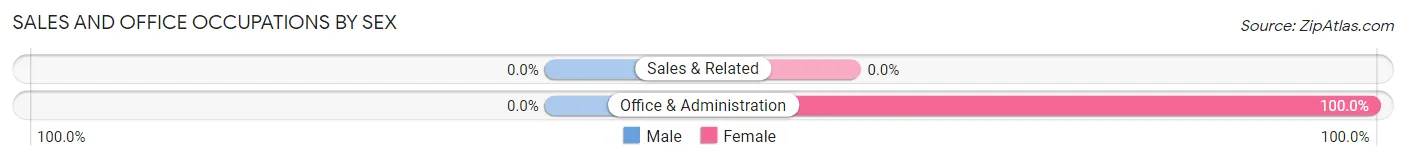
Sales and Office Occupations
The most common Sales and Office occupations in Wheeler are , and Office & Administration (5 | 10.2%).
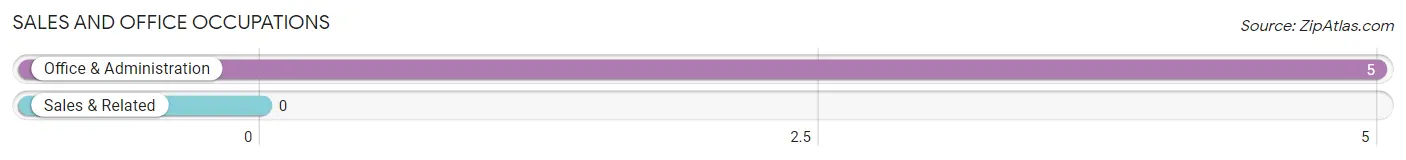
Sales and Office Occupations by Sex
| Occupation | Male | Female |
| Sales & Related | 0 (0.0%) | 0 (0.0%) |
| Office & Administration | 0 (0.0%) | 5 (100.0%) |
| Total (Category) | 0 (0.0%) | 5 (100.0%) |
| Total (Overall) | 33 (67.3%) | 16 (32.7%) |
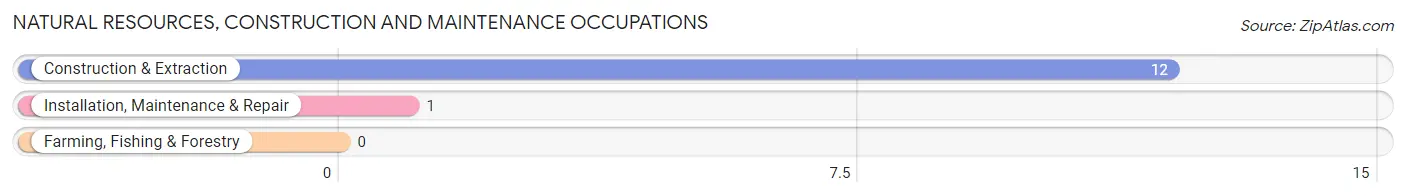
Natural Resources, Construction and Maintenance Occupations
The most common Natural Resources, Construction and Maintenance occupations in Wheeler are Construction & Extraction (12 | 24.5%), and Installation, Maintenance & Repair (1 | 2.0%).
Natural Resources, Construction and Maintenance Occupations by Sex
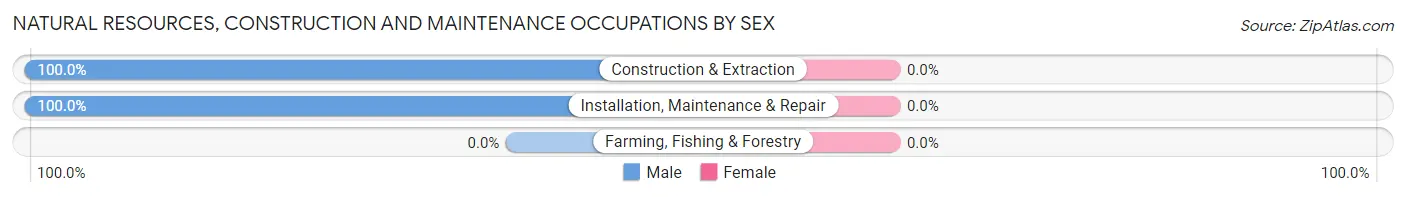
| Occupation | Male | Female |
| Farming, Fishing & Forestry | 0 (0.0%) | 0 (0.0%) |
| Construction & Extraction | 12 (100.0%) | 0 (0.0%) |
| Installation, Maintenance & Repair | 1 (100.0%) | 0 (0.0%) |
| Total (Category) | 13 (100.0%) | 0 (0.0%) |
| Total (Overall) | 33 (67.3%) | 16 (32.7%) |
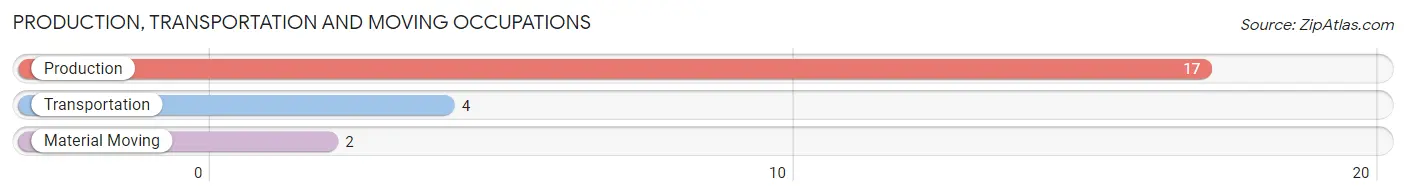
Production, Transportation and Moving Occupations
The most common Production, Transportation and Moving occupations in Wheeler are Production (17 | 34.7%), Transportation (4 | 8.2%), and Material Moving (2 | 4.1%).
Production, Transportation and Moving Occupations by Sex
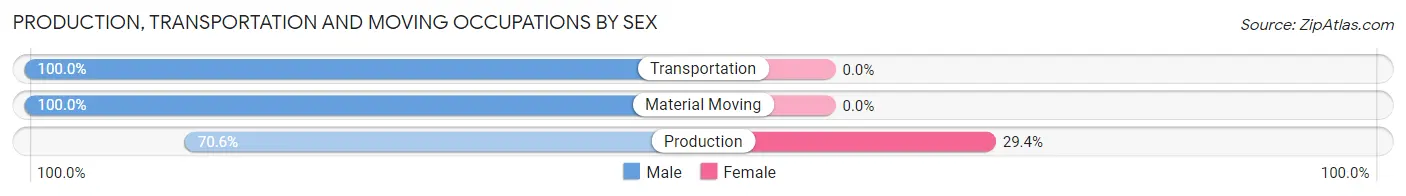
| Occupation | Male | Female |
| Production | 12 (70.6%) | 5 (29.4%) |
| Transportation | 4 (100.0%) | 0 (0.0%) |
| Material Moving | 2 (100.0%) | 0 (0.0%) |
| Total (Category) | 18 (78.3%) | 5 (21.7%) |
| Total (Overall) | 33 (67.3%) | 16 (32.7%) |
Employment Industries by Sex in Wheeler
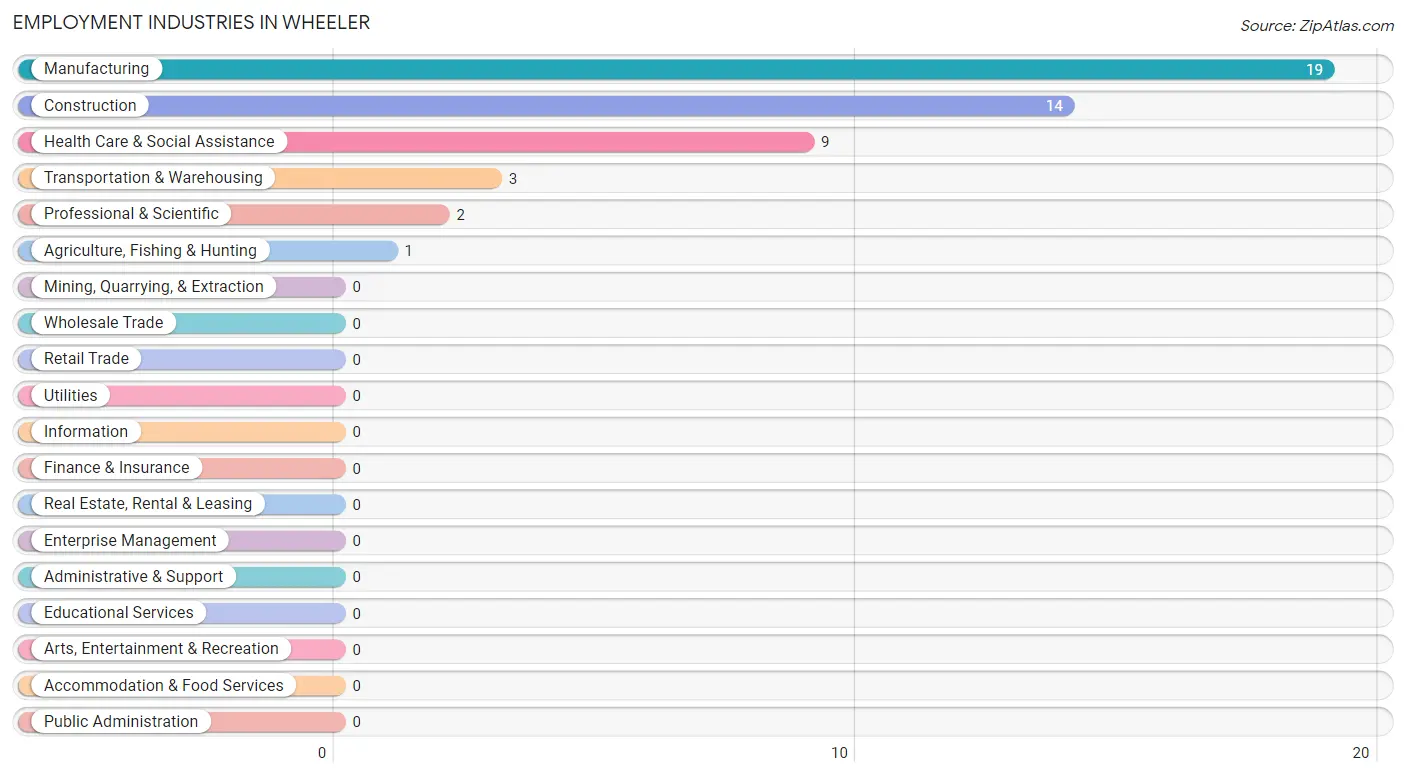
Employment Industries in Wheeler
The major employment industries in Wheeler include Manufacturing (19 | 38.8%), Construction (14 | 28.6%), Health Care & Social Assistance (9 | 18.4%), Transportation & Warehousing (3 | 6.1%), and Professional & Scientific (2 | 4.1%).
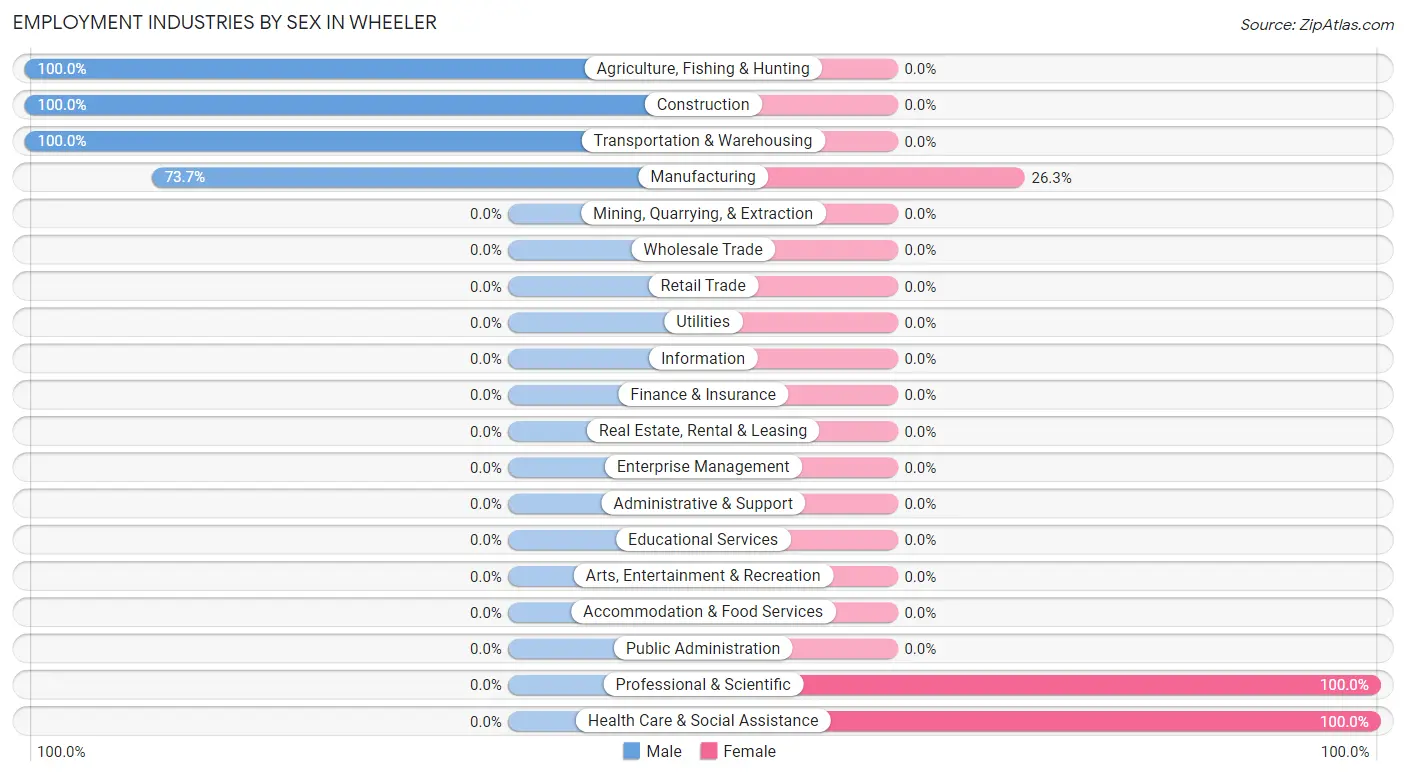
Employment Industries by Sex in Wheeler
The Wheeler industries that see more men than women are Agriculture, Fishing & Hunting (100.0%), Construction (100.0%), and Transportation & Warehousing (100.0%), whereas the industries that tend to have a higher number of women are Professional & Scientific (100.0%), Health Care & Social Assistance (100.0%), and Manufacturing (26.3%).
| Industry | Male | Female |
| Agriculture, Fishing & Hunting | 1 (100.0%) | 0 (0.0%) |
| Mining, Quarrying, & Extraction | 0 (0.0%) | 0 (0.0%) |
| Construction | 14 (100.0%) | 0 (0.0%) |
| Manufacturing | 14 (73.7%) | 5 (26.3%) |
| Wholesale Trade | 0 (0.0%) | 0 (0.0%) |
| Retail Trade | 0 (0.0%) | 0 (0.0%) |
| Transportation & Warehousing | 3 (100.0%) | 0 (0.0%) |
| Utilities | 0 (0.0%) | 0 (0.0%) |
| Information | 0 (0.0%) | 0 (0.0%) |
| Finance & Insurance | 0 (0.0%) | 0 (0.0%) |
| Real Estate, Rental & Leasing | 0 (0.0%) | 0 (0.0%) |
| Professional & Scientific | 0 (0.0%) | 2 (100.0%) |
| Enterprise Management | 0 (0.0%) | 0 (0.0%) |
| Administrative & Support | 0 (0.0%) | 0 (0.0%) |
| Educational Services | 0 (0.0%) | 0 (0.0%) |
| Health Care & Social Assistance | 0 (0.0%) | 9 (100.0%) |
| Arts, Entertainment & Recreation | 0 (0.0%) | 0 (0.0%) |
| Accommodation & Food Services | 0 (0.0%) | 0 (0.0%) |
| Public Administration | 0 (0.0%) | 0 (0.0%) |
| Total | 33 (67.3%) | 16 (32.7%) |
Education in Wheeler
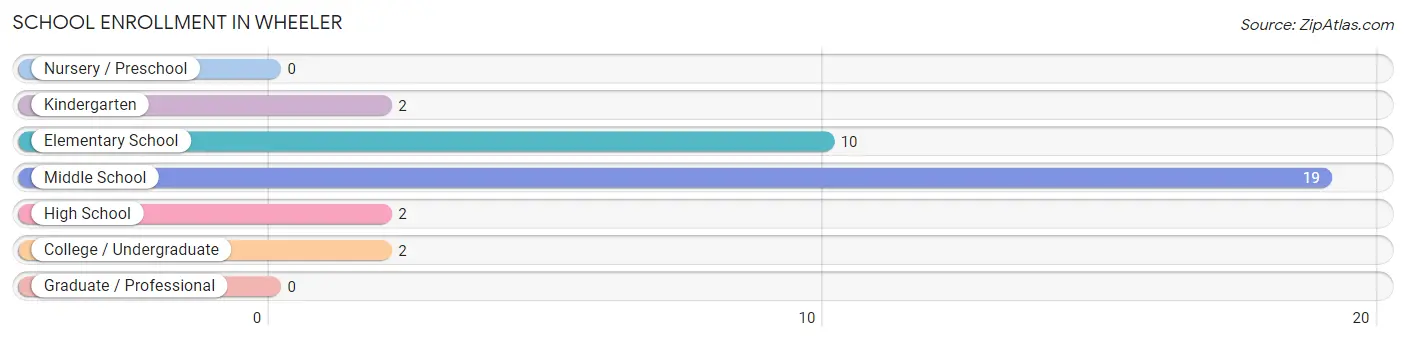
School Enrollment in Wheeler
The most common levels of schooling among the 35 students in Wheeler are middle school (19 | 54.3%), elementary school (10 | 28.6%), and kindergarten (2 | 5.7%).
| School Level | # Students | % Students |
| Nursery / Preschool | 0 | 0.0% |
| Kindergarten | 2 | 5.7% |
| Elementary School | 10 | 28.6% |
| Middle School | 19 | 54.3% |
| High School | 2 | 5.7% |
| College / Undergraduate | 2 | 5.7% |
| Graduate / Professional | 0 | 0.0% |
| Total | 35 | 100.0% |
School Enrollment by Age by Funding Source in Wheeler
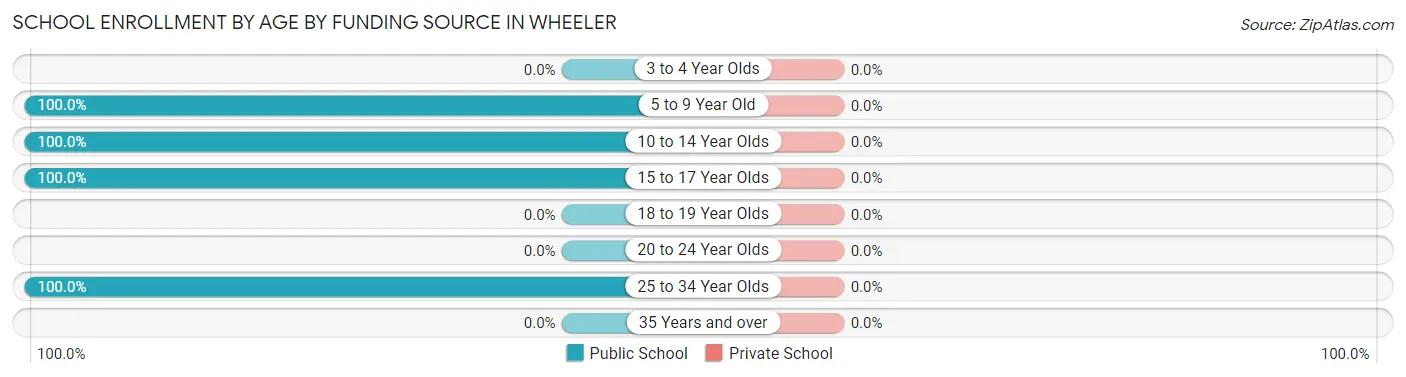
| Age Bracket | Public School | Private School |
| 3 to 4 Year Olds | 0 (0.0%) | 0 (0.0%) |
| 5 to 9 Year Old | 12 (100.0%) | 0 (0.0%) |
| 10 to 14 Year Olds | 19 (100.0%) | 0 (0.0%) |
| 15 to 17 Year Olds | 2 (100.0%) | 0 (0.0%) |
| 18 to 19 Year Olds | 0 (0.0%) | 0 (0.0%) |
| 20 to 24 Year Olds | 0 (0.0%) | 0 (0.0%) |
| 25 to 34 Year Olds | 2 (100.0%) | 0 (0.0%) |
| 35 Years and over | 0 (0.0%) | 0 (0.0%) |
| Total | 35 (100.0%) | 0 (0.0%) |
Educational Attainment by Field of Study in Wheeler
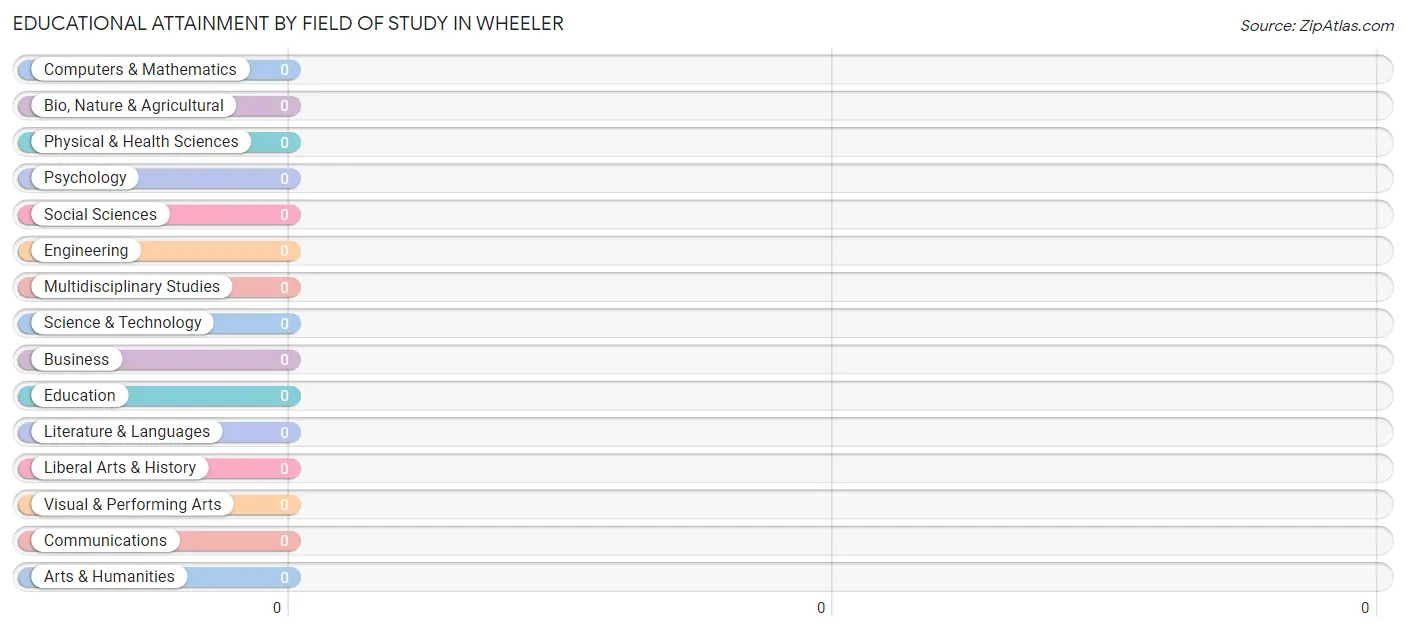
| Field of Study | # Graduates | % Graduates |
| Computers & Mathematics | 0 | 0.0% |
| Bio, Nature & Agricultural | 0 | 0.0% |
| Physical & Health Sciences | 0 | 0.0% |
| Psychology | 0 | 0.0% |
| Social Sciences | 0 | 0.0% |
| Engineering | 0 | 0.0% |
| Multidisciplinary Studies | 0 | 0.0% |
| Science & Technology | 0 | 0.0% |
| Business | 0 | 0.0% |
| Education | 0 | 0.0% |
| Literature & Languages | 0 | 0.0% |
| Liberal Arts & History | 0 | 0.0% |
| Visual & Performing Arts | 0 | 0.0% |
| Communications | 0 | 0.0% |
| Arts & Humanities | 0 | 0.0% |
| Total | 0 | 0.0% |
Transportation & Commute in Wheeler
Vehicle Availability by Sex in Wheeler
The most prevalent vehicle ownership categories in Wheeler are males with 1 vehicle (14, accounting for 42.4%) and females with 1 vehicle (5, making up 87.5%).
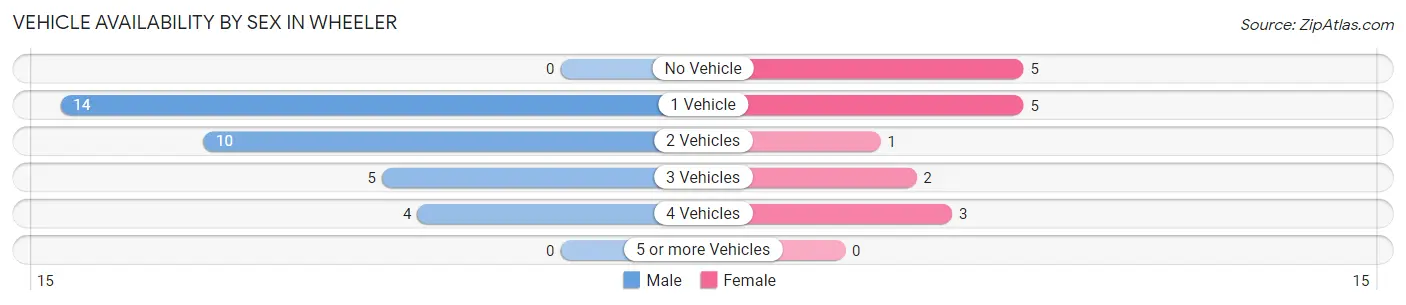
| Vehicles Available | Male | Female |
| No Vehicle | 0 (0.0%) | 5 (31.2%) |
| 1 Vehicle | 14 (42.4%) | 5 (31.2%) |
| 2 Vehicles | 10 (30.3%) | 1 (6.2%) |
| 3 Vehicles | 5 (15.1%) | 2 (12.5%) |
| 4 Vehicles | 4 (12.1%) | 3 (18.8%) |
| 5 or more Vehicles | 0 (0.0%) | 0 (0.0%) |
| Total | 33 (100.0%) | 16 (100.0%) |
Commute Time in Wheeler
The most frequently occuring commute durations in Wheeler are 30 to 34 minutes (12 commuters, 25.0%), 45 to 59 minutes (12 commuters, 25.0%), and 15 to 19 minutes (11 commuters, 22.9%).
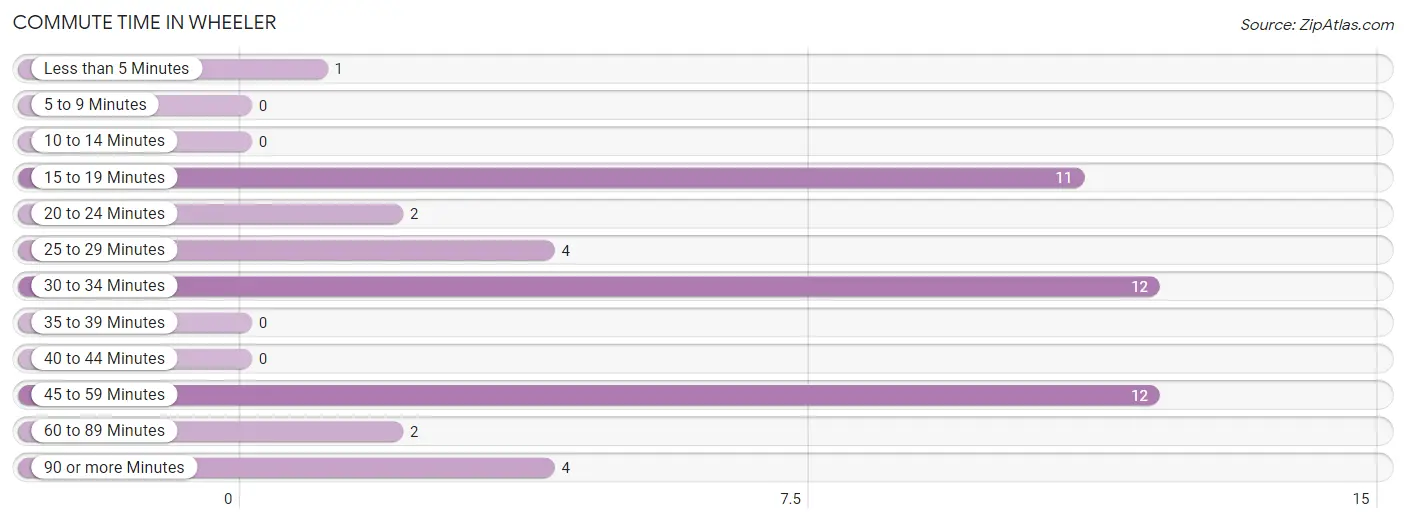
| Commute Time | # Commuters | % Commuters |
| Less than 5 Minutes | 1 | 2.1% |
| 5 to 9 Minutes | 0 | 0.0% |
| 10 to 14 Minutes | 0 | 0.0% |
| 15 to 19 Minutes | 11 | 22.9% |
| 20 to 24 Minutes | 2 | 4.2% |
| 25 to 29 Minutes | 4 | 8.3% |
| 30 to 34 Minutes | 12 | 25.0% |
| 35 to 39 Minutes | 0 | 0.0% |
| 40 to 44 Minutes | 0 | 0.0% |
| 45 to 59 Minutes | 12 | 25.0% |
| 60 to 89 Minutes | 2 | 4.2% |
| 90 or more Minutes | 4 | 8.3% |
Commute Time by Sex in Wheeler
The most common commute times in Wheeler are 45 to 59 minutes (12 commuters, 36.4%) for males and 30 to 34 minutes (6 commuters, 40.0%) for females.
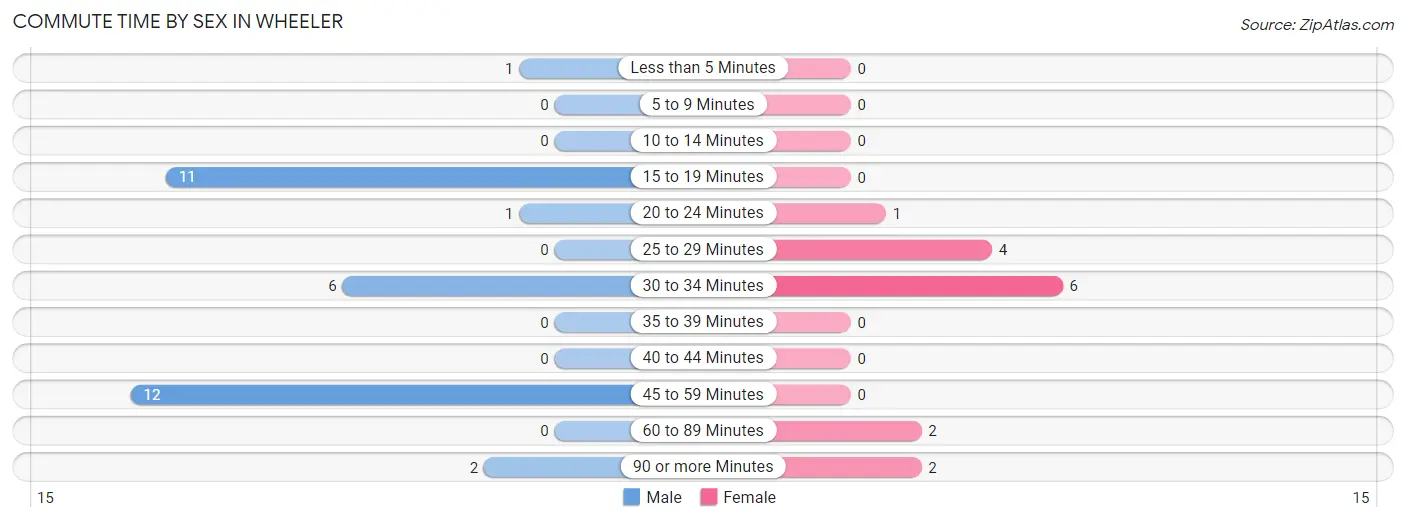
| Commute Time | Male | Female |
| Less than 5 Minutes | 1 (3.0%) | 0 (0.0%) |
| 5 to 9 Minutes | 0 (0.0%) | 0 (0.0%) |
| 10 to 14 Minutes | 0 (0.0%) | 0 (0.0%) |
| 15 to 19 Minutes | 11 (33.3%) | 0 (0.0%) |
| 20 to 24 Minutes | 1 (3.0%) | 1 (6.7%) |
| 25 to 29 Minutes | 0 (0.0%) | 4 (26.7%) |
| 30 to 34 Minutes | 6 (18.2%) | 6 (40.0%) |
| 35 to 39 Minutes | 0 (0.0%) | 0 (0.0%) |
| 40 to 44 Minutes | 0 (0.0%) | 0 (0.0%) |
| 45 to 59 Minutes | 12 (36.4%) | 0 (0.0%) |
| 60 to 89 Minutes | 0 (0.0%) | 2 (13.3%) |
| 90 or more Minutes | 2 (6.1%) | 2 (13.3%) |
Time of Departure to Work by Sex in Wheeler
The most frequent times of departure to work in Wheeler are 5:00 AM to 5:29 AM (12, 36.4%) for males and 8:30 AM to 8:59 AM (6, 40.0%) for females.
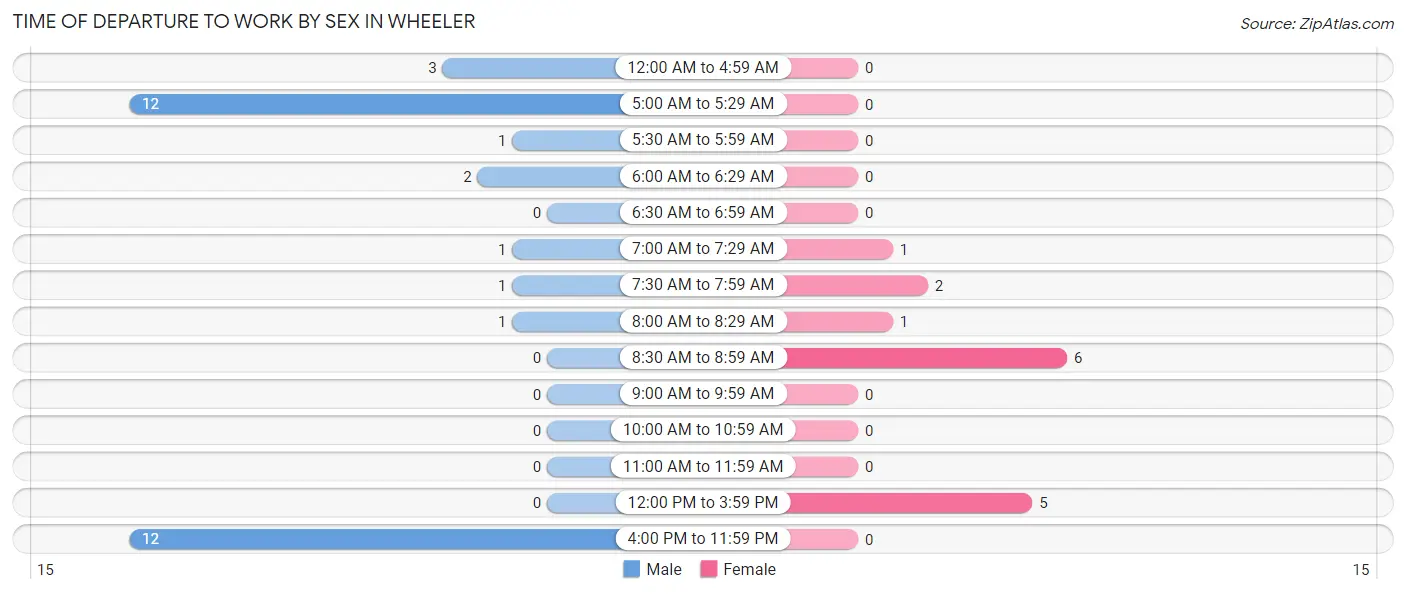
| Time of Departure | Male | Female |
| 12:00 AM to 4:59 AM | 3 (9.1%) | 0 (0.0%) |
| 5:00 AM to 5:29 AM | 12 (36.4%) | 0 (0.0%) |
| 5:30 AM to 5:59 AM | 1 (3.0%) | 0 (0.0%) |
| 6:00 AM to 6:29 AM | 2 (6.1%) | 0 (0.0%) |
| 6:30 AM to 6:59 AM | 0 (0.0%) | 0 (0.0%) |
| 7:00 AM to 7:29 AM | 1 (3.0%) | 1 (6.7%) |
| 7:30 AM to 7:59 AM | 1 (3.0%) | 2 (13.3%) |
| 8:00 AM to 8:29 AM | 1 (3.0%) | 1 (6.7%) |
| 8:30 AM to 8:59 AM | 0 (0.0%) | 6 (40.0%) |
| 9:00 AM to 9:59 AM | 0 (0.0%) | 0 (0.0%) |
| 10:00 AM to 10:59 AM | 0 (0.0%) | 0 (0.0%) |
| 11:00 AM to 11:59 AM | 0 (0.0%) | 0 (0.0%) |
| 12:00 PM to 3:59 PM | 0 (0.0%) | 5 (33.3%) |
| 4:00 PM to 11:59 PM | 12 (36.4%) | 0 (0.0%) |
| Total | 33 (100.0%) | 15 (100.0%) |
Housing Occupancy in Wheeler
Occupancy by Ownership in Wheeler
Of the total 43 dwellings in Wheeler, owner-occupied units account for 28 (65.1%), while renter-occupied units make up 15 (34.9%).
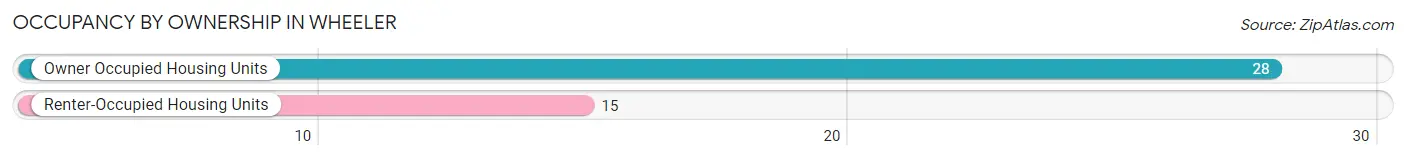
| Occupancy | # Housing Units | % Housing Units |
| Owner Occupied Housing Units | 28 | 65.1% |
| Renter-Occupied Housing Units | 15 | 34.9% |
| Total Occupied Housing Units | 43 | 100.0% |
Occupancy by Household Size in Wheeler
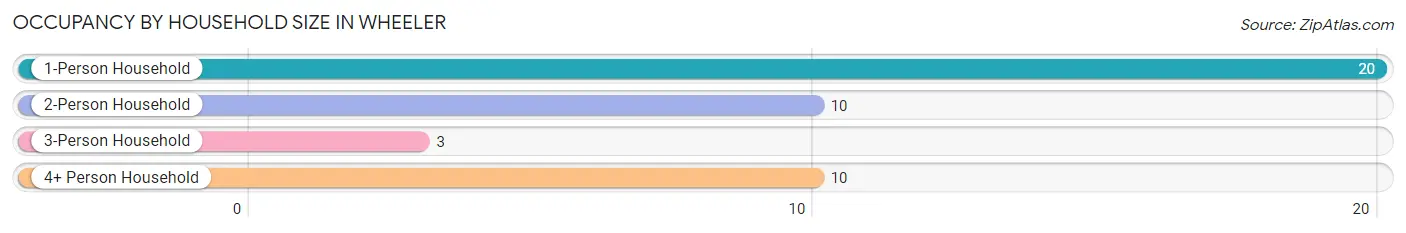
| Household Size | # Housing Units | % Housing Units |
| 1-Person Household | 20 | 46.5% |
| 2-Person Household | 10 | 23.3% |
| 3-Person Household | 3 | 7.0% |
| 4+ Person Household | 10 | 23.3% |
| Total Housing Units | 43 | 100.0% |
Occupancy by Ownership by Household Size in Wheeler
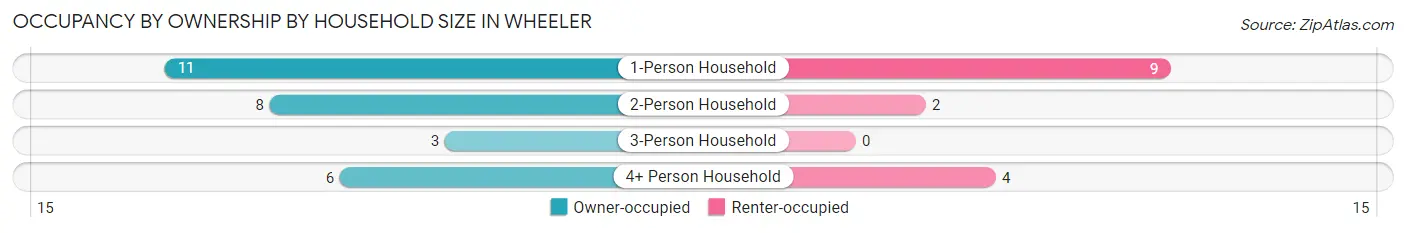
| Household Size | Owner-occupied | Renter-occupied |
| 1-Person Household | 11 (55.0%) | 9 (45.0%) |
| 2-Person Household | 8 (80.0%) | 2 (20.0%) |
| 3-Person Household | 3 (100.0%) | 0 (0.0%) |
| 4+ Person Household | 6 (60.0%) | 4 (40.0%) |
| Total Housing Units | 28 (65.1%) | 15 (34.9%) |
Occupancy by Educational Attainment in Wheeler
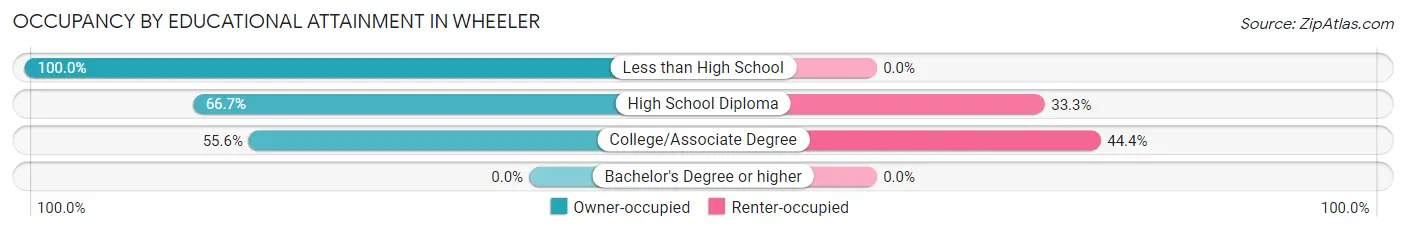
| Household Size | Owner-occupied | Renter-occupied |
| Less than High School | 1 (100.0%) | 0 (0.0%) |
| High School Diploma | 22 (66.7%) | 11 (33.3%) |
| College/Associate Degree | 5 (55.6%) | 4 (44.4%) |
| Bachelor's Degree or higher | 0 (0.0%) | 0 (0.0%) |
Occupancy by Age of Householder in Wheeler

| Age Bracket | # Households | % Households |
| Under 35 Years | 19 | 44.2% |
| 35 to 44 Years | 7 | 16.3% |
| 45 to 54 Years | 6 | 14.0% |
| 55 to 64 Years | 3 | 7.0% |
| 65 to 74 Years | 1 | 2.3% |
| 75 to 84 Years | 4 | 9.3% |
| 85 Years and Over | 3 | 7.0% |
| Total | 43 | 100.0% |
Housing Finances in Wheeler
Median Income by Occupancy in Wheeler
| Occupancy Type | # Households | Median Income |
| Owner-Occupied | 28 (65.1%) | $0 |
| Renter-Occupied | 15 (34.9%) | $0 |
| Average | 43 (100.0%) | $0 |
Occupancy by Householder Income Bracket in Wheeler
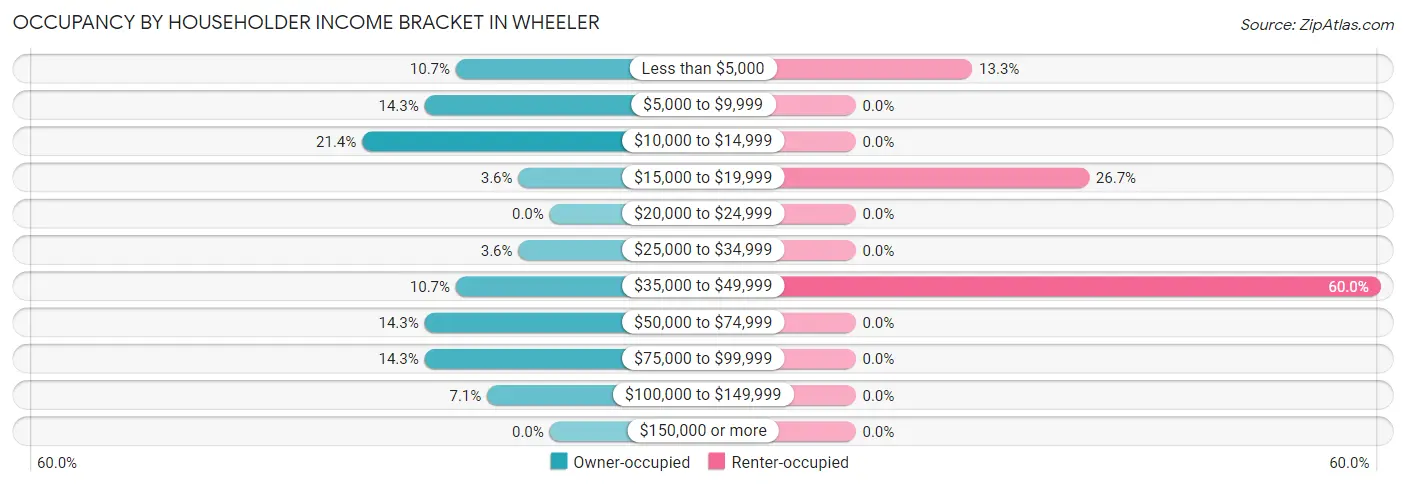
| Income Bracket | Owner-occupied | Renter-occupied |
| Less than $5,000 | 3 (10.7%) | 2 (13.3%) |
| $5,000 to $9,999 | 4 (14.3%) | 0 (0.0%) |
| $10,000 to $14,999 | 6 (21.4%) | 0 (0.0%) |
| $15,000 to $19,999 | 1 (3.6%) | 4 (26.7%) |
| $20,000 to $24,999 | 0 (0.0%) | 0 (0.0%) |
| $25,000 to $34,999 | 1 (3.6%) | 0 (0.0%) |
| $35,000 to $49,999 | 3 (10.7%) | 9 (60.0%) |
| $50,000 to $74,999 | 4 (14.3%) | 0 (0.0%) |
| $75,000 to $99,999 | 4 (14.3%) | 0 (0.0%) |
| $100,000 to $149,999 | 2 (7.1%) | 0 (0.0%) |
| $150,000 or more | 0 (0.0%) | 0 (0.0%) |
| Total | 28 (100.0%) | 15 (100.0%) |
Monthly Housing Cost Tiers in Wheeler
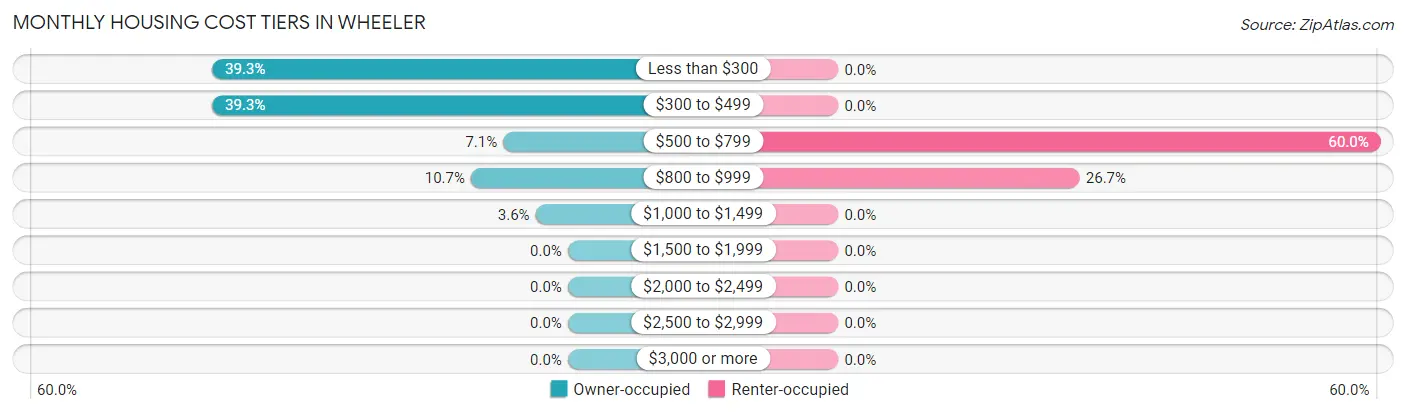
| Monthly Cost | Owner-occupied | Renter-occupied |
| Less than $300 | 11 (39.3%) | 0 (0.0%) |
| $300 to $499 | 11 (39.3%) | 0 (0.0%) |
| $500 to $799 | 2 (7.1%) | 9 (60.0%) |
| $800 to $999 | 3 (10.7%) | 4 (26.7%) |
| $1,000 to $1,499 | 1 (3.6%) | 0 (0.0%) |
| $1,500 to $1,999 | 0 (0.0%) | 0 (0.0%) |
| $2,000 to $2,499 | 0 (0.0%) | 0 (0.0%) |
| $2,500 to $2,999 | 0 (0.0%) | 0 (0.0%) |
| $3,000 or more | 0 (0.0%) | 0 (0.0%) |
| Total | 28 (100.0%) | 15 (100.0%) |
Physical Housing Characteristics in Wheeler
Housing Structures in Wheeler
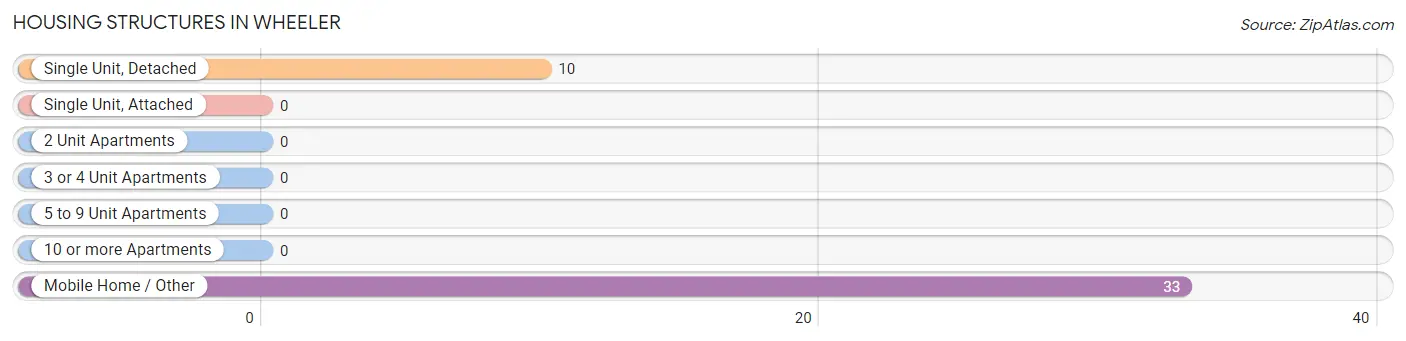
| Structure Type | # Housing Units | % Housing Units |
| Single Unit, Detached | 10 | 23.3% |
| Single Unit, Attached | 0 | 0.0% |
| 2 Unit Apartments | 0 | 0.0% |
| 3 or 4 Unit Apartments | 0 | 0.0% |
| 5 to 9 Unit Apartments | 0 | 0.0% |
| 10 or more Apartments | 0 | 0.0% |
| Mobile Home / Other | 33 | 76.7% |
| Total | 43 | 100.0% |
Housing Structures by Occupancy in Wheeler
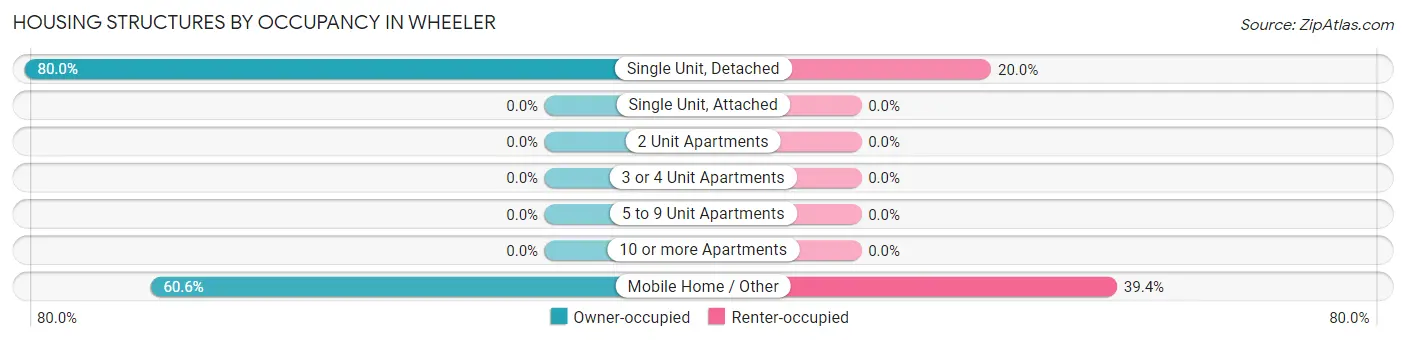
| Structure Type | Owner-occupied | Renter-occupied |
| Single Unit, Detached | 8 (80.0%) | 2 (20.0%) |
| Single Unit, Attached | 0 (0.0%) | 0 (0.0%) |
| 2 Unit Apartments | 0 (0.0%) | 0 (0.0%) |
| 3 or 4 Unit Apartments | 0 (0.0%) | 0 (0.0%) |
| 5 to 9 Unit Apartments | 0 (0.0%) | 0 (0.0%) |
| 10 or more Apartments | 0 (0.0%) | 0 (0.0%) |
| Mobile Home / Other | 20 (60.6%) | 13 (39.4%) |
| Total | 28 (65.1%) | 15 (34.9%) |
Housing Structures by Number of Rooms in Wheeler
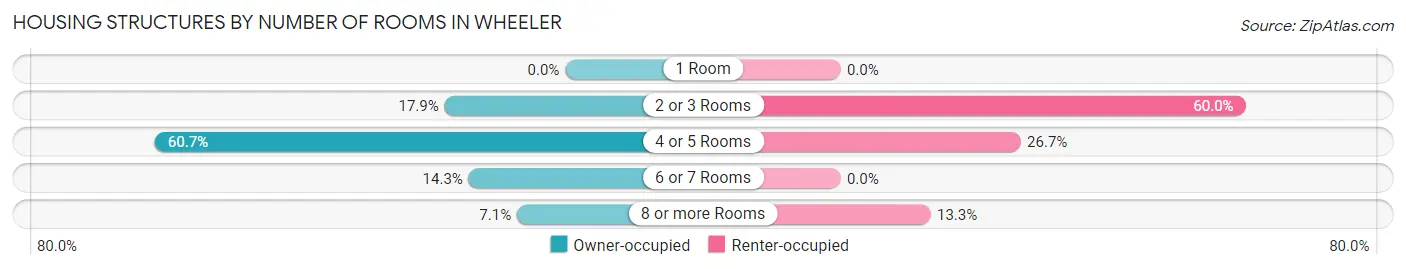
| Number of Rooms | Owner-occupied | Renter-occupied |
| 1 Room | 0 (0.0%) | 0 (0.0%) |
| 2 or 3 Rooms | 5 (17.9%) | 9 (60.0%) |
| 4 or 5 Rooms | 17 (60.7%) | 4 (26.7%) |
| 6 or 7 Rooms | 4 (14.3%) | 0 (0.0%) |
| 8 or more Rooms | 2 (7.1%) | 2 (13.3%) |
| Total | 28 (100.0%) | 15 (100.0%) |
Housing Structure by Heating Type in Wheeler
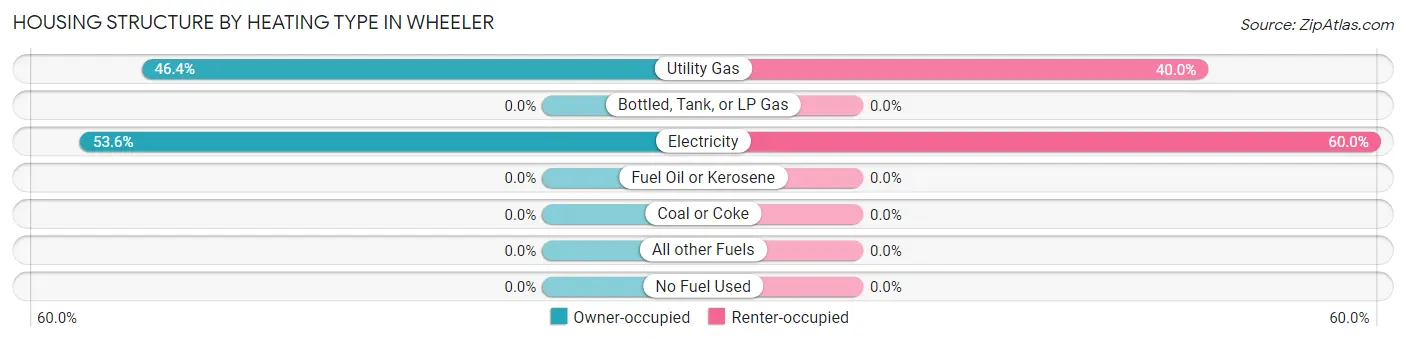
| Heating Type | Owner-occupied | Renter-occupied |
| Utility Gas | 13 (46.4%) | 6 (40.0%) |
| Bottled, Tank, or LP Gas | 0 (0.0%) | 0 (0.0%) |
| Electricity | 15 (53.6%) | 9 (60.0%) |
| Fuel Oil or Kerosene | 0 (0.0%) | 0 (0.0%) |
| Coal or Coke | 0 (0.0%) | 0 (0.0%) |
| All other Fuels | 0 (0.0%) | 0 (0.0%) |
| No Fuel Used | 0 (0.0%) | 0 (0.0%) |
| Total | 28 (100.0%) | 15 (100.0%) |
Household Vehicle Usage in Wheeler
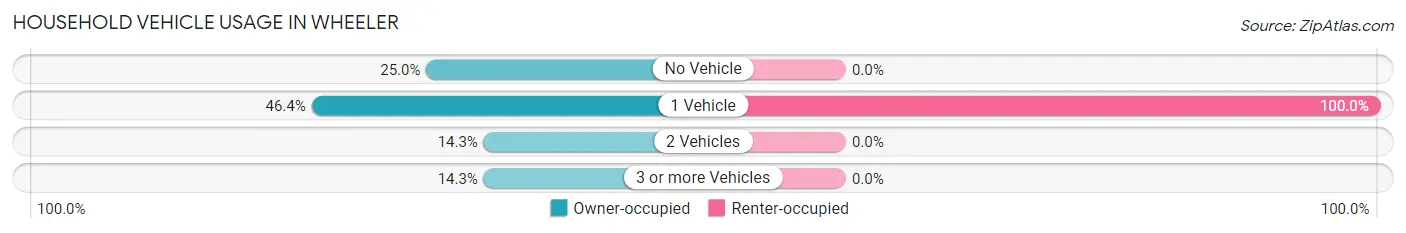
| Vehicles per Household | Owner-occupied | Renter-occupied |
| No Vehicle | 7 (25.0%) | 0 (0.0%) |
| 1 Vehicle | 13 (46.4%) | 15 (100.0%) |
| 2 Vehicles | 4 (14.3%) | 0 (0.0%) |
| 3 or more Vehicles | 4 (14.3%) | 0 (0.0%) |
| Total | 28 (100.0%) | 15 (100.0%) |
Real Estate & Mortgages in Wheeler
Real Estate and Mortgage Overview in Wheeler
| Characteristic | Without Mortgage | With Mortgage |
| Housing Units | 22 | 6 |
| Median Property Value | $12,500 | $0 |
| Median Household Income | - | - |
| Monthly Housing Costs | $300 | $0 |
| Real Estate Taxes | - | - |
Property Value by Mortgage Status in Wheeler
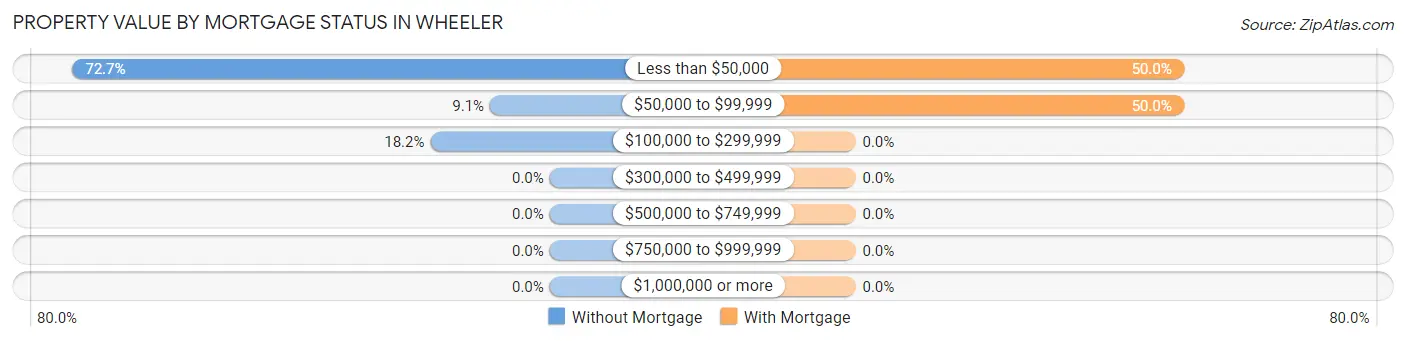
| Property Value | Without Mortgage | With Mortgage |
| Less than $50,000 | 16 (72.7%) | 3 (50.0%) |
| $50,000 to $99,999 | 2 (9.1%) | 3 (50.0%) |
| $100,000 to $299,999 | 4 (18.2%) | 0 (0.0%) |
| $300,000 to $499,999 | 0 (0.0%) | 0 (0.0%) |
| $500,000 to $749,999 | 0 (0.0%) | 0 (0.0%) |
| $750,000 to $999,999 | 0 (0.0%) | 0 (0.0%) |
| $1,000,000 or more | 0 (0.0%) | 0 (0.0%) |
| Total | 22 (100.0%) | 6 (100.0%) |
Household Income by Mortgage Status in Wheeler
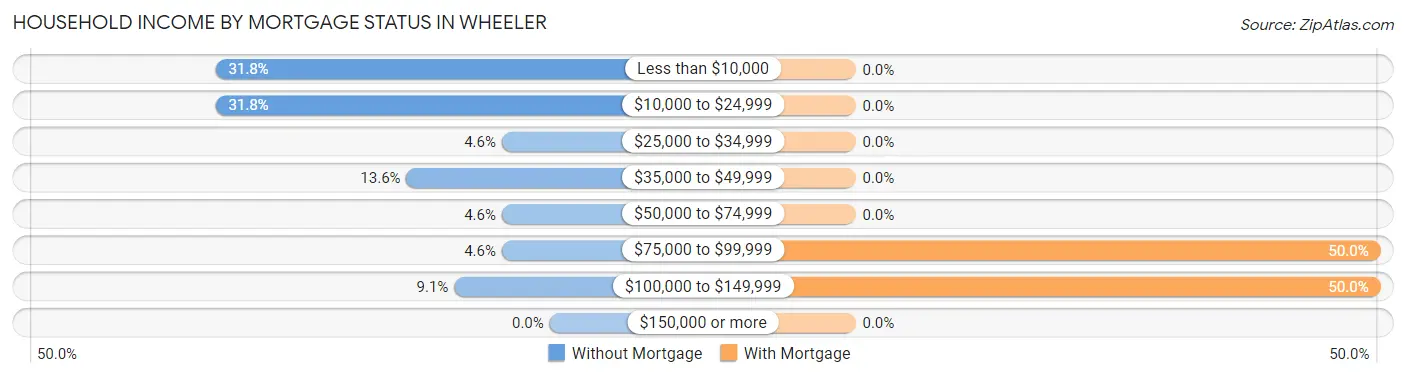
| Household Income | Without Mortgage | With Mortgage |
| Less than $10,000 | 7 (31.8%) | 0 (0.0%) |
| $10,000 to $24,999 | 7 (31.8%) | 0 (0.0%) |
| $25,000 to $34,999 | 1 (4.5%) | 0 (0.0%) |
| $35,000 to $49,999 | 3 (13.6%) | 0 (0.0%) |
| $50,000 to $74,999 | 1 (4.5%) | 0 (0.0%) |
| $75,000 to $99,999 | 1 (4.5%) | 3 (50.0%) |
| $100,000 to $149,999 | 2 (9.1%) | 3 (50.0%) |
| $150,000 or more | 0 (0.0%) | 0 (0.0%) |
| Total | 22 (100.0%) | 6 (100.0%) |
Property Value to Household Income Ratio in Wheeler
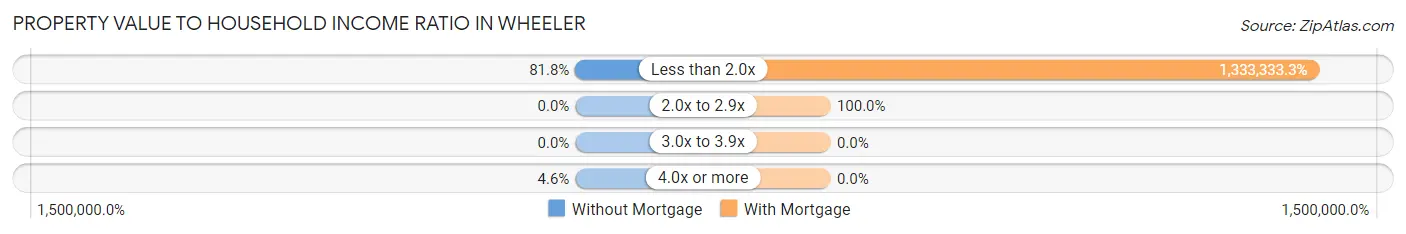
| Value-to-Income Ratio | Without Mortgage | With Mortgage |
| Less than 2.0x | 18 (81.8%) | 80,000 (1,333,333.3%) |
| 2.0x to 2.9x | 0 (0.0%) | 6 (100.0%) |
| 3.0x to 3.9x | 0 (0.0%) | 0 (0.0%) |
| 4.0x or more | 1 (4.5%) | 0 (0.0%) |
| Total | 22 (100.0%) | 6 (100.0%) |
Real Estate Taxes by Mortgage Status in Wheeler
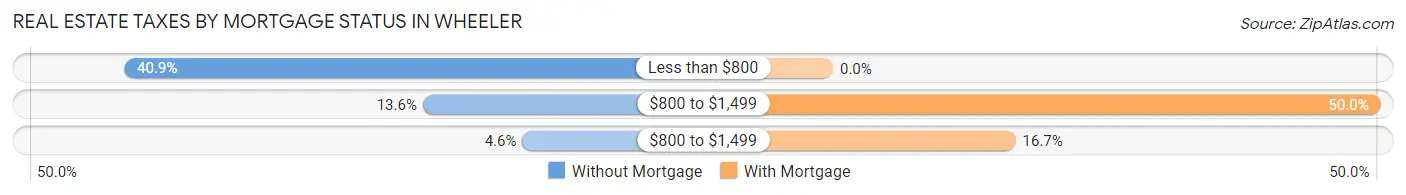
| Property Taxes | Without Mortgage | With Mortgage |
| Less than $800 | 9 (40.9%) | 0 (0.0%) |
| $800 to $1,499 | 3 (13.6%) | 3 (50.0%) |
| $800 to $1,499 | 1 (4.5%) | 1 (16.7%) |
| Total | 22 (100.0%) | 6 (100.0%) |
Health & Disability in Wheeler
Health Insurance Coverage by Age in Wheeler
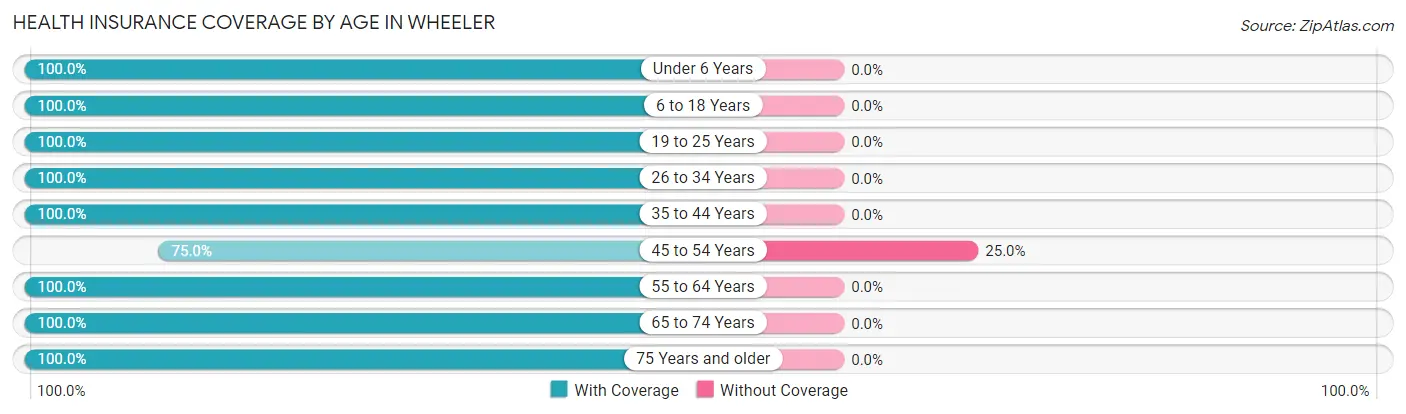
| Age Bracket | With Coverage | Without Coverage |
| Under 6 Years | 12 (100.0%) | 0 (0.0%) |
| 6 to 18 Years | 31 (100.0%) | 0 (0.0%) |
| 19 to 25 Years | 1 (100.0%) | 0 (0.0%) |
| 26 to 34 Years | 29 (100.0%) | 0 (0.0%) |
| 35 to 44 Years | 20 (100.0%) | 0 (0.0%) |
| 45 to 54 Years | 9 (75.0%) | 3 (25.0%) |
| 55 to 64 Years | 7 (100.0%) | 0 (0.0%) |
| 65 to 74 Years | 2 (100.0%) | 0 (0.0%) |
| 75 Years and older | 9 (100.0%) | 0 (0.0%) |
| Total | 120 (97.6%) | 3 (2.4%) |
Health Insurance Coverage by Citizenship Status in Wheeler
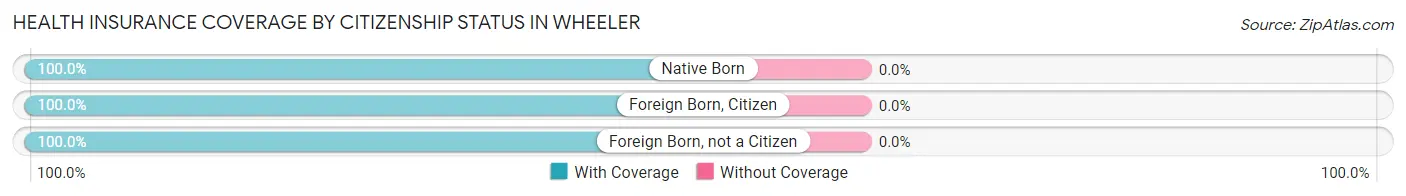
| Citizenship Status | With Coverage | Without Coverage |
| Native Born | 12 (100.0%) | 0 (0.0%) |
| Foreign Born, Citizen | 31 (100.0%) | 0 (0.0%) |
| Foreign Born, not a Citizen | 1 (100.0%) | 0 (0.0%) |
Health Insurance Coverage by Household Income in Wheeler
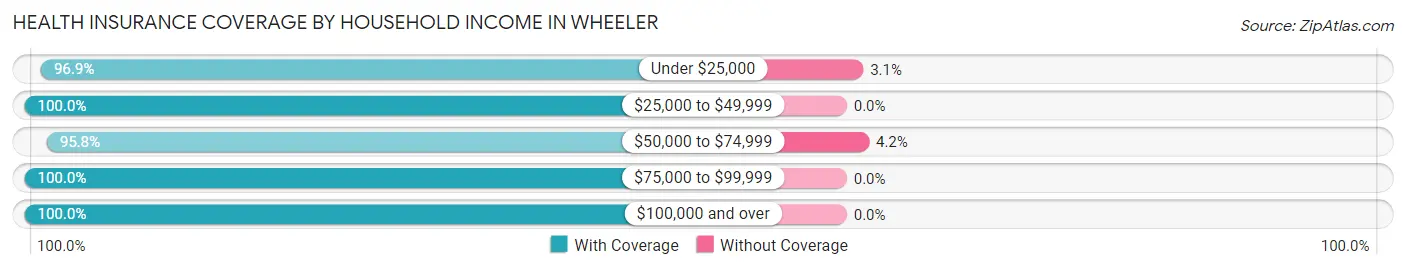
| Household Income | With Coverage | Without Coverage |
| Under $25,000 | 63 (96.9%) | 2 (3.1%) |
| $25,000 to $49,999 | 15 (100.0%) | 0 (0.0%) |
| $50,000 to $74,999 | 23 (95.8%) | 1 (4.2%) |
| $75,000 to $99,999 | 17 (100.0%) | 0 (0.0%) |
| $100,000 and over | 2 (100.0%) | 0 (0.0%) |
Public vs Private Health Insurance Coverage by Age in Wheeler
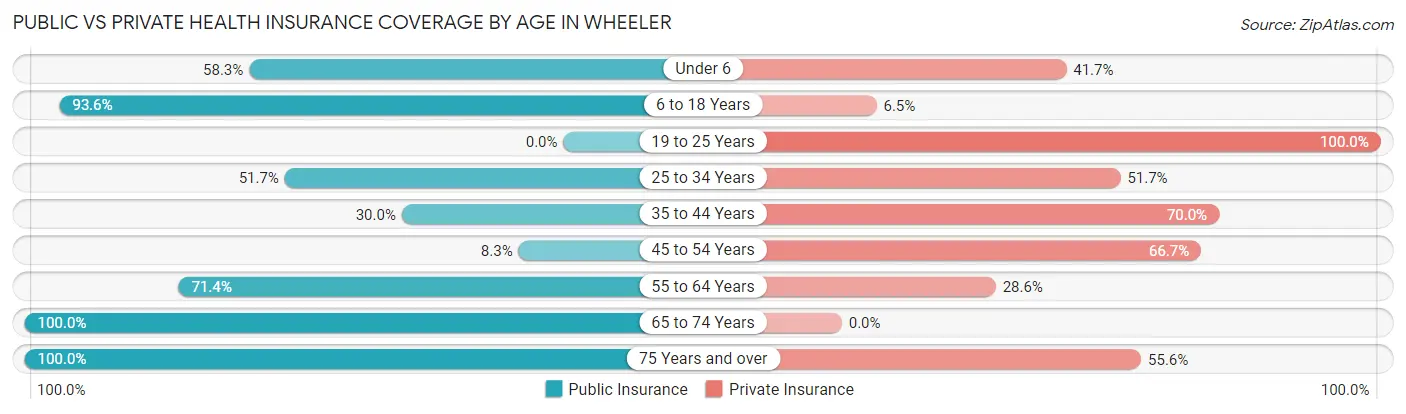
| Age Bracket | Public Insurance | Private Insurance |
| Under 6 | 7 (58.3%) | 5 (41.7%) |
| 6 to 18 Years | 29 (93.5%) | 2 (6.5%) |
| 19 to 25 Years | 0 (0.0%) | 1 (100.0%) |
| 25 to 34 Years | 15 (51.7%) | 15 (51.7%) |
| 35 to 44 Years | 6 (30.0%) | 14 (70.0%) |
| 45 to 54 Years | 1 (8.3%) | 8 (66.7%) |
| 55 to 64 Years | 5 (71.4%) | 2 (28.6%) |
| 65 to 74 Years | 2 (100.0%) | 0 (0.0%) |
| 75 Years and over | 9 (100.0%) | 5 (55.6%) |
| Total | 74 (60.2%) | 52 (42.3%) |
Disability Status by Sex by Age in Wheeler
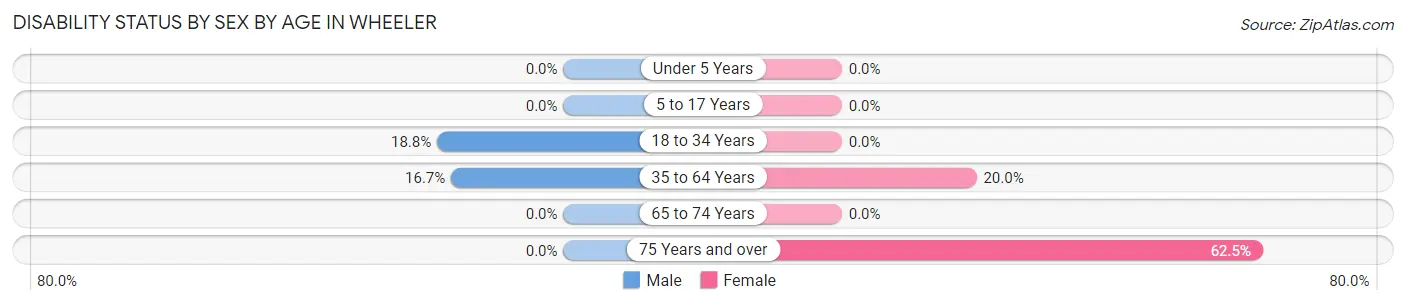
| Age Bracket | Male | Female |
| Under 5 Years | 0 (0.0%) | 0 (0.0%) |
| 5 to 17 Years | 0 (0.0%) | 0 (0.0%) |
| 18 to 34 Years | 3 (18.8%) | 0 (0.0%) |
| 35 to 64 Years | 4 (16.7%) | 3 (20.0%) |
| 65 to 74 Years | 0 (0.0%) | 0 (0.0%) |
| 75 Years and over | 0 (0.0%) | 5 (62.5%) |
Disability Class by Sex by Age in Wheeler
Disability Class: Hearing Difficulty
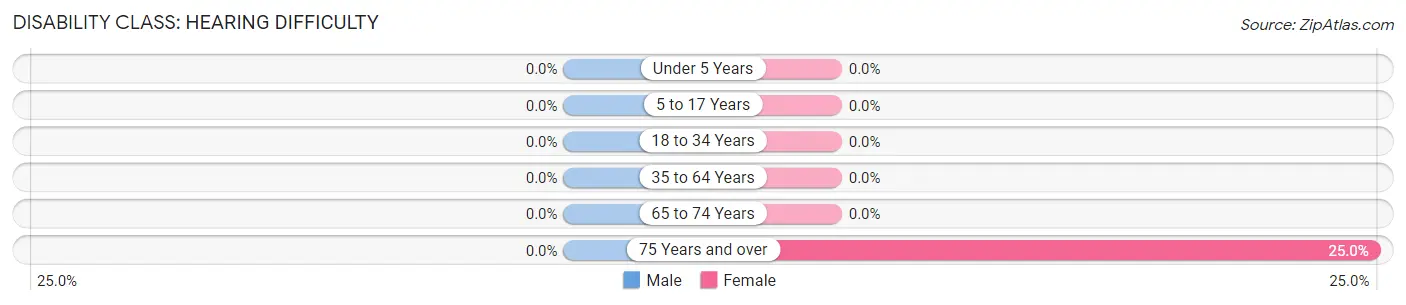
| Age Bracket | Male | Female |
| Under 5 Years | 0 (0.0%) | 0 (0.0%) |
| 5 to 17 Years | 0 (0.0%) | 0 (0.0%) |
| 18 to 34 Years | 0 (0.0%) | 0 (0.0%) |
| 35 to 64 Years | 0 (0.0%) | 0 (0.0%) |
| 65 to 74 Years | 0 (0.0%) | 0 (0.0%) |
| 75 Years and over | 0 (0.0%) | 2 (25.0%) |
Disability Class: Vision Difficulty
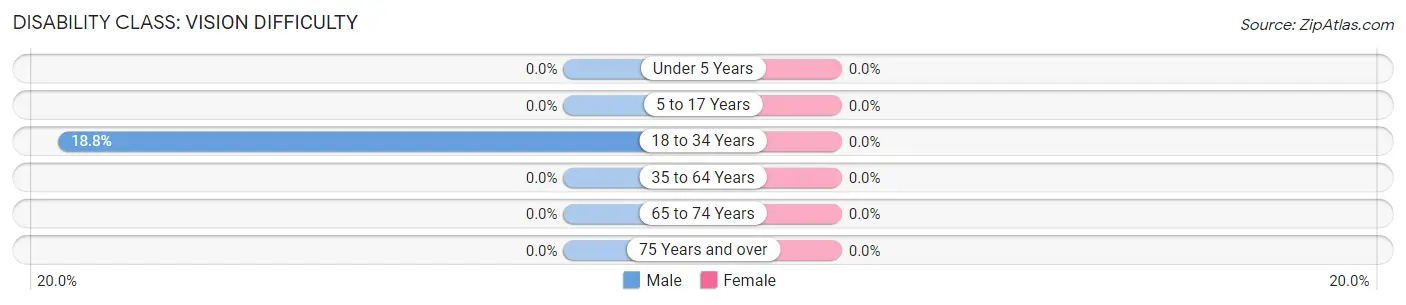
| Age Bracket | Male | Female |
| Under 5 Years | 0 (0.0%) | 0 (0.0%) |
| 5 to 17 Years | 0 (0.0%) | 0 (0.0%) |
| 18 to 34 Years | 3 (18.8%) | 0 (0.0%) |
| 35 to 64 Years | 0 (0.0%) | 0 (0.0%) |
| 65 to 74 Years | 0 (0.0%) | 0 (0.0%) |
| 75 Years and over | 0 (0.0%) | 0 (0.0%) |
Disability Class: Cognitive Difficulty
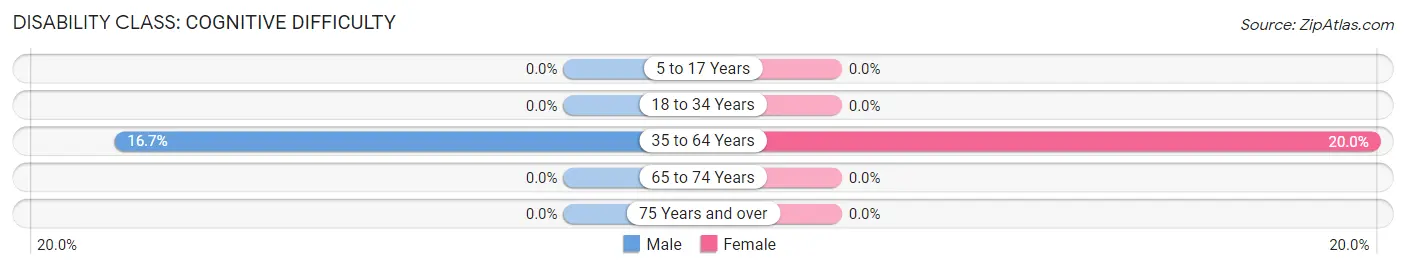
| Age Bracket | Male | Female |
| 5 to 17 Years | 0 (0.0%) | 0 (0.0%) |
| 18 to 34 Years | 0 (0.0%) | 0 (0.0%) |
| 35 to 64 Years | 4 (16.7%) | 3 (20.0%) |
| 65 to 74 Years | 0 (0.0%) | 0 (0.0%) |
| 75 Years and over | 0 (0.0%) | 0 (0.0%) |
Disability Class: Ambulatory Difficulty
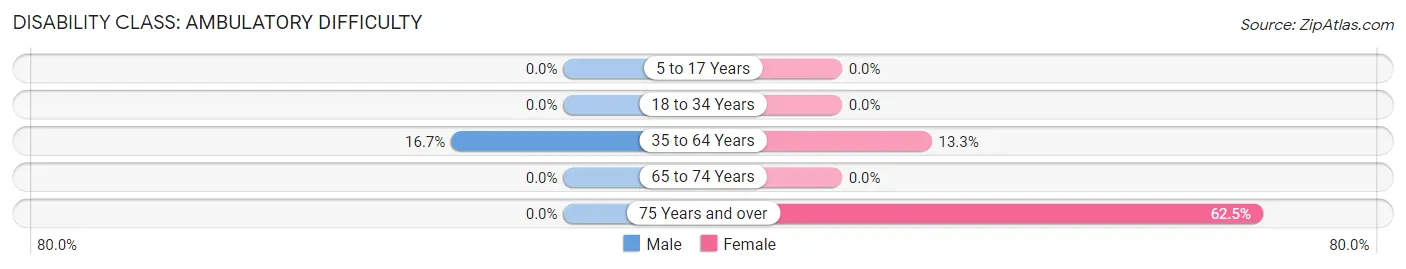
| Age Bracket | Male | Female |
| 5 to 17 Years | 0 (0.0%) | 0 (0.0%) |
| 18 to 34 Years | 0 (0.0%) | 0 (0.0%) |
| 35 to 64 Years | 4 (16.7%) | 2 (13.3%) |
| 65 to 74 Years | 0 (0.0%) | 0 (0.0%) |
| 75 Years and over | 0 (0.0%) | 5 (62.5%) |
Disability Class: Self-Care Difficulty
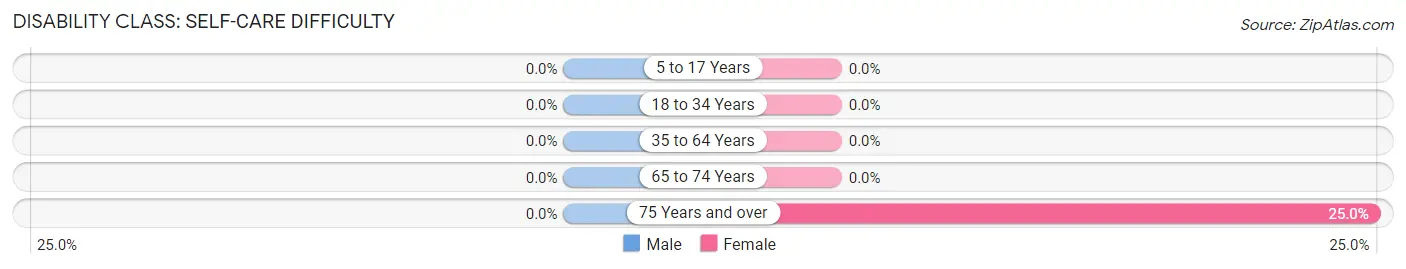
| Age Bracket | Male | Female |
| 5 to 17 Years | 0 (0.0%) | 0 (0.0%) |
| 18 to 34 Years | 0 (0.0%) | 0 (0.0%) |
| 35 to 64 Years | 0 (0.0%) | 0 (0.0%) |
| 65 to 74 Years | 0 (0.0%) | 0 (0.0%) |
| 75 Years and over | 0 (0.0%) | 2 (25.0%) |
Technology Access in Wheeler
Computing Device Access in Wheeler
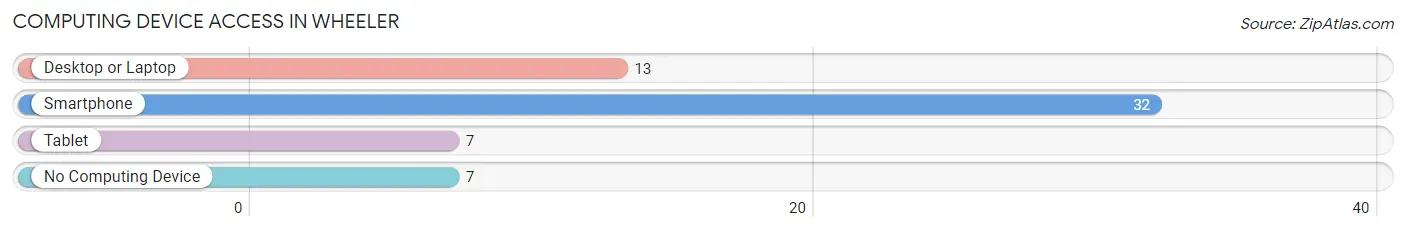
| Device Type | # Households | % Households |
| Desktop or Laptop | 13 | 30.2% |
| Smartphone | 32 | 74.4% |
| Tablet | 7 | 16.3% |
| No Computing Device | 7 | 16.3% |
| Total | 43 | 100.0% |
Internet Access in Wheeler
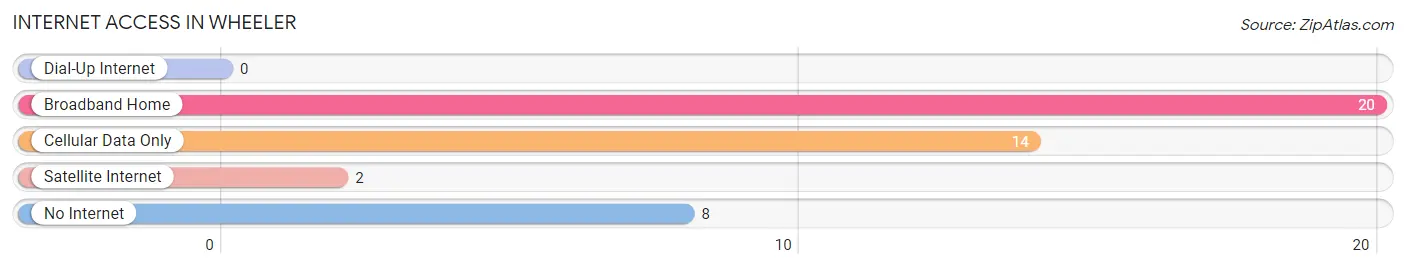
| Internet Type | # Households | % Households |
| Dial-Up Internet | 0 | 0.0% |
| Broadband Home | 20 | 46.5% |
| Cellular Data Only | 14 | 32.6% |
| Satellite Internet | 2 | 4.6% |
| No Internet | 8 | 18.6% |
| Total | 43 | 100.0% |
Wheeler Summary
Wheeler, Illinois is a small village located in the northern part of the state, in Lee County. It is situated on the banks of the Mississippi River, and is home to a population of just over 500 people. The village was founded in 1836, and has a rich history that is intertwined with the development of the region.
Geography
Wheeler is located in the northern part of Illinois, in Lee County. It is situated on the banks of the Mississippi River, and is bordered by the towns of Dixon, Amboy, and Ashton. The village is located in a rural area, and is surrounded by farmland and wooded areas. The terrain is mostly flat, with some rolling hills in the area. The climate is temperate, with hot summers and cold winters.
Economy
The economy of Wheeler is largely based on agriculture. The village is home to several farms, which produce a variety of crops, including corn, soybeans, and wheat. There are also several small businesses in the area, including a grocery store, a hardware store, and a few restaurants. The village also has a few manufacturing plants, which produce a variety of products, including furniture and automotive parts.
Demographics
As of the 2010 census, the population of Wheeler was 514. The racial makeup of the village was 97.3% White, 0.6% African American, 0.2% Native American, 0.2% Asian, 0.2% from other races, and 1.6% from two or more races. Hispanic or Latino of any race were 1.2% of the population.
The median income for a household in Wheeler was $45,000, and the median income for a family was $50,000. The per capita income for the village was $20,000. About 8.3% of families and 10.2% of the population were below the poverty line, including 11.3% of those under age 18 and 8.3% of those age 65 or over.
History
Wheeler was founded in 1836 by a group of settlers from New York. The village was named after a local Native American chief, Chief Wheeler. The village was originally a farming community, and the settlers built a grist mill and a sawmill to help support the local economy.
In the late 19th century, the village began to grow and develop. The railroad was built through the area, and the village became a stop on the line. This helped to spur economic growth, and the village began to attract more businesses and residents.
In the early 20th century, Wheeler was a thriving community. The village had several stores, a bank, a post office, and a hotel. The village also had a school, and several churches.
In the late 20th century, the village began to decline. Many of the businesses and residents moved away, and the population began to decline. Today, the village is still a small, rural community, but it is slowly beginning to grow again.
Common Questions
What is Per Capita Income in Wheeler?
Per Capita income in Wheeler is $18,725.
What is Income or Wage Gap in Wheeler?
Income or Wage Gap in Wheeler is 63.5%.
Women in Wheeler earn 36.5 cents for every dollar earned by a man.
What is Inequality or Gini Index in Wheeler?
Inequality or Gini Index in Wheeler is 0.49.
What is the Total Population of Wheeler?
Total Population of Wheeler is 123.
What is the Total Male Population of Wheeler?
Total Male Population of Wheeler is 63.
What is the Total Female Population of Wheeler?
Total Female Population of Wheeler is 60.
What is the Ratio of Males per 100 Females in Wheeler?
There are 105.00 Males per 100 Females in Wheeler.
What is the Ratio of Females per 100 Males in Wheeler?
There are 95.24 Females per 100 Males in Wheeler.
What is the Median Population Age in Wheeler?
Median Population Age in Wheeler is 33.1 Years.
What is the Average Family Size in Wheeler
Average Family Size in Wheeler is 4.9 People.
What is the Average Household Size in Wheeler
Average Household Size in Wheeler is 2.9 People.
How Large is the Labor Force in Wheeler?
There are 53 People in the Labor Forcein in Wheeler.
What is the Percentage of People in the Labor Force in Wheeler?
66.3% of People are in the Labor Force in Wheeler.
What is the Unemployment Rate in Wheeler?
Unemployment Rate in Wheeler is 7.5%.