Westfield, IL Map & Demographics
Westfield Map
Westfield Overview
$26,104
PER CAPITA INCOME
$60,625
AVG FAMILY INCOME
$56,750
AVG HOUSEHOLD INCOME
46.5%
WAGE / INCOME GAP [ % ]
53.5¢/ $1
WAGE / INCOME GAP [ $ ]
0.33
INEQUALITY / GINI INDEX
503
TOTAL POPULATION
256
MALE POPULATION
247
FEMALE POPULATION
103.64
MALES / 100 FEMALES
96.48
FEMALES / 100 MALES
48.5
MEDIAN AGE
2.7
AVG FAMILY SIZE
2.4
AVG HOUSEHOLD SIZE
237
LABOR FORCE [ PEOPLE ]
55.5%
PERCENT IN LABOR FORCE
6.3%
UNEMPLOYMENT RATE
Westfield Zip Codes
Westfield Area Codes
Income in Westfield
Income Overview in Westfield
Per Capita Income in Westfield is $26,104, while median incomes of families and households are $60,625 and $56,750 respectively.
| Characteristic | Number | Measure |
| Per Capita Income | 503 | $26,104 |
| Median Family Income | 141 | $60,625 |
| Mean Family Income | 141 | $63,254 |
| Median Household Income | 210 | $56,750 |
| Mean Household Income | 210 | $59,667 |
| Income Deficit | 141 | $0 |
| Wage / Income Gap (%) | 503 | 46.47% |
| Wage / Income Gap ($) | 503 | 53.53¢ per $1 |
| Gini / Inequality Index | 503 | 0.33 |
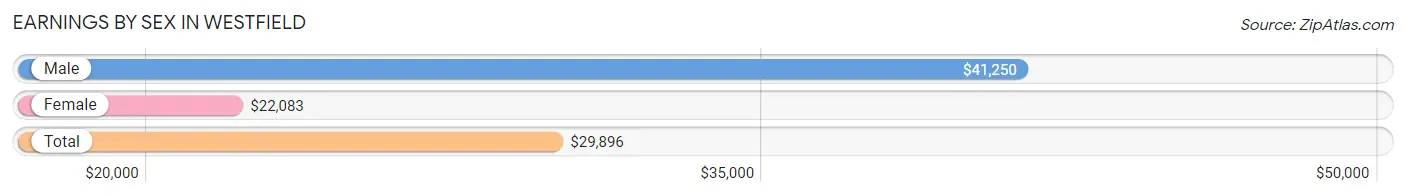
Earnings by Sex in Westfield
Average Earnings in Westfield are $29,896, $41,250 for men and $22,083 for women, a difference of 46.5%.
| Sex | Number | Average Earnings |
| Male | 147 (58.1%) | $41,250 |
| Female | 106 (41.9%) | $22,083 |
| Total | 253 (100.0%) | $29,896 |
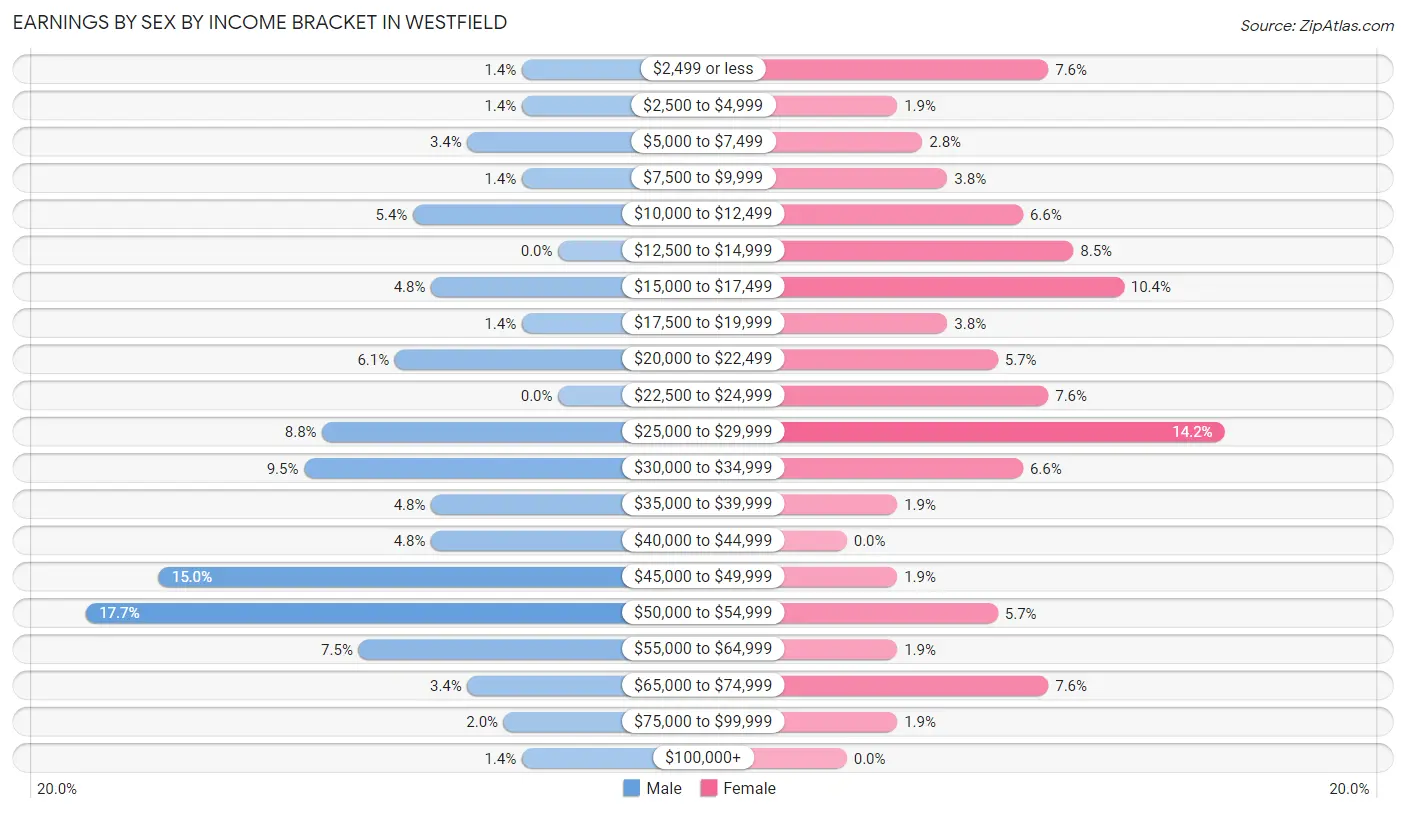
Earnings by Sex by Income Bracket in Westfield
The most common earnings brackets in Westfield are $50,000 to $54,999 for men (26 | 17.7%) and $25,000 to $29,999 for women (15 | 14.1%).
| Income | Male | Female |
| $2,499 or less | 2 (1.4%) | 8 (7.5%) |
| $2,500 to $4,999 | 2 (1.4%) | 2 (1.9%) |
| $5,000 to $7,499 | 5 (3.4%) | 3 (2.8%) |
| $7,500 to $9,999 | 2 (1.4%) | 4 (3.8%) |
| $10,000 to $12,499 | 8 (5.4%) | 7 (6.6%) |
| $12,500 to $14,999 | 0 (0.0%) | 9 (8.5%) |
| $15,000 to $17,499 | 7 (4.8%) | 11 (10.4%) |
| $17,500 to $19,999 | 2 (1.4%) | 4 (3.8%) |
| $20,000 to $22,499 | 9 (6.1%) | 6 (5.7%) |
| $22,500 to $24,999 | 0 (0.0%) | 8 (7.5%) |
| $25,000 to $29,999 | 13 (8.8%) | 15 (14.1%) |
| $30,000 to $34,999 | 14 (9.5%) | 7 (6.6%) |
| $35,000 to $39,999 | 7 (4.8%) | 2 (1.9%) |
| $40,000 to $44,999 | 7 (4.8%) | 0 (0.0%) |
| $45,000 to $49,999 | 22 (15.0%) | 2 (1.9%) |
| $50,000 to $54,999 | 26 (17.7%) | 6 (5.7%) |
| $55,000 to $64,999 | 11 (7.5%) | 2 (1.9%) |
| $65,000 to $74,999 | 5 (3.4%) | 8 (7.5%) |
| $75,000 to $99,999 | 3 (2.0%) | 2 (1.9%) |
| $100,000+ | 2 (1.4%) | 0 (0.0%) |
| Total | 147 (100.0%) | 106 (100.0%) |
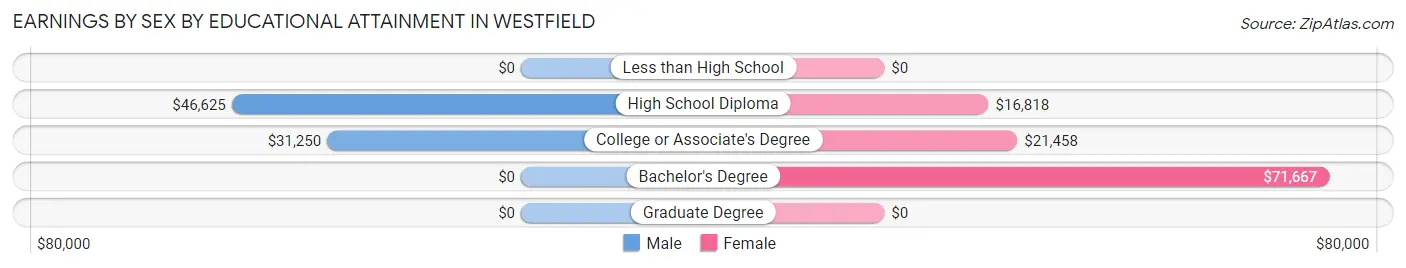
Earnings by Sex by Educational Attainment in Westfield
Average earnings in Westfield are $36,071 for men and $23,000 for women, a difference of 36.2%. Men with an educational attainment of high school diploma enjoy the highest average annual earnings of $46,625, while those with college or associate's degree education earn the least with $31,250. Women with an educational attainment of bachelor's degree earn the most with the average annual earnings of $71,667, while those with high school diploma education have the smallest earnings of $16,818.
| Educational Attainment | Male Income | Female Income |
| Less than High School | - | - |
| High School Diploma | $46,625 | $16,818 |
| College or Associate's Degree | $31,250 | $21,458 |
| Bachelor's Degree | - | - |
| Graduate Degree | - | - |
| Total | $36,071 | $23,000 |
Family Income in Westfield
Family Income Brackets in Westfield
According to the Westfield family income data, there are 41 families falling into the $50,000 to $74,999 income range, which is the most common income bracket and makes up 29.1% of all families.
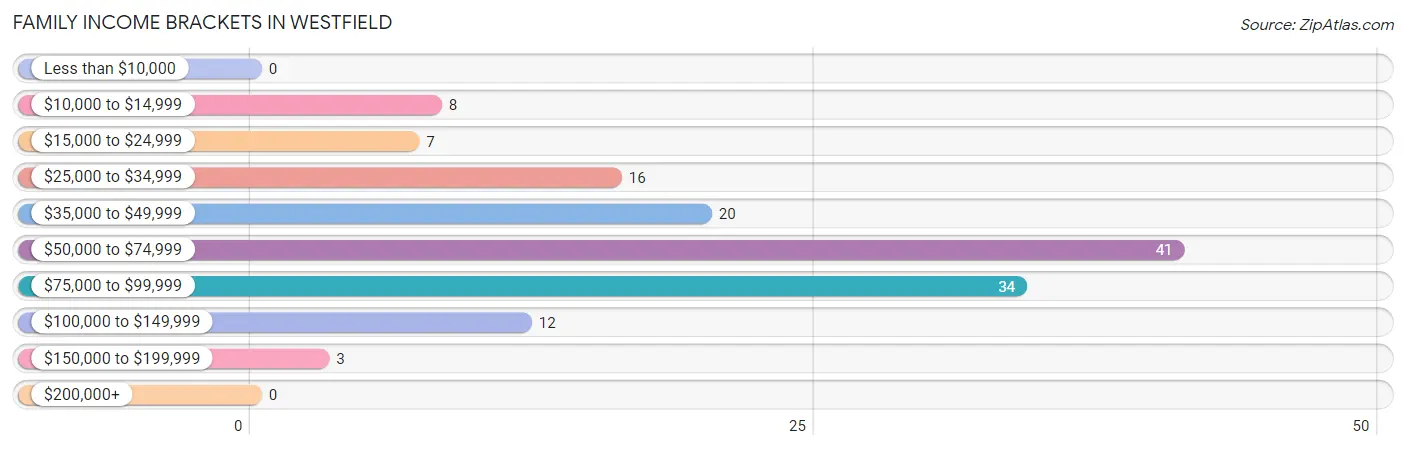
| Income Bracket | # Families | % Families |
| Less than $10,000 | 0 | 0.0% |
| $10,000 to $14,999 | 8 | 5.7% |
| $15,000 to $24,999 | 7 | 5.0% |
| $25,000 to $34,999 | 16 | 11.3% |
| $35,000 to $49,999 | 20 | 14.2% |
| $50,000 to $74,999 | 41 | 29.1% |
| $75,000 to $99,999 | 34 | 24.1% |
| $100,000 to $149,999 | 12 | 8.5% |
| $150,000 to $199,999 | 3 | 2.1% |
| $200,000+ | 0 | 0.0% |
Family Income by Famaliy Size in Westfield
5-person families (5 | 3.5%) account for the highest median family income in Westfield with $91,250 per family, while 2-person families (88 | 62.4%) have the highest median income of $27,000 per family member.
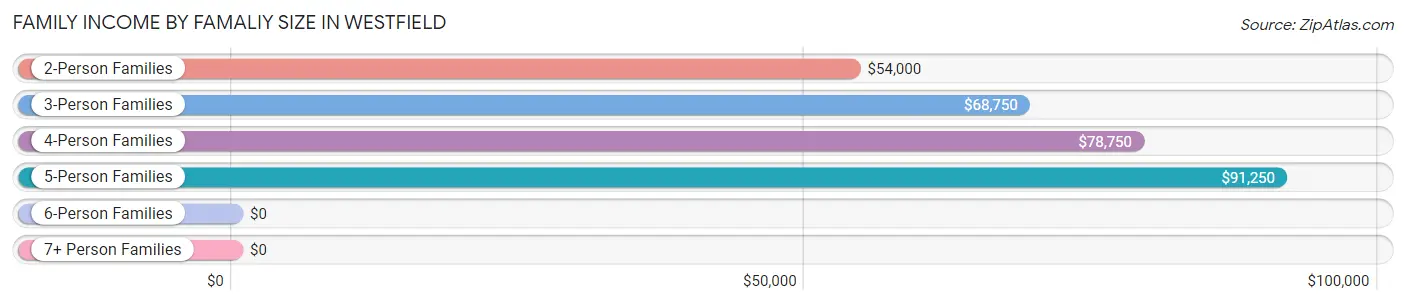
| Income Bracket | # Families | Median Income |
| 2-Person Families | 88 (62.4%) | $54,000 |
| 3-Person Families | 24 (17.0%) | $68,750 |
| 4-Person Families | 22 (15.6%) | $78,750 |
| 5-Person Families | 5 (3.5%) | $91,250 |
| 6-Person Families | 2 (1.4%) | $0 |
| 7+ Person Families | 0 (0.0%) | $0 |
| Total | 141 (100.0%) | $60,625 |
Family Income by Number of Earners in Westfield
The median family income in Westfield is $60,625, with families comprising 3+ earners (19) having the highest median family income of $107,708, while families with 1 earner (53) have the lowest median family income of $48,958, accounting for 13.5% and 37.6% of families, respectively.
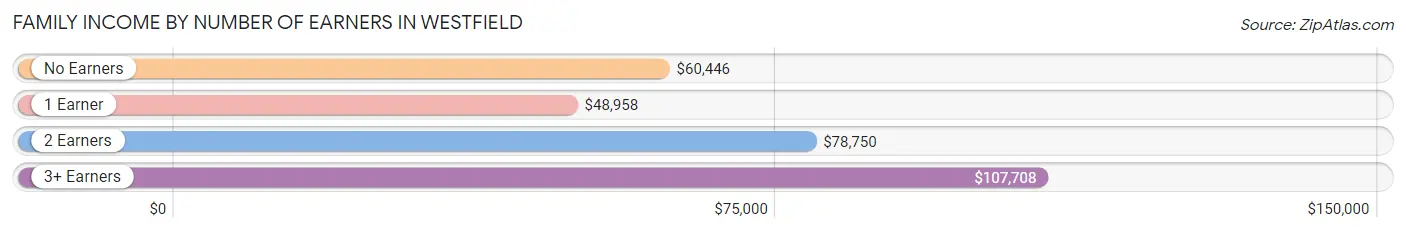
| Number of Earners | # Families | Median Income |
| No Earners | 33 (23.4%) | $60,446 |
| 1 Earner | 53 (37.6%) | $48,958 |
| 2 Earners | 36 (25.5%) | $78,750 |
| 3+ Earners | 19 (13.5%) | $107,708 |
| Total | 141 (100.0%) | $60,625 |
Household Income in Westfield
Household Income Brackets in Westfield
With 75 households falling in the category, the $50,000 to $74,999 income range is the most frequent in Westfield, accounting for 35.7% of all households.
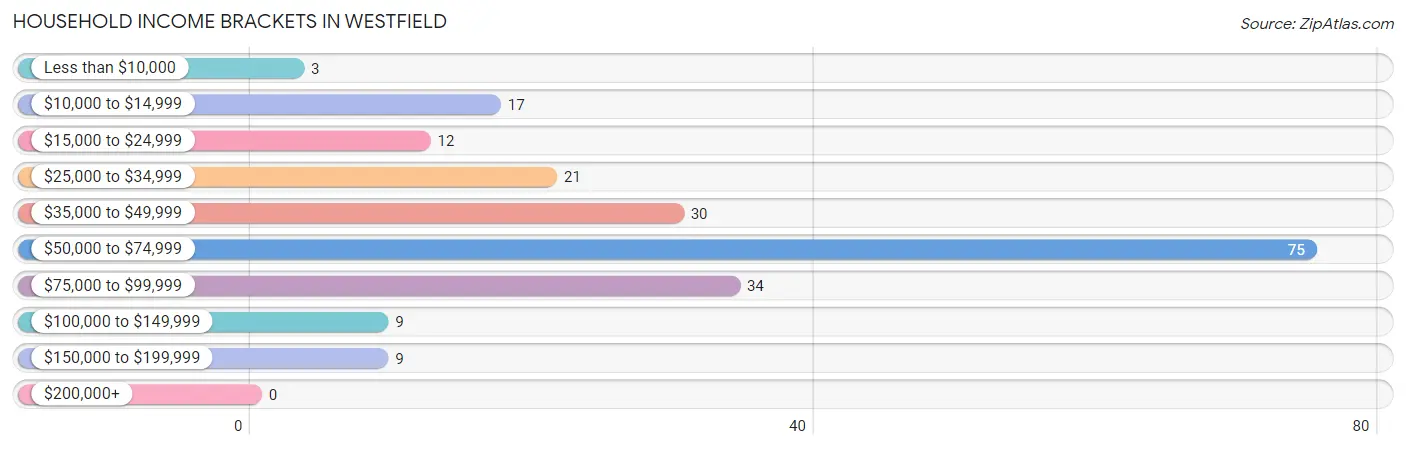
| Income Bracket | # Households | % Households |
| Less than $10,000 | 3 | 1.4% |
| $10,000 to $14,999 | 17 | 8.1% |
| $15,000 to $24,999 | 12 | 5.7% |
| $25,000 to $34,999 | 21 | 10.0% |
| $35,000 to $49,999 | 30 | 14.3% |
| $50,000 to $74,999 | 75 | 35.7% |
| $75,000 to $99,999 | 34 | 16.2% |
| $100,000 to $149,999 | 9 | 4.3% |
| $150,000 to $199,999 | 9 | 4.3% |
| $200,000+ | 0 | 0.0% |
Household Income by Householder Age in Westfield
The median household income in Westfield is $56,750, with the highest median household income of $68,194 found in the 45 to 64 years age bracket for the primary householder. A total of 79 households (37.6%) fall into this category. Meanwhile, the 15 to 24 years age bracket for the primary householder has the lowest median household income of $45,833, with 8 households (3.8%) in this group.
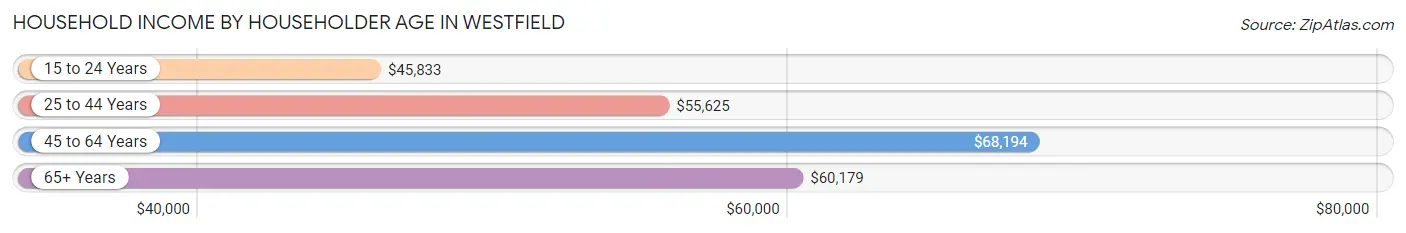
| Income Bracket | # Households | Median Income |
| 15 to 24 Years | 8 (3.8%) | $45,833 |
| 25 to 44 Years | 41 (19.5%) | $55,625 |
| 45 to 64 Years | 79 (37.6%) | $68,194 |
| 65+ Years | 82 (39.1%) | $60,179 |
| Total | 210 (100.0%) | $56,750 |
Poverty in Westfield
Income Below Poverty by Sex and Age in Westfield
With 7.8% poverty level for males and 12.6% for females among the residents of Westfield, 75 year old and over males and 18 to 24 year old females are the most vulnerable to poverty, with 2 males (20.0%) and 5 females (38.5%) in their respective age groups living below the poverty level.
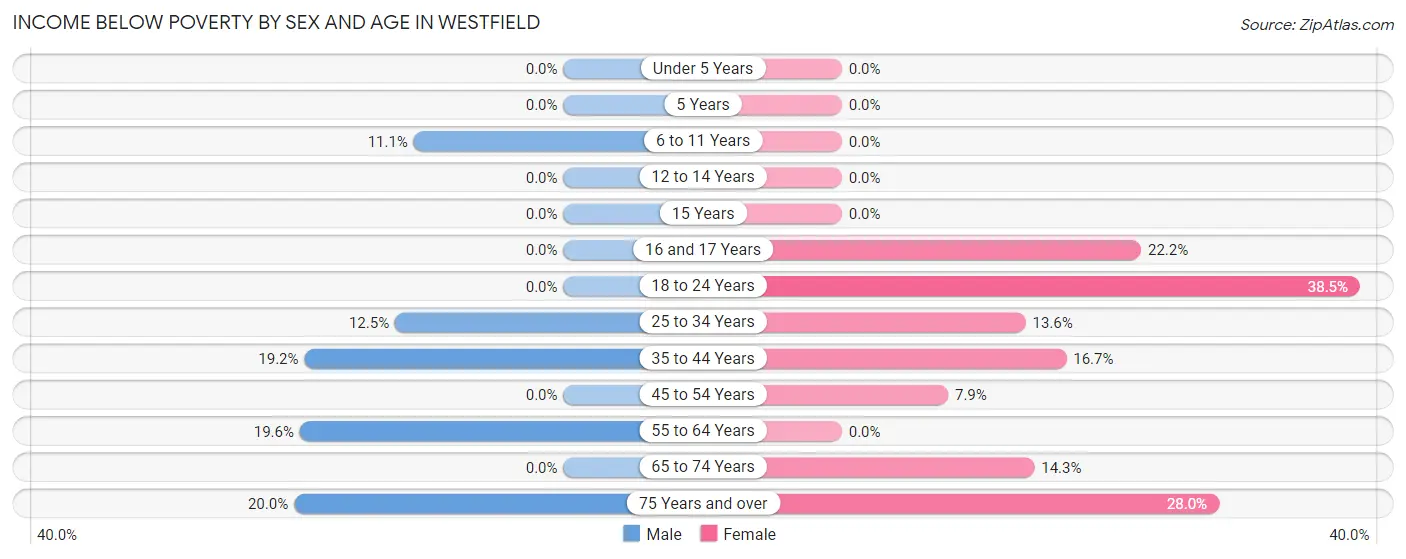
| Age Bracket | Male | Female |
| Under 5 Years | 0 (0.0%) | 0 (0.0%) |
| 5 Years | 0 (0.0%) | 0 (0.0%) |
| 6 to 11 Years | 2 (11.1%) | 0 (0.0%) |
| 12 to 14 Years | 0 (0.0%) | 0 (0.0%) |
| 15 Years | 0 (0.0%) | 0 (0.0%) |
| 16 and 17 Years | 0 (0.0%) | 2 (22.2%) |
| 18 to 24 Years | 0 (0.0%) | 5 (38.5%) |
| 25 to 34 Years | 2 (12.5%) | 3 (13.6%) |
| 35 to 44 Years | 5 (19.2%) | 2 (16.7%) |
| 45 to 54 Years | 0 (0.0%) | 3 (7.9%) |
| 55 to 64 Years | 9 (19.6%) | 0 (0.0%) |
| 65 to 74 Years | 0 (0.0%) | 9 (14.3%) |
| 75 Years and over | 2 (20.0%) | 7 (28.0%) |
| Total | 20 (7.8%) | 31 (12.6%) |
Income Above Poverty by Sex and Age in Westfield
According to the poverty statistics in Westfield, males aged 5 years and females aged under 5 years are the age groups that are most secure financially, with 100.0% of males and 100.0% of females in these age groups living above the poverty line.
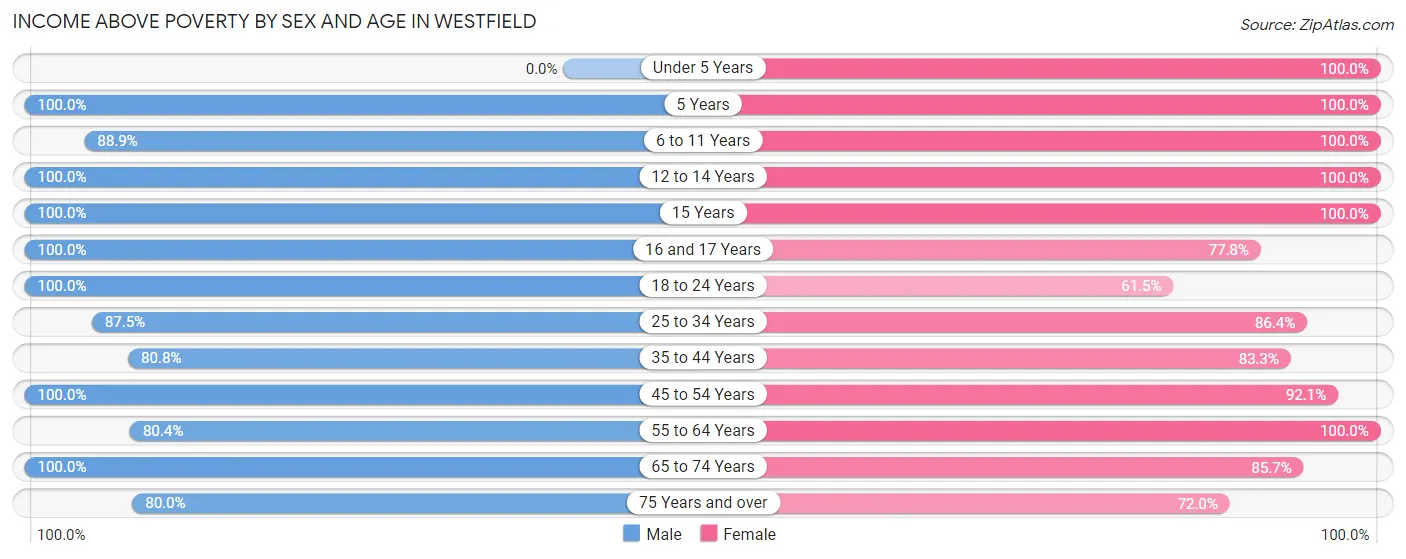
| Age Bracket | Male | Female |
| Under 5 Years | 0 (0.0%) | 6 (100.0%) |
| 5 Years | 8 (100.0%) | 4 (100.0%) |
| 6 to 11 Years | 16 (88.9%) | 17 (100.0%) |
| 12 to 14 Years | 6 (100.0%) | 5 (100.0%) |
| 15 Years | 4 (100.0%) | 7 (100.0%) |
| 16 and 17 Years | 5 (100.0%) | 7 (77.8%) |
| 18 to 24 Years | 54 (100.0%) | 8 (61.5%) |
| 25 to 34 Years | 14 (87.5%) | 19 (86.4%) |
| 35 to 44 Years | 21 (80.8%) | 10 (83.3%) |
| 45 to 54 Years | 30 (100.0%) | 35 (92.1%) |
| 55 to 64 Years | 37 (80.4%) | 25 (100.0%) |
| 65 to 74 Years | 33 (100.0%) | 54 (85.7%) |
| 75 Years and over | 8 (80.0%) | 18 (72.0%) |
| Total | 236 (92.2%) | 215 (87.4%) |
Income Below Poverty Among Married-Couple Families in Westfield
The poverty statistics for married-couple families in Westfield show that 7.2% or 8 of the total 111 families live below the poverty line. Families with no children have the highest poverty rate of 9.6%, comprising of 8 families. On the other hand, families with 1 or 2 children have the lowest poverty rate of 0.0%, which includes 0 families.
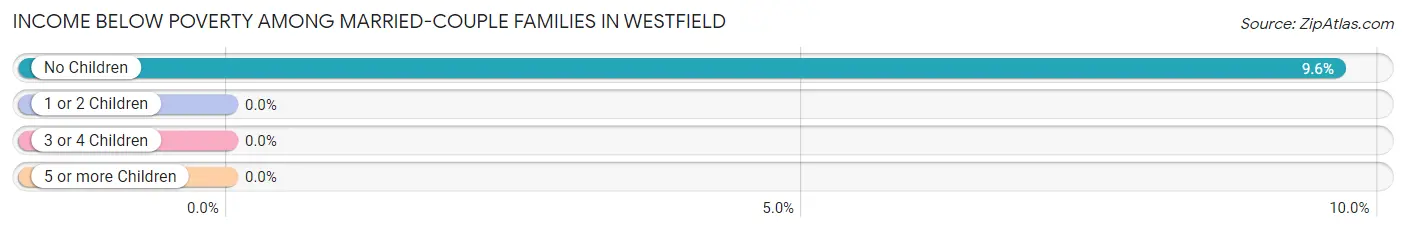
| Children | Above Poverty | Below Poverty |
| No Children | 75 (90.4%) | 8 (9.6%) |
| 1 or 2 Children | 23 (100.0%) | 0 (0.0%) |
| 3 or 4 Children | 5 (100.0%) | 0 (0.0%) |
| 5 or more Children | 0 (0.0%) | 0 (0.0%) |
| Total | 103 (92.8%) | 8 (7.2%) |
Income Below Poverty Among Single-Parent Households in Westfield
According to the poverty data in Westfield, 15.8% or 3 single-father households and 18.2% or 2 single-mother households are living below the poverty line. Among single-father households, those with 1 or 2 children have the highest poverty rate, with 3 households (75.0%) experiencing poverty. Likewise, among single-mother households, those with 1 or 2 children have the highest poverty rate, with 2 households (25.0%) falling below the poverty line.
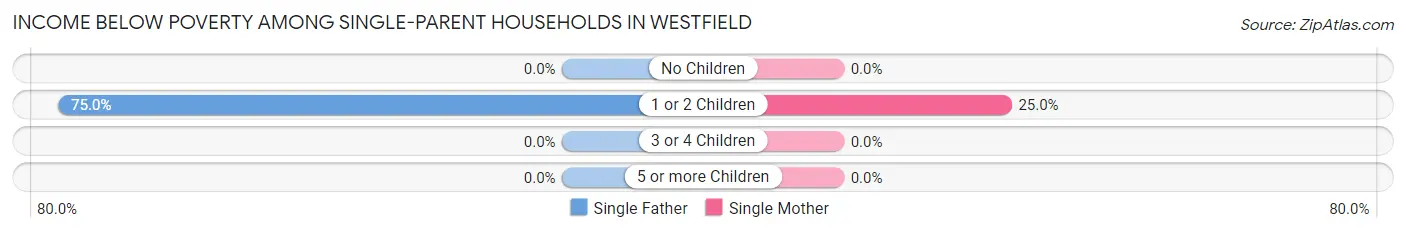
| Children | Single Father | Single Mother |
| No Children | 0 (0.0%) | 0 (0.0%) |
| 1 or 2 Children | 3 (75.0%) | 2 (25.0%) |
| 3 or 4 Children | 0 (0.0%) | 0 (0.0%) |
| 5 or more Children | 0 (0.0%) | 0 (0.0%) |
| Total | 3 (15.8%) | 2 (18.2%) |
Income Below Poverty Among Married-Couple vs Single-Parent Households in Westfield
The poverty data for Westfield shows that 8 of the married-couple family households (7.2%) and 5 of the single-parent households (16.7%) are living below the poverty level. Within the married-couple family households, those with no children have the highest poverty rate, with 8 households (9.6%) falling below the poverty line. Among the single-parent households, those with 1 or 2 children have the highest poverty rate, with 5 household (41.7%) living below poverty.
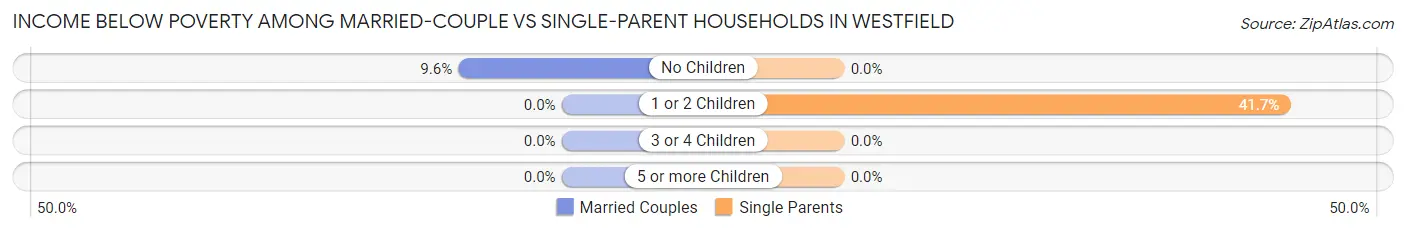
| Children | Married-Couple Families | Single-Parent Households |
| No Children | 8 (9.6%) | 0 (0.0%) |
| 1 or 2 Children | 0 (0.0%) | 5 (41.7%) |
| 3 or 4 Children | 0 (0.0%) | 0 (0.0%) |
| 5 or more Children | 0 (0.0%) | 0 (0.0%) |
| Total | 8 (7.2%) | 5 (16.7%) |
Race in Westfield
The most populous races in Westfield are White / Caucasian (478 | 95.0%), Two or more Races (16 | 3.2%), and Hispanic or Latino (10 | 2.0%).
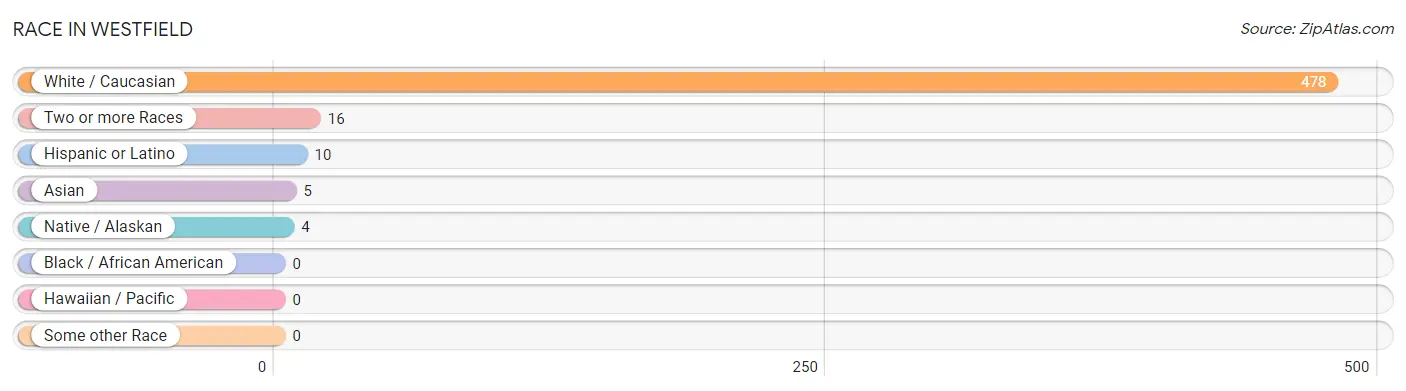
| Race | # Population | % Population |
| Asian | 5 | 1.0% |
| Black / African American | 0 | 0.0% |
| Hawaiian / Pacific | 0 | 0.0% |
| Hispanic or Latino | 10 | 2.0% |
| Native / Alaskan | 4 | 0.8% |
| White / Caucasian | 478 | 95.0% |
| Two or more Races | 16 | 3.2% |
| Some other Race | 0 | 0.0% |
| Total | 503 | 100.0% |
Ancestry in Westfield
The most populous ancestries reported in Westfield are American (78 | 15.5%), German (68 | 13.5%), English (46 | 9.1%), Irish (33 | 6.6%), and Italian (20 | 4.0%), together accounting for 48.7% of all Westfield residents.
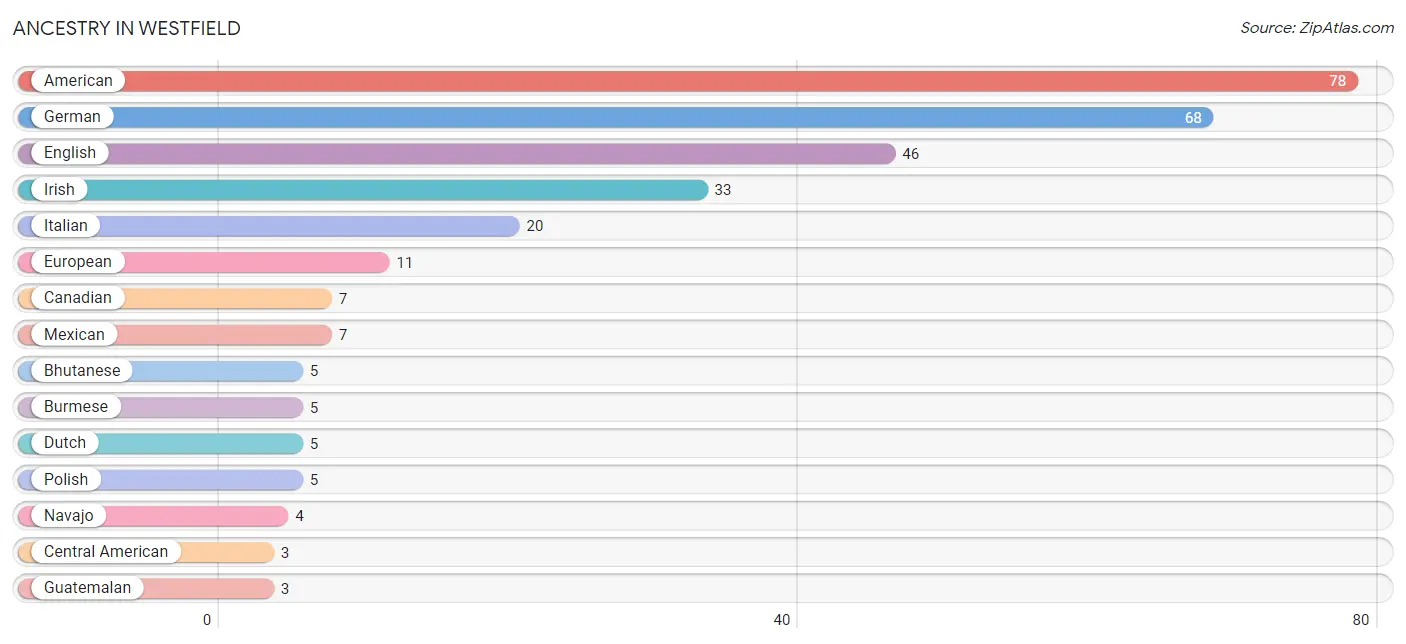
| Ancestry | # Population | % Population |
| American | 78 | 15.5% |
| Bhutanese | 5 | 1.0% |
| Burmese | 5 | 1.0% |
| Canadian | 7 | 1.4% |
| Central American | 3 | 0.6% |
| Croatian | 2 | 0.4% |
| Czechoslovakian | 2 | 0.4% |
| Dutch | 5 | 1.0% |
| English | 46 | 9.1% |
| European | 11 | 2.2% |
| French | 2 | 0.4% |
| German | 68 | 13.5% |
| Guatemalan | 3 | 0.6% |
| Irish | 33 | 6.6% |
| Italian | 20 | 4.0% |
| Mexican | 7 | 1.4% |
| Navajo | 4 | 0.8% |
| Norwegian | 3 | 0.6% |
| Polish | 5 | 1.0% |
| Scotch-Irish | 2 | 0.4% |
| Sioux | 2 | 0.4% |
| Welsh | 2 | 0.4% | View All 22 Rows |
Immigrants in Westfield
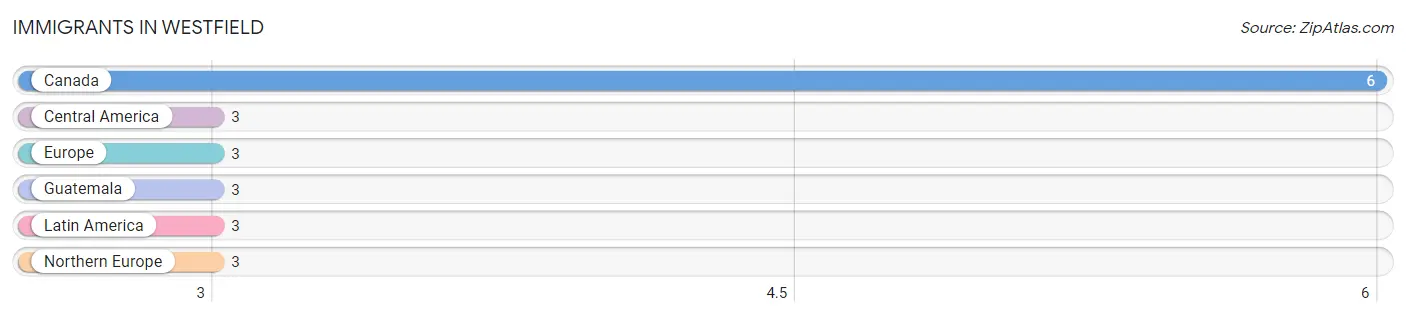
The most numerous immigrant groups reported in Westfield came from Canada (6 | 1.2%), Central America (3 | 0.6%), Europe (3 | 0.6%), Guatemala (3 | 0.6%), and Latin America (3 | 0.6%), together accounting for 3.6% of all Westfield residents.
| Immigration Origin | # Population | % Population |
| Canada | 6 | 1.2% |
| Central America | 3 | 0.6% |
| Europe | 3 | 0.6% |
| Guatemala | 3 | 0.6% |
| Latin America | 3 | 0.6% |
| Northern Europe | 3 | 0.6% | View All 6 Rows |
Sex and Age in Westfield
Sex and Age in Westfield
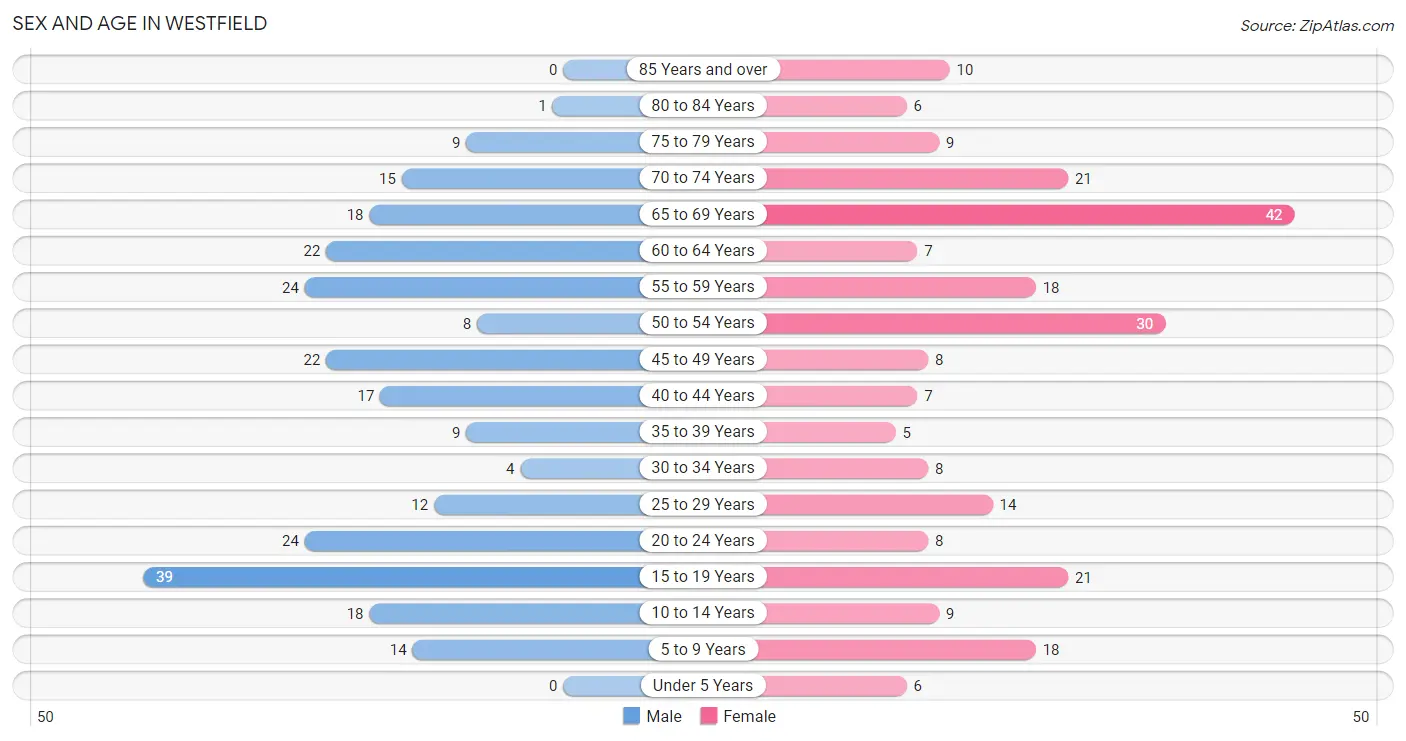
The most populous age groups in Westfield are 15 to 19 Years (39 | 15.2%) for men and 65 to 69 Years (42 | 17.0%) for women.
| Age Bracket | Male | Female |
| Under 5 Years | 0 (0.0%) | 6 (2.4%) |
| 5 to 9 Years | 14 (5.5%) | 18 (7.3%) |
| 10 to 14 Years | 18 (7.0%) | 9 (3.6%) |
| 15 to 19 Years | 39 (15.2%) | 21 (8.5%) |
| 20 to 24 Years | 24 (9.4%) | 8 (3.2%) |
| 25 to 29 Years | 12 (4.7%) | 14 (5.7%) |
| 30 to 34 Years | 4 (1.6%) | 8 (3.2%) |
| 35 to 39 Years | 9 (3.5%) | 5 (2.0%) |
| 40 to 44 Years | 17 (6.6%) | 7 (2.8%) |
| 45 to 49 Years | 22 (8.6%) | 8 (3.2%) |
| 50 to 54 Years | 8 (3.1%) | 30 (12.1%) |
| 55 to 59 Years | 24 (9.4%) | 18 (7.3%) |
| 60 to 64 Years | 22 (8.6%) | 7 (2.8%) |
| 65 to 69 Years | 18 (7.0%) | 42 (17.0%) |
| 70 to 74 Years | 15 (5.9%) | 21 (8.5%) |
| 75 to 79 Years | 9 (3.5%) | 9 (3.6%) |
| 80 to 84 Years | 1 (0.4%) | 6 (2.4%) |
| 85 Years and over | 0 (0.0%) | 10 (4.1%) |
| Total | 256 (100.0%) | 247 (100.0%) |
Families and Households in Westfield
Median Family Size in Westfield
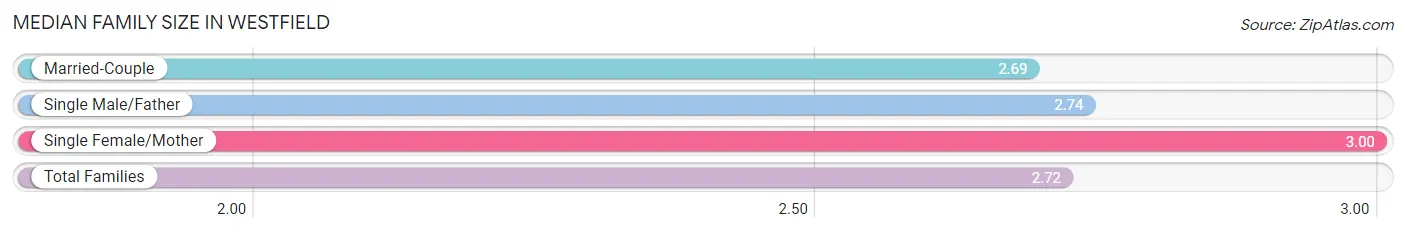
The median family size in Westfield is 2.72 persons per family, with single female/mother families (11 | 7.8%) accounting for the largest median family size of 3 persons per family. On the other hand, married-couple families (111 | 78.7%) represent the smallest median family size with 2.69 persons per family.
| Family Type | # Families | Family Size |
| Married-Couple | 111 (78.7%) | 2.69 |
| Single Male/Father | 19 (13.5%) | 2.74 |
| Single Female/Mother | 11 (7.8%) | 3.00 |
| Total Families | 141 (100.0%) | 2.72 |
Median Household Size in Westfield
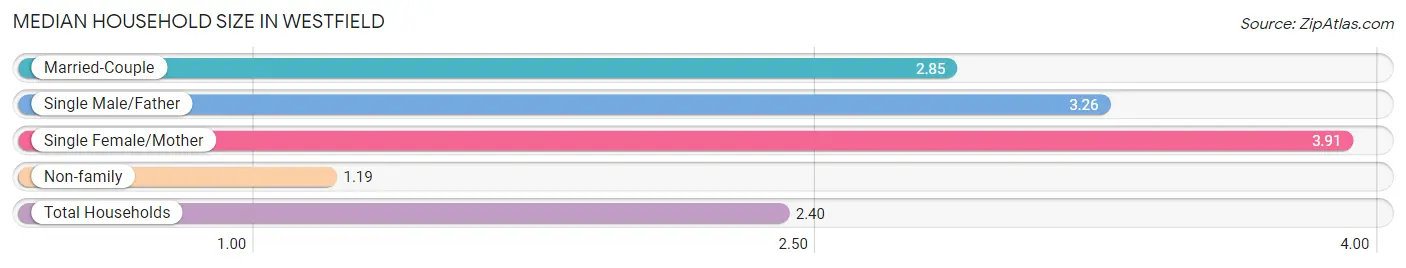
The median household size in Westfield is 2.40 persons per household, with single female/mother households (11 | 5.2%) accounting for the largest median household size of 3.91 persons per household. non-family households (69 | 32.9%) represent the smallest median household size with 1.19 persons per household.
| Household Type | # Households | Household Size |
| Married-Couple | 111 (52.9%) | 2.85 |
| Single Male/Father | 19 (9.0%) | 3.26 |
| Single Female/Mother | 11 (5.2%) | 3.91 |
| Non-family | 69 (32.9%) | 1.19 |
| Total Households | 210 (100.0%) | 2.40 |
Household Size by Marriage Status in Westfield
Out of a total of 210 households in Westfield, 141 (67.1%) are family households, while 69 (32.9%) are nonfamily households. The most numerous type of family households are 2-person households, comprising 81, and the most common type of nonfamily households are 1-person households, comprising 59.
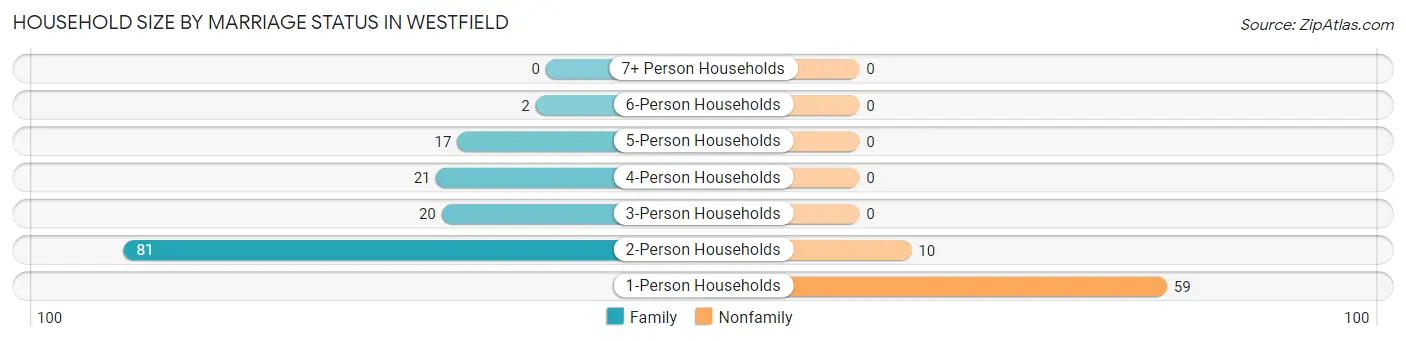
| Household Size | Family Households | Nonfamily Households |
| 1-Person Households | - | 59 (28.1%) |
| 2-Person Households | 81 (38.6%) | 10 (4.8%) |
| 3-Person Households | 20 (9.5%) | 0 (0.0%) |
| 4-Person Households | 21 (10.0%) | 0 (0.0%) |
| 5-Person Households | 17 (8.1%) | 0 (0.0%) |
| 6-Person Households | 2 (0.9%) | 0 (0.0%) |
| 7+ Person Households | 0 (0.0%) | 0 (0.0%) |
| Total | 141 (67.1%) | 69 (32.9%) |
Female Fertility in Westfield
Fertility by Age in Westfield
| Age Bracket | Women with Births | Births / 1,000 Women |
| 15 to 19 years | 0 (0.0%) | 0.0 |
| 20 to 34 years | 0 (0.0%) | 0.0 |
| 35 to 50 years | 0 (0.0%) | 0.0 |
| Total | 0 (0.0%) | 0.0 |
Fertility by Age by Marriage Status in Westfield
| Age Bracket | Married | Unmarried |
| 15 to 19 years | 0 (0.0%) | 0 (0.0%) |
| 20 to 34 years | 0 (0.0%) | 0 (0.0%) |
| 35 to 50 years | 0 (0.0%) | 0 (0.0%) |
| Total | 0 (0.0%) | 0 (0.0%) |
Fertility by Education in Westfield
| Educational Attainment | Women with Births | Births / 1,000 Women |
| Less than High School | 0 (0.0%) | 0.0 |
| High School Diploma | 0 (0.0%) | 0.0 |
| College or Associate's Degree | 0 (0.0%) | 0.0 |
| Bachelor's Degree | 0 (0.0%) | 0.0 |
| Graduate Degree | 0 (0.0%) | 0.0 |
| Total | 0 (0.0%) | 0.0 |
Fertility by Education by Marriage Status in Westfield
| Educational Attainment | Married | Unmarried |
| Less than High School | 0 (0.0%) | 0 (0.0%) |
| High School Diploma | 0 (0.0%) | 0 (0.0%) |
| College or Associate's Degree | 0 (0.0%) | 0 (0.0%) |
| Bachelor's Degree | 0 (0.0%) | 0 (0.0%) |
| Graduate Degree | 0 (0.0%) | 0 (0.0%) |
| Total | 0 (0.0%) | 0 (0.0%) |
Employment Characteristics in Westfield
Employment by Class of Employer in Westfield
Among the 222 employed individuals in Westfield, private company employees (172 | 77.5%), self-employed (not incorporated) (15 | 6.8%), and not-for-profit organizations (15 | 6.8%) make up the most common classes of employment.
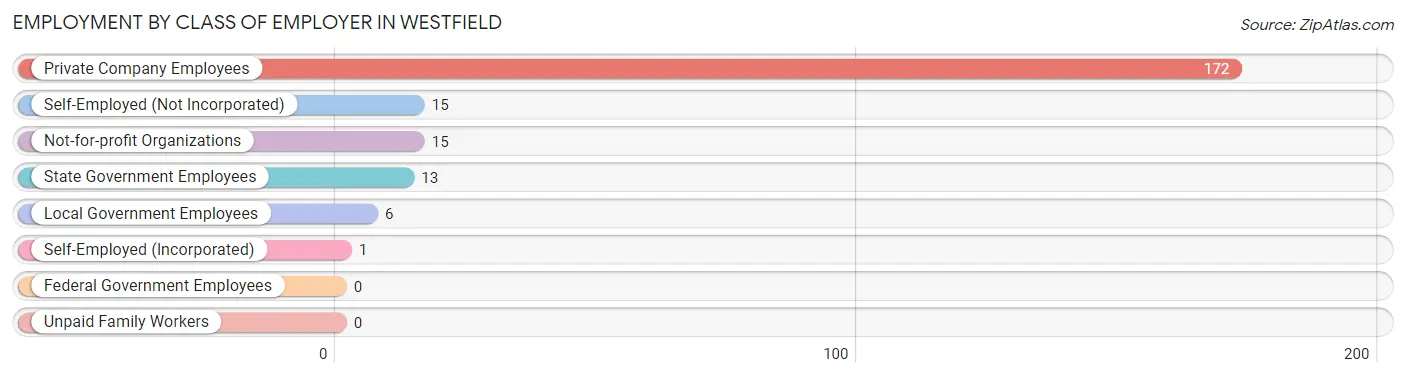
| Employer Class | # Employees | % Employees |
| Private Company Employees | 172 | 77.5% |
| Self-Employed (Incorporated) | 1 | 0.4% |
| Self-Employed (Not Incorporated) | 15 | 6.8% |
| Not-for-profit Organizations | 15 | 6.8% |
| Local Government Employees | 6 | 2.7% |
| State Government Employees | 13 | 5.9% |
| Federal Government Employees | 0 | 0.0% |
| Unpaid Family Workers | 0 | 0.0% |
| Total | 222 | 100.0% |
Employment Status by Age in Westfield
According to the labor force statistics for Westfield, out of the total population over 16 years of age (427), 55.5% or 237 individuals are in the labor force, with 6.3% or 15 of them unemployed. The age group with the highest labor force participation rate is 30 to 34 years, with 100.0% or 12 individuals in the labor force. Within the labor force, the 25 to 29 years age range has the highest percentage of unemployed individuals, with 33.3% or 6 of them being unemployed.
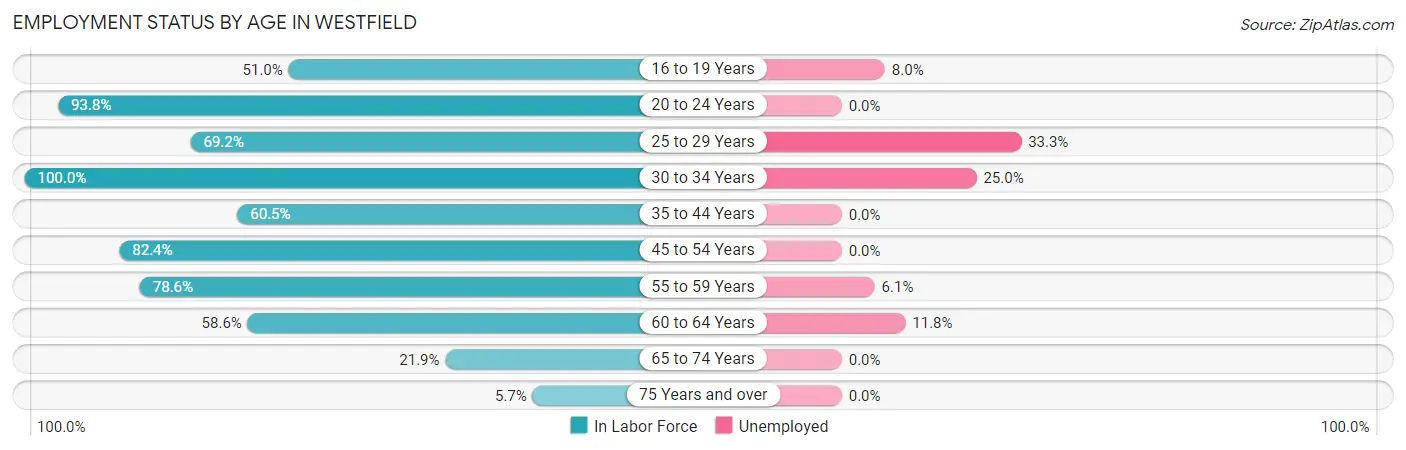
| Age Bracket | In Labor Force | Unemployed |
| 16 to 19 Years | 25 (51.0%) | 2 (8.0%) |
| 20 to 24 Years | 30 (93.8%) | 0 (0.0%) |
| 25 to 29 Years | 18 (69.2%) | 6 (33.3%) |
| 30 to 34 Years | 12 (100.0%) | 3 (25.0%) |
| 35 to 44 Years | 23 (60.5%) | 0 (0.0%) |
| 45 to 54 Years | 56 (82.4%) | 0 (0.0%) |
| 55 to 59 Years | 33 (78.6%) | 2 (6.1%) |
| 60 to 64 Years | 17 (58.6%) | 2 (11.8%) |
| 65 to 74 Years | 21 (21.9%) | 0 (0.0%) |
| 75 Years and over | 2 (5.7%) | 0 (0.0%) |
| Total | 237 (55.5%) | 15 (6.3%) |
Employment Status by Educational Attainment in Westfield
According to labor force statistics for Westfield, 74.0% of individuals (159) out of the total population between 25 and 64 years of age (215) are in the labor force, with 8.2% or 13 of them being unemployed. The group with the highest labor force participation rate are those with the educational attainment of bachelor's degree or higher, with 100.0% or 19 individuals in the labor force. Within the labor force, individuals with less than high school education have the highest percentage of unemployment, with 75.0% or 9 of them being unemployed.
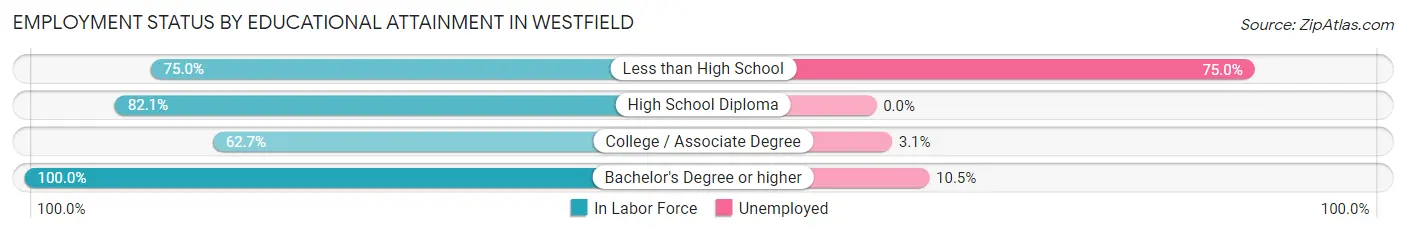
| Educational Attainment | In Labor Force | Unemployed |
| Less than High School | 12 (75.0%) | 12 (75.0%) |
| High School Diploma | 64 (82.1%) | 0 (0.0%) |
| College / Associate Degree | 64 (62.7%) | 3 (3.1%) |
| Bachelor's Degree or higher | 19 (100.0%) | 2 (10.5%) |
| Total | 159 (74.0%) | 18 (8.2%) |
Employment Occupations by Sex in Westfield
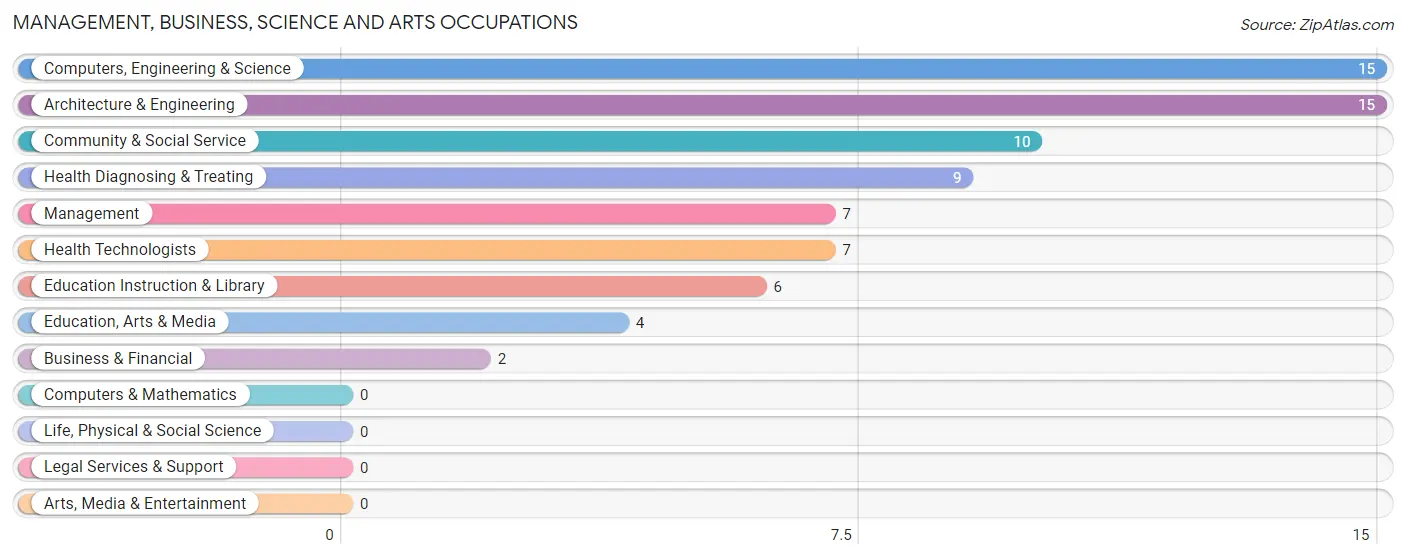
Management, Business, Science and Arts Occupations
The most common Management, Business, Science and Arts occupations in Westfield are Computers, Engineering & Science (15 | 6.8%), Architecture & Engineering (15 | 6.8%), Community & Social Service (10 | 4.5%), Health Diagnosing & Treating (9 | 4.1%), and Management (7 | 3.2%).
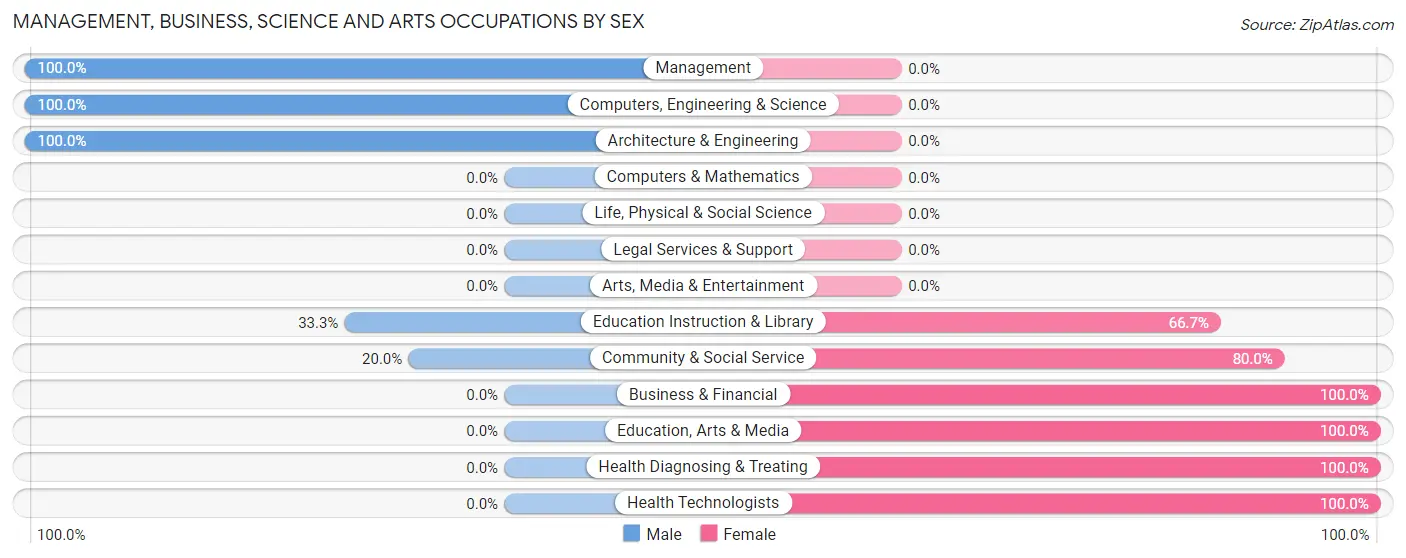
Management, Business, Science and Arts Occupations by Sex
Within the Management, Business, Science and Arts occupations in Westfield, the most male-oriented occupations are Management (100.0%), Computers, Engineering & Science (100.0%), and Architecture & Engineering (100.0%), while the most female-oriented occupations are Business & Financial (100.0%), Education, Arts & Media (100.0%), and Health Diagnosing & Treating (100.0%).
| Occupation | Male | Female |
| Management | 7 (100.0%) | 0 (0.0%) |
| Business & Financial | 0 (0.0%) | 2 (100.0%) |
| Computers, Engineering & Science | 15 (100.0%) | 0 (0.0%) |
| Computers & Mathematics | 0 (0.0%) | 0 (0.0%) |
| Architecture & Engineering | 15 (100.0%) | 0 (0.0%) |
| Life, Physical & Social Science | 0 (0.0%) | 0 (0.0%) |
| Community & Social Service | 2 (20.0%) | 8 (80.0%) |
| Education, Arts & Media | 0 (0.0%) | 4 (100.0%) |
| Legal Services & Support | 0 (0.0%) | 0 (0.0%) |
| Education Instruction & Library | 2 (33.3%) | 4 (66.7%) |
| Arts, Media & Entertainment | 0 (0.0%) | 0 (0.0%) |
| Health Diagnosing & Treating | 0 (0.0%) | 9 (100.0%) |
| Health Technologists | 0 (0.0%) | 7 (100.0%) |
| Total (Category) | 24 (55.8%) | 19 (44.2%) |
| Total (Overall) | 137 (61.7%) | 85 (38.3%) |
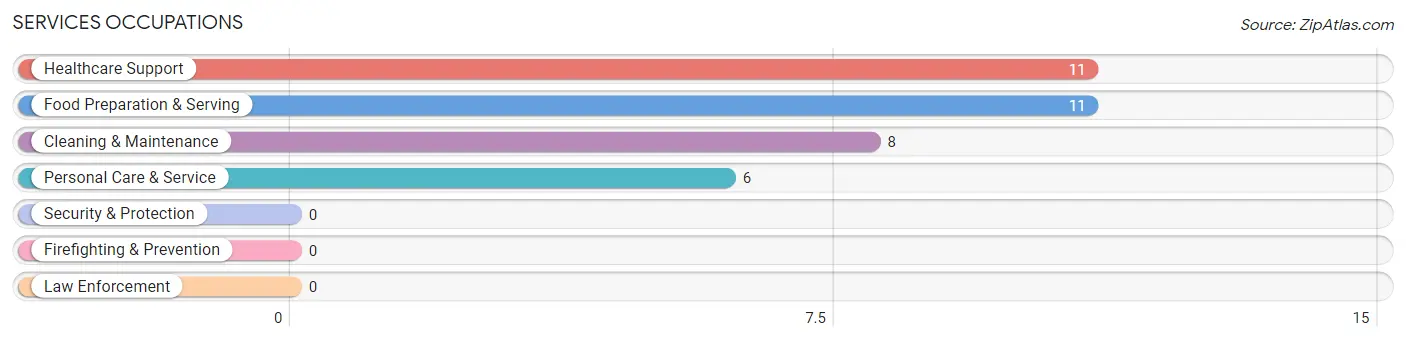
Services Occupations
The most common Services occupations in Westfield are Healthcare Support (11 | 5.0%), Food Preparation & Serving (11 | 5.0%), Cleaning & Maintenance (8 | 3.6%), and Personal Care & Service (6 | 2.7%).
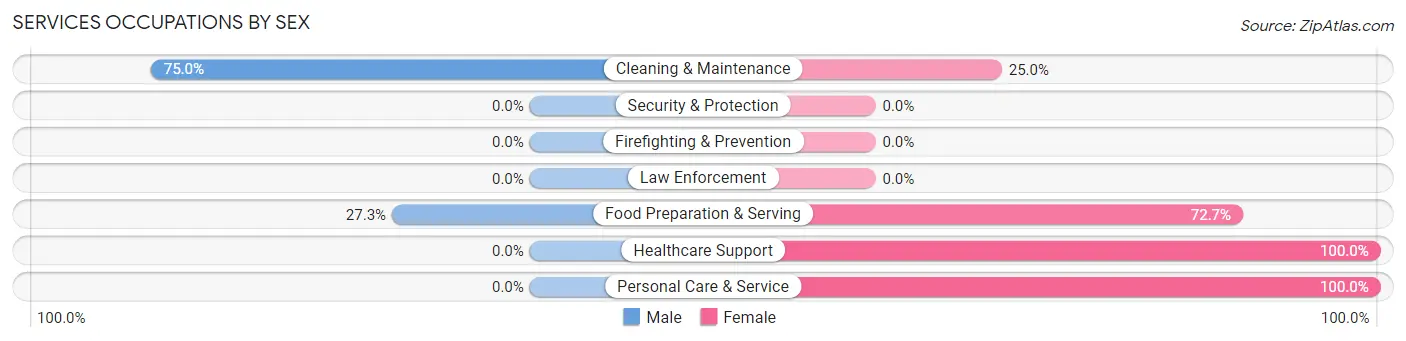
Services Occupations by Sex
Within the Services occupations in Westfield, the most male-oriented occupations are Cleaning & Maintenance (75.0%), and Food Preparation & Serving (27.3%), while the most female-oriented occupations are Healthcare Support (100.0%), Personal Care & Service (100.0%), and Food Preparation & Serving (72.7%).
| Occupation | Male | Female |
| Healthcare Support | 0 (0.0%) | 11 (100.0%) |
| Security & Protection | 0 (0.0%) | 0 (0.0%) |
| Firefighting & Prevention | 0 (0.0%) | 0 (0.0%) |
| Law Enforcement | 0 (0.0%) | 0 (0.0%) |
| Food Preparation & Serving | 3 (27.3%) | 8 (72.7%) |
| Cleaning & Maintenance | 6 (75.0%) | 2 (25.0%) |
| Personal Care & Service | 0 (0.0%) | 6 (100.0%) |
| Total (Category) | 9 (25.0%) | 27 (75.0%) |
| Total (Overall) | 137 (61.7%) | 85 (38.3%) |
Sales and Office Occupations
The most common Sales and Office occupations in Westfield are Office & Administration (24 | 10.8%), and Sales & Related (18 | 8.1%).
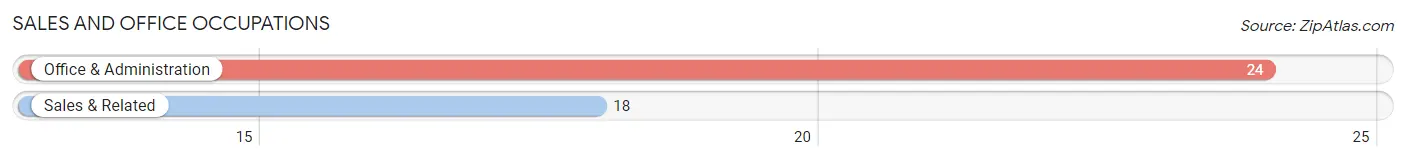
Sales and Office Occupations by Sex
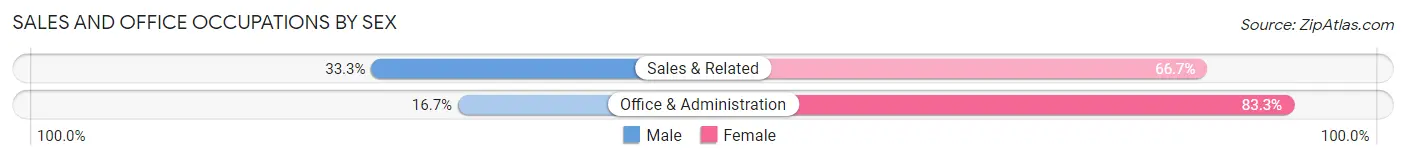
| Occupation | Male | Female |
| Sales & Related | 6 (33.3%) | 12 (66.7%) |
| Office & Administration | 4 (16.7%) | 20 (83.3%) |
| Total (Category) | 10 (23.8%) | 32 (76.2%) |
| Total (Overall) | 137 (61.7%) | 85 (38.3%) |
Natural Resources, Construction and Maintenance Occupations
The most common Natural Resources, Construction and Maintenance occupations in Westfield are Construction & Extraction (20 | 9.0%), Installation, Maintenance & Repair (17 | 7.7%), and Farming, Fishing & Forestry (10 | 4.5%).
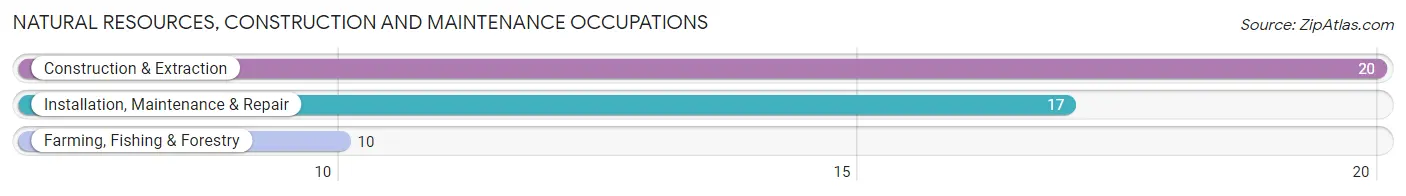
Natural Resources, Construction and Maintenance Occupations by Sex
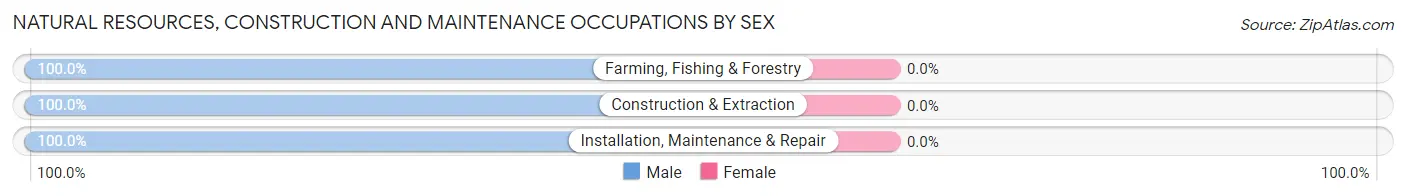
| Occupation | Male | Female |
| Farming, Fishing & Forestry | 10 (100.0%) | 0 (0.0%) |
| Construction & Extraction | 20 (100.0%) | 0 (0.0%) |
| Installation, Maintenance & Repair | 17 (100.0%) | 0 (0.0%) |
| Total (Category) | 47 (100.0%) | 0 (0.0%) |
| Total (Overall) | 137 (61.7%) | 85 (38.3%) |
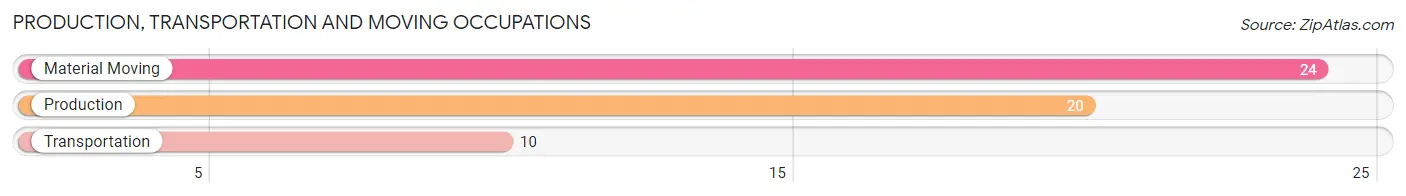
Production, Transportation and Moving Occupations
The most common Production, Transportation and Moving occupations in Westfield are Material Moving (24 | 10.8%), Production (20 | 9.0%), and Transportation (10 | 4.5%).
Production, Transportation and Moving Occupations by Sex
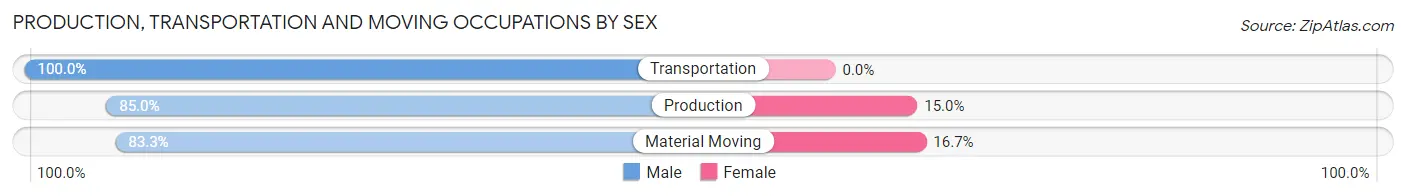
| Occupation | Male | Female |
| Production | 17 (85.0%) | 3 (15.0%) |
| Transportation | 10 (100.0%) | 0 (0.0%) |
| Material Moving | 20 (83.3%) | 4 (16.7%) |
| Total (Category) | 47 (87.0%) | 7 (13.0%) |
| Total (Overall) | 137 (61.7%) | 85 (38.3%) |
Employment Industries by Sex in Westfield
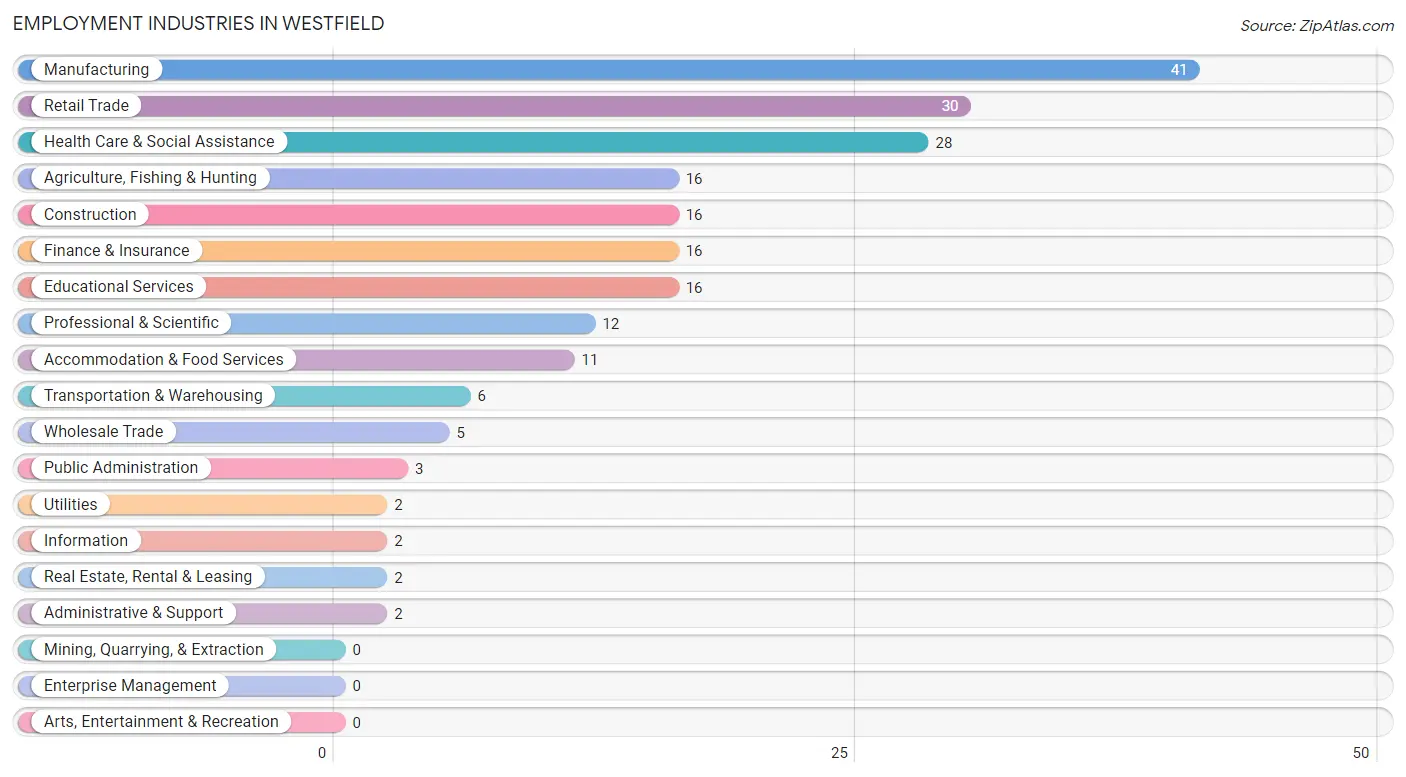
Employment Industries in Westfield
The major employment industries in Westfield include Manufacturing (41 | 18.5%), Retail Trade (30 | 13.5%), Health Care & Social Assistance (28 | 12.6%), Agriculture, Fishing & Hunting (16 | 7.2%), and Construction (16 | 7.2%).
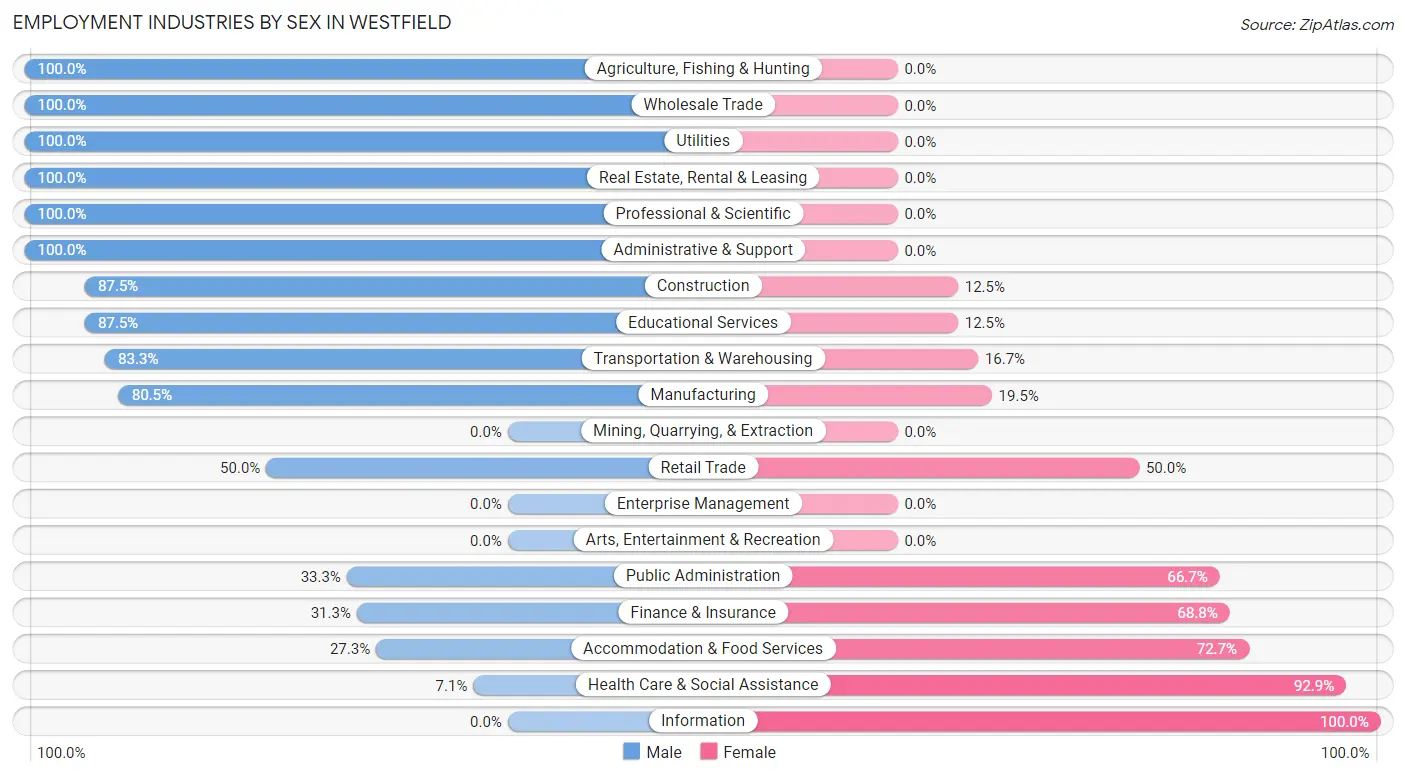
Employment Industries by Sex in Westfield
The Westfield industries that see more men than women are Agriculture, Fishing & Hunting (100.0%), Wholesale Trade (100.0%), and Utilities (100.0%), whereas the industries that tend to have a higher number of women are Information (100.0%), Health Care & Social Assistance (92.9%), and Accommodation & Food Services (72.7%).
| Industry | Male | Female |
| Agriculture, Fishing & Hunting | 16 (100.0%) | 0 (0.0%) |
| Mining, Quarrying, & Extraction | 0 (0.0%) | 0 (0.0%) |
| Construction | 14 (87.5%) | 2 (12.5%) |
| Manufacturing | 33 (80.5%) | 8 (19.5%) |
| Wholesale Trade | 5 (100.0%) | 0 (0.0%) |
| Retail Trade | 15 (50.0%) | 15 (50.0%) |
| Transportation & Warehousing | 5 (83.3%) | 1 (16.7%) |
| Utilities | 2 (100.0%) | 0 (0.0%) |
| Information | 0 (0.0%) | 2 (100.0%) |
| Finance & Insurance | 5 (31.2%) | 11 (68.8%) |
| Real Estate, Rental & Leasing | 2 (100.0%) | 0 (0.0%) |
| Professional & Scientific | 12 (100.0%) | 0 (0.0%) |
| Enterprise Management | 0 (0.0%) | 0 (0.0%) |
| Administrative & Support | 2 (100.0%) | 0 (0.0%) |
| Educational Services | 14 (87.5%) | 2 (12.5%) |
| Health Care & Social Assistance | 2 (7.1%) | 26 (92.9%) |
| Arts, Entertainment & Recreation | 0 (0.0%) | 0 (0.0%) |
| Accommodation & Food Services | 3 (27.3%) | 8 (72.7%) |
| Public Administration | 1 (33.3%) | 2 (66.7%) |
| Total | 137 (61.7%) | 85 (38.3%) |
Education in Westfield
School Enrollment in Westfield
The most common levels of schooling among the 96 students in Westfield are middle school (25 | 26.0%), high school (25 | 26.0%), and elementary school (20 | 20.8%).
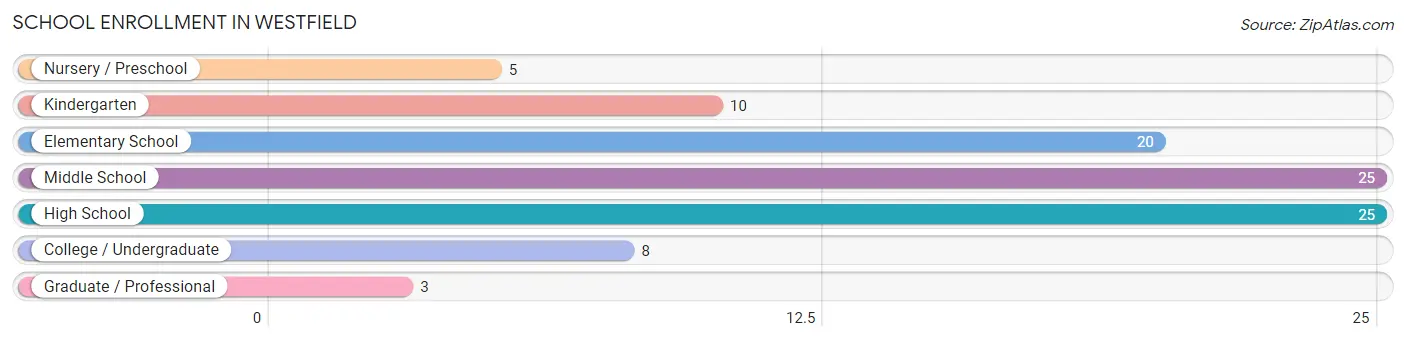
| School Level | # Students | % Students |
| Nursery / Preschool | 5 | 5.2% |
| Kindergarten | 10 | 10.4% |
| Elementary School | 20 | 20.8% |
| Middle School | 25 | 26.0% |
| High School | 25 | 26.0% |
| College / Undergraduate | 8 | 8.3% |
| Graduate / Professional | 3 | 3.1% |
| Total | 96 | 100.0% |
School Enrollment by Age by Funding Source in Westfield
Out of a total of 96 students who are enrolled in schools in Westfield, 11 (11.5%) attend a private institution, while the remaining 85 (88.5%) are enrolled in public schools. The age group of 10 to 14 year olds has the highest likelihood of being enrolled in private schools, with 6 (24.0% in the age bracket) enrolled. Conversely, the age group of 3 to 4 year olds has the lowest likelihood of being enrolled in a private school, with 3 (100.0% in the age bracket) attending a public institution.
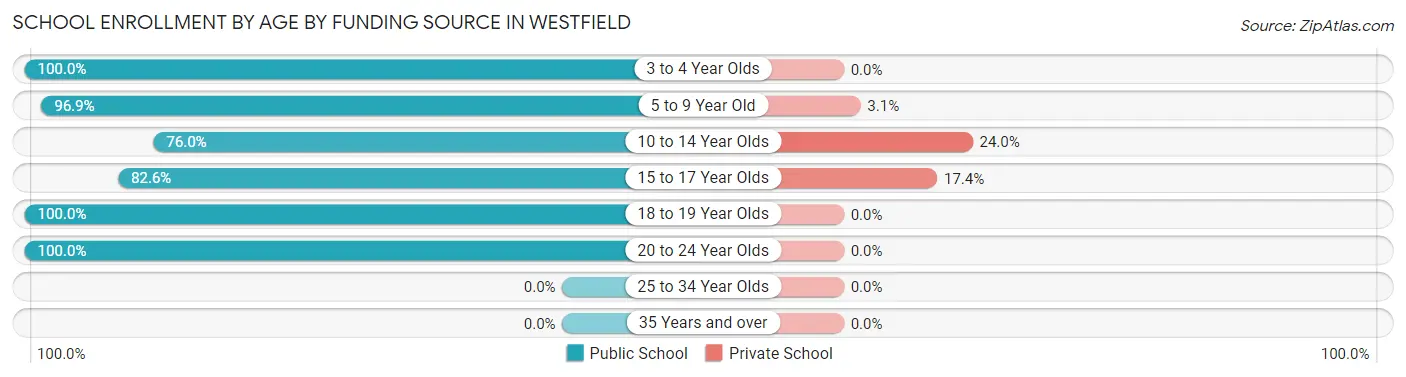
| Age Bracket | Public School | Private School |
| 3 to 4 Year Olds | 3 (100.0%) | 0 (0.0%) |
| 5 to 9 Year Old | 31 (96.9%) | 1 (3.1%) |
| 10 to 14 Year Olds | 19 (76.0%) | 6 (24.0%) |
| 15 to 17 Year Olds | 19 (82.6%) | 4 (17.4%) |
| 18 to 19 Year Olds | 5 (100.0%) | 0 (0.0%) |
| 20 to 24 Year Olds | 8 (100.0%) | 0 (0.0%) |
| 25 to 34 Year Olds | 0 (0.0%) | 0 (0.0%) |
| 35 Years and over | 0 (0.0%) | 0 (0.0%) |
| Total | 85 (88.5%) | 11 (11.5%) |
Educational Attainment by Field of Study in Westfield
Arts & humanities (13 | 38.2%), science & technology (7 | 20.6%), business (5 | 14.7%), education (5 | 14.7%), and literature & languages (4 | 11.8%) are the most common fields of study among 34 individuals in Westfield who have obtained a bachelor's degree or higher.
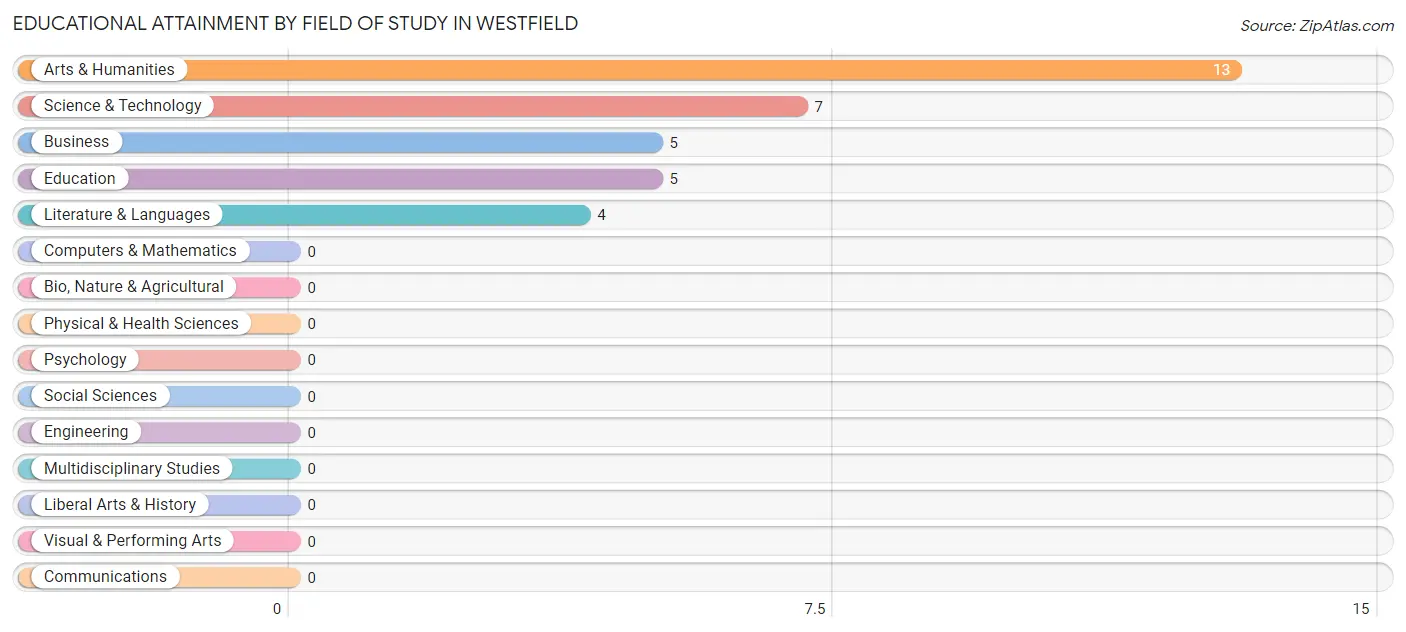
| Field of Study | # Graduates | % Graduates |
| Computers & Mathematics | 0 | 0.0% |
| Bio, Nature & Agricultural | 0 | 0.0% |
| Physical & Health Sciences | 0 | 0.0% |
| Psychology | 0 | 0.0% |
| Social Sciences | 0 | 0.0% |
| Engineering | 0 | 0.0% |
| Multidisciplinary Studies | 0 | 0.0% |
| Science & Technology | 7 | 20.6% |
| Business | 5 | 14.7% |
| Education | 5 | 14.7% |
| Literature & Languages | 4 | 11.8% |
| Liberal Arts & History | 0 | 0.0% |
| Visual & Performing Arts | 0 | 0.0% |
| Communications | 0 | 0.0% |
| Arts & Humanities | 13 | 38.2% |
| Total | 34 | 100.0% |
Transportation & Commute in Westfield
Vehicle Availability by Sex in Westfield
The most prevalent vehicle ownership categories in Westfield are males with 2 vehicles (50, accounting for 36.5%) and females with 2 vehicles (51, making up 58.8%).
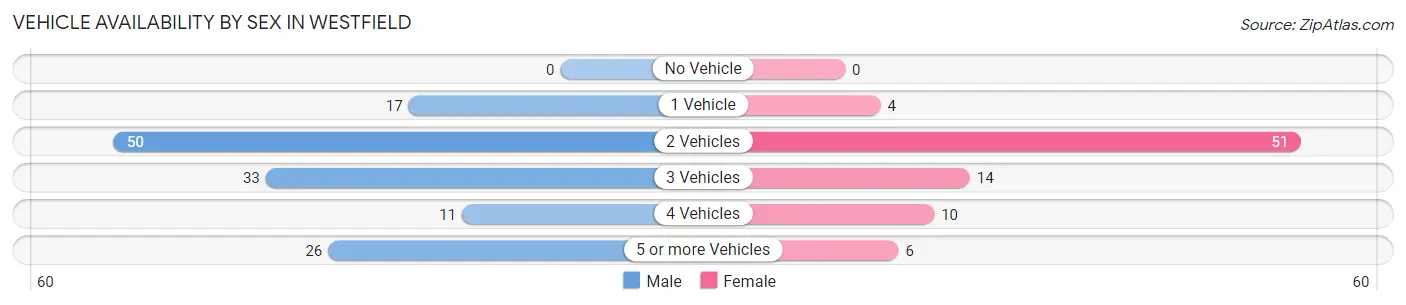
| Vehicles Available | Male | Female |
| No Vehicle | 0 (0.0%) | 0 (0.0%) |
| 1 Vehicle | 17 (12.4%) | 4 (4.7%) |
| 2 Vehicles | 50 (36.5%) | 51 (60.0%) |
| 3 Vehicles | 33 (24.1%) | 14 (16.5%) |
| 4 Vehicles | 11 (8.0%) | 10 (11.8%) |
| 5 or more Vehicles | 26 (19.0%) | 6 (7.1%) |
| Total | 137 (100.0%) | 85 (100.0%) |
Commute Time in Westfield
The most frequently occuring commute durations in Westfield are 15 to 19 minutes (65 commuters, 29.3%), 30 to 34 minutes (50 commuters, 22.5%), and 20 to 24 minutes (37 commuters, 16.7%).
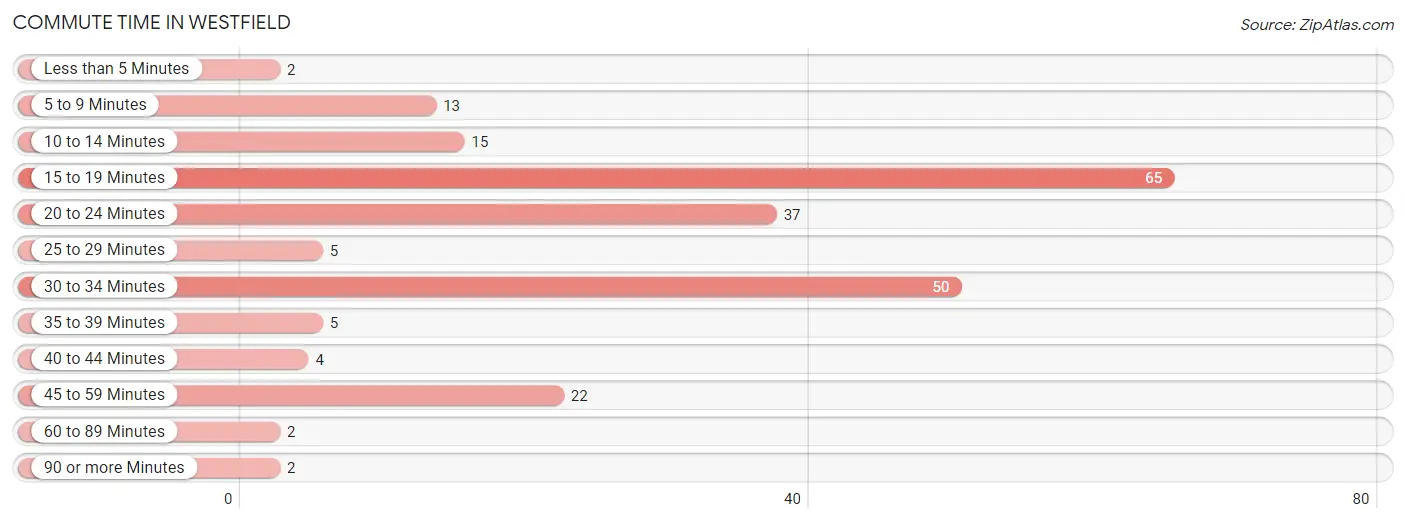
| Commute Time | # Commuters | % Commuters |
| Less than 5 Minutes | 2 | 0.9% |
| 5 to 9 Minutes | 13 | 5.9% |
| 10 to 14 Minutes | 15 | 6.8% |
| 15 to 19 Minutes | 65 | 29.3% |
| 20 to 24 Minutes | 37 | 16.7% |
| 25 to 29 Minutes | 5 | 2.2% |
| 30 to 34 Minutes | 50 | 22.5% |
| 35 to 39 Minutes | 5 | 2.2% |
| 40 to 44 Minutes | 4 | 1.8% |
| 45 to 59 Minutes | 22 | 9.9% |
| 60 to 89 Minutes | 2 | 0.9% |
| 90 or more Minutes | 2 | 0.9% |
Commute Time by Sex in Westfield
The most common commute times in Westfield are 15 to 19 minutes (39 commuters, 28.5%) for males and 15 to 19 minutes (26 commuters, 30.6%) for females.
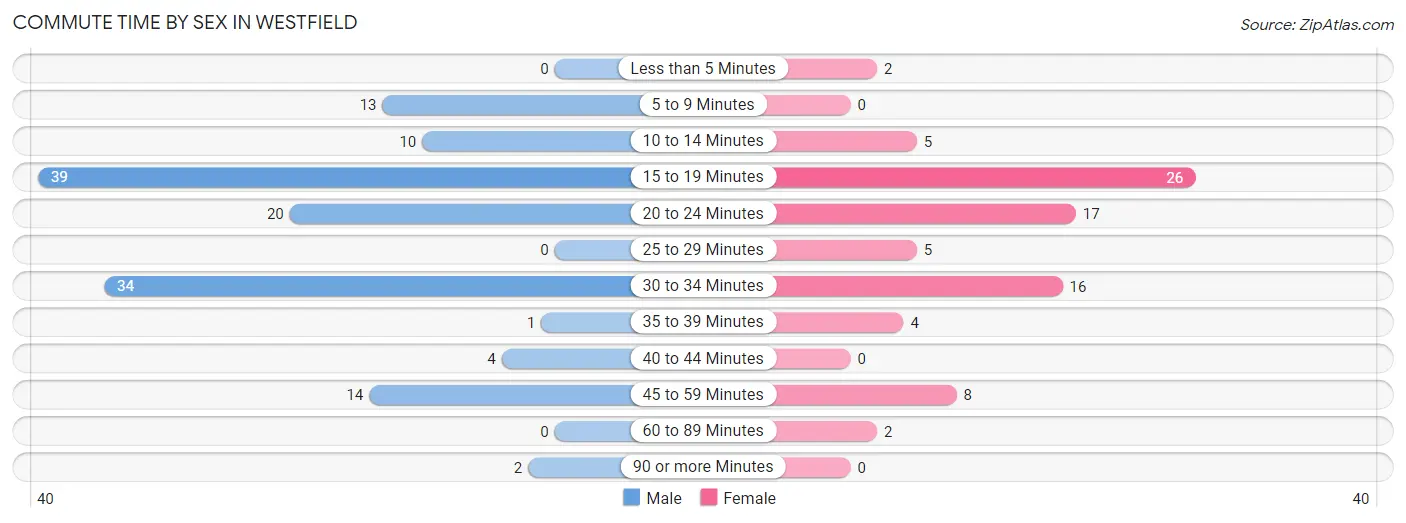
| Commute Time | Male | Female |
| Less than 5 Minutes | 0 (0.0%) | 2 (2.4%) |
| 5 to 9 Minutes | 13 (9.5%) | 0 (0.0%) |
| 10 to 14 Minutes | 10 (7.3%) | 5 (5.9%) |
| 15 to 19 Minutes | 39 (28.5%) | 26 (30.6%) |
| 20 to 24 Minutes | 20 (14.6%) | 17 (20.0%) |
| 25 to 29 Minutes | 0 (0.0%) | 5 (5.9%) |
| 30 to 34 Minutes | 34 (24.8%) | 16 (18.8%) |
| 35 to 39 Minutes | 1 (0.7%) | 4 (4.7%) |
| 40 to 44 Minutes | 4 (2.9%) | 0 (0.0%) |
| 45 to 59 Minutes | 14 (10.2%) | 8 (9.4%) |
| 60 to 89 Minutes | 0 (0.0%) | 2 (2.4%) |
| 90 or more Minutes | 2 (1.5%) | 0 (0.0%) |
Time of Departure to Work by Sex in Westfield
The most frequent times of departure to work in Westfield are 6:00 AM to 6:29 AM (30, 21.9%) for males and 7:00 AM to 7:29 AM (16, 18.8%) for females.
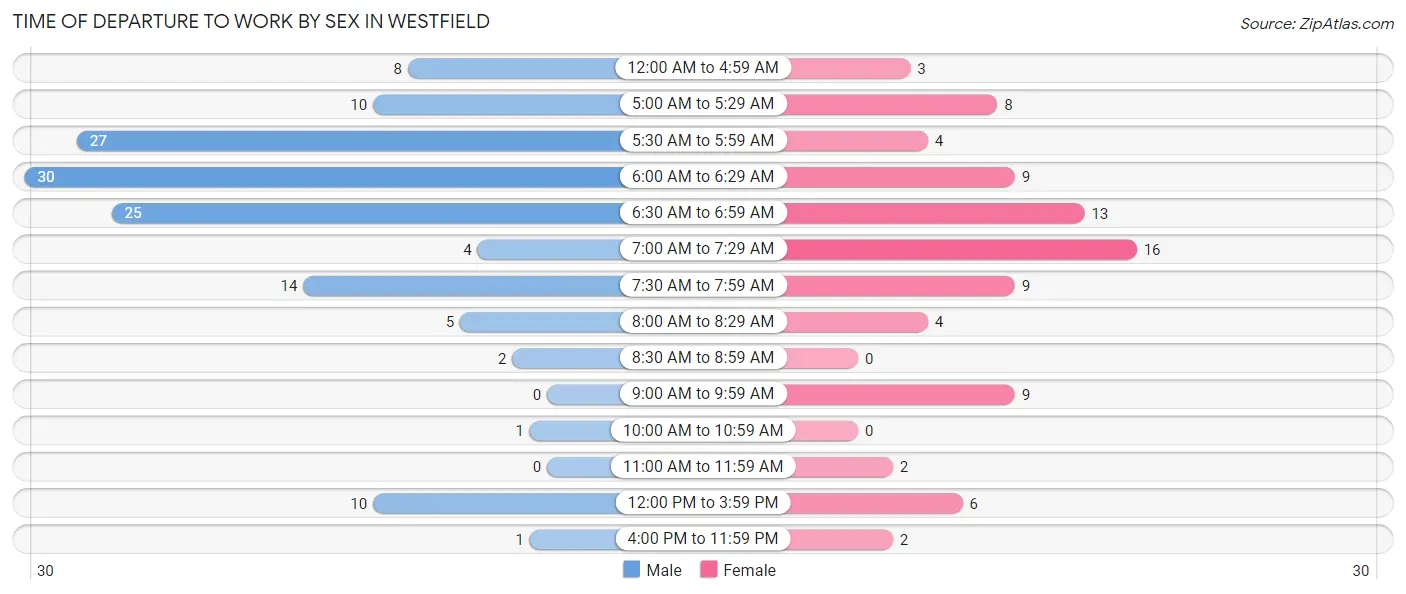
| Time of Departure | Male | Female |
| 12:00 AM to 4:59 AM | 8 (5.8%) | 3 (3.5%) |
| 5:00 AM to 5:29 AM | 10 (7.3%) | 8 (9.4%) |
| 5:30 AM to 5:59 AM | 27 (19.7%) | 4 (4.7%) |
| 6:00 AM to 6:29 AM | 30 (21.9%) | 9 (10.6%) |
| 6:30 AM to 6:59 AM | 25 (18.2%) | 13 (15.3%) |
| 7:00 AM to 7:29 AM | 4 (2.9%) | 16 (18.8%) |
| 7:30 AM to 7:59 AM | 14 (10.2%) | 9 (10.6%) |
| 8:00 AM to 8:29 AM | 5 (3.6%) | 4 (4.7%) |
| 8:30 AM to 8:59 AM | 2 (1.5%) | 0 (0.0%) |
| 9:00 AM to 9:59 AM | 0 (0.0%) | 9 (10.6%) |
| 10:00 AM to 10:59 AM | 1 (0.7%) | 0 (0.0%) |
| 11:00 AM to 11:59 AM | 0 (0.0%) | 2 (2.4%) |
| 12:00 PM to 3:59 PM | 10 (7.3%) | 6 (7.1%) |
| 4:00 PM to 11:59 PM | 1 (0.7%) | 2 (2.4%) |
| Total | 137 (100.0%) | 85 (100.0%) |
Housing Occupancy in Westfield
Occupancy by Ownership in Westfield
Of the total 210 dwellings in Westfield, owner-occupied units account for 199 (94.8%), while renter-occupied units make up 11 (5.2%).
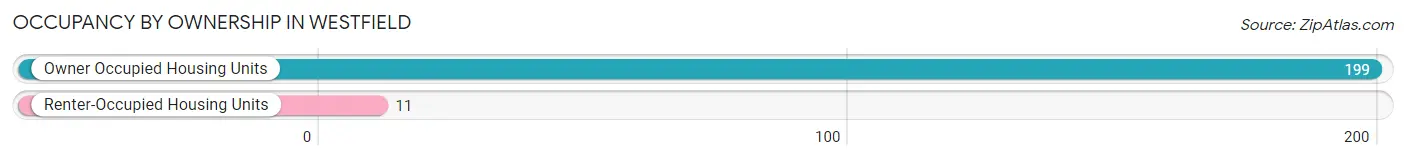
| Occupancy | # Housing Units | % Housing Units |
| Owner Occupied Housing Units | 199 | 94.8% |
| Renter-Occupied Housing Units | 11 | 5.2% |
| Total Occupied Housing Units | 210 | 100.0% |
Occupancy by Household Size in Westfield
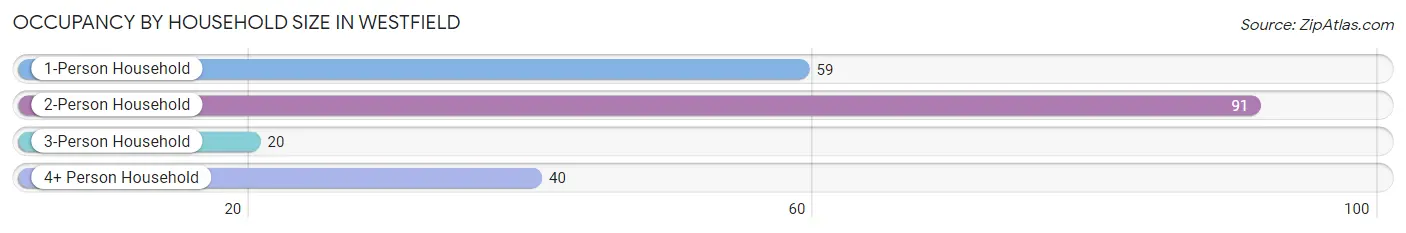
| Household Size | # Housing Units | % Housing Units |
| 1-Person Household | 59 | 28.1% |
| 2-Person Household | 91 | 43.3% |
| 3-Person Household | 20 | 9.5% |
| 4+ Person Household | 40 | 19.1% |
| Total Housing Units | 210 | 100.0% |
Occupancy by Ownership by Household Size in Westfield
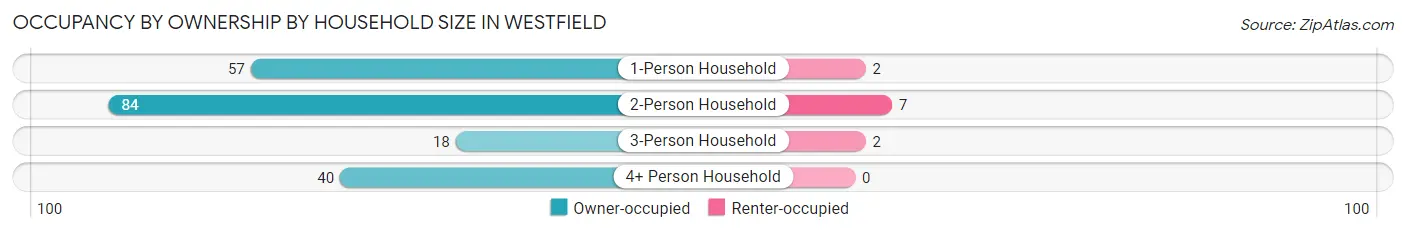
| Household Size | Owner-occupied | Renter-occupied |
| 1-Person Household | 57 (96.6%) | 2 (3.4%) |
| 2-Person Household | 84 (92.3%) | 7 (7.7%) |
| 3-Person Household | 18 (90.0%) | 2 (10.0%) |
| 4+ Person Household | 40 (100.0%) | 0 (0.0%) |
| Total Housing Units | 199 (94.8%) | 11 (5.2%) |
Occupancy by Educational Attainment in Westfield
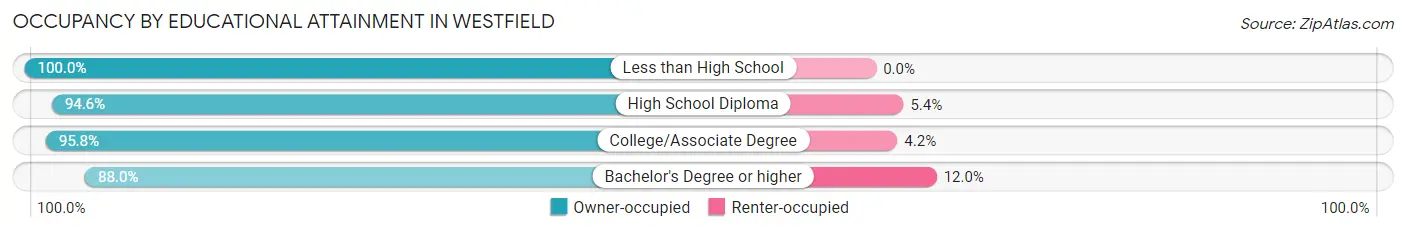
| Household Size | Owner-occupied | Renter-occupied |
| Less than High School | 16 (100.0%) | 0 (0.0%) |
| High School Diploma | 70 (94.6%) | 4 (5.4%) |
| College/Associate Degree | 91 (95.8%) | 4 (4.2%) |
| Bachelor's Degree or higher | 22 (88.0%) | 3 (12.0%) |
Occupancy by Age of Householder in Westfield
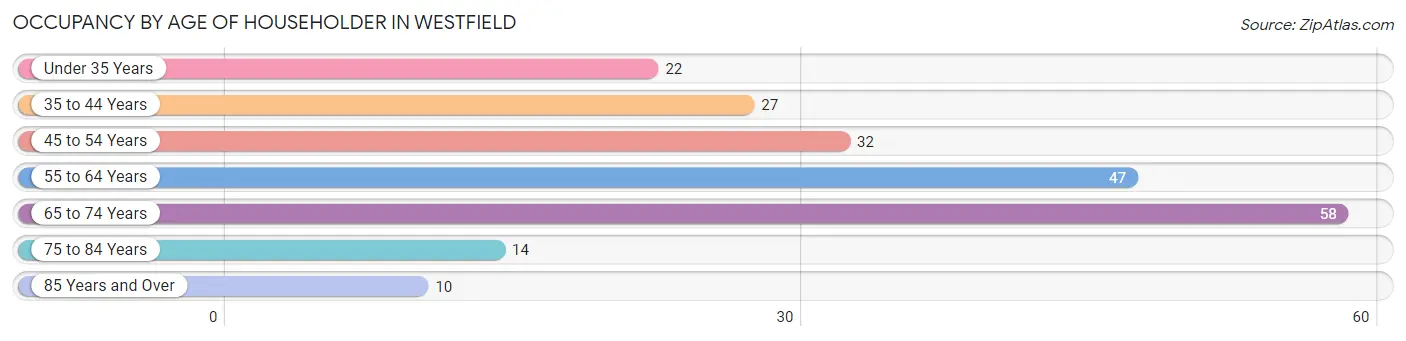
| Age Bracket | # Households | % Households |
| Under 35 Years | 22 | 10.5% |
| 35 to 44 Years | 27 | 12.9% |
| 45 to 54 Years | 32 | 15.2% |
| 55 to 64 Years | 47 | 22.4% |
| 65 to 74 Years | 58 | 27.6% |
| 75 to 84 Years | 14 | 6.7% |
| 85 Years and Over | 10 | 4.8% |
| Total | 210 | 100.0% |
Housing Finances in Westfield
Median Income by Occupancy in Westfield
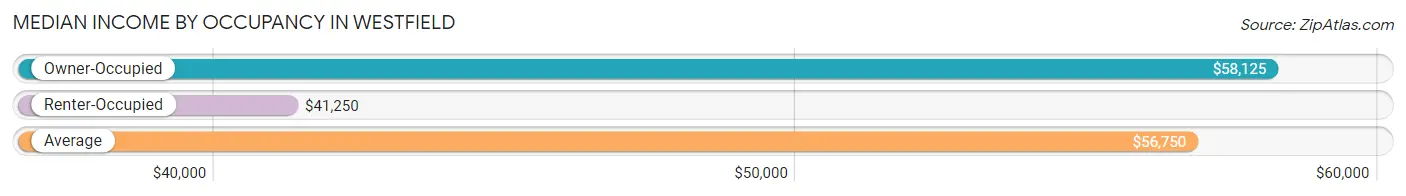
| Occupancy Type | # Households | Median Income |
| Owner-Occupied | 199 (94.8%) | $58,125 |
| Renter-Occupied | 11 (5.2%) | $41,250 |
| Average | 210 (100.0%) | $56,750 |
Occupancy by Householder Income Bracket in Westfield
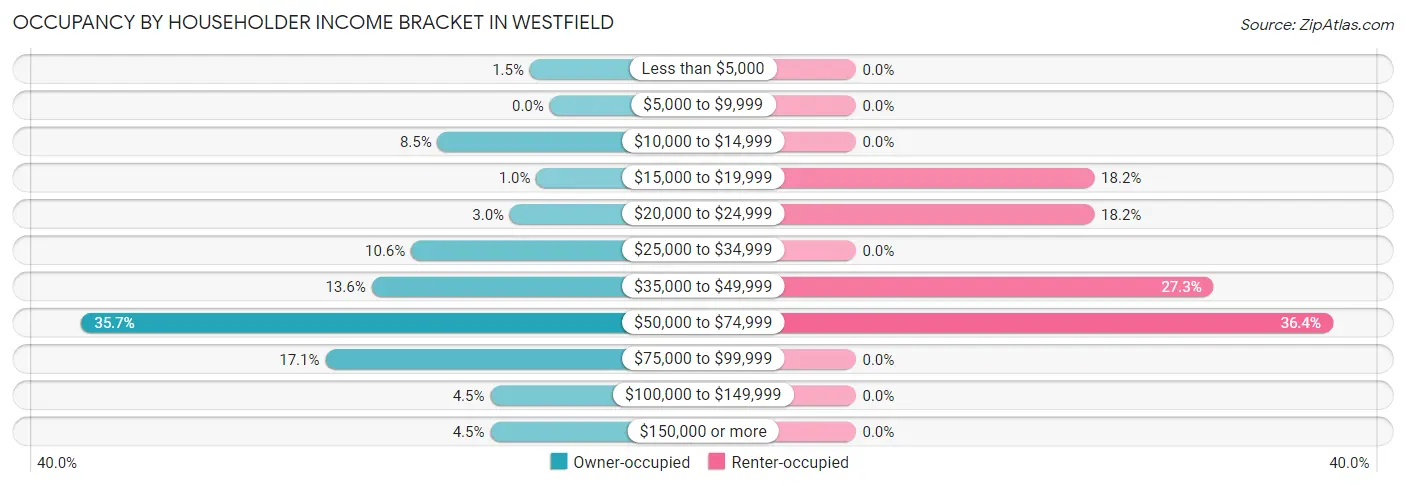
| Income Bracket | Owner-occupied | Renter-occupied |
| Less than $5,000 | 3 (1.5%) | 0 (0.0%) |
| $5,000 to $9,999 | 0 (0.0%) | 0 (0.0%) |
| $10,000 to $14,999 | 17 (8.5%) | 0 (0.0%) |
| $15,000 to $19,999 | 2 (1.0%) | 2 (18.2%) |
| $20,000 to $24,999 | 6 (3.0%) | 2 (18.2%) |
| $25,000 to $34,999 | 21 (10.5%) | 0 (0.0%) |
| $35,000 to $49,999 | 27 (13.6%) | 3 (27.3%) |
| $50,000 to $74,999 | 71 (35.7%) | 4 (36.4%) |
| $75,000 to $99,999 | 34 (17.1%) | 0 (0.0%) |
| $100,000 to $149,999 | 9 (4.5%) | 0 (0.0%) |
| $150,000 or more | 9 (4.5%) | 0 (0.0%) |
| Total | 199 (100.0%) | 11 (100.0%) |
Monthly Housing Cost Tiers in Westfield
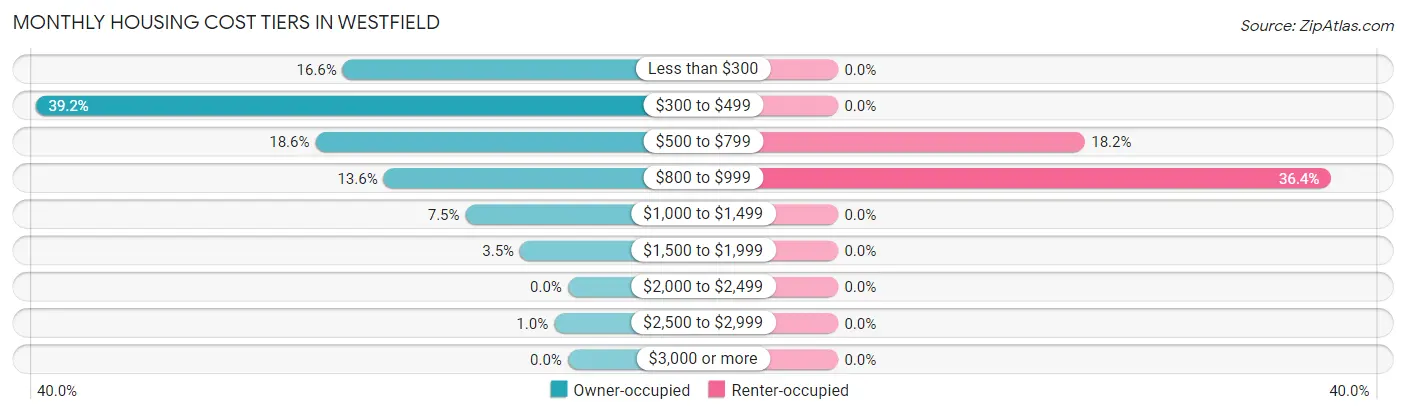
| Monthly Cost | Owner-occupied | Renter-occupied |
| Less than $300 | 33 (16.6%) | 0 (0.0%) |
| $300 to $499 | 78 (39.2%) | 0 (0.0%) |
| $500 to $799 | 37 (18.6%) | 2 (18.2%) |
| $800 to $999 | 27 (13.6%) | 4 (36.4%) |
| $1,000 to $1,499 | 15 (7.5%) | 0 (0.0%) |
| $1,500 to $1,999 | 7 (3.5%) | 0 (0.0%) |
| $2,000 to $2,499 | 0 (0.0%) | 0 (0.0%) |
| $2,500 to $2,999 | 2 (1.0%) | 0 (0.0%) |
| $3,000 or more | 0 (0.0%) | 0 (0.0%) |
| Total | 199 (100.0%) | 11 (100.0%) |
Physical Housing Characteristics in Westfield
Housing Structures in Westfield
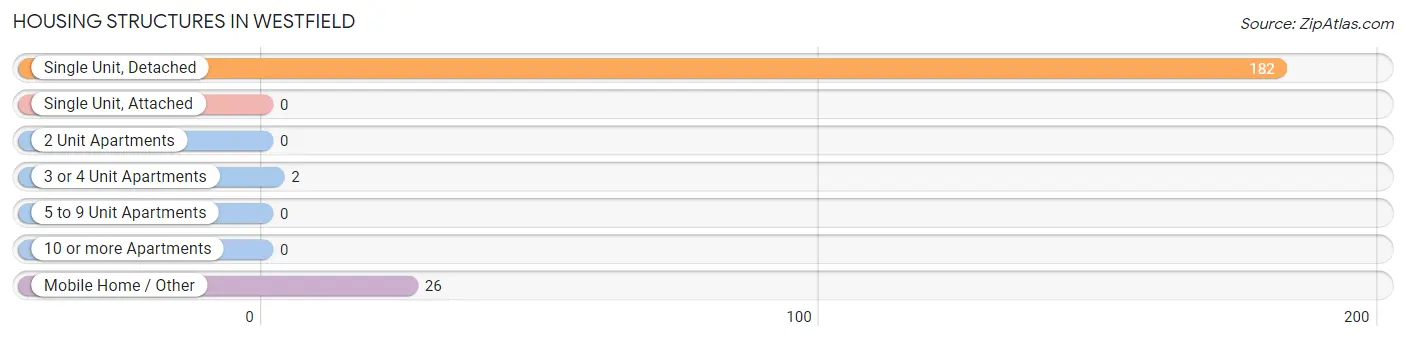
| Structure Type | # Housing Units | % Housing Units |
| Single Unit, Detached | 182 | 86.7% |
| Single Unit, Attached | 0 | 0.0% |
| 2 Unit Apartments | 0 | 0.0% |
| 3 or 4 Unit Apartments | 2 | 0.9% |
| 5 to 9 Unit Apartments | 0 | 0.0% |
| 10 or more Apartments | 0 | 0.0% |
| Mobile Home / Other | 26 | 12.4% |
| Total | 210 | 100.0% |
Housing Structures by Occupancy in Westfield
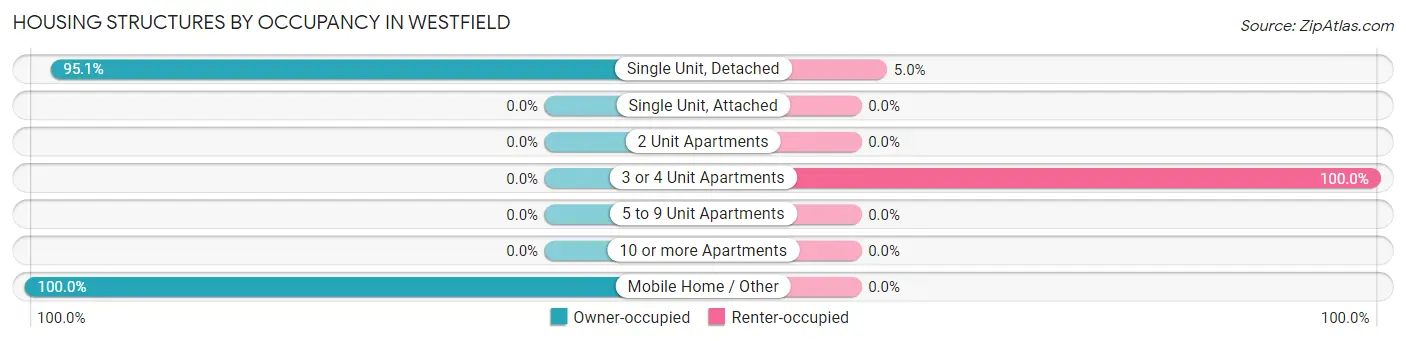
| Structure Type | Owner-occupied | Renter-occupied |
| Single Unit, Detached | 173 (95.1%) | 9 (5.0%) |
| Single Unit, Attached | 0 (0.0%) | 0 (0.0%) |
| 2 Unit Apartments | 0 (0.0%) | 0 (0.0%) |
| 3 or 4 Unit Apartments | 0 (0.0%) | 2 (100.0%) |
| 5 to 9 Unit Apartments | 0 (0.0%) | 0 (0.0%) |
| 10 or more Apartments | 0 (0.0%) | 0 (0.0%) |
| Mobile Home / Other | 26 (100.0%) | 0 (0.0%) |
| Total | 199 (94.8%) | 11 (5.2%) |
Housing Structures by Number of Rooms in Westfield
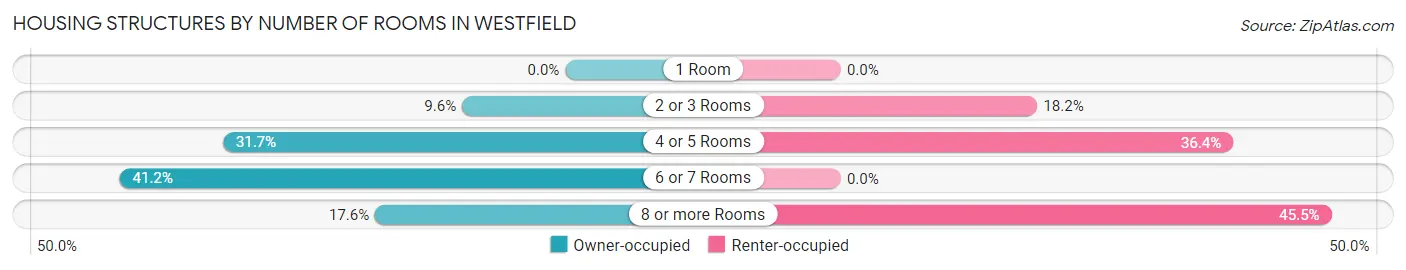
| Number of Rooms | Owner-occupied | Renter-occupied |
| 1 Room | 0 (0.0%) | 0 (0.0%) |
| 2 or 3 Rooms | 19 (9.6%) | 2 (18.2%) |
| 4 or 5 Rooms | 63 (31.7%) | 4 (36.4%) |
| 6 or 7 Rooms | 82 (41.2%) | 0 (0.0%) |
| 8 or more Rooms | 35 (17.6%) | 5 (45.5%) |
| Total | 199 (100.0%) | 11 (100.0%) |
Housing Structure by Heating Type in Westfield
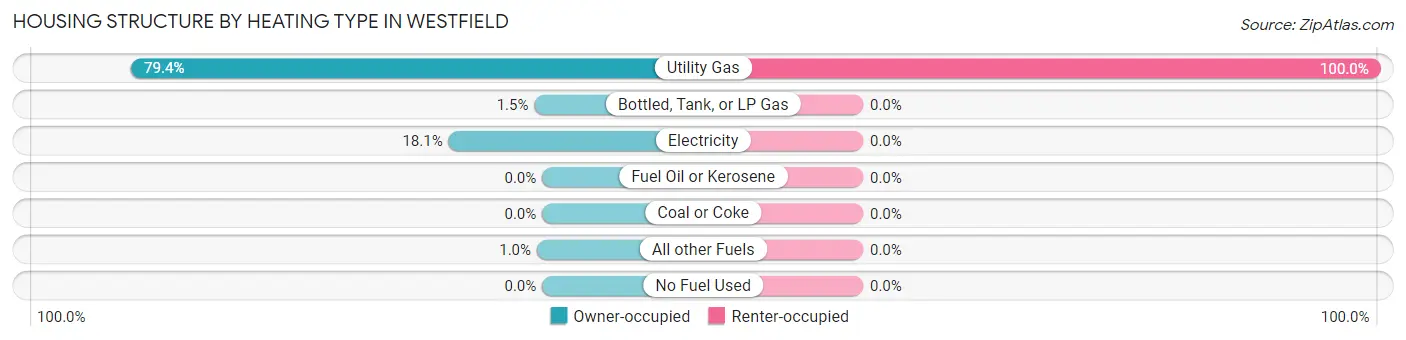
| Heating Type | Owner-occupied | Renter-occupied |
| Utility Gas | 158 (79.4%) | 11 (100.0%) |
| Bottled, Tank, or LP Gas | 3 (1.5%) | 0 (0.0%) |
| Electricity | 36 (18.1%) | 0 (0.0%) |
| Fuel Oil or Kerosene | 0 (0.0%) | 0 (0.0%) |
| Coal or Coke | 0 (0.0%) | 0 (0.0%) |
| All other Fuels | 2 (1.0%) | 0 (0.0%) |
| No Fuel Used | 0 (0.0%) | 0 (0.0%) |
| Total | 199 (100.0%) | 11 (100.0%) |
Household Vehicle Usage in Westfield
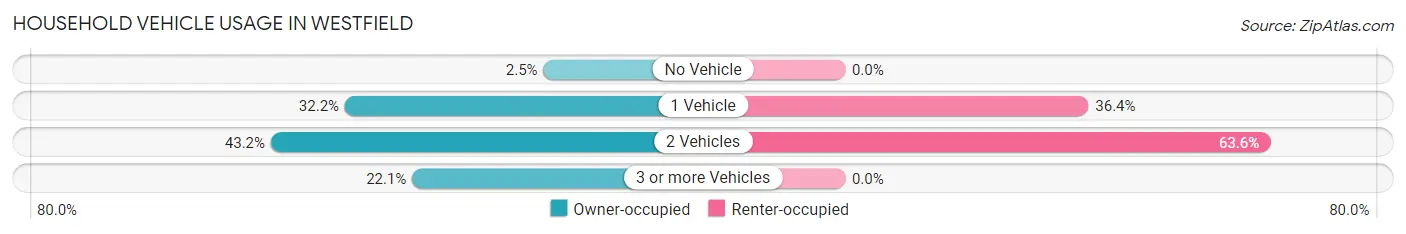
| Vehicles per Household | Owner-occupied | Renter-occupied |
| No Vehicle | 5 (2.5%) | 0 (0.0%) |
| 1 Vehicle | 64 (32.2%) | 4 (36.4%) |
| 2 Vehicles | 86 (43.2%) | 7 (63.6%) |
| 3 or more Vehicles | 44 (22.1%) | 0 (0.0%) |
| Total | 199 (100.0%) | 11 (100.0%) |
Real Estate & Mortgages in Westfield
Real Estate and Mortgage Overview in Westfield
| Characteristic | Without Mortgage | With Mortgage |
| Housing Units | 129 | 70 |
| Median Property Value | $55,000 | $78,500 |
| Median Household Income | $53,558 | $9 |
| Monthly Housing Costs | $337 | $0 |
| Real Estate Taxes | $474 | $2 |
Property Value by Mortgage Status in Westfield
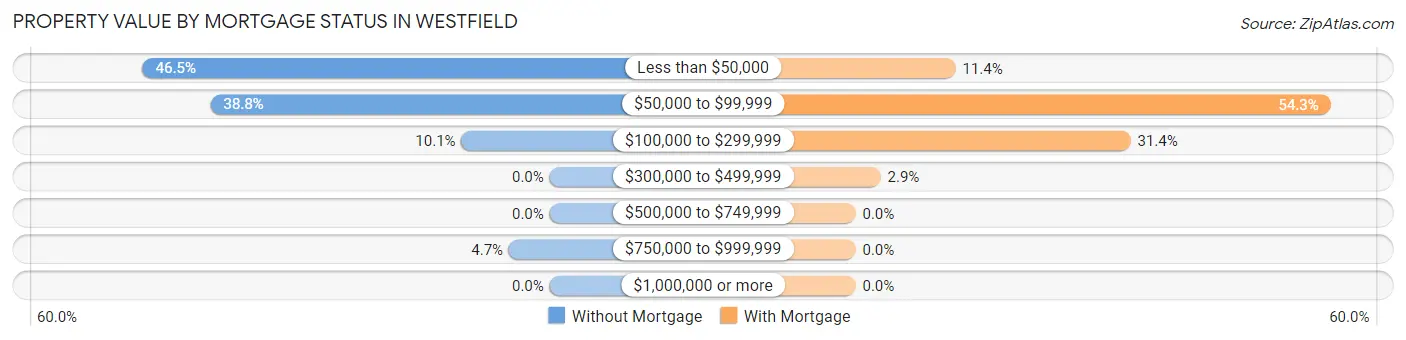
| Property Value | Without Mortgage | With Mortgage |
| Less than $50,000 | 60 (46.5%) | 8 (11.4%) |
| $50,000 to $99,999 | 50 (38.8%) | 38 (54.3%) |
| $100,000 to $299,999 | 13 (10.1%) | 22 (31.4%) |
| $300,000 to $499,999 | 0 (0.0%) | 2 (2.9%) |
| $500,000 to $749,999 | 0 (0.0%) | 0 (0.0%) |
| $750,000 to $999,999 | 6 (4.6%) | 0 (0.0%) |
| $1,000,000 or more | 0 (0.0%) | 0 (0.0%) |
| Total | 129 (100.0%) | 70 (100.0%) |
Household Income by Mortgage Status in Westfield
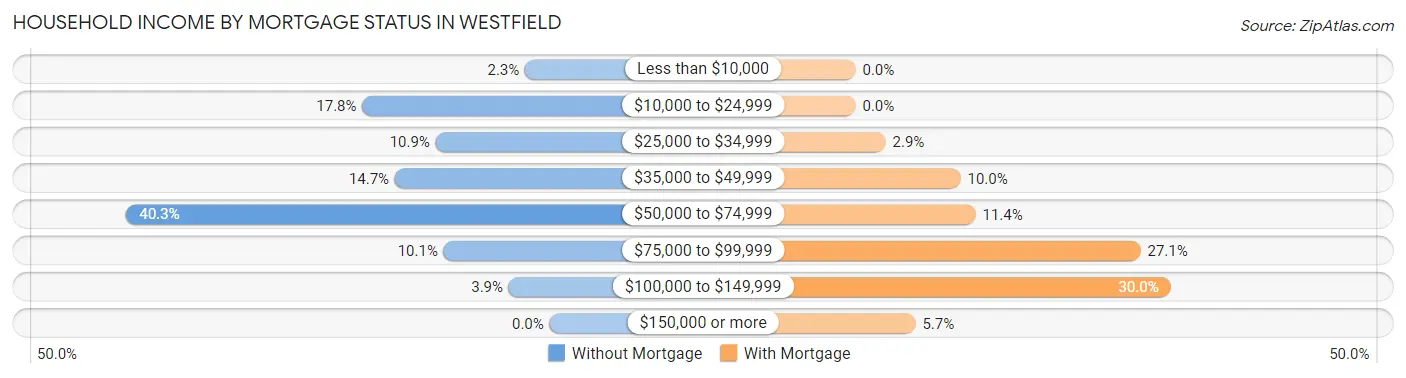
| Household Income | Without Mortgage | With Mortgage |
| Less than $10,000 | 3 (2.3%) | 0 (0.0%) |
| $10,000 to $24,999 | 23 (17.8%) | 0 (0.0%) |
| $25,000 to $34,999 | 14 (10.8%) | 2 (2.9%) |
| $35,000 to $49,999 | 19 (14.7%) | 7 (10.0%) |
| $50,000 to $74,999 | 52 (40.3%) | 8 (11.4%) |
| $75,000 to $99,999 | 13 (10.1%) | 19 (27.1%) |
| $100,000 to $149,999 | 5 (3.9%) | 21 (30.0%) |
| $150,000 or more | 0 (0.0%) | 4 (5.7%) |
| Total | 129 (100.0%) | 70 (100.0%) |
Property Value to Household Income Ratio in Westfield
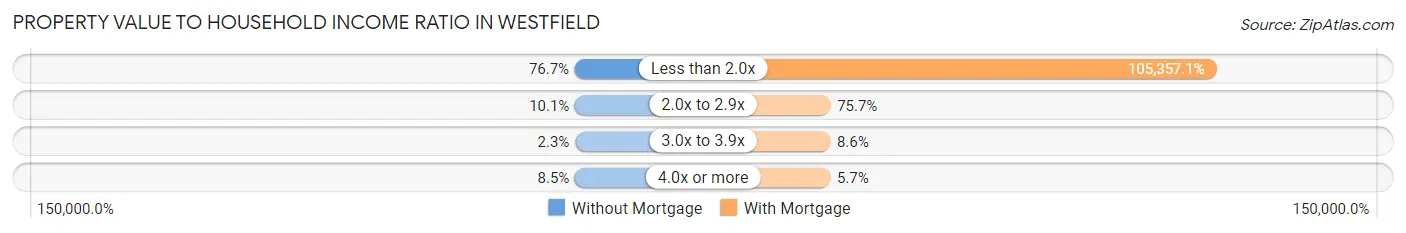
| Value-to-Income Ratio | Without Mortgage | With Mortgage |
| Less than 2.0x | 99 (76.7%) | 73,750 (105,357.1%) |
| 2.0x to 2.9x | 13 (10.1%) | 53 (75.7%) |
| 3.0x to 3.9x | 3 (2.3%) | 6 (8.6%) |
| 4.0x or more | 11 (8.5%) | 4 (5.7%) |
| Total | 129 (100.0%) | 70 (100.0%) |
Real Estate Taxes by Mortgage Status in Westfield
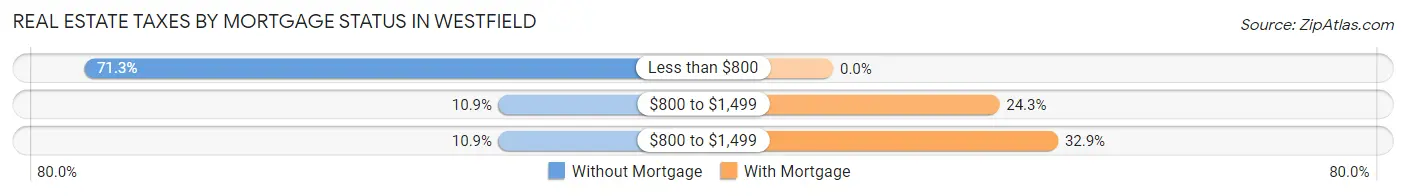
| Property Taxes | Without Mortgage | With Mortgage |
| Less than $800 | 92 (71.3%) | 0 (0.0%) |
| $800 to $1,499 | 14 (10.8%) | 17 (24.3%) |
| $800 to $1,499 | 14 (10.8%) | 23 (32.9%) |
| Total | 129 (100.0%) | 70 (100.0%) |
Health & Disability in Westfield
Health Insurance Coverage by Age in Westfield
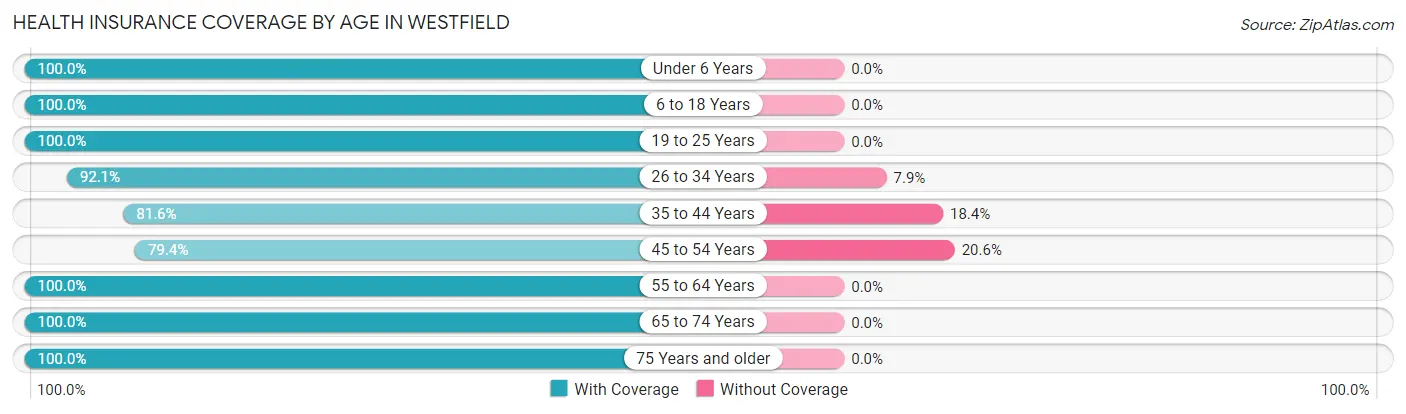
| Age Bracket | With Coverage | Without Coverage |
| Under 6 Years | 18 (100.0%) | 0 (0.0%) |
| 6 to 18 Years | 77 (100.0%) | 0 (0.0%) |
| 19 to 25 Years | 62 (100.0%) | 0 (0.0%) |
| 26 to 34 Years | 35 (92.1%) | 3 (7.9%) |
| 35 to 44 Years | 31 (81.6%) | 7 (18.4%) |
| 45 to 54 Years | 54 (79.4%) | 14 (20.6%) |
| 55 to 64 Years | 71 (100.0%) | 0 (0.0%) |
| 65 to 74 Years | 96 (100.0%) | 0 (0.0%) |
| 75 Years and older | 35 (100.0%) | 0 (0.0%) |
| Total | 479 (95.2%) | 24 (4.8%) |
Health Insurance Coverage by Citizenship Status in Westfield
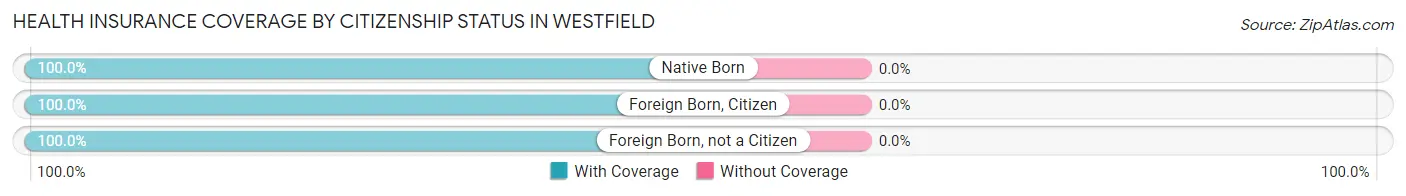
| Citizenship Status | With Coverage | Without Coverage |
| Native Born | 18 (100.0%) | 0 (0.0%) |
| Foreign Born, Citizen | 77 (100.0%) | 0 (0.0%) |
| Foreign Born, not a Citizen | 62 (100.0%) | 0 (0.0%) |
Health Insurance Coverage by Household Income in Westfield
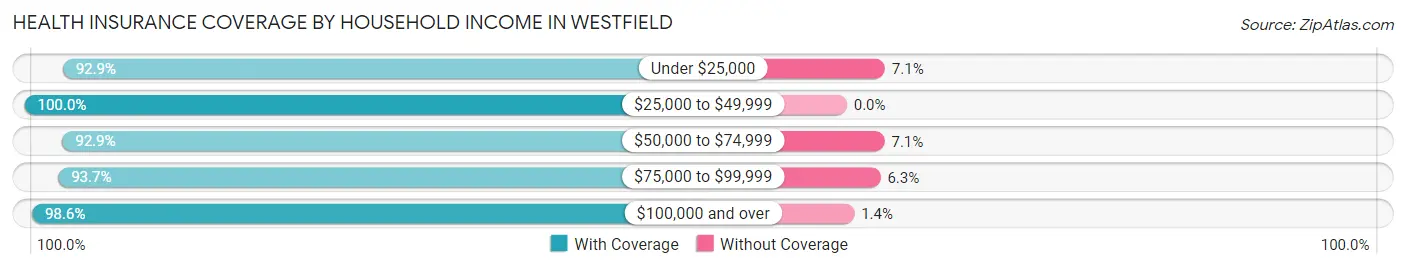
| Household Income | With Coverage | Without Coverage |
| Under $25,000 | 39 (92.9%) | 3 (7.1%) |
| $25,000 to $49,999 | 94 (100.0%) | 0 (0.0%) |
| $50,000 to $74,999 | 171 (92.9%) | 13 (7.1%) |
| $75,000 to $99,999 | 104 (93.7%) | 7 (6.3%) |
| $100,000 and over | 71 (98.6%) | 1 (1.4%) |
Public vs Private Health Insurance Coverage by Age in Westfield
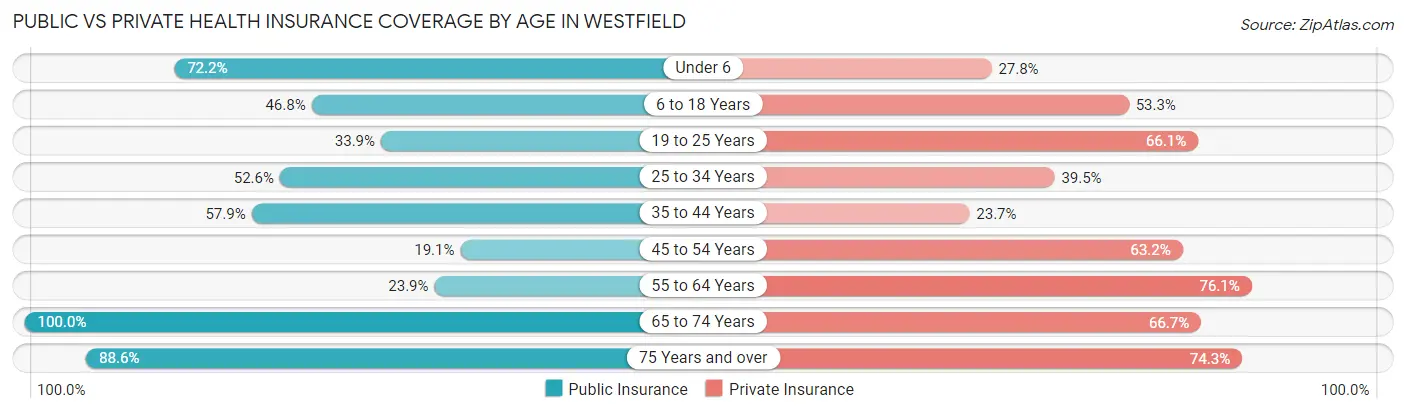
| Age Bracket | Public Insurance | Private Insurance |
| Under 6 | 13 (72.2%) | 5 (27.8%) |
| 6 to 18 Years | 36 (46.8%) | 41 (53.2%) |
| 19 to 25 Years | 21 (33.9%) | 41 (66.1%) |
| 25 to 34 Years | 20 (52.6%) | 15 (39.5%) |
| 35 to 44 Years | 22 (57.9%) | 9 (23.7%) |
| 45 to 54 Years | 13 (19.1%) | 43 (63.2%) |
| 55 to 64 Years | 17 (23.9%) | 54 (76.1%) |
| 65 to 74 Years | 96 (100.0%) | 64 (66.7%) |
| 75 Years and over | 31 (88.6%) | 26 (74.3%) |
| Total | 269 (53.5%) | 298 (59.2%) |
Disability Status by Sex by Age in Westfield
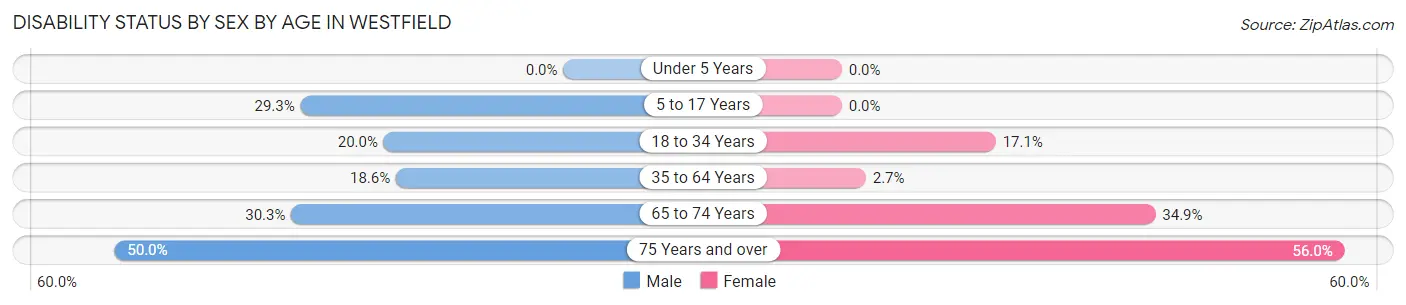
| Age Bracket | Male | Female |
| Under 5 Years | 0 (0.0%) | 0 (0.0%) |
| 5 to 17 Years | 12 (29.3%) | 0 (0.0%) |
| 18 to 34 Years | 14 (20.0%) | 6 (17.1%) |
| 35 to 64 Years | 19 (18.6%) | 2 (2.7%) |
| 65 to 74 Years | 10 (30.3%) | 22 (34.9%) |
| 75 Years and over | 5 (50.0%) | 14 (56.0%) |
Disability Class by Sex by Age in Westfield
Disability Class: Hearing Difficulty
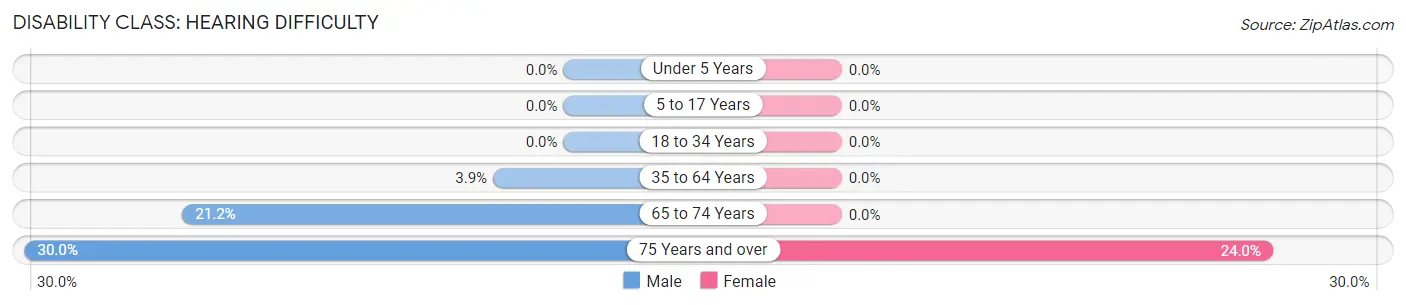
| Age Bracket | Male | Female |
| Under 5 Years | 0 (0.0%) | 0 (0.0%) |
| 5 to 17 Years | 0 (0.0%) | 0 (0.0%) |
| 18 to 34 Years | 0 (0.0%) | 0 (0.0%) |
| 35 to 64 Years | 4 (3.9%) | 0 (0.0%) |
| 65 to 74 Years | 7 (21.2%) | 0 (0.0%) |
| 75 Years and over | 3 (30.0%) | 6 (24.0%) |
Disability Class: Vision Difficulty
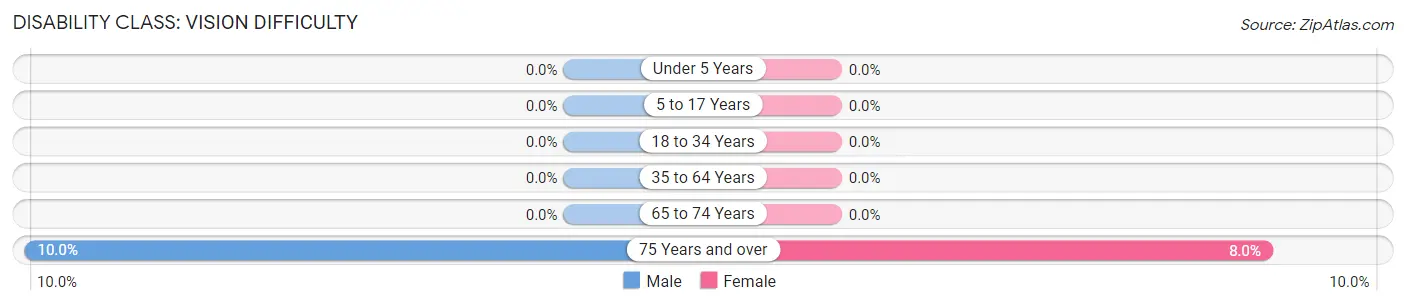
| Age Bracket | Male | Female |
| Under 5 Years | 0 (0.0%) | 0 (0.0%) |
| 5 to 17 Years | 0 (0.0%) | 0 (0.0%) |
| 18 to 34 Years | 0 (0.0%) | 0 (0.0%) |
| 35 to 64 Years | 0 (0.0%) | 0 (0.0%) |
| 65 to 74 Years | 0 (0.0%) | 0 (0.0%) |
| 75 Years and over | 1 (10.0%) | 2 (8.0%) |
Disability Class: Cognitive Difficulty
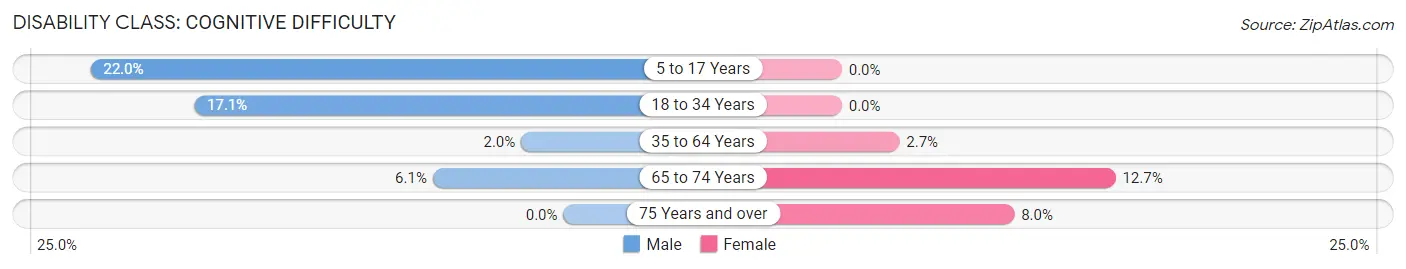
| Age Bracket | Male | Female |
| 5 to 17 Years | 9 (22.0%) | 0 (0.0%) |
| 18 to 34 Years | 12 (17.1%) | 0 (0.0%) |
| 35 to 64 Years | 2 (2.0%) | 2 (2.7%) |
| 65 to 74 Years | 2 (6.1%) | 8 (12.7%) |
| 75 Years and over | 0 (0.0%) | 2 (8.0%) |
Disability Class: Ambulatory Difficulty
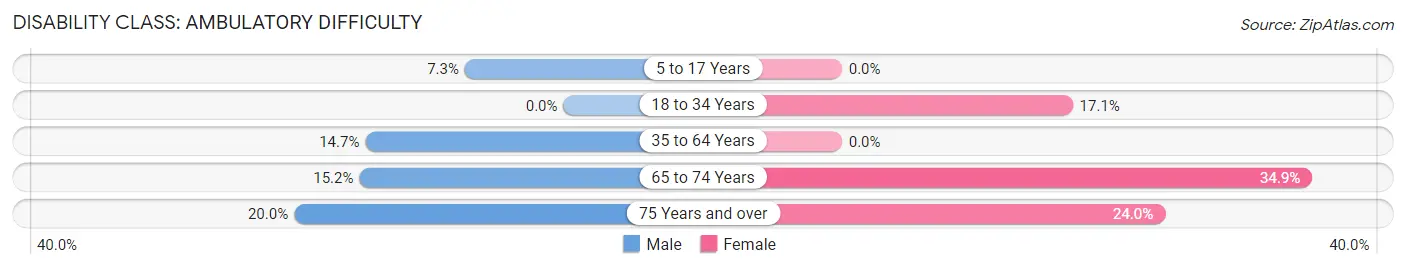
| Age Bracket | Male | Female |
| 5 to 17 Years | 3 (7.3%) | 0 (0.0%) |
| 18 to 34 Years | 0 (0.0%) | 6 (17.1%) |
| 35 to 64 Years | 15 (14.7%) | 0 (0.0%) |
| 65 to 74 Years | 5 (15.1%) | 22 (34.9%) |
| 75 Years and over | 2 (20.0%) | 6 (24.0%) |
Disability Class: Self-Care Difficulty
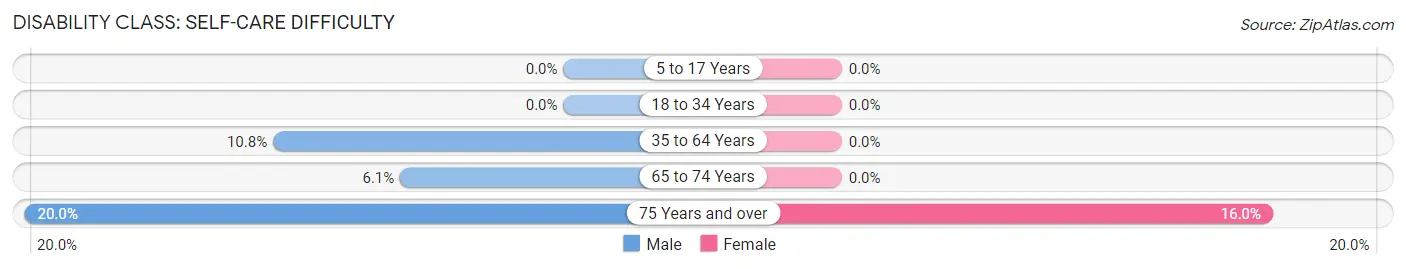
| Age Bracket | Male | Female |
| 5 to 17 Years | 0 (0.0%) | 0 (0.0%) |
| 18 to 34 Years | 0 (0.0%) | 0 (0.0%) |
| 35 to 64 Years | 11 (10.8%) | 0 (0.0%) |
| 65 to 74 Years | 2 (6.1%) | 0 (0.0%) |
| 75 Years and over | 2 (20.0%) | 4 (16.0%) |
Technology Access in Westfield
Computing Device Access in Westfield
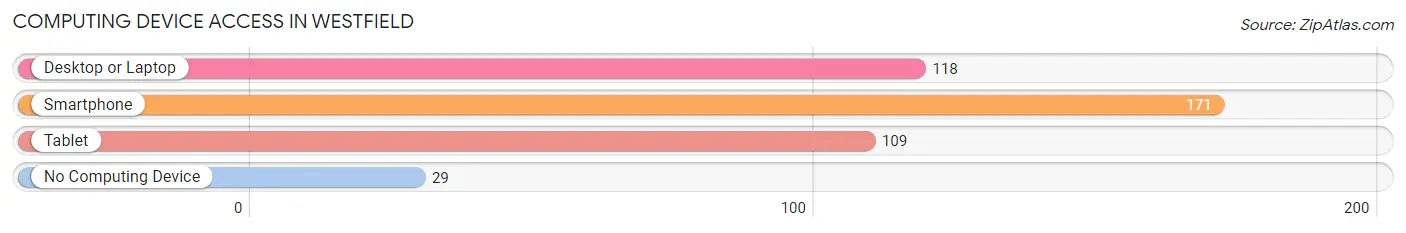
| Device Type | # Households | % Households |
| Desktop or Laptop | 118 | 56.2% |
| Smartphone | 171 | 81.4% |
| Tablet | 109 | 51.9% |
| No Computing Device | 29 | 13.8% |
| Total | 210 | 100.0% |
Internet Access in Westfield
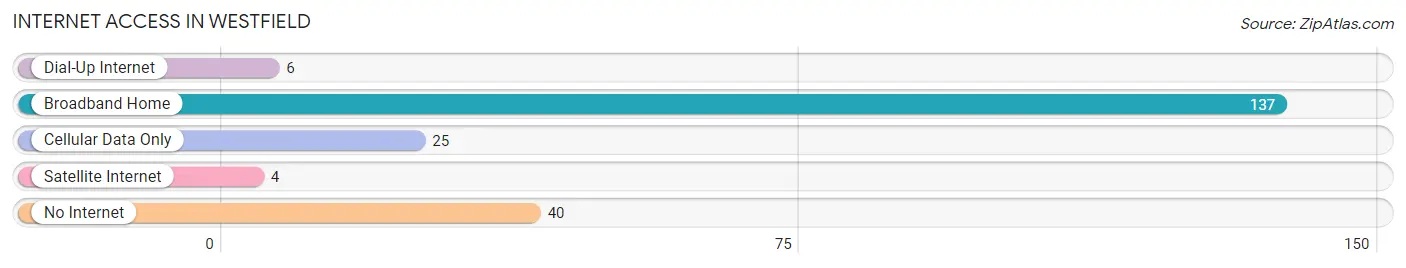
| Internet Type | # Households | % Households |
| Dial-Up Internet | 6 | 2.9% |
| Broadband Home | 137 | 65.2% |
| Cellular Data Only | 25 | 11.9% |
| Satellite Internet | 4 | 1.9% |
| No Internet | 40 | 19.1% |
| Total | 210 | 100.0% |
Westfield Summary
History
Westfield, Illinois is a small village located in the northern part of the state, in the county of LaSalle. It is situated on the banks of the Fox River, and is part of the Ottawa-Streator Micropolitan Statistical Area. The village was first settled in 1835 by a group of settlers from New York, led by William and Mary Westfield. The village was originally known as Westfield’s Landing, and was later changed to Westfield.
The village was officially incorporated in 1867, and the first mayor was William Westfield. The village was a small farming community, and the main crops were corn, wheat, and oats. The village also had a few small businesses, such as a general store, a blacksmith shop, and a sawmill.
In the late 19th century, the village began to grow and develop. The first school was built in 1876, and the first church was built in 1877. The village also had a post office, a bank, and a newspaper.
In the early 20th century, the village continued to grow and develop. The first telephone service was established in 1906, and the first electric service was established in 1910. The village also had a fire department, a library, and a hospital.
In the late 20th century, the village continued to grow and develop. The village was connected to the interstate highway system in the 1970s, and the village was connected to the internet in the 1990s.
Geography
Westfield is located in the northern part of the state of Illinois, in the county of LaSalle. It is situated on the banks of the Fox River, and is part of the Ottawa-Streator Micropolitan Statistical Area. The village is located about 50 miles southwest of Chicago, and about 25 miles east of Rockford.
The village has a total area of 1.2 square miles, all of which is land. The village is located in a flat, open area, with no major hills or mountains. The climate is humid continental, with hot summers and cold winters.
Economy
The economy of Westfield is largely based on agriculture and manufacturing. The village is home to several large farms, which produce corn, wheat, and oats. The village also has several small businesses, such as a general store, a blacksmith shop, and a sawmill.
The village is also home to several manufacturing companies, which produce a variety of products, such as furniture, clothing, and electronics. The village is also home to several small businesses, such as restaurants, bars, and shops.
Demographics
As of the 2010 census, the village had a population of 1,845. The population is largely white (94.3%), with small percentages of African American (2.2%), Hispanic (1.7%), and Asian (1.2%) residents. The median household income is $50,000, and the median home value is $125,000. The village has a high school graduation rate of 95%, and a college graduation rate of 40%.
Common Questions
What is Per Capita Income in Westfield?
Per Capita income in Westfield is $26,104.
What is the Median Family Income in Westfield?
Median Family Income in Westfield is $60,625.
What is the Median Household income in Westfield?
Median Household Income in Westfield is $56,750.
What is Income or Wage Gap in Westfield?
Income or Wage Gap in Westfield is 46.5%.
Women in Westfield earn 53.5 cents for every dollar earned by a man.
What is Inequality or Gini Index in Westfield?
Inequality or Gini Index in Westfield is 0.33.
What is the Total Population of Westfield?
Total Population of Westfield is 503.
What is the Total Male Population of Westfield?
Total Male Population of Westfield is 256.
What is the Total Female Population of Westfield?
Total Female Population of Westfield is 247.
What is the Ratio of Males per 100 Females in Westfield?
There are 103.64 Males per 100 Females in Westfield.
What is the Ratio of Females per 100 Males in Westfield?
There are 96.48 Females per 100 Males in Westfield.
What is the Median Population Age in Westfield?
Median Population Age in Westfield is 48.5 Years.
What is the Average Family Size in Westfield
Average Family Size in Westfield is 2.7 People.
What is the Average Household Size in Westfield
Average Household Size in Westfield is 2.4 People.
How Large is the Labor Force in Westfield?
There are 237 People in the Labor Forcein in Westfield.
What is the Percentage of People in the Labor Force in Westfield?
55.5% of People are in the Labor Force in Westfield.
What is the Unemployment Rate in Westfield?
Unemployment Rate in Westfield is 6.3%.