Walnut, IL Map & Demographics
Walnut Map
Walnut Overview
$30,193
PER CAPITA INCOME
$75,750
AVG FAMILY INCOME
$55,515
AVG HOUSEHOLD INCOME
44.9%
WAGE / INCOME GAP [ % ]
55.1¢/ $1
WAGE / INCOME GAP [ $ ]
0.38
INEQUALITY / GINI INDEX
1,348
TOTAL POPULATION
659
MALE POPULATION
689
FEMALE POPULATION
95.65
MALES / 100 FEMALES
104.55
FEMALES / 100 MALES
40.8
MEDIAN AGE
2.8
AVG FAMILY SIZE
2.2
AVG HOUSEHOLD SIZE
765
LABOR FORCE [ PEOPLE ]
70.8%
PERCENT IN LABOR FORCE
6.0%
UNEMPLOYMENT RATE
Walnut Zip Codes
Walnut Area Codes
Income in Walnut
Income Overview in Walnut
Per Capita Income in Walnut is $30,193, while median incomes of families and households are $75,750 and $55,515 respectively.
| Characteristic | Number | Measure |
| Per Capita Income | 1,348 | $30,193 |
| Median Family Income | 349 | $75,750 |
| Mean Family Income | 349 | $83,170 |
| Median Household Income | 583 | $55,515 |
| Mean Household Income | 583 | $67,011 |
| Income Deficit | 349 | $0 |
| Wage / Income Gap (%) | 1,348 | 44.94% |
| Wage / Income Gap ($) | 1,348 | 55.06¢ per $1 |
| Gini / Inequality Index | 1,348 | 0.38 |
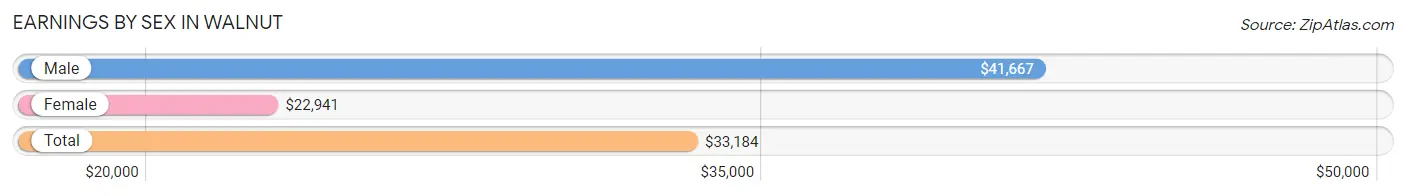
Earnings by Sex in Walnut
Average Earnings in Walnut are $33,184, $41,667 for men and $22,941 for women, a difference of 44.9%.
| Sex | Number | Average Earnings |
| Male | 376 (48.0%) | $41,667 |
| Female | 408 (52.0%) | $22,941 |
| Total | 784 (100.0%) | $33,184 |
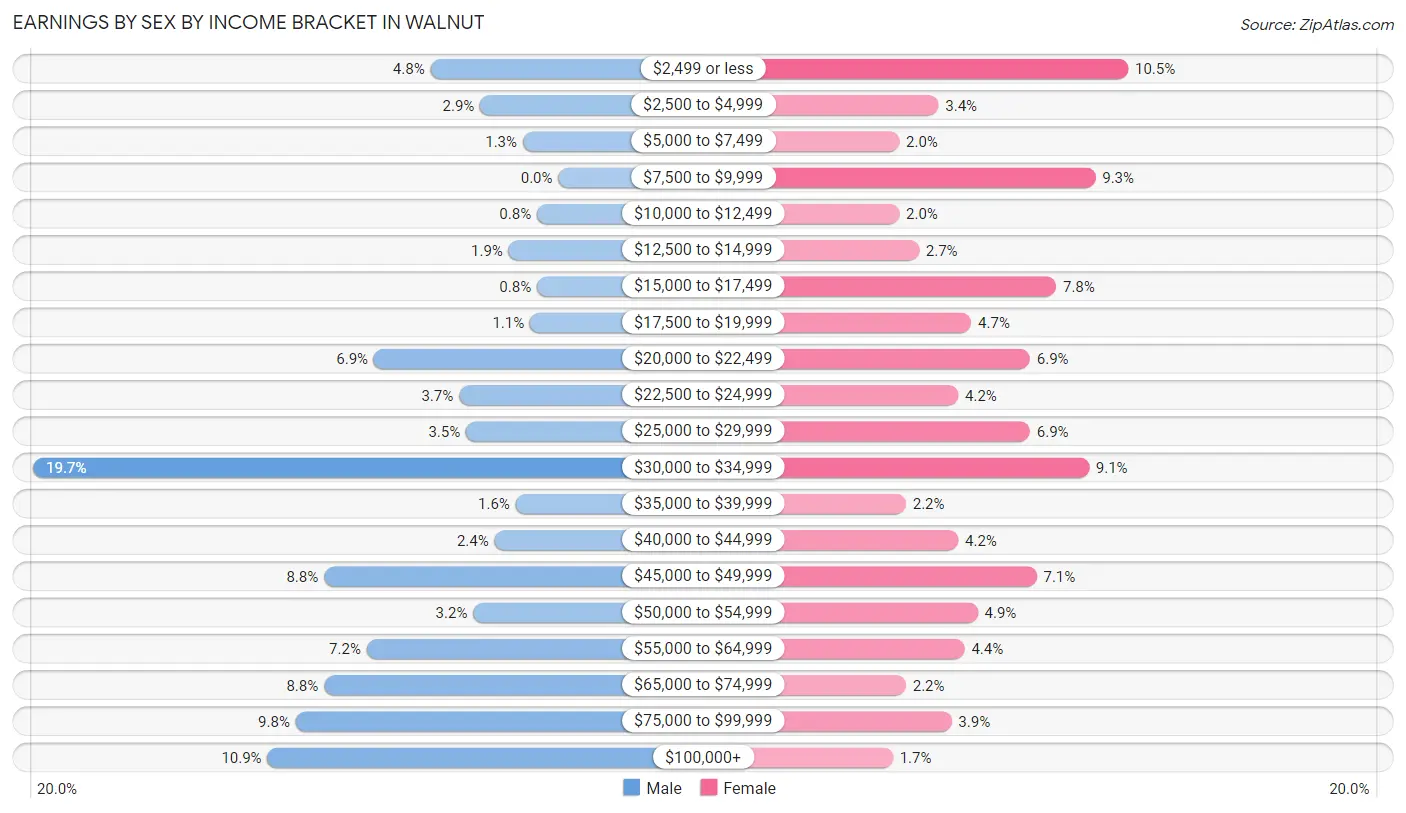
Earnings by Sex by Income Bracket in Walnut
The most common earnings brackets in Walnut are $30,000 to $34,999 for men (74 | 19.7%) and $2,499 or less for women (43 | 10.5%).
| Income | Male | Female |
| $2,499 or less | 18 (4.8%) | 43 (10.5%) |
| $2,500 to $4,999 | 11 (2.9%) | 14 (3.4%) |
| $5,000 to $7,499 | 5 (1.3%) | 8 (2.0%) |
| $7,500 to $9,999 | 0 (0.0%) | 38 (9.3%) |
| $10,000 to $12,499 | 3 (0.8%) | 8 (2.0%) |
| $12,500 to $14,999 | 7 (1.9%) | 11 (2.7%) |
| $15,000 to $17,499 | 3 (0.8%) | 32 (7.8%) |
| $17,500 to $19,999 | 4 (1.1%) | 19 (4.7%) |
| $20,000 to $22,499 | 26 (6.9%) | 28 (6.9%) |
| $22,500 to $24,999 | 14 (3.7%) | 17 (4.2%) |
| $25,000 to $29,999 | 13 (3.5%) | 28 (6.9%) |
| $30,000 to $34,999 | 74 (19.7%) | 37 (9.1%) |
| $35,000 to $39,999 | 6 (1.6%) | 9 (2.2%) |
| $40,000 to $44,999 | 9 (2.4%) | 17 (4.2%) |
| $45,000 to $49,999 | 33 (8.8%) | 29 (7.1%) |
| $50,000 to $54,999 | 12 (3.2%) | 20 (4.9%) |
| $55,000 to $64,999 | 27 (7.2%) | 18 (4.4%) |
| $65,000 to $74,999 | 33 (8.8%) | 9 (2.2%) |
| $75,000 to $99,999 | 37 (9.8%) | 16 (3.9%) |
| $100,000+ | 41 (10.9%) | 7 (1.7%) |
| Total | 376 (100.0%) | 408 (100.0%) |
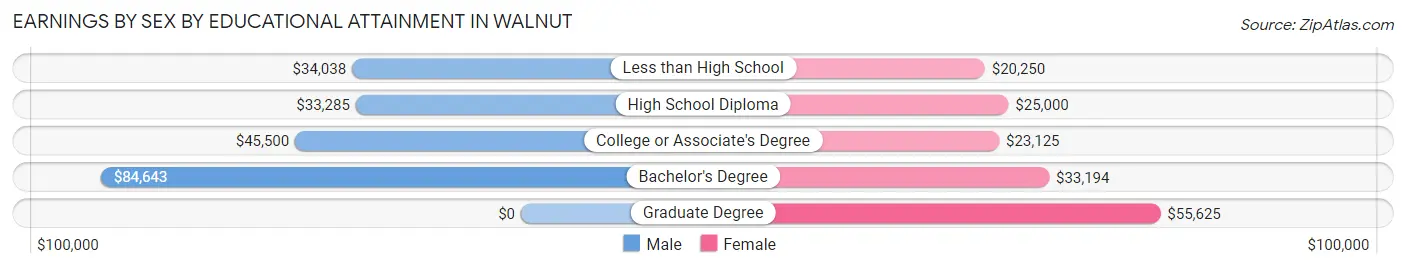
Earnings by Sex by Educational Attainment in Walnut
Average earnings in Walnut are $45,400 for men and $26,964 for women, a difference of 40.6%. Men with an educational attainment of bachelor's degree enjoy the highest average annual earnings of $84,643, while those with high school diploma education earn the least with $33,285. Women with an educational attainment of graduate degree earn the most with the average annual earnings of $55,625, while those with less than high school education have the smallest earnings of $20,250.
| Educational Attainment | Male Income | Female Income |
| Less than High School | $34,038 | $20,250 |
| High School Diploma | $33,285 | $25,000 |
| College or Associate's Degree | $45,500 | $23,125 |
| Bachelor's Degree | $84,643 | $33,194 |
| Graduate Degree | - | - |
| Total | $45,400 | $26,964 |
Family Income in Walnut
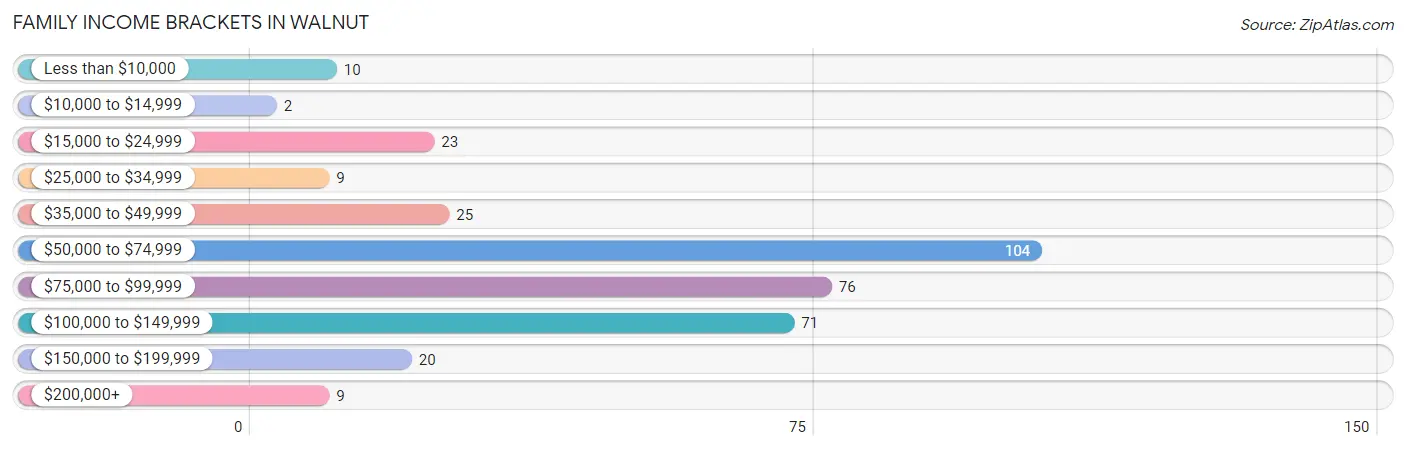
Family Income Brackets in Walnut
According to the Walnut family income data, there are 104 families falling into the $50,000 to $74,999 income range, which is the most common income bracket and makes up 29.8% of all families. Conversely, the $10,000 to $14,999 income bracket is the least frequent group with only 2 families (0.6%) belonging to this category.
| Income Bracket | # Families | % Families |
| Less than $10,000 | 10 | 2.9% |
| $10,000 to $14,999 | 2 | 0.6% |
| $15,000 to $24,999 | 23 | 6.6% |
| $25,000 to $34,999 | 9 | 2.6% |
| $35,000 to $49,999 | 25 | 7.2% |
| $50,000 to $74,999 | 104 | 29.8% |
| $75,000 to $99,999 | 76 | 21.8% |
| $100,000 to $149,999 | 71 | 20.3% |
| $150,000 to $199,999 | 20 | 5.7% |
| $200,000+ | 9 | 2.6% |
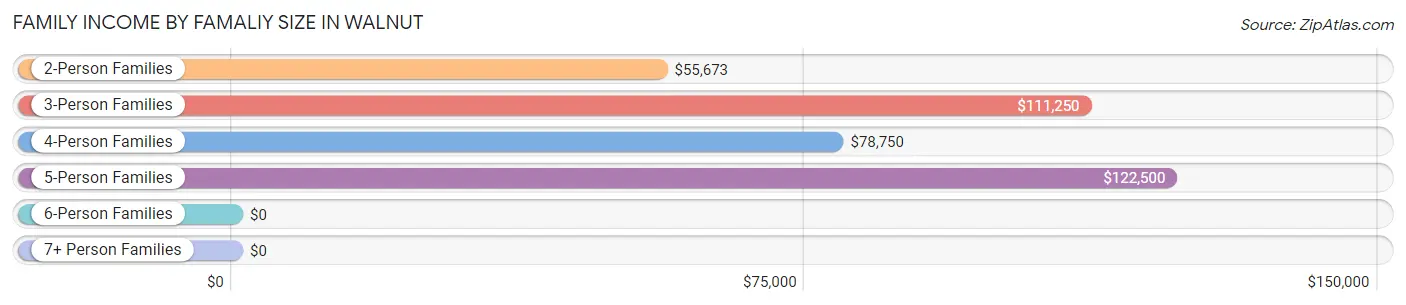
Family Income by Famaliy Size in Walnut
5-person families (34 | 9.7%) account for the highest median family income in Walnut with $122,500 per family, while 3-person families (66 | 18.9%) have the highest median income of $37,083 per family member.
| Income Bracket | # Families | Median Income |
| 2-Person Families | 207 (59.3%) | $55,673 |
| 3-Person Families | 66 (18.9%) | $111,250 |
| 4-Person Families | 39 (11.2%) | $78,750 |
| 5-Person Families | 34 (9.7%) | $122,500 |
| 6-Person Families | 3 (0.9%) | $0 |
| 7+ Person Families | 0 (0.0%) | $0 |
| Total | 349 (100.0%) | $75,750 |
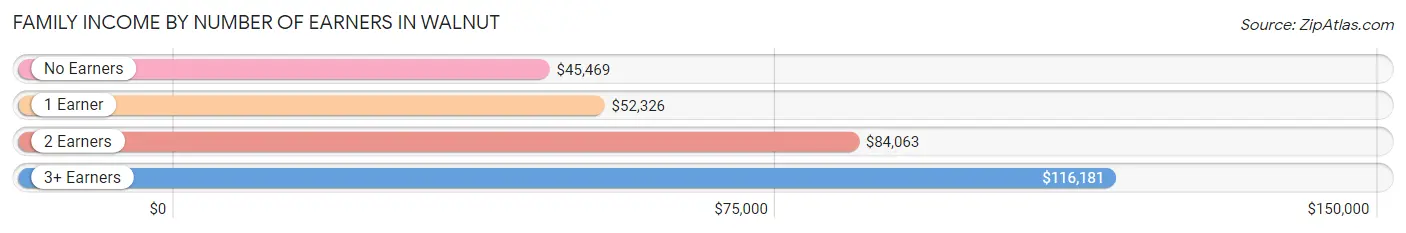
Family Income by Number of Earners in Walnut
The median family income in Walnut is $75,750, with families comprising 3+ earners (35) having the highest median family income of $116,181, while families with no earners (33) have the lowest median family income of $45,469, accounting for 10.0% and 9.5% of families, respectively.
| Number of Earners | # Families | Median Income |
| No Earners | 33 (9.5%) | $45,469 |
| 1 Earner | 105 (30.1%) | $52,326 |
| 2 Earners | 176 (50.4%) | $84,063 |
| 3+ Earners | 35 (10.0%) | $116,181 |
| Total | 349 (100.0%) | $75,750 |
Household Income in Walnut
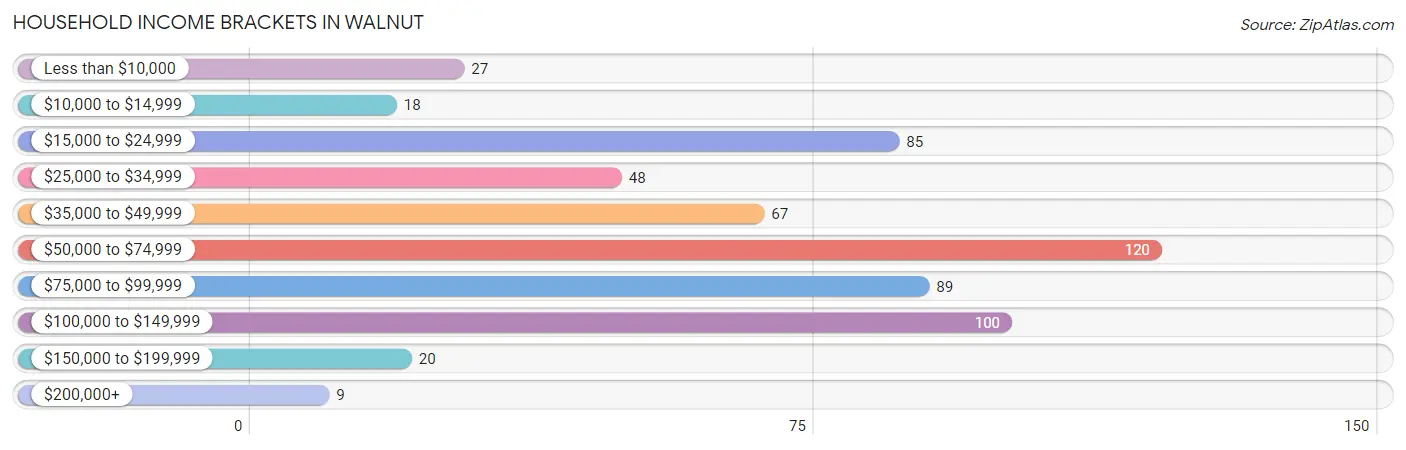
Household Income Brackets in Walnut
With 120 households falling in the category, the $50,000 to $74,999 income range is the most frequent in Walnut, accounting for 20.6% of all households. In contrast, only 9 households (1.5%) fall into the $200,000+ income bracket, making it the least populous group.
| Income Bracket | # Households | % Households |
| Less than $10,000 | 27 | 4.6% |
| $10,000 to $14,999 | 18 | 3.1% |
| $15,000 to $24,999 | 85 | 14.6% |
| $25,000 to $34,999 | 48 | 8.2% |
| $35,000 to $49,999 | 67 | 11.5% |
| $50,000 to $74,999 | 120 | 20.6% |
| $75,000 to $99,999 | 89 | 15.3% |
| $100,000 to $149,999 | 100 | 17.2% |
| $150,000 to $199,999 | 20 | 3.4% |
| $200,000+ | 9 | 1.5% |
Household Income by Householder Age in Walnut
The median household income in Walnut is $55,515, with the highest median household income of $80,833 found in the 25 to 44 years age bracket for the primary householder. A total of 206 households (35.3%) fall into this category. Meanwhile, the 15 to 24 years age bracket for the primary householder has the lowest median household income of $32,917, with 21 households (3.6%) in this group.
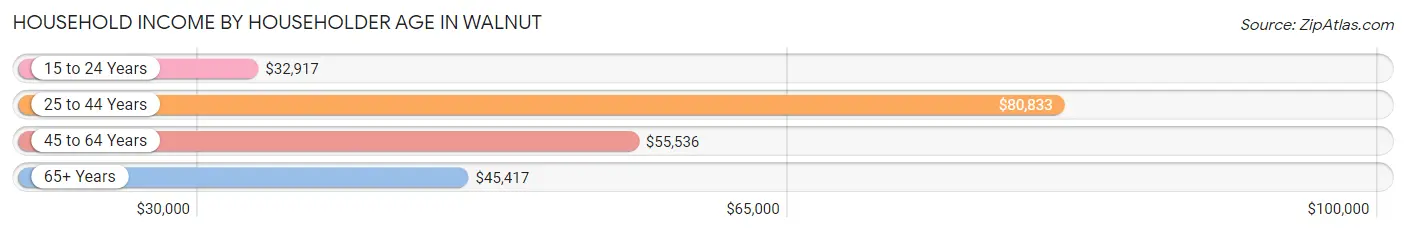
| Income Bracket | # Households | Median Income |
| 15 to 24 Years | 21 (3.6%) | $32,917 |
| 25 to 44 Years | 206 (35.3%) | $80,833 |
| 45 to 64 Years | 208 (35.7%) | $55,536 |
| 65+ Years | 148 (25.4%) | $45,417 |
| Total | 583 (100.0%) | $55,515 |
Poverty in Walnut
Income Below Poverty by Sex and Age in Walnut
With 7.9% poverty level for males and 12.0% for females among the residents of Walnut, 16 and 17 year old males and 12 to 14 year old females are the most vulnerable to poverty, with 8 males (50.0%) and 12 females (34.3%) in their respective age groups living below the poverty level.
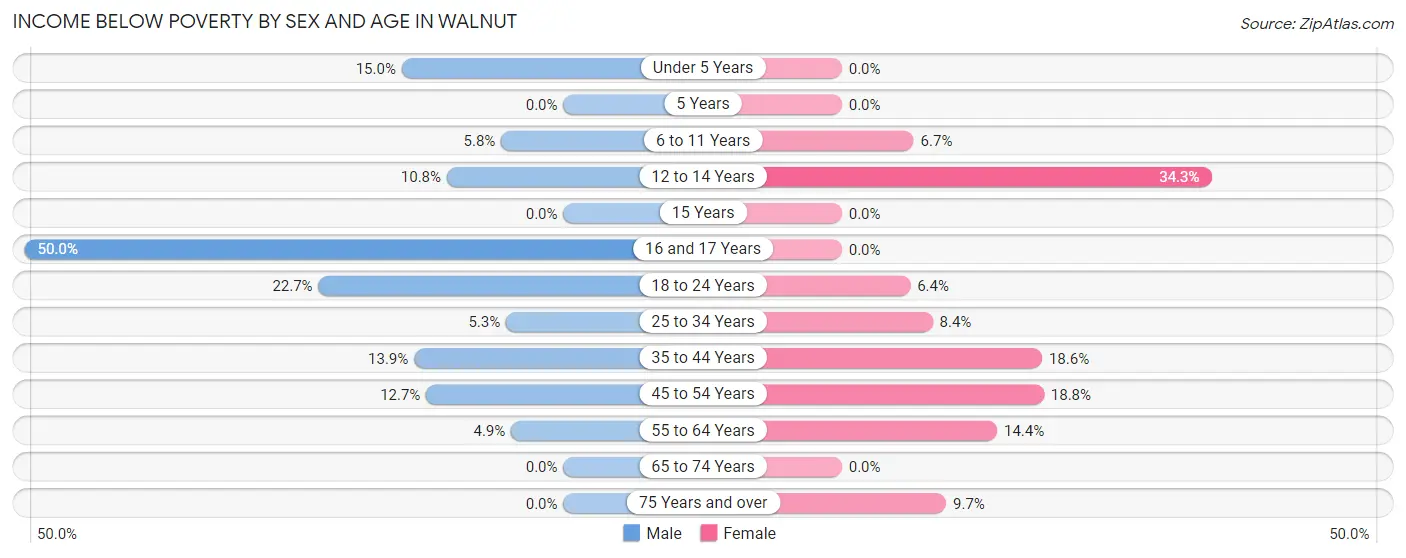
| Age Bracket | Male | Female |
| Under 5 Years | 3 (15.0%) | 0 (0.0%) |
| 5 Years | 0 (0.0%) | 0 (0.0%) |
| 6 to 11 Years | 3 (5.8%) | 4 (6.7%) |
| 12 to 14 Years | 4 (10.8%) | 12 (34.3%) |
| 15 Years | 0 (0.0%) | 0 (0.0%) |
| 16 and 17 Years | 8 (50.0%) | 0 (0.0%) |
| 18 to 24 Years | 5 (22.7%) | 4 (6.4%) |
| 25 to 34 Years | 5 (5.3%) | 7 (8.4%) |
| 35 to 44 Years | 9 (13.9%) | 21 (18.6%) |
| 45 to 54 Years | 7 (12.7%) | 9 (18.8%) |
| 55 to 64 Years | 5 (4.9%) | 17 (14.4%) |
| 65 to 74 Years | 0 (0.0%) | 0 (0.0%) |
| 75 Years and over | 0 (0.0%) | 6 (9.7%) |
| Total | 49 (7.9%) | 80 (12.0%) |
Income Above Poverty by Sex and Age in Walnut
According to the poverty statistics in Walnut, males aged 15 years and females aged under 5 years are the age groups that are most secure financially, with 100.0% of males and 100.0% of females in these age groups living above the poverty line.
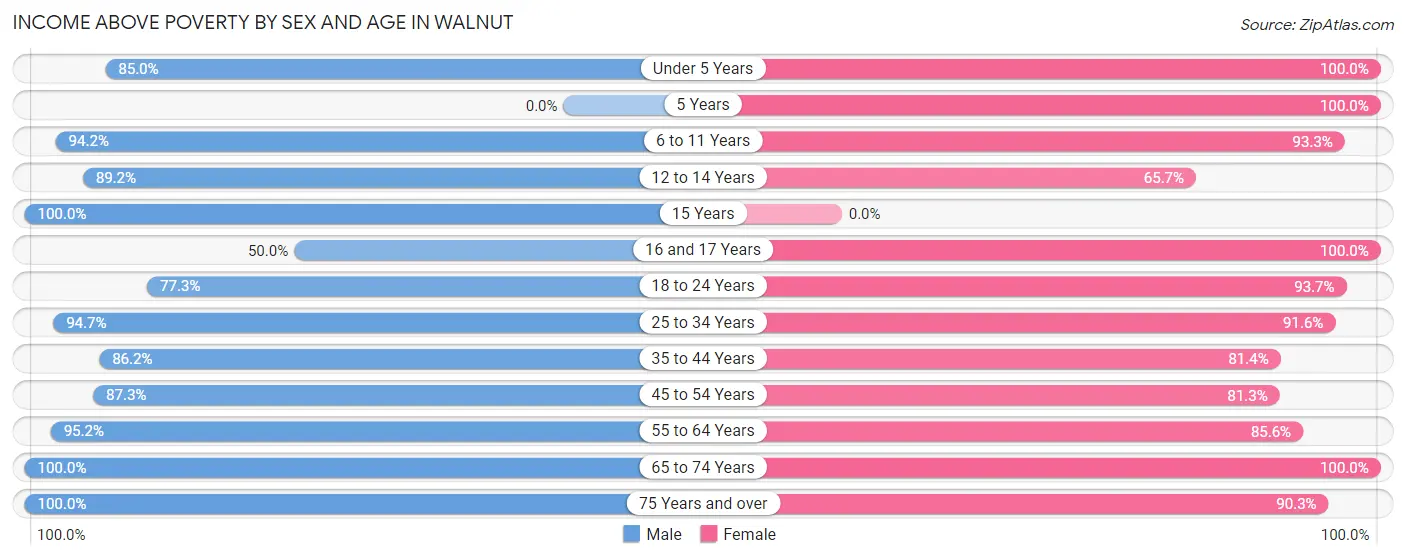
| Age Bracket | Male | Female |
| Under 5 Years | 17 (85.0%) | 29 (100.0%) |
| 5 Years | 0 (0.0%) | 4 (100.0%) |
| 6 to 11 Years | 49 (94.2%) | 56 (93.3%) |
| 12 to 14 Years | 33 (89.2%) | 23 (65.7%) |
| 15 Years | 11 (100.0%) | 0 (0.0%) |
| 16 and 17 Years | 8 (50.0%) | 12 (100.0%) |
| 18 to 24 Years | 17 (77.3%) | 59 (93.6%) |
| 25 to 34 Years | 89 (94.7%) | 76 (91.6%) |
| 35 to 44 Years | 56 (86.2%) | 92 (81.4%) |
| 45 to 54 Years | 48 (87.3%) | 39 (81.2%) |
| 55 to 64 Years | 98 (95.2%) | 101 (85.6%) |
| 65 to 74 Years | 79 (100.0%) | 37 (100.0%) |
| 75 Years and over | 64 (100.0%) | 56 (90.3%) |
| Total | 569 (92.1%) | 584 (87.9%) |
Income Below Poverty Among Married-Couple Families in Walnut
The poverty statistics for married-couple families in Walnut show that 3.0% or 7 of the total 232 families live below the poverty line. Families with no children have the highest poverty rate of 4.9%, comprising of 7 families. On the other hand, families with 1 or 2 children have the lowest poverty rate of 0.0%, which includes 0 families.
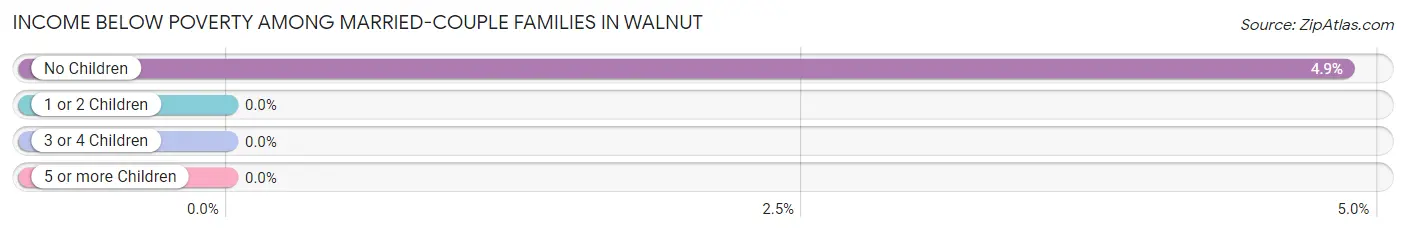
| Children | Above Poverty | Below Poverty |
| No Children | 137 (95.1%) | 7 (4.9%) |
| 1 or 2 Children | 62 (100.0%) | 0 (0.0%) |
| 3 or 4 Children | 26 (100.0%) | 0 (0.0%) |
| 5 or more Children | 0 (0.0%) | 0 (0.0%) |
| Total | 225 (97.0%) | 7 (3.0%) |
Income Below Poverty Among Single-Parent Households in Walnut
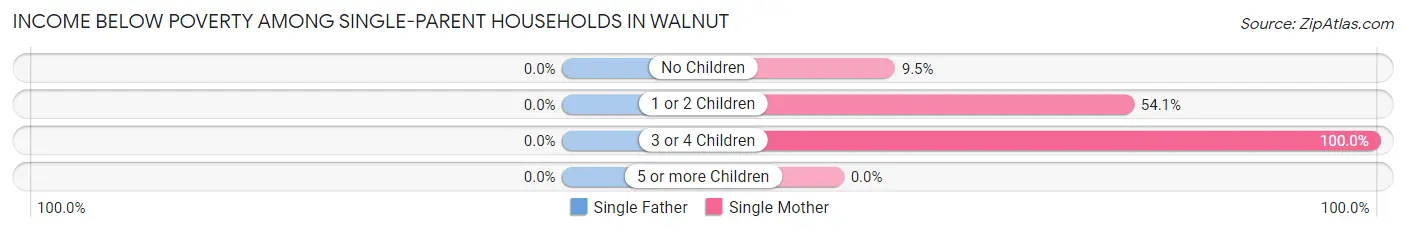
| Children | Single Father | Single Mother |
| No Children | 0 (0.0%) | 2 (9.5%) |
| 1 or 2 Children | 0 (0.0%) | 20 (54.0%) |
| 3 or 4 Children | 0 (0.0%) | 4 (100.0%) |
| 5 or more Children | 0 (0.0%) | 0 (0.0%) |
| Total | 0 (0.0%) | 26 (41.9%) |
Income Below Poverty Among Married-Couple vs Single-Parent Households in Walnut
The poverty data for Walnut shows that 7 of the married-couple family households (3.0%) and 26 of the single-parent households (22.2%) are living below the poverty level. Within the married-couple family households, those with no children have the highest poverty rate, with 7 households (4.9%) falling below the poverty line. Among the single-parent households, those with 3 or 4 children have the highest poverty rate, with 4 household (100.0%) living below poverty.
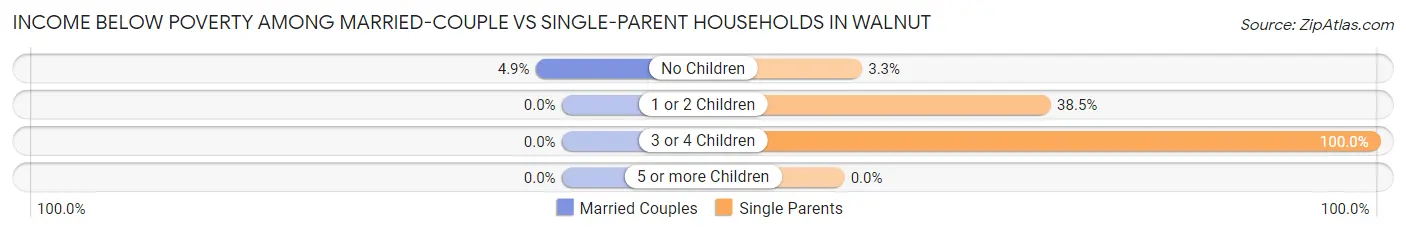
| Children | Married-Couple Families | Single-Parent Households |
| No Children | 7 (4.9%) | 2 (3.3%) |
| 1 or 2 Children | 0 (0.0%) | 20 (38.5%) |
| 3 or 4 Children | 0 (0.0%) | 4 (100.0%) |
| 5 or more Children | 0 (0.0%) | 0 (0.0%) |
| Total | 7 (3.0%) | 26 (22.2%) |
Race in Walnut
The most populous races in Walnut are White / Caucasian (1,321 | 98.0%), Hispanic or Latino (26 | 1.9%), and Two or more Races (15 | 1.1%).
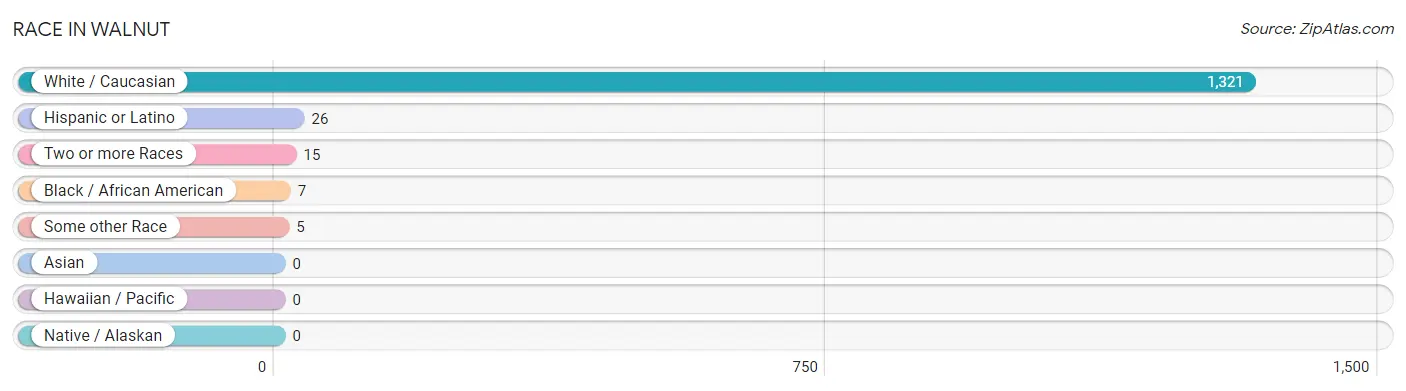
| Race | # Population | % Population |
| Asian | 0 | 0.0% |
| Black / African American | 7 | 0.5% |
| Hawaiian / Pacific | 0 | 0.0% |
| Hispanic or Latino | 26 | 1.9% |
| Native / Alaskan | 0 | 0.0% |
| White / Caucasian | 1,321 | 98.0% |
| Two or more Races | 15 | 1.1% |
| Some other Race | 5 | 0.4% |
| Total | 1,348 | 100.0% |
Ancestry in Walnut
The most populous ancestries reported in Walnut are German (399 | 29.6%), Irish (251 | 18.6%), Swedish (187 | 13.9%), English (132 | 9.8%), and American (58 | 4.3%), together accounting for 76.2% of all Walnut residents.
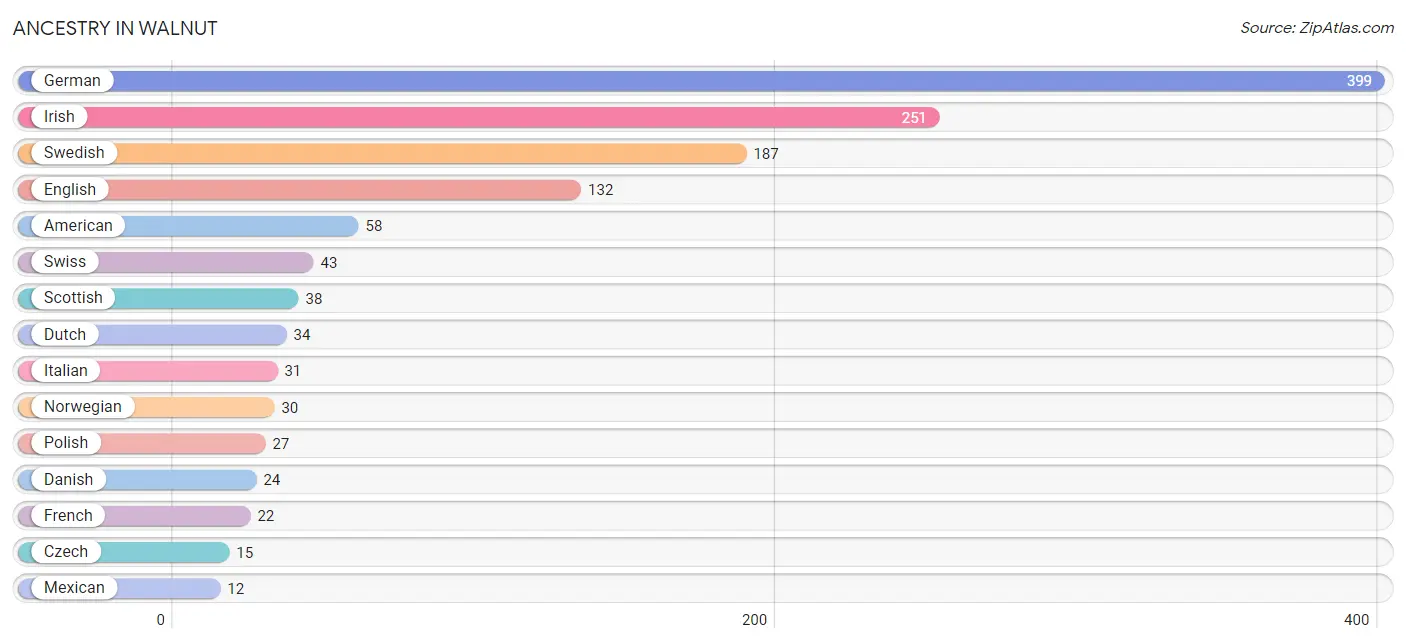
| Ancestry | # Population | % Population |
| American | 58 | 4.3% |
| Belgian | 9 | 0.7% |
| Czech | 15 | 1.1% |
| Danish | 24 | 1.8% |
| Dutch | 34 | 2.5% |
| English | 132 | 9.8% |
| European | 9 | 0.7% |
| French | 22 | 1.6% |
| German | 399 | 29.6% |
| Greek | 3 | 0.2% |
| Irish | 251 | 18.6% |
| Italian | 31 | 2.3% |
| Lithuanian | 7 | 0.5% |
| Mexican | 12 | 0.9% |
| Norwegian | 30 | 2.2% |
| Polish | 27 | 2.0% |
| Puerto Rican | 3 | 0.2% |
| Scandinavian | 12 | 0.9% |
| Scottish | 38 | 2.8% |
| Swedish | 187 | 13.9% |
| Swiss | 43 | 3.2% |
| Welsh | 6 | 0.4% | View All 22 Rows |
Immigrants in Walnut
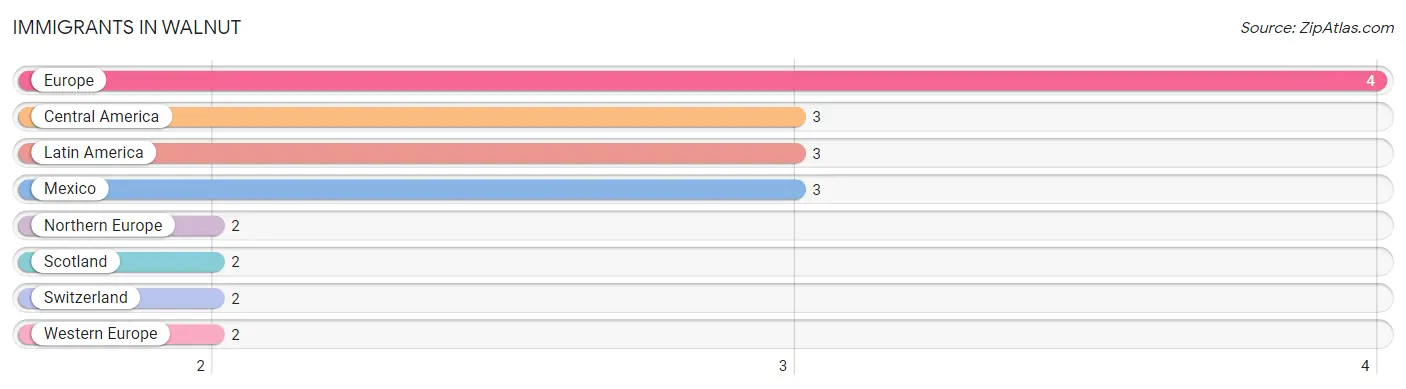
The most numerous immigrant groups reported in Walnut came from Europe (4 | 0.3%), Central America (3 | 0.2%), Latin America (3 | 0.2%), Mexico (3 | 0.2%), and Northern Europe (2 | 0.2%), together accounting for 1.1% of all Walnut residents.
| Immigration Origin | # Population | % Population |
| Central America | 3 | 0.2% |
| Europe | 4 | 0.3% |
| Latin America | 3 | 0.2% |
| Mexico | 3 | 0.2% |
| Northern Europe | 2 | 0.2% |
| Scotland | 2 | 0.2% |
| Switzerland | 2 | 0.2% |
| Western Europe | 2 | 0.2% | View All 8 Rows |
Sex and Age in Walnut
Sex and Age in Walnut
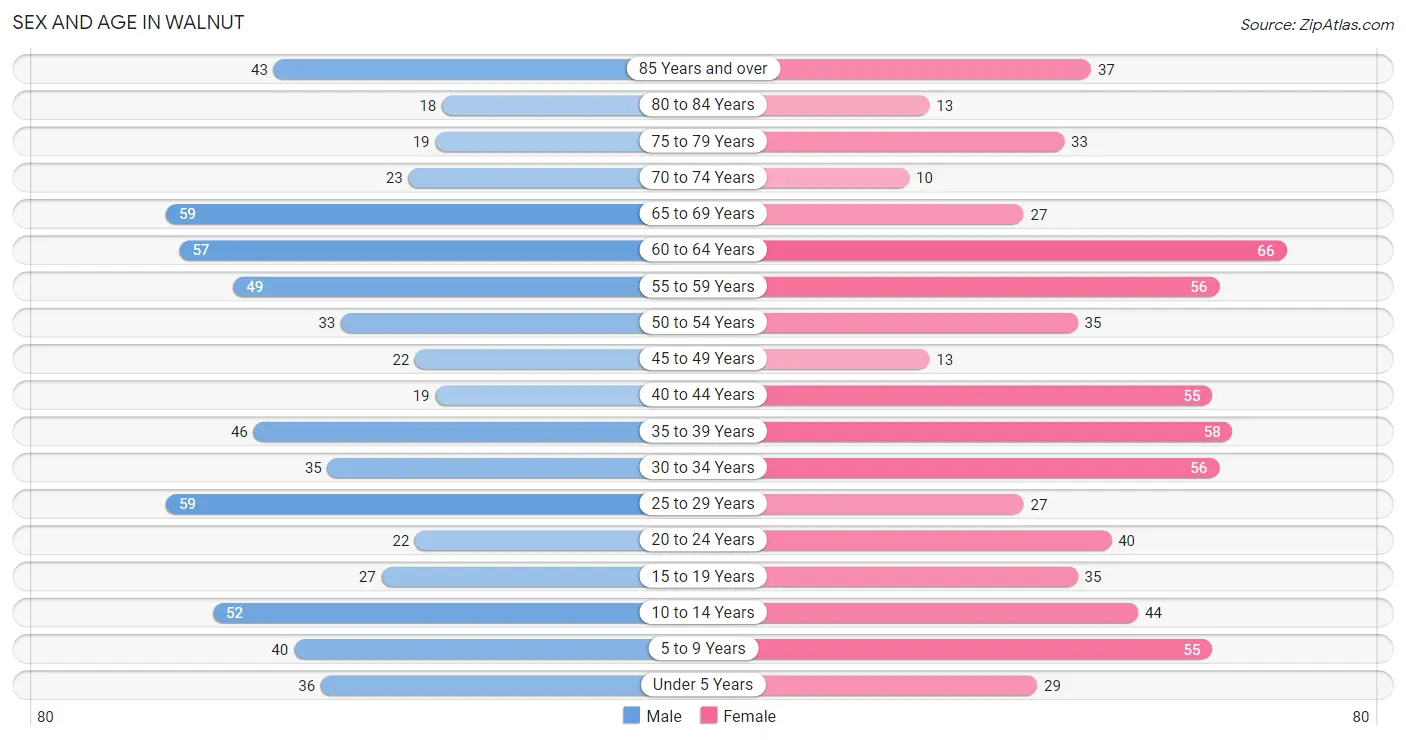
The most populous age groups in Walnut are 25 to 29 Years (59 | 8.9%) for men and 60 to 64 Years (66 | 9.6%) for women.
| Age Bracket | Male | Female |
| Under 5 Years | 36 (5.5%) | 29 (4.2%) |
| 5 to 9 Years | 40 (6.1%) | 55 (8.0%) |
| 10 to 14 Years | 52 (7.9%) | 44 (6.4%) |
| 15 to 19 Years | 27 (4.1%) | 35 (5.1%) |
| 20 to 24 Years | 22 (3.3%) | 40 (5.8%) |
| 25 to 29 Years | 59 (8.9%) | 27 (3.9%) |
| 30 to 34 Years | 35 (5.3%) | 56 (8.1%) |
| 35 to 39 Years | 46 (7.0%) | 58 (8.4%) |
| 40 to 44 Years | 19 (2.9%) | 55 (8.0%) |
| 45 to 49 Years | 22 (3.3%) | 13 (1.9%) |
| 50 to 54 Years | 33 (5.0%) | 35 (5.1%) |
| 55 to 59 Years | 49 (7.4%) | 56 (8.1%) |
| 60 to 64 Years | 57 (8.6%) | 66 (9.6%) |
| 65 to 69 Years | 59 (8.9%) | 27 (3.9%) |
| 70 to 74 Years | 23 (3.5%) | 10 (1.5%) |
| 75 to 79 Years | 19 (2.9%) | 33 (4.8%) |
| 80 to 84 Years | 18 (2.7%) | 13 (1.9%) |
| 85 Years and over | 43 (6.5%) | 37 (5.4%) |
| Total | 659 (100.0%) | 689 (100.0%) |
Families and Households in Walnut
Median Family Size in Walnut
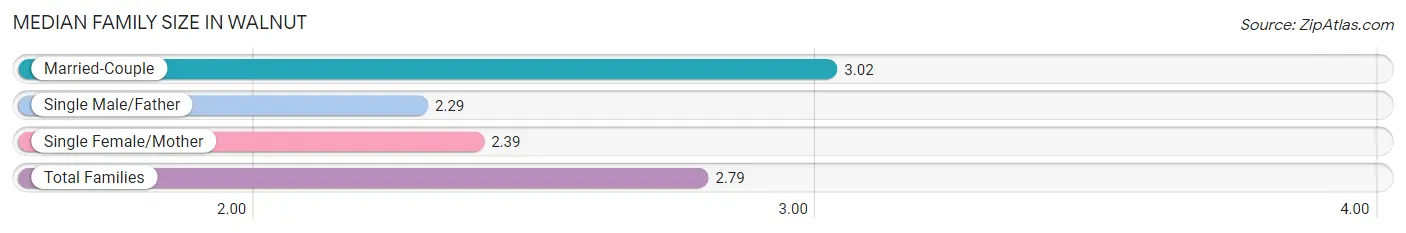
The median family size in Walnut is 2.79 persons per family, with married-couple families (232 | 66.5%) accounting for the largest median family size of 3.02 persons per family. On the other hand, single male/father families (55 | 15.8%) represent the smallest median family size with 2.29 persons per family.
| Family Type | # Families | Family Size |
| Married-Couple | 232 (66.5%) | 3.02 |
| Single Male/Father | 55 (15.8%) | 2.29 |
| Single Female/Mother | 62 (17.8%) | 2.39 |
| Total Families | 349 (100.0%) | 2.79 |
Median Household Size in Walnut
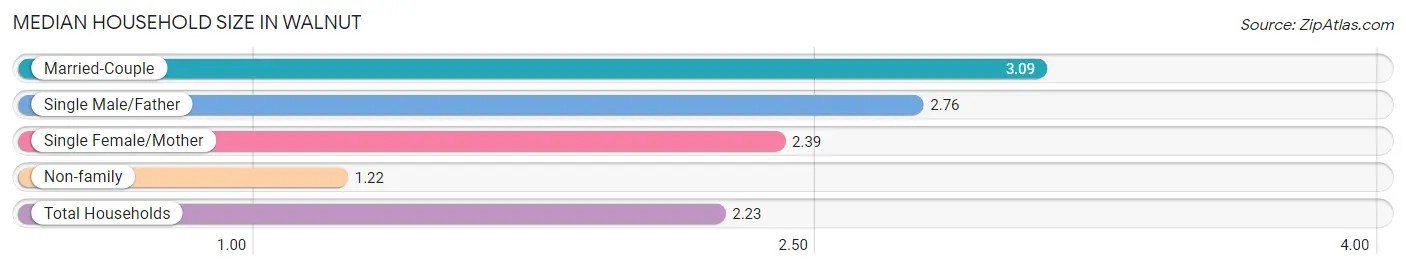
The median household size in Walnut is 2.23 persons per household, with married-couple households (232 | 39.8%) accounting for the largest median household size of 3.09 persons per household. non-family households (234 | 40.1%) represent the smallest median household size with 1.22 persons per household.
| Household Type | # Households | Household Size |
| Married-Couple | 232 (39.8%) | 3.09 |
| Single Male/Father | 55 (9.4%) | 2.76 |
| Single Female/Mother | 62 (10.6%) | 2.39 |
| Non-family | 234 (40.1%) | 1.22 |
| Total Households | 583 (100.0%) | 2.23 |
Household Size by Marriage Status in Walnut
Out of a total of 583 households in Walnut, 349 (59.9%) are family households, while 234 (40.1%) are nonfamily households. The most numerous type of family households are 2-person households, comprising 195, and the most common type of nonfamily households are 1-person households, comprising 191.
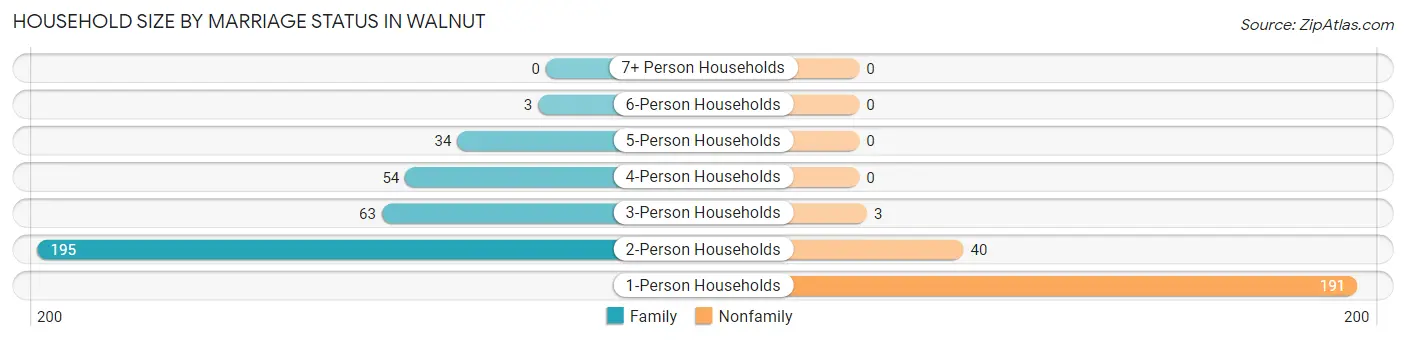
| Household Size | Family Households | Nonfamily Households |
| 1-Person Households | - | 191 (32.8%) |
| 2-Person Households | 195 (33.5%) | 40 (6.9%) |
| 3-Person Households | 63 (10.8%) | 3 (0.5%) |
| 4-Person Households | 54 (9.3%) | 0 (0.0%) |
| 5-Person Households | 34 (5.8%) | 0 (0.0%) |
| 6-Person Households | 3 (0.5%) | 0 (0.0%) |
| 7+ Person Households | 0 (0.0%) | 0 (0.0%) |
| Total | 349 (59.9%) | 234 (40.1%) |
Female Fertility in Walnut
Fertility by Age in Walnut
Average fertility rate in Walnut is 20.0 births per 1,000 women. Women in the age bracket of 35 to 50 years have the highest fertility rate with 29.0 births per 1,000 women. Women in the age bracket of 35 to 50 years acount for 66.7% of all women with births.
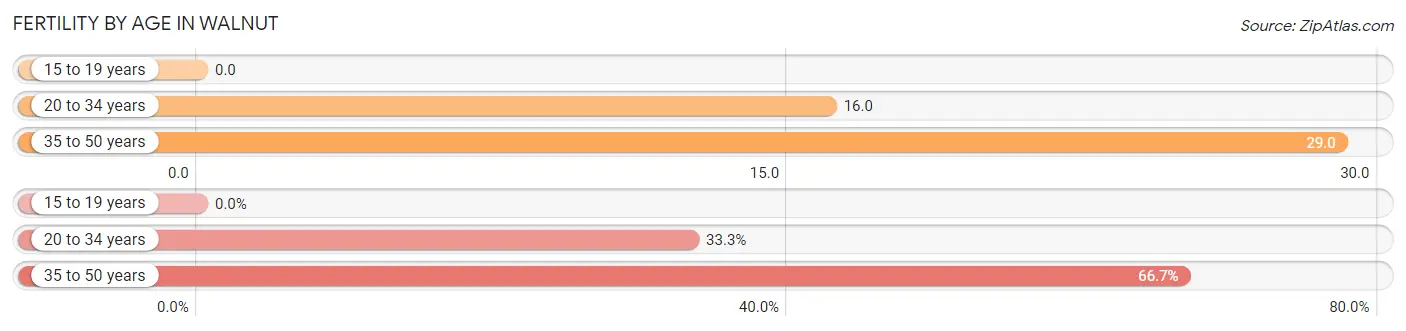
| Age Bracket | Women with Births | Births / 1,000 Women |
| 15 to 19 years | 0 (0.0%) | 0.0 |
| 20 to 34 years | 2 (33.3%) | 16.0 |
| 35 to 50 years | 4 (66.7%) | 29.0 |
| Total | 6 (100.0%) | 20.0 |
Fertility by Age by Marriage Status in Walnut
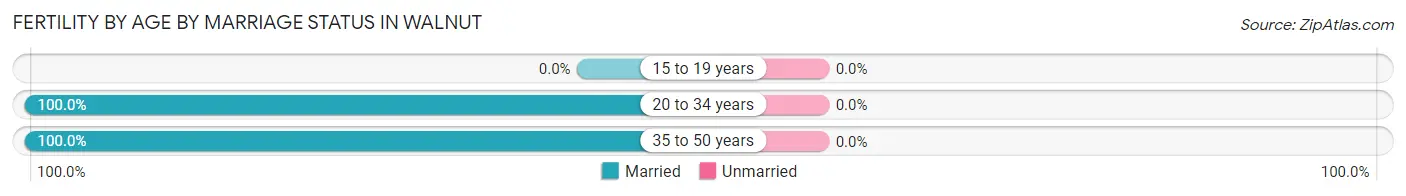
| Age Bracket | Married | Unmarried |
| 15 to 19 years | 0 (0.0%) | 0 (0.0%) |
| 20 to 34 years | 2 (100.0%) | 0 (0.0%) |
| 35 to 50 years | 4 (100.0%) | 0 (0.0%) |
| Total | 6 (100.0%) | 0 (0.0%) |
Fertility by Education in Walnut
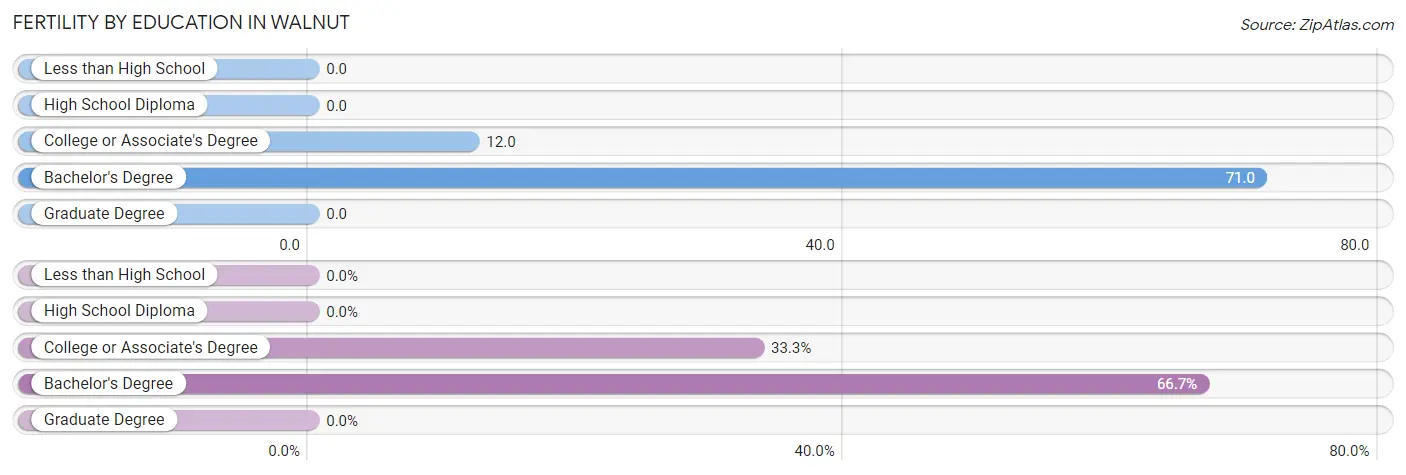
| Educational Attainment | Women with Births | Births / 1,000 Women |
| Less than High School | 0 (0.0%) | 0.0 |
| High School Diploma | 0 (0.0%) | 0.0 |
| College or Associate's Degree | 2 (33.3%) | 12.0 |
| Bachelor's Degree | 4 (66.7%) | 71.0 |
| Graduate Degree | 0 (0.0%) | 0.0 |
| Total | 6 (100.0%) | 20.0 |
Fertility by Education by Marriage Status in Walnut
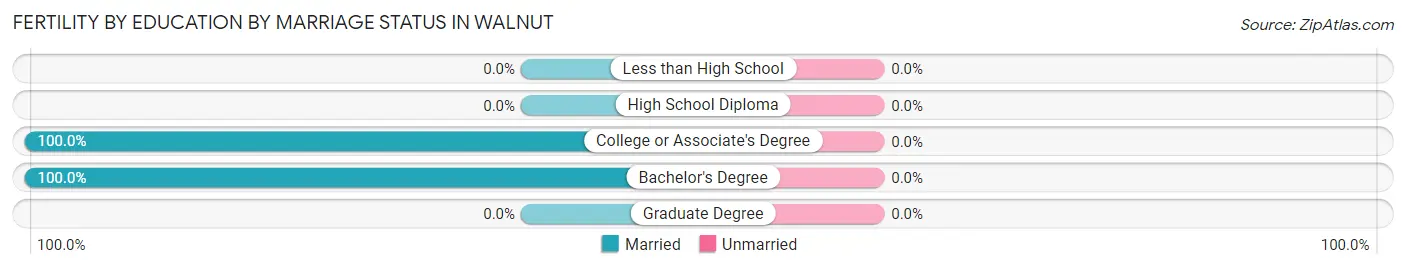
| Educational Attainment | Married | Unmarried |
| Less than High School | 0 (0.0%) | 0 (0.0%) |
| High School Diploma | 0 (0.0%) | 0 (0.0%) |
| College or Associate's Degree | 2 (100.0%) | 0 (0.0%) |
| Bachelor's Degree | 4 (100.0%) | 0 (0.0%) |
| Graduate Degree | 0 (0.0%) | 0 (0.0%) |
| Total | 6 (100.0%) | 0 (0.0%) |
Employment Characteristics in Walnut
Employment by Class of Employer in Walnut
Among the 676 employed individuals in Walnut, private company employees (484 | 71.6%), local government employees (65 | 9.6%), and not-for-profit organizations (51 | 7.5%) make up the most common classes of employment.
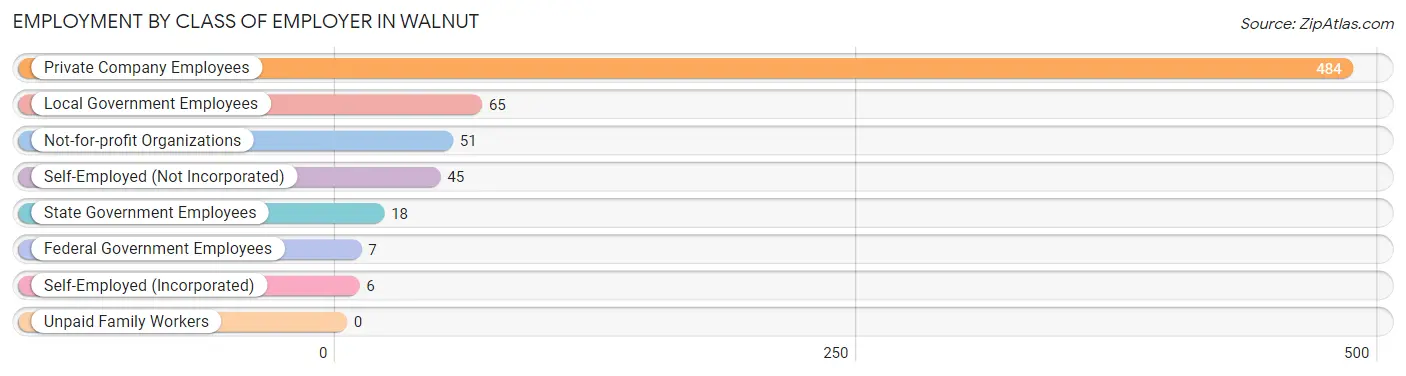
| Employer Class | # Employees | % Employees |
| Private Company Employees | 484 | 71.6% |
| Self-Employed (Incorporated) | 6 | 0.9% |
| Self-Employed (Not Incorporated) | 45 | 6.7% |
| Not-for-profit Organizations | 51 | 7.5% |
| Local Government Employees | 65 | 9.6% |
| State Government Employees | 18 | 2.7% |
| Federal Government Employees | 7 | 1.0% |
| Unpaid Family Workers | 0 | 0.0% |
| Total | 676 | 100.0% |
Employment Status by Age in Walnut
According to the labor force statistics for Walnut, out of the total population over 16 years of age (1,081), 70.8% or 765 individuals are in the labor force, with 6.0% or 46 of them unemployed. The age group with the highest labor force participation rate is 20 to 24 years, with 100.0% or 62 individuals in the labor force. Within the labor force, the 45 to 54 years age range has the highest percentage of unemployed individuals, with 23.4% or 18 of them being unemployed.
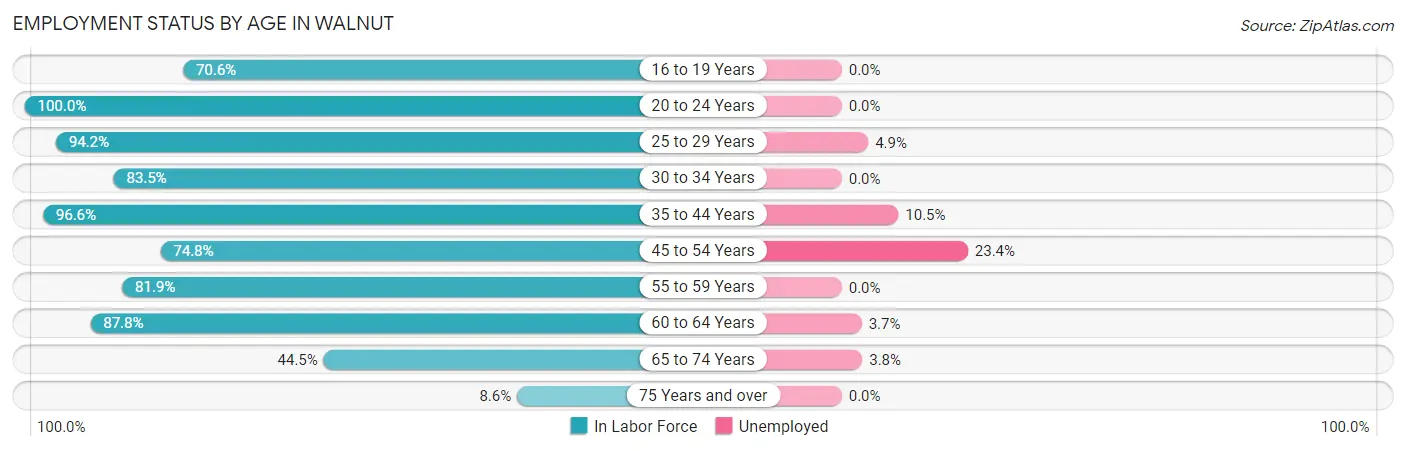
| Age Bracket | In Labor Force | Unemployed |
| 16 to 19 Years | 36 (70.6%) | 0 (0.0%) |
| 20 to 24 Years | 62 (100.0%) | 0 (0.0%) |
| 25 to 29 Years | 81 (94.2%) | 4 (4.9%) |
| 30 to 34 Years | 76 (83.5%) | 0 (0.0%) |
| 35 to 44 Years | 172 (96.6%) | 18 (10.5%) |
| 45 to 54 Years | 77 (74.8%) | 18 (23.4%) |
| 55 to 59 Years | 86 (81.9%) | 0 (0.0%) |
| 60 to 64 Years | 108 (87.8%) | 4 (3.7%) |
| 65 to 74 Years | 53 (44.5%) | 2 (3.8%) |
| 75 Years and over | 14 (8.6%) | 0 (0.0%) |
| Total | 765 (70.8%) | 46 (6.0%) |
Employment Status by Educational Attainment in Walnut
According to labor force statistics for Walnut, 87.5% of individuals (600) out of the total population between 25 and 64 years of age (686) are in the labor force, with 7.3% or 44 of them being unemployed. The group with the highest labor force participation rate are those with the educational attainment of bachelor's degree or higher, with 100.0% or 196 individuals in the labor force. Within the labor force, individuals with high school diploma education have the highest percentage of unemployment, with 10.6% or 18 of them being unemployed.
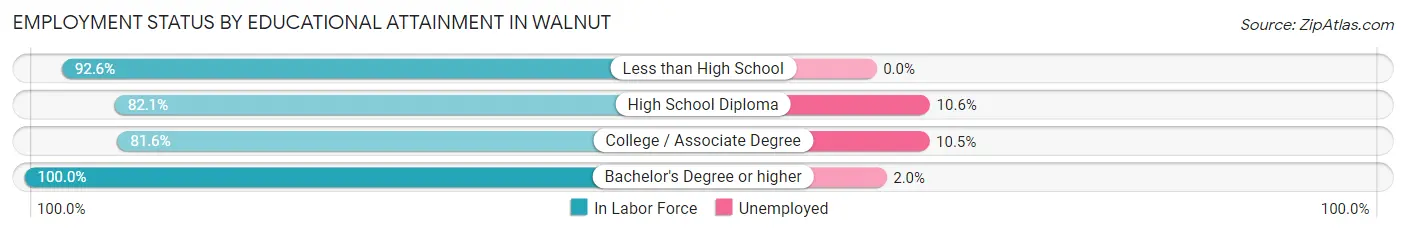
| Educational Attainment | In Labor Force | Unemployed |
| Less than High School | 25 (92.6%) | 0 (0.0%) |
| High School Diploma | 170 (82.1%) | 22 (10.6%) |
| College / Associate Degree | 209 (81.6%) | 27 (10.5%) |
| Bachelor's Degree or higher | 196 (100.0%) | 4 (2.0%) |
| Total | 600 (87.5%) | 50 (7.3%) |
Employment Occupations by Sex in Walnut
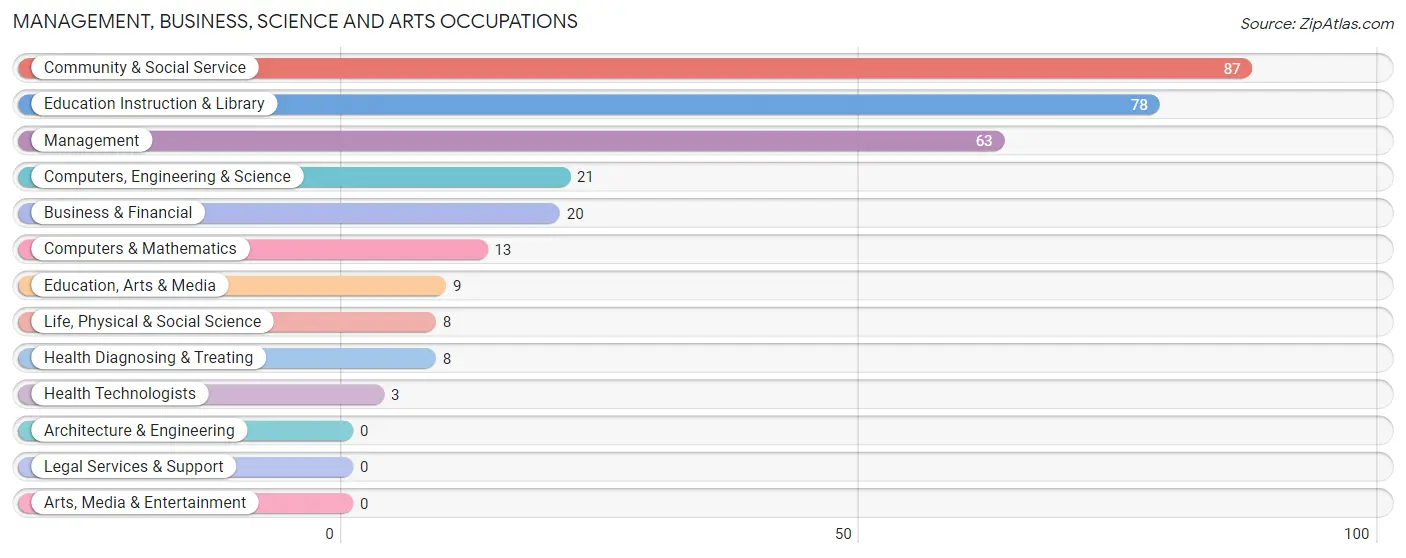
Management, Business, Science and Arts Occupations
The most common Management, Business, Science and Arts occupations in Walnut are Community & Social Service (87 | 12.1%), Education Instruction & Library (78 | 10.8%), Management (63 | 8.8%), Computers, Engineering & Science (21 | 2.9%), and Business & Financial (20 | 2.8%).
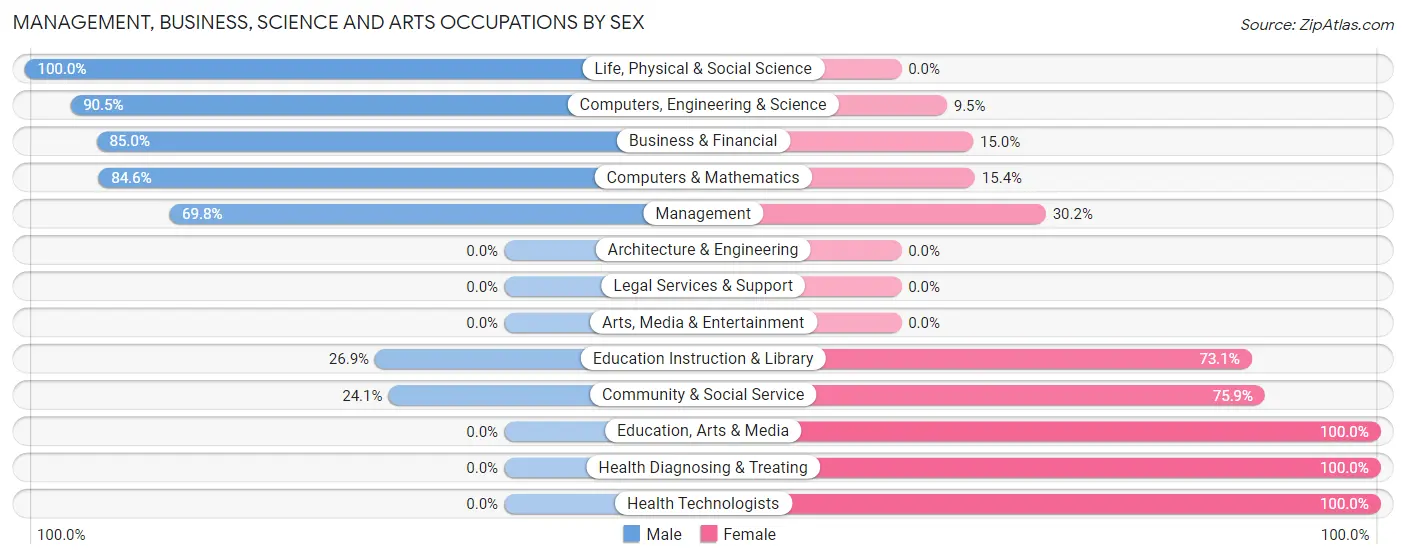
Management, Business, Science and Arts Occupations by Sex
Within the Management, Business, Science and Arts occupations in Walnut, the most male-oriented occupations are Life, Physical & Social Science (100.0%), Computers, Engineering & Science (90.5%), and Business & Financial (85.0%), while the most female-oriented occupations are Education, Arts & Media (100.0%), Health Diagnosing & Treating (100.0%), and Health Technologists (100.0%).
| Occupation | Male | Female |
| Management | 44 (69.8%) | 19 (30.2%) |
| Business & Financial | 17 (85.0%) | 3 (15.0%) |
| Computers, Engineering & Science | 19 (90.5%) | 2 (9.5%) |
| Computers & Mathematics | 11 (84.6%) | 2 (15.4%) |
| Architecture & Engineering | 0 (0.0%) | 0 (0.0%) |
| Life, Physical & Social Science | 8 (100.0%) | 0 (0.0%) |
| Community & Social Service | 21 (24.1%) | 66 (75.9%) |
| Education, Arts & Media | 0 (0.0%) | 9 (100.0%) |
| Legal Services & Support | 0 (0.0%) | 0 (0.0%) |
| Education Instruction & Library | 21 (26.9%) | 57 (73.1%) |
| Arts, Media & Entertainment | 0 (0.0%) | 0 (0.0%) |
| Health Diagnosing & Treating | 0 (0.0%) | 8 (100.0%) |
| Health Technologists | 0 (0.0%) | 3 (100.0%) |
| Total (Category) | 101 (50.7%) | 98 (49.2%) |
| Total (Overall) | 335 (46.6%) | 384 (53.4%) |
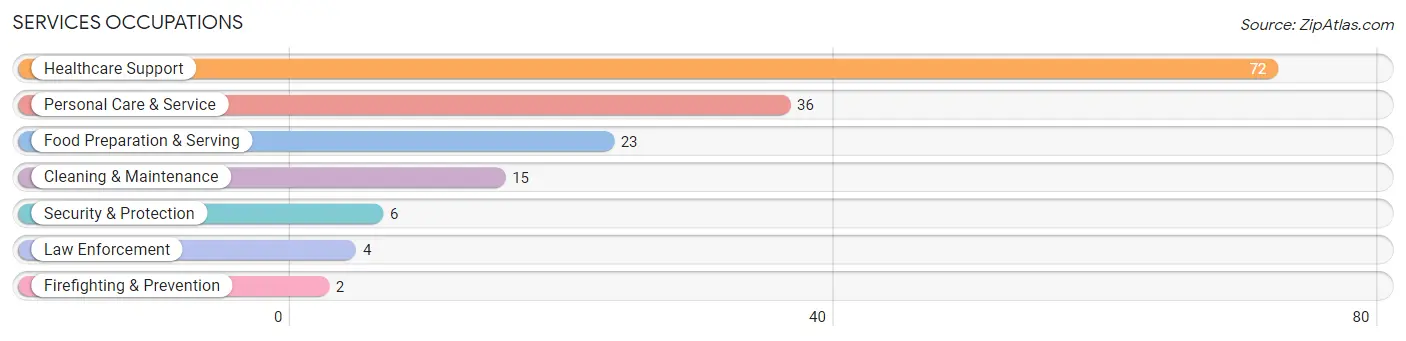
Services Occupations
The most common Services occupations in Walnut are Healthcare Support (72 | 10.0%), Personal Care & Service (36 | 5.0%), Food Preparation & Serving (23 | 3.2%), Cleaning & Maintenance (15 | 2.1%), and Security & Protection (6 | 0.8%).
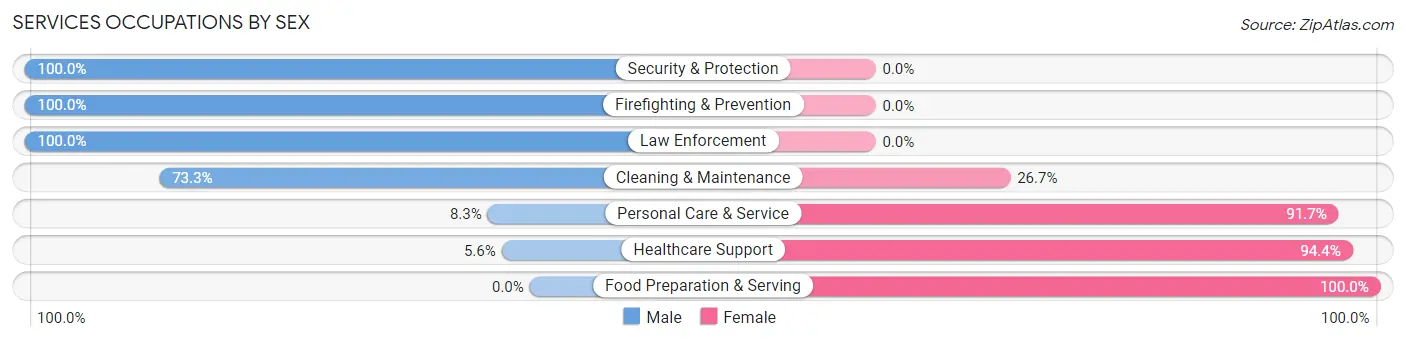
Services Occupations by Sex
Within the Services occupations in Walnut, the most male-oriented occupations are Security & Protection (100.0%), Firefighting & Prevention (100.0%), and Law Enforcement (100.0%), while the most female-oriented occupations are Food Preparation & Serving (100.0%), Healthcare Support (94.4%), and Personal Care & Service (91.7%).
| Occupation | Male | Female |
| Healthcare Support | 4 (5.6%) | 68 (94.4%) |
| Security & Protection | 6 (100.0%) | 0 (0.0%) |
| Firefighting & Prevention | 2 (100.0%) | 0 (0.0%) |
| Law Enforcement | 4 (100.0%) | 0 (0.0%) |
| Food Preparation & Serving | 0 (0.0%) | 23 (100.0%) |
| Cleaning & Maintenance | 11 (73.3%) | 4 (26.7%) |
| Personal Care & Service | 3 (8.3%) | 33 (91.7%) |
| Total (Category) | 24 (15.8%) | 128 (84.2%) |
| Total (Overall) | 335 (46.6%) | 384 (53.4%) |
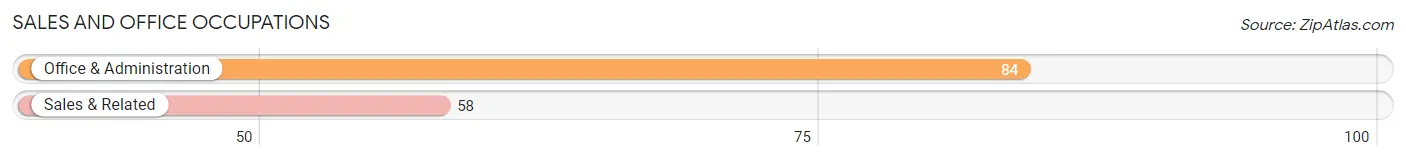
Sales and Office Occupations
The most common Sales and Office occupations in Walnut are Office & Administration (84 | 11.7%), and Sales & Related (58 | 8.1%).
Sales and Office Occupations by Sex
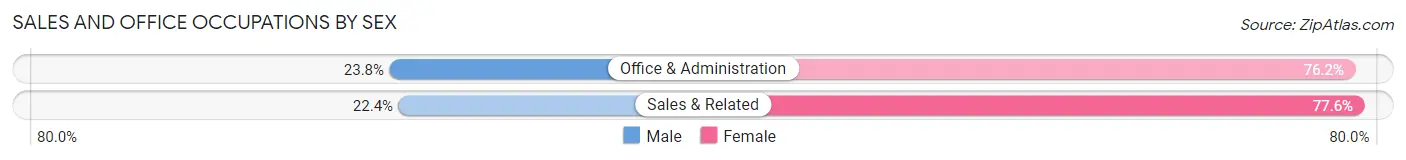
| Occupation | Male | Female |
| Sales & Related | 13 (22.4%) | 45 (77.6%) |
| Office & Administration | 20 (23.8%) | 64 (76.2%) |
| Total (Category) | 33 (23.2%) | 109 (76.8%) |
| Total (Overall) | 335 (46.6%) | 384 (53.4%) |
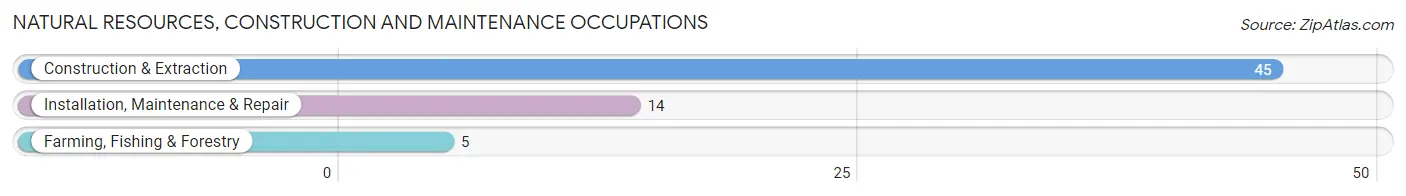
Natural Resources, Construction and Maintenance Occupations
The most common Natural Resources, Construction and Maintenance occupations in Walnut are Construction & Extraction (45 | 6.3%), Installation, Maintenance & Repair (14 | 1.9%), and Farming, Fishing & Forestry (5 | 0.7%).
Natural Resources, Construction and Maintenance Occupations by Sex
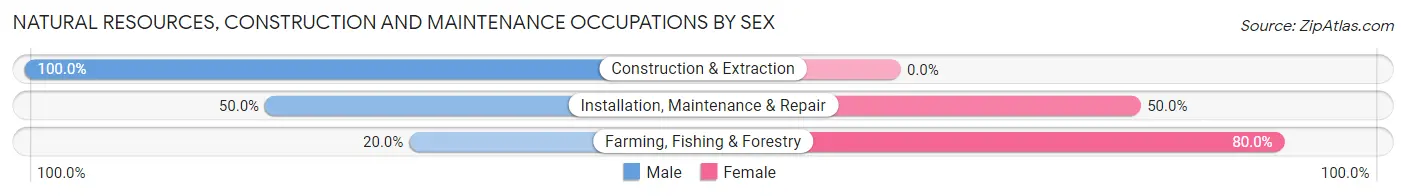
| Occupation | Male | Female |
| Farming, Fishing & Forestry | 1 (20.0%) | 4 (80.0%) |
| Construction & Extraction | 45 (100.0%) | 0 (0.0%) |
| Installation, Maintenance & Repair | 7 (50.0%) | 7 (50.0%) |
| Total (Category) | 53 (82.8%) | 11 (17.2%) |
| Total (Overall) | 335 (46.6%) | 384 (53.4%) |
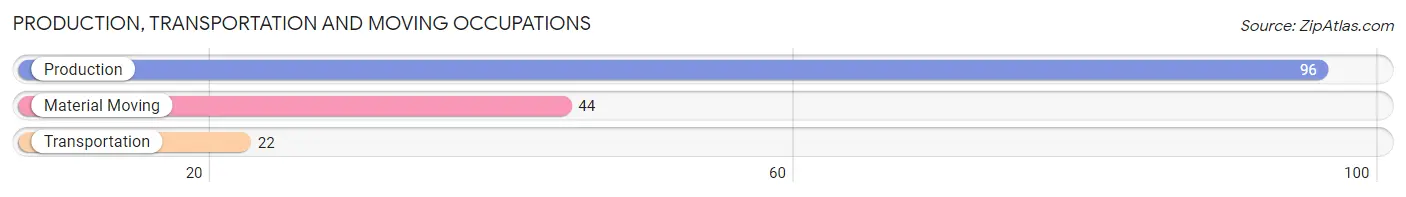
Production, Transportation and Moving Occupations
The most common Production, Transportation and Moving occupations in Walnut are Production (96 | 13.4%), Material Moving (44 | 6.1%), and Transportation (22 | 3.1%).
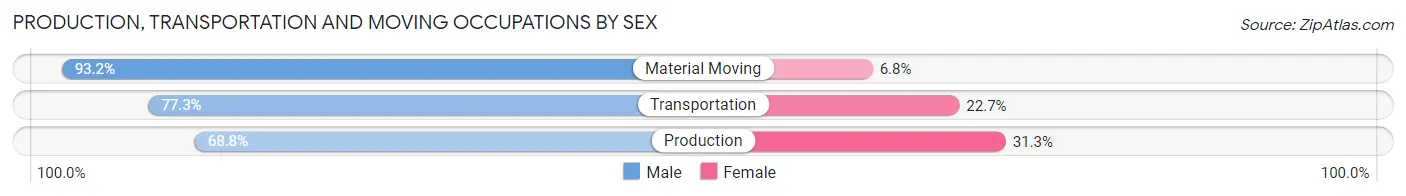
Production, Transportation and Moving Occupations by Sex
| Occupation | Male | Female |
| Production | 66 (68.8%) | 30 (31.2%) |
| Transportation | 17 (77.3%) | 5 (22.7%) |
| Material Moving | 41 (93.2%) | 3 (6.8%) |
| Total (Category) | 124 (76.5%) | 38 (23.5%) |
| Total (Overall) | 335 (46.6%) | 384 (53.4%) |
Employment Industries by Sex in Walnut
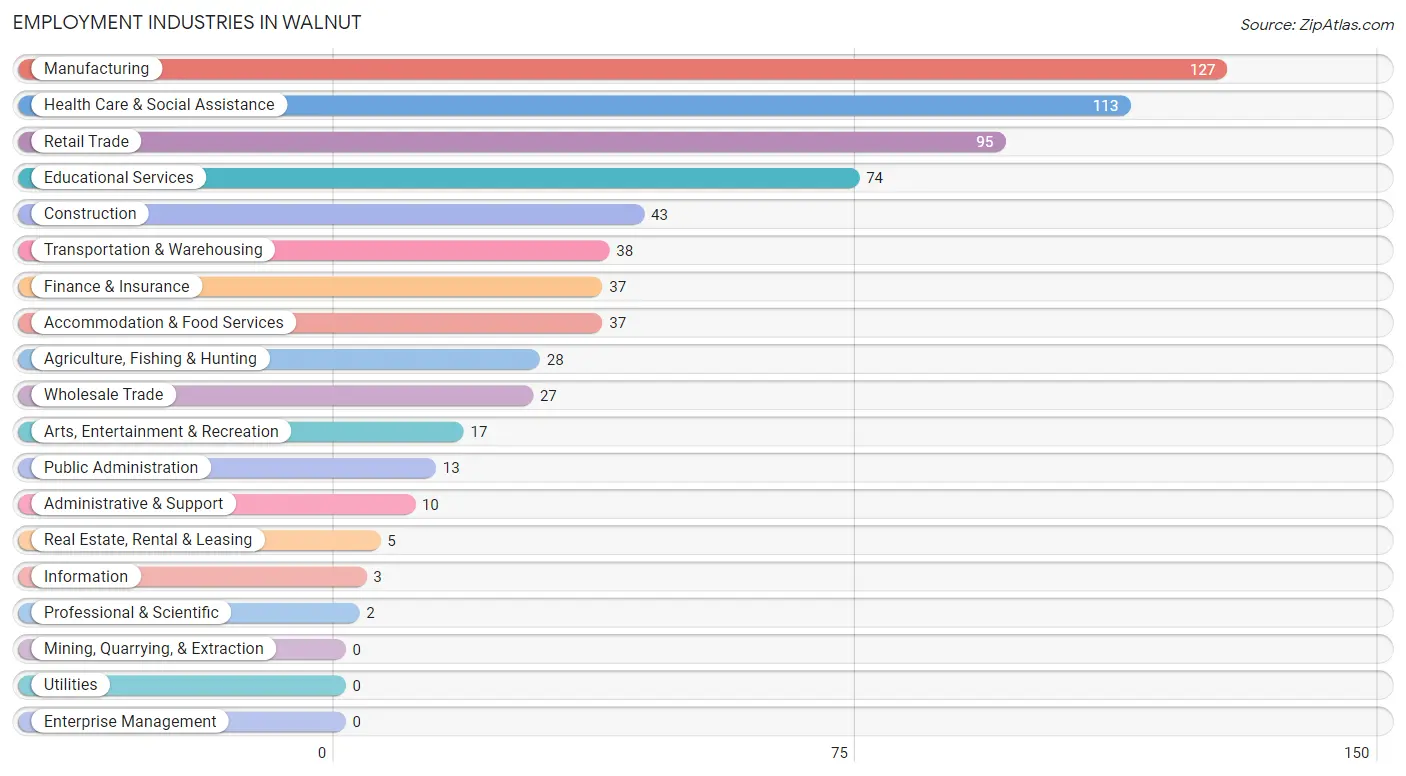
Employment Industries in Walnut
The major employment industries in Walnut include Manufacturing (127 | 17.7%), Health Care & Social Assistance (113 | 15.7%), Retail Trade (95 | 13.2%), Educational Services (74 | 10.3%), and Construction (43 | 6.0%).
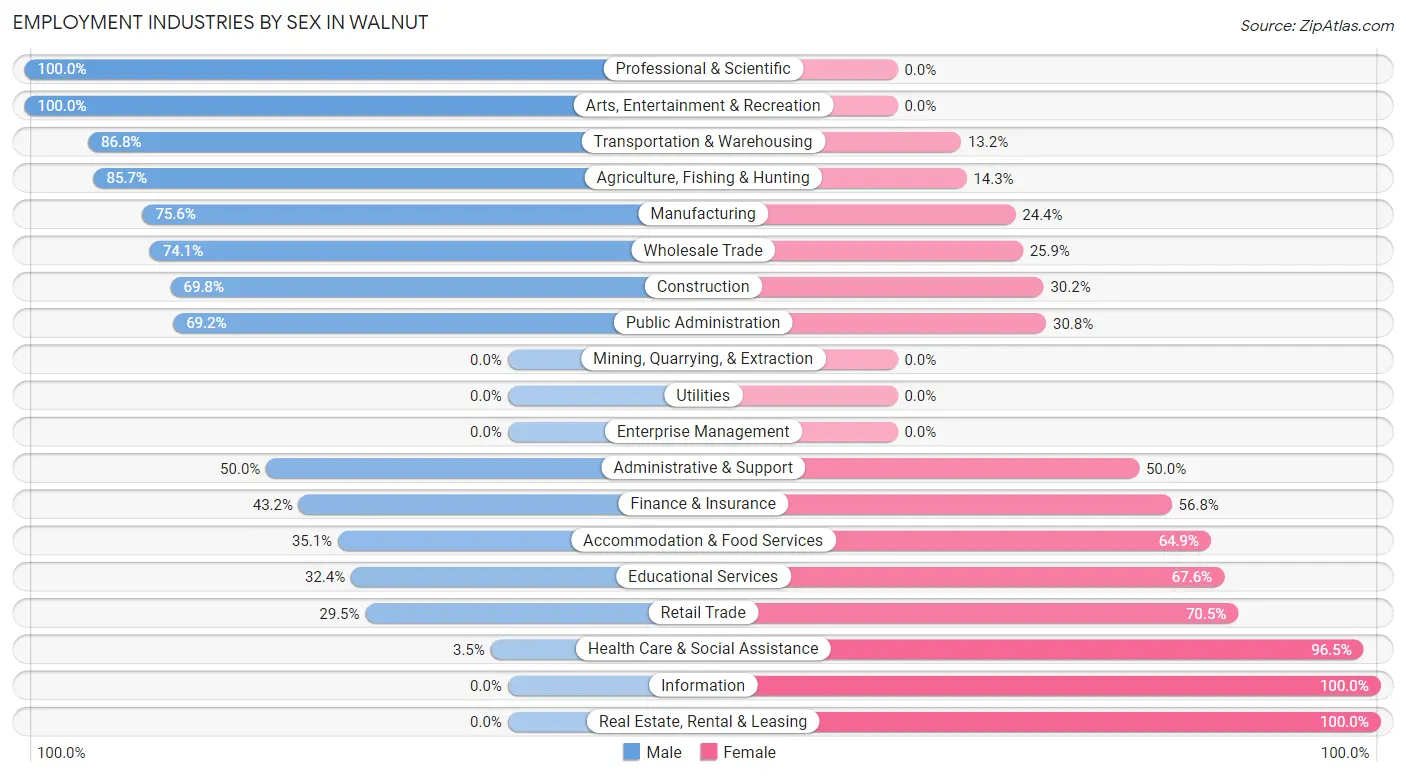
Employment Industries by Sex in Walnut
The Walnut industries that see more men than women are Professional & Scientific (100.0%), Arts, Entertainment & Recreation (100.0%), and Transportation & Warehousing (86.8%), whereas the industries that tend to have a higher number of women are Information (100.0%), Real Estate, Rental & Leasing (100.0%), and Health Care & Social Assistance (96.5%).
| Industry | Male | Female |
| Agriculture, Fishing & Hunting | 24 (85.7%) | 4 (14.3%) |
| Mining, Quarrying, & Extraction | 0 (0.0%) | 0 (0.0%) |
| Construction | 30 (69.8%) | 13 (30.2%) |
| Manufacturing | 96 (75.6%) | 31 (24.4%) |
| Wholesale Trade | 20 (74.1%) | 7 (25.9%) |
| Retail Trade | 28 (29.5%) | 67 (70.5%) |
| Transportation & Warehousing | 33 (86.8%) | 5 (13.2%) |
| Utilities | 0 (0.0%) | 0 (0.0%) |
| Information | 0 (0.0%) | 3 (100.0%) |
| Finance & Insurance | 16 (43.2%) | 21 (56.8%) |
| Real Estate, Rental & Leasing | 0 (0.0%) | 5 (100.0%) |
| Professional & Scientific | 2 (100.0%) | 0 (0.0%) |
| Enterprise Management | 0 (0.0%) | 0 (0.0%) |
| Administrative & Support | 5 (50.0%) | 5 (50.0%) |
| Educational Services | 24 (32.4%) | 50 (67.6%) |
| Health Care & Social Assistance | 4 (3.5%) | 109 (96.5%) |
| Arts, Entertainment & Recreation | 17 (100.0%) | 0 (0.0%) |
| Accommodation & Food Services | 13 (35.1%) | 24 (64.9%) |
| Public Administration | 9 (69.2%) | 4 (30.8%) |
| Total | 335 (46.6%) | 384 (53.4%) |
Education in Walnut
School Enrollment in Walnut
The most common levels of schooling among the 333 students in Walnut are elementary school (98 | 29.4%), middle school (75 | 22.5%), and high school (50 | 15.0%).
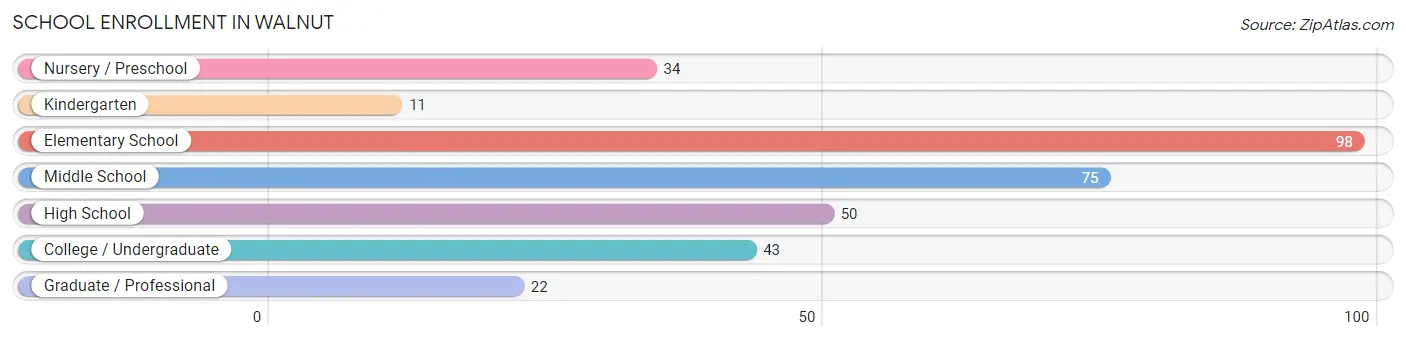
| School Level | # Students | % Students |
| Nursery / Preschool | 34 | 10.2% |
| Kindergarten | 11 | 3.3% |
| Elementary School | 98 | 29.4% |
| Middle School | 75 | 22.5% |
| High School | 50 | 15.0% |
| College / Undergraduate | 43 | 12.9% |
| Graduate / Professional | 22 | 6.6% |
| Total | 333 | 100.0% |
School Enrollment by Age by Funding Source in Walnut
Out of a total of 333 students who are enrolled in schools in Walnut, 49 (14.7%) attend a private institution, while the remaining 284 (85.3%) are enrolled in public schools. The age group of 35 years and over has the highest likelihood of being enrolled in private schools, with 12 (75.0% in the age bracket) enrolled. Conversely, the age group of 15 to 17 year olds has the lowest likelihood of being enrolled in a private school, with 39 (100.0% in the age bracket) attending a public institution.
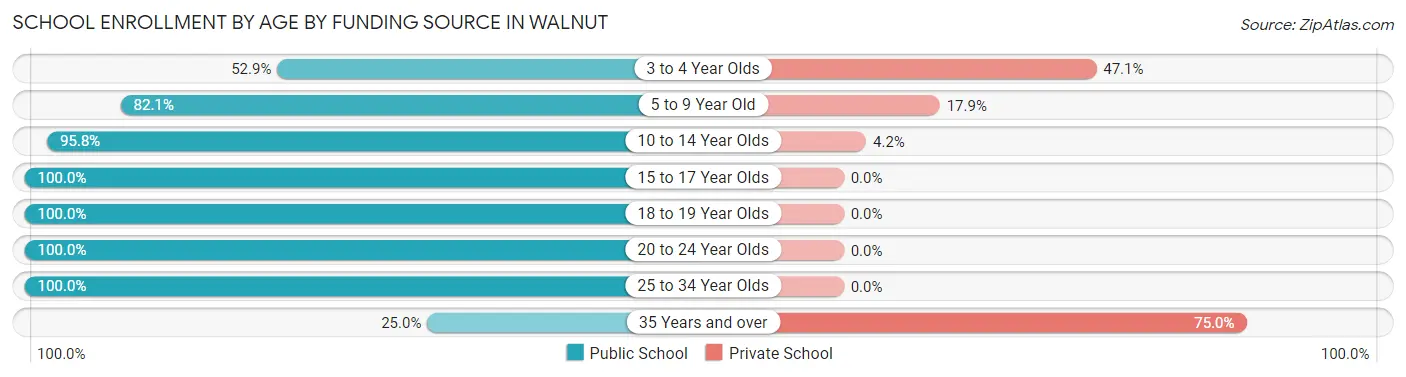
| Age Bracket | Public School | Private School |
| 3 to 4 Year Olds | 18 (52.9%) | 16 (47.1%) |
| 5 to 9 Year Old | 78 (82.1%) | 17 (17.9%) |
| 10 to 14 Year Olds | 92 (95.8%) | 4 (4.2%) |
| 15 to 17 Year Olds | 39 (100.0%) | 0 (0.0%) |
| 18 to 19 Year Olds | 19 (100.0%) | 0 (0.0%) |
| 20 to 24 Year Olds | 16 (100.0%) | 0 (0.0%) |
| 25 to 34 Year Olds | 18 (100.0%) | 0 (0.0%) |
| 35 Years and over | 4 (25.0%) | 12 (75.0%) |
| Total | 284 (85.3%) | 49 (14.7%) |
Educational Attainment by Field of Study in Walnut
Bio, nature & agricultural (73 | 30.9%), education (45 | 19.1%), business (27 | 11.4%), literature & languages (20 | 8.5%), and arts & humanities (19 | 8.1%) are the most common fields of study among 236 individuals in Walnut who have obtained a bachelor's degree or higher.
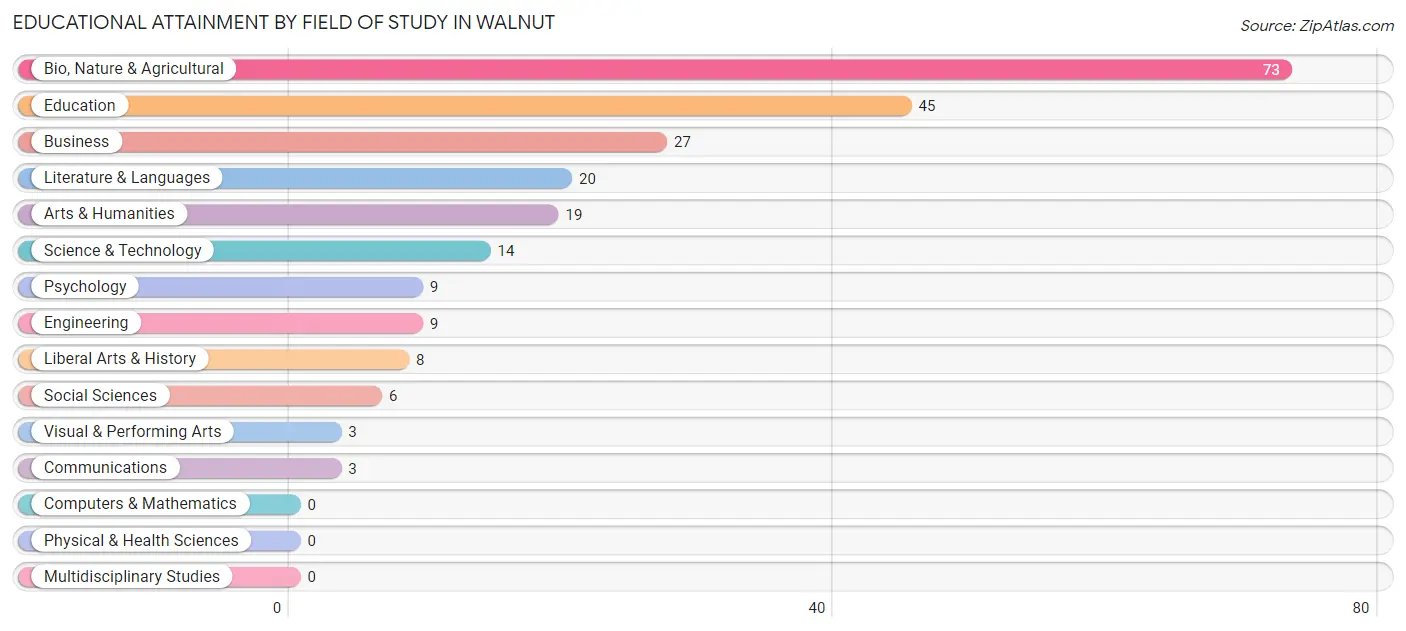
| Field of Study | # Graduates | % Graduates |
| Computers & Mathematics | 0 | 0.0% |
| Bio, Nature & Agricultural | 73 | 30.9% |
| Physical & Health Sciences | 0 | 0.0% |
| Psychology | 9 | 3.8% |
| Social Sciences | 6 | 2.5% |
| Engineering | 9 | 3.8% |
| Multidisciplinary Studies | 0 | 0.0% |
| Science & Technology | 14 | 5.9% |
| Business | 27 | 11.4% |
| Education | 45 | 19.1% |
| Literature & Languages | 20 | 8.5% |
| Liberal Arts & History | 8 | 3.4% |
| Visual & Performing Arts | 3 | 1.3% |
| Communications | 3 | 1.3% |
| Arts & Humanities | 19 | 8.1% |
| Total | 236 | 100.0% |
Transportation & Commute in Walnut
Vehicle Availability by Sex in Walnut
The most prevalent vehicle ownership categories in Walnut are males with 2 vehicles (164, accounting for 56.2%) and females with 2 vehicles (196, making up 42.7%).
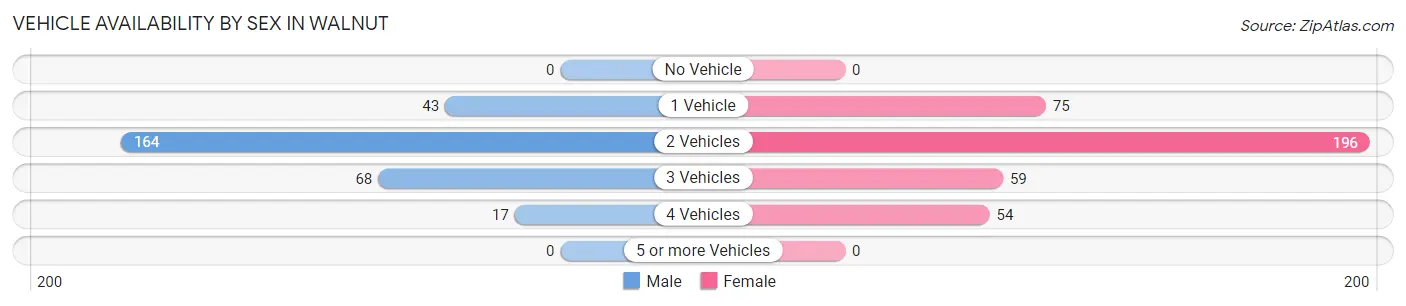
| Vehicles Available | Male | Female |
| No Vehicle | 0 (0.0%) | 0 (0.0%) |
| 1 Vehicle | 43 (14.7%) | 75 (19.5%) |
| 2 Vehicles | 164 (56.2%) | 196 (51.0%) |
| 3 Vehicles | 68 (23.3%) | 59 (15.4%) |
| 4 Vehicles | 17 (5.8%) | 54 (14.1%) |
| 5 or more Vehicles | 0 (0.0%) | 0 (0.0%) |
| Total | 292 (100.0%) | 384 (100.0%) |
Commute Time in Walnut
The most frequently occuring commute durations in Walnut are less than 5 minutes (142 commuters, 21.2%), 5 to 9 minutes (119 commuters, 17.8%), and 30 to 34 minutes (94 commuters, 14.1%).
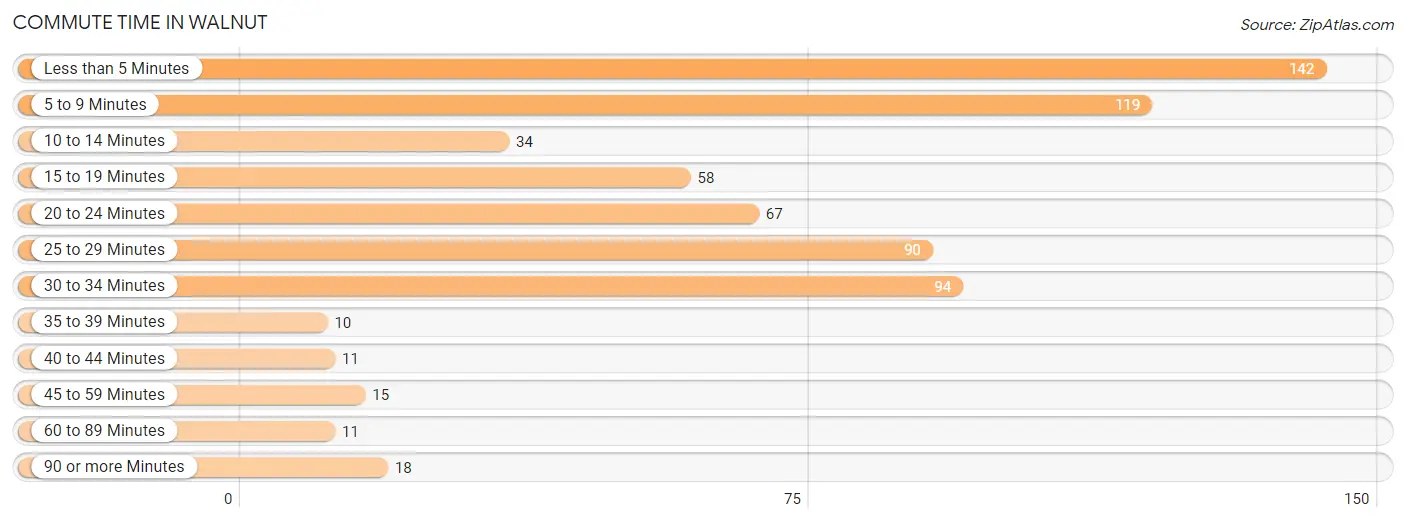
| Commute Time | # Commuters | % Commuters |
| Less than 5 Minutes | 142 | 21.2% |
| 5 to 9 Minutes | 119 | 17.8% |
| 10 to 14 Minutes | 34 | 5.1% |
| 15 to 19 Minutes | 58 | 8.7% |
| 20 to 24 Minutes | 67 | 10.0% |
| 25 to 29 Minutes | 90 | 13.5% |
| 30 to 34 Minutes | 94 | 14.1% |
| 35 to 39 Minutes | 10 | 1.5% |
| 40 to 44 Minutes | 11 | 1.6% |
| 45 to 59 Minutes | 15 | 2.2% |
| 60 to 89 Minutes | 11 | 1.6% |
| 90 or more Minutes | 18 | 2.7% |
Commute Time by Sex in Walnut
The most common commute times in Walnut are 25 to 29 minutes (58 commuters, 20.3%) for males and less than 5 minutes (91 commuters, 23.7%) for females.
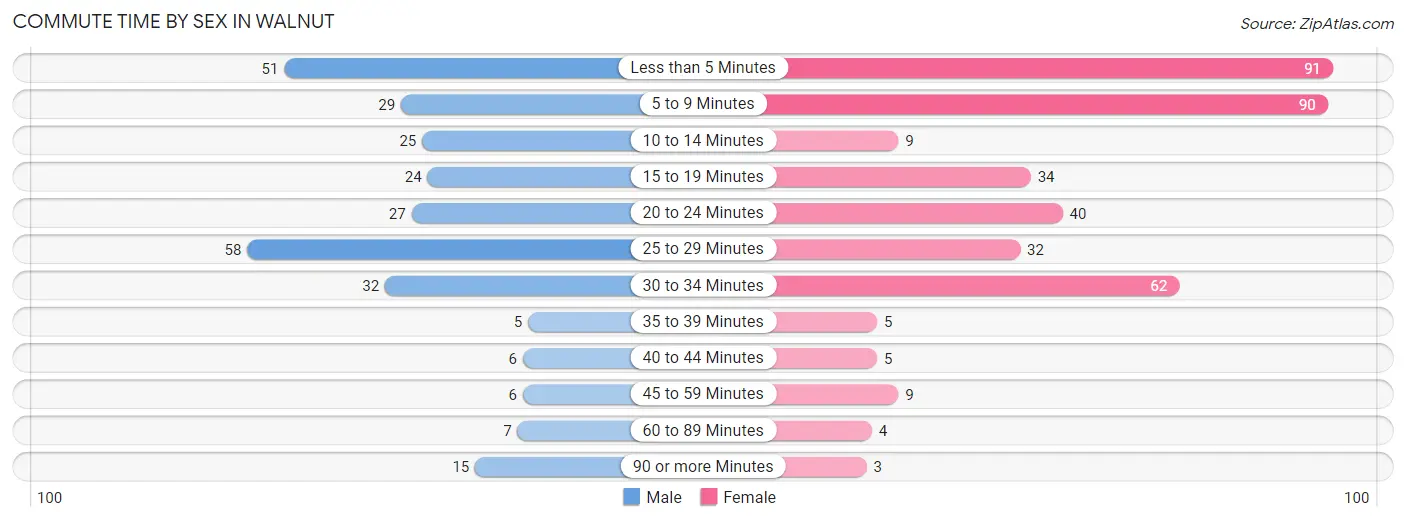
| Commute Time | Male | Female |
| Less than 5 Minutes | 51 (17.9%) | 91 (23.7%) |
| 5 to 9 Minutes | 29 (10.2%) | 90 (23.4%) |
| 10 to 14 Minutes | 25 (8.8%) | 9 (2.3%) |
| 15 to 19 Minutes | 24 (8.4%) | 34 (8.8%) |
| 20 to 24 Minutes | 27 (9.5%) | 40 (10.4%) |
| 25 to 29 Minutes | 58 (20.3%) | 32 (8.3%) |
| 30 to 34 Minutes | 32 (11.2%) | 62 (16.2%) |
| 35 to 39 Minutes | 5 (1.8%) | 5 (1.3%) |
| 40 to 44 Minutes | 6 (2.1%) | 5 (1.3%) |
| 45 to 59 Minutes | 6 (2.1%) | 9 (2.3%) |
| 60 to 89 Minutes | 7 (2.5%) | 4 (1.0%) |
| 90 or more Minutes | 15 (5.3%) | 3 (0.8%) |
Time of Departure to Work by Sex in Walnut
The most frequent times of departure to work in Walnut are 7:00 AM to 7:29 AM (72, 25.3%) for males and 12:00 PM to 3:59 PM (63, 16.4%) for females.
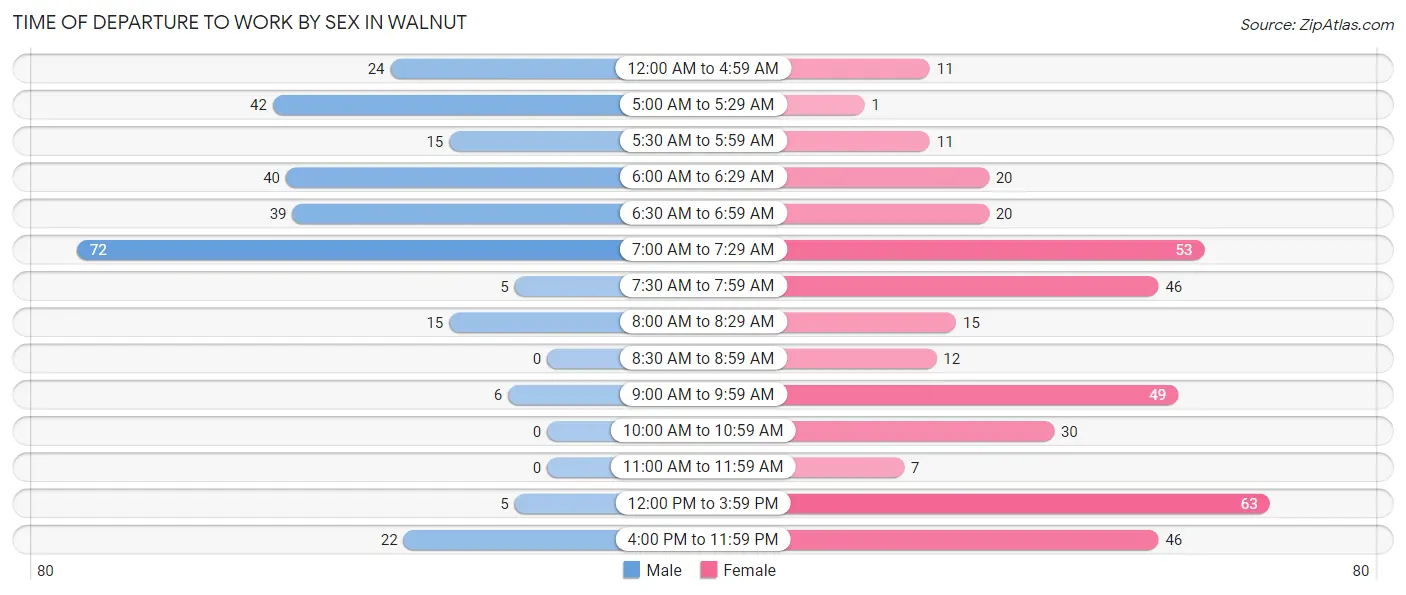
| Time of Departure | Male | Female |
| 12:00 AM to 4:59 AM | 24 (8.4%) | 11 (2.9%) |
| 5:00 AM to 5:29 AM | 42 (14.7%) | 1 (0.3%) |
| 5:30 AM to 5:59 AM | 15 (5.3%) | 11 (2.9%) |
| 6:00 AM to 6:29 AM | 40 (14.0%) | 20 (5.2%) |
| 6:30 AM to 6:59 AM | 39 (13.7%) | 20 (5.2%) |
| 7:00 AM to 7:29 AM | 72 (25.3%) | 53 (13.8%) |
| 7:30 AM to 7:59 AM | 5 (1.8%) | 46 (12.0%) |
| 8:00 AM to 8:29 AM | 15 (5.3%) | 15 (3.9%) |
| 8:30 AM to 8:59 AM | 0 (0.0%) | 12 (3.1%) |
| 9:00 AM to 9:59 AM | 6 (2.1%) | 49 (12.8%) |
| 10:00 AM to 10:59 AM | 0 (0.0%) | 30 (7.8%) |
| 11:00 AM to 11:59 AM | 0 (0.0%) | 7 (1.8%) |
| 12:00 PM to 3:59 PM | 5 (1.8%) | 63 (16.4%) |
| 4:00 PM to 11:59 PM | 22 (7.7%) | 46 (12.0%) |
| Total | 285 (100.0%) | 384 (100.0%) |
Housing Occupancy in Walnut
Occupancy by Ownership in Walnut
Of the total 583 dwellings in Walnut, owner-occupied units account for 471 (80.8%), while renter-occupied units make up 112 (19.2%).
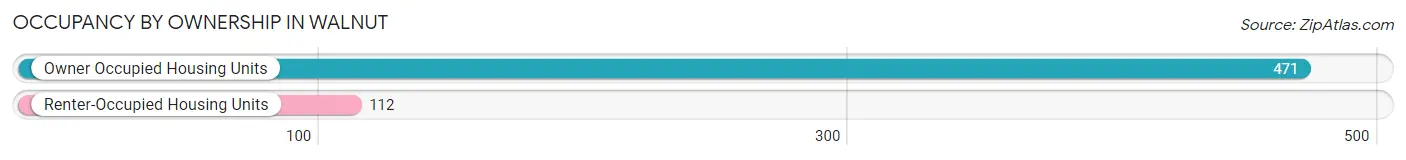
| Occupancy | # Housing Units | % Housing Units |
| Owner Occupied Housing Units | 471 | 80.8% |
| Renter-Occupied Housing Units | 112 | 19.2% |
| Total Occupied Housing Units | 583 | 100.0% |
Occupancy by Household Size in Walnut
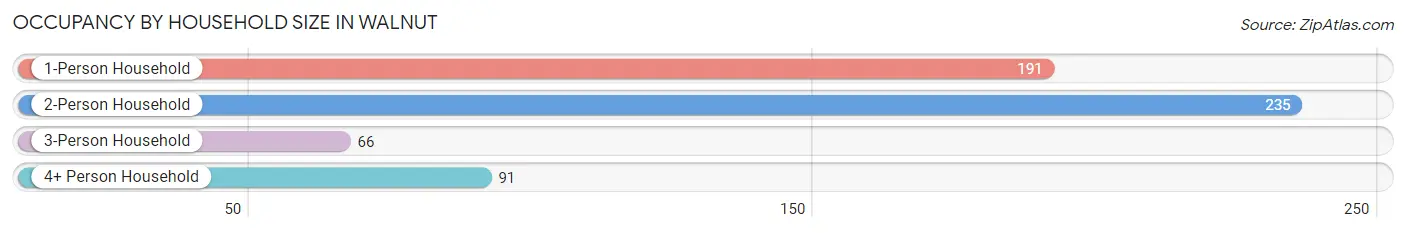
| Household Size | # Housing Units | % Housing Units |
| 1-Person Household | 191 | 32.8% |
| 2-Person Household | 235 | 40.3% |
| 3-Person Household | 66 | 11.3% |
| 4+ Person Household | 91 | 15.6% |
| Total Housing Units | 583 | 100.0% |
Occupancy by Ownership by Household Size in Walnut
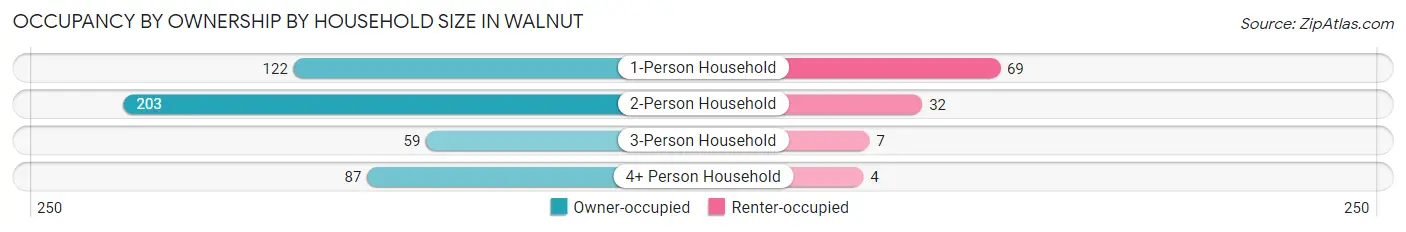
| Household Size | Owner-occupied | Renter-occupied |
| 1-Person Household | 122 (63.9%) | 69 (36.1%) |
| 2-Person Household | 203 (86.4%) | 32 (13.6%) |
| 3-Person Household | 59 (89.4%) | 7 (10.6%) |
| 4+ Person Household | 87 (95.6%) | 4 (4.4%) |
| Total Housing Units | 471 (80.8%) | 112 (19.2%) |
Occupancy by Educational Attainment in Walnut
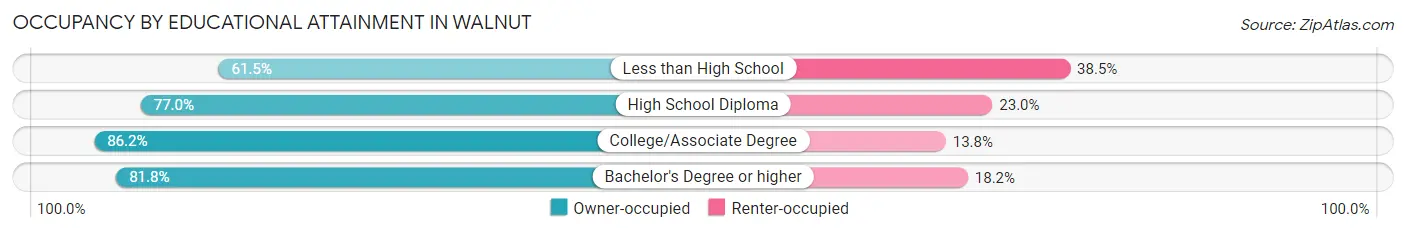
| Household Size | Owner-occupied | Renter-occupied |
| Less than High School | 16 (61.5%) | 10 (38.5%) |
| High School Diploma | 157 (77.0%) | 47 (23.0%) |
| College/Associate Degree | 181 (86.2%) | 29 (13.8%) |
| Bachelor's Degree or higher | 117 (81.8%) | 26 (18.2%) |
Occupancy by Age of Householder in Walnut
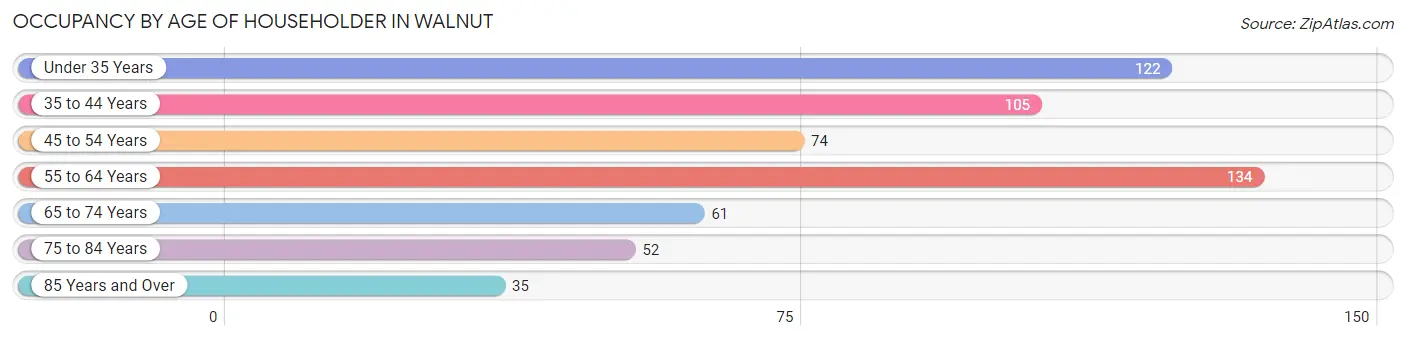
| Age Bracket | # Households | % Households |
| Under 35 Years | 122 | 20.9% |
| 35 to 44 Years | 105 | 18.0% |
| 45 to 54 Years | 74 | 12.7% |
| 55 to 64 Years | 134 | 23.0% |
| 65 to 74 Years | 61 | 10.5% |
| 75 to 84 Years | 52 | 8.9% |
| 85 Years and Over | 35 | 6.0% |
| Total | 583 | 100.0% |
Housing Finances in Walnut
Median Income by Occupancy in Walnut
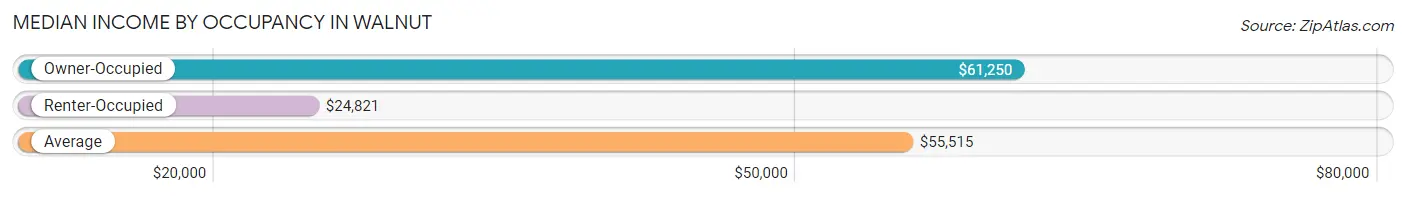
| Occupancy Type | # Households | Median Income |
| Owner-Occupied | 471 (80.8%) | $61,250 |
| Renter-Occupied | 112 (19.2%) | $24,821 |
| Average | 583 (100.0%) | $55,515 |
Occupancy by Householder Income Bracket in Walnut
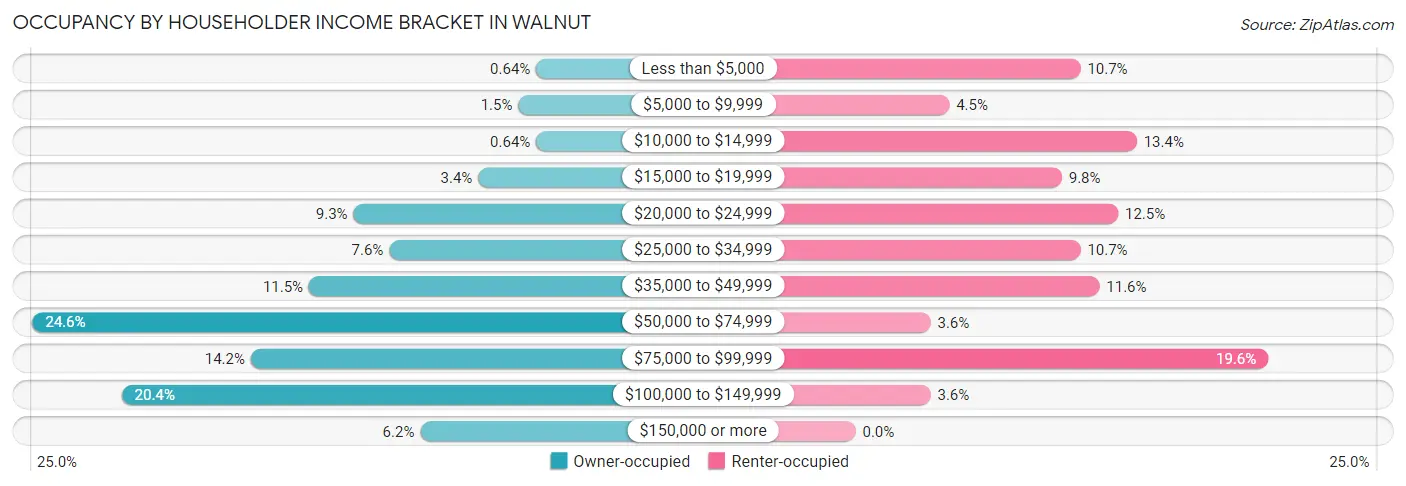
| Income Bracket | Owner-occupied | Renter-occupied |
| Less than $5,000 | 3 (0.6%) | 12 (10.7%) |
| $5,000 to $9,999 | 7 (1.5%) | 5 (4.5%) |
| $10,000 to $14,999 | 3 (0.6%) | 15 (13.4%) |
| $15,000 to $19,999 | 16 (3.4%) | 11 (9.8%) |
| $20,000 to $24,999 | 44 (9.3%) | 14 (12.5%) |
| $25,000 to $34,999 | 36 (7.6%) | 12 (10.7%) |
| $35,000 to $49,999 | 54 (11.5%) | 13 (11.6%) |
| $50,000 to $74,999 | 116 (24.6%) | 4 (3.6%) |
| $75,000 to $99,999 | 67 (14.2%) | 22 (19.6%) |
| $100,000 to $149,999 | 96 (20.4%) | 4 (3.6%) |
| $150,000 or more | 29 (6.2%) | 0 (0.0%) |
| Total | 471 (100.0%) | 112 (100.0%) |
Monthly Housing Cost Tiers in Walnut
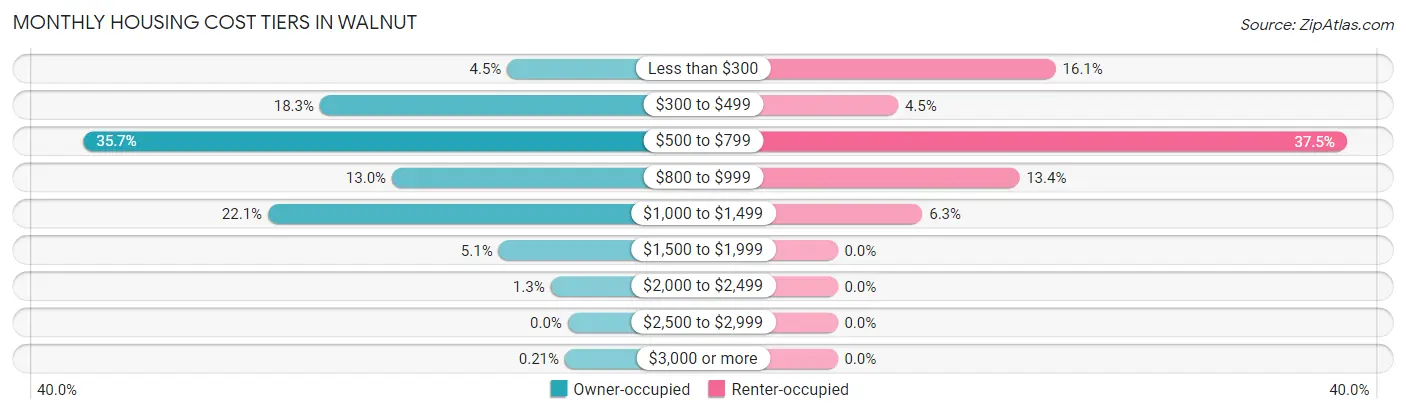
| Monthly Cost | Owner-occupied | Renter-occupied |
| Less than $300 | 21 (4.5%) | 18 (16.1%) |
| $300 to $499 | 86 (18.3%) | 5 (4.5%) |
| $500 to $799 | 168 (35.7%) | 42 (37.5%) |
| $800 to $999 | 61 (13.0%) | 15 (13.4%) |
| $1,000 to $1,499 | 104 (22.1%) | 7 (6.2%) |
| $1,500 to $1,999 | 24 (5.1%) | 0 (0.0%) |
| $2,000 to $2,499 | 6 (1.3%) | 0 (0.0%) |
| $2,500 to $2,999 | 0 (0.0%) | 0 (0.0%) |
| $3,000 or more | 1 (0.2%) | 0 (0.0%) |
| Total | 471 (100.0%) | 112 (100.0%) |
Physical Housing Characteristics in Walnut
Housing Structures in Walnut
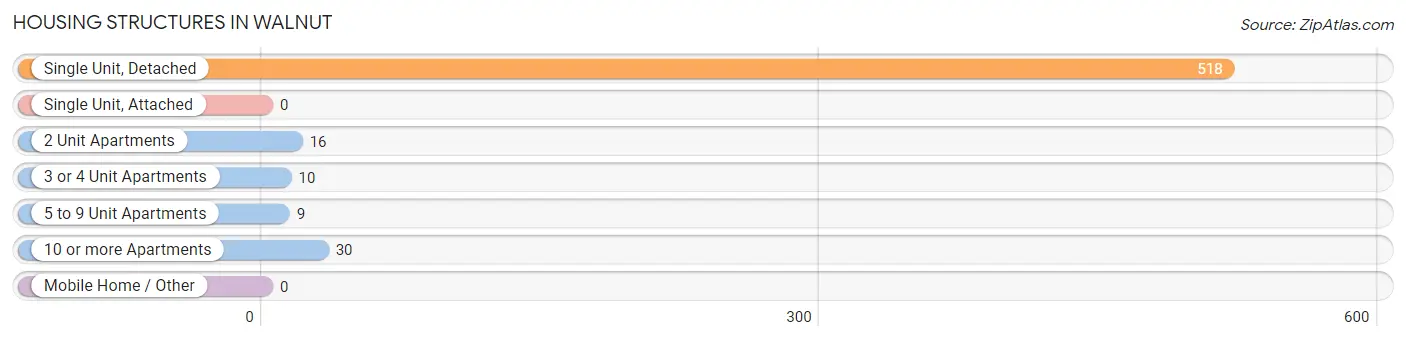
| Structure Type | # Housing Units | % Housing Units |
| Single Unit, Detached | 518 | 88.8% |
| Single Unit, Attached | 0 | 0.0% |
| 2 Unit Apartments | 16 | 2.7% |
| 3 or 4 Unit Apartments | 10 | 1.7% |
| 5 to 9 Unit Apartments | 9 | 1.5% |
| 10 or more Apartments | 30 | 5.1% |
| Mobile Home / Other | 0 | 0.0% |
| Total | 583 | 100.0% |
Housing Structures by Occupancy in Walnut
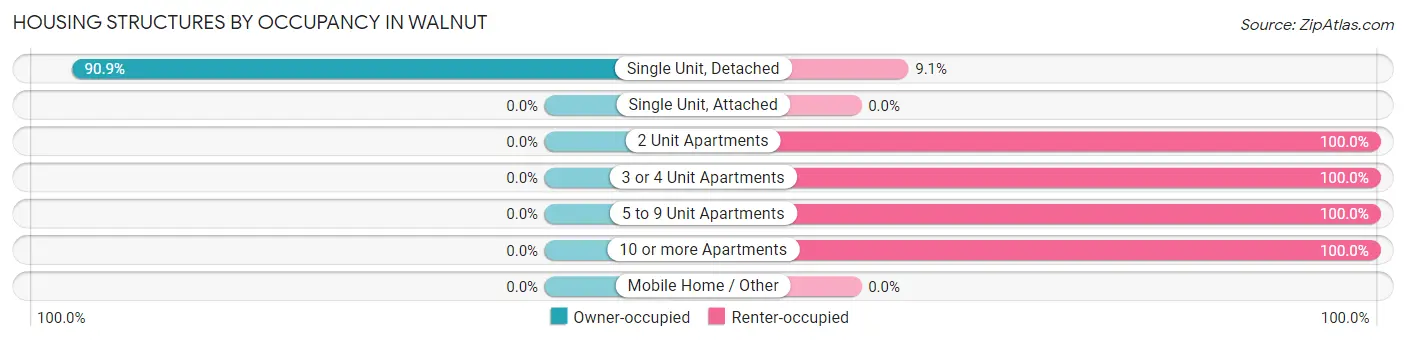
| Structure Type | Owner-occupied | Renter-occupied |
| Single Unit, Detached | 471 (90.9%) | 47 (9.1%) |
| Single Unit, Attached | 0 (0.0%) | 0 (0.0%) |
| 2 Unit Apartments | 0 (0.0%) | 16 (100.0%) |
| 3 or 4 Unit Apartments | 0 (0.0%) | 10 (100.0%) |
| 5 to 9 Unit Apartments | 0 (0.0%) | 9 (100.0%) |
| 10 or more Apartments | 0 (0.0%) | 30 (100.0%) |
| Mobile Home / Other | 0 (0.0%) | 0 (0.0%) |
| Total | 471 (80.8%) | 112 (19.2%) |
Housing Structures by Number of Rooms in Walnut
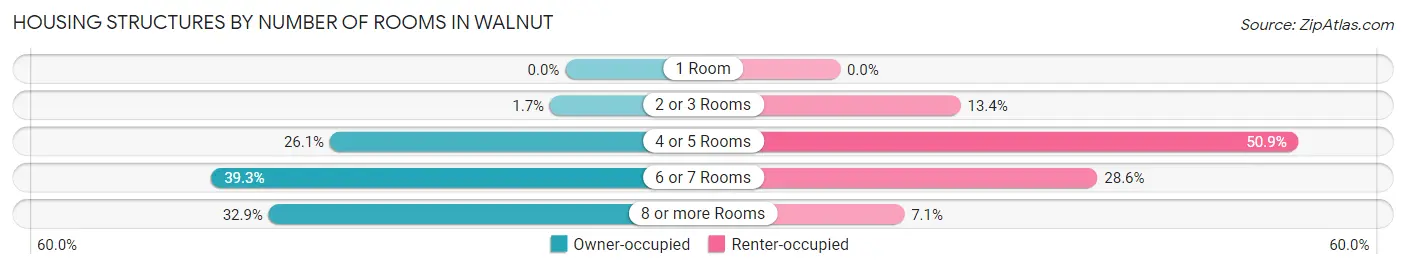
| Number of Rooms | Owner-occupied | Renter-occupied |
| 1 Room | 0 (0.0%) | 0 (0.0%) |
| 2 or 3 Rooms | 8 (1.7%) | 15 (13.4%) |
| 4 or 5 Rooms | 123 (26.1%) | 57 (50.9%) |
| 6 or 7 Rooms | 185 (39.3%) | 32 (28.6%) |
| 8 or more Rooms | 155 (32.9%) | 8 (7.1%) |
| Total | 471 (100.0%) | 112 (100.0%) |
Housing Structure by Heating Type in Walnut
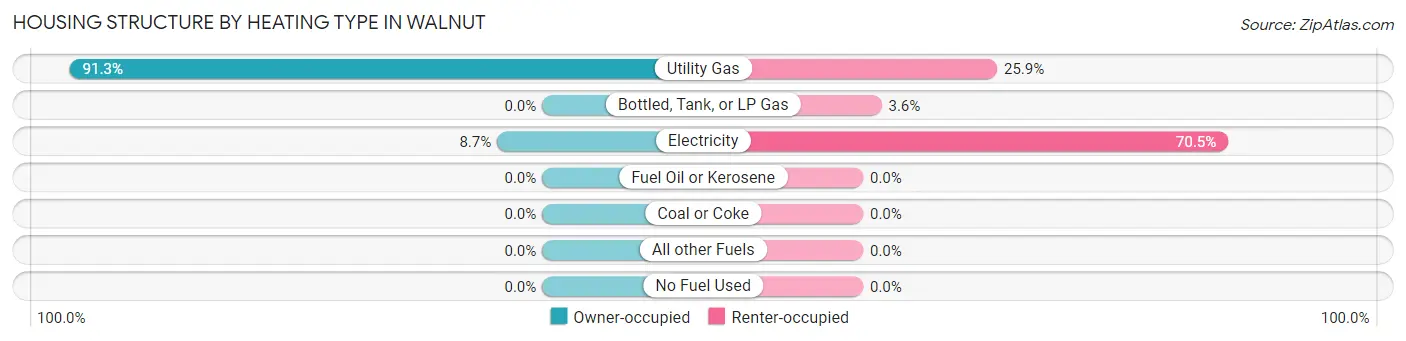
| Heating Type | Owner-occupied | Renter-occupied |
| Utility Gas | 430 (91.3%) | 29 (25.9%) |
| Bottled, Tank, or LP Gas | 0 (0.0%) | 4 (3.6%) |
| Electricity | 41 (8.7%) | 79 (70.5%) |
| Fuel Oil or Kerosene | 0 (0.0%) | 0 (0.0%) |
| Coal or Coke | 0 (0.0%) | 0 (0.0%) |
| All other Fuels | 0 (0.0%) | 0 (0.0%) |
| No Fuel Used | 0 (0.0%) | 0 (0.0%) |
| Total | 471 (100.0%) | 112 (100.0%) |
Household Vehicle Usage in Walnut
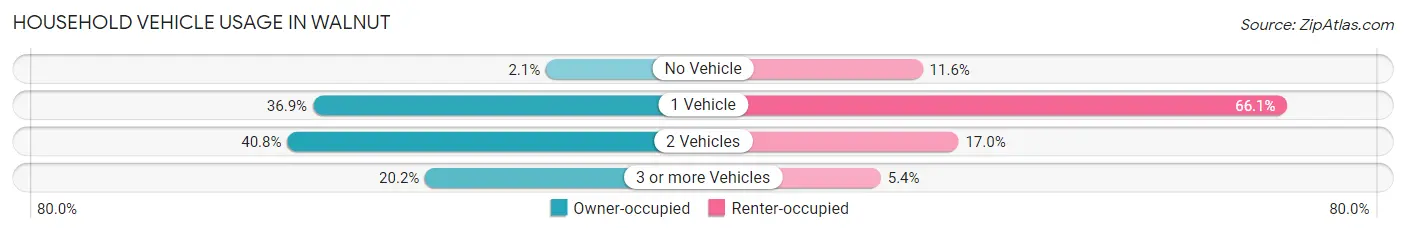
| Vehicles per Household | Owner-occupied | Renter-occupied |
| No Vehicle | 10 (2.1%) | 13 (11.6%) |
| 1 Vehicle | 174 (36.9%) | 74 (66.1%) |
| 2 Vehicles | 192 (40.8%) | 19 (17.0%) |
| 3 or more Vehicles | 95 (20.2%) | 6 (5.4%) |
| Total | 471 (100.0%) | 112 (100.0%) |
Real Estate & Mortgages in Walnut
Real Estate and Mortgage Overview in Walnut
| Characteristic | Without Mortgage | With Mortgage |
| Housing Units | 189 | 282 |
| Median Property Value | $98,900 | $104,200 |
| Median Household Income | $48,854 | $20 |
| Monthly Housing Costs | $485 | $1 |
| Real Estate Taxes | $2,269 | $8 |
Property Value by Mortgage Status in Walnut
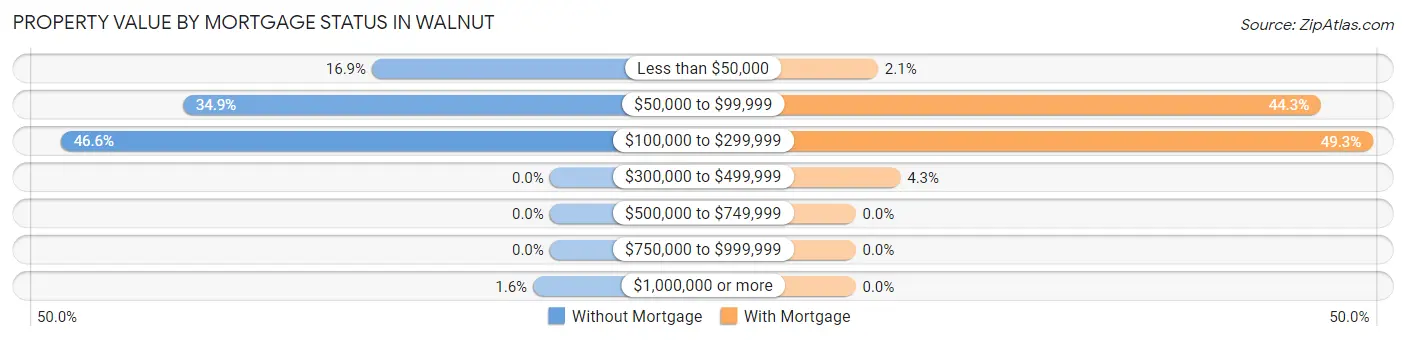
| Property Value | Without Mortgage | With Mortgage |
| Less than $50,000 | 32 (16.9%) | 6 (2.1%) |
| $50,000 to $99,999 | 66 (34.9%) | 125 (44.3%) |
| $100,000 to $299,999 | 88 (46.6%) | 139 (49.3%) |
| $300,000 to $499,999 | 0 (0.0%) | 12 (4.3%) |
| $500,000 to $749,999 | 0 (0.0%) | 0 (0.0%) |
| $750,000 to $999,999 | 0 (0.0%) | 0 (0.0%) |
| $1,000,000 or more | 3 (1.6%) | 0 (0.0%) |
| Total | 189 (100.0%) | 282 (100.0%) |
Household Income by Mortgage Status in Walnut
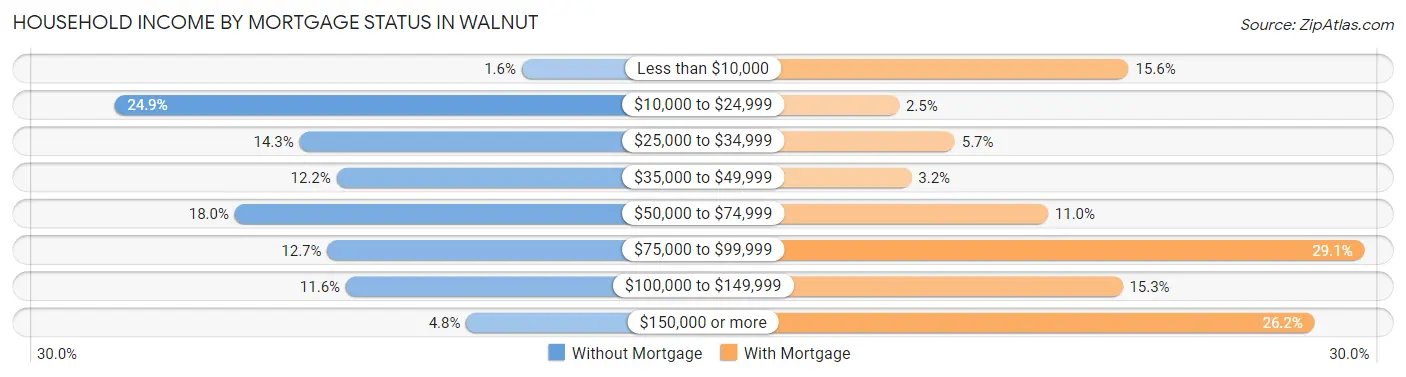
| Household Income | Without Mortgage | With Mortgage |
| Less than $10,000 | 3 (1.6%) | 44 (15.6%) |
| $10,000 to $24,999 | 47 (24.9%) | 7 (2.5%) |
| $25,000 to $34,999 | 27 (14.3%) | 16 (5.7%) |
| $35,000 to $49,999 | 23 (12.2%) | 9 (3.2%) |
| $50,000 to $74,999 | 34 (18.0%) | 31 (11.0%) |
| $75,000 to $99,999 | 24 (12.7%) | 82 (29.1%) |
| $100,000 to $149,999 | 22 (11.6%) | 43 (15.2%) |
| $150,000 or more | 9 (4.8%) | 74 (26.2%) |
| Total | 189 (100.0%) | 282 (100.0%) |
Property Value to Household Income Ratio in Walnut
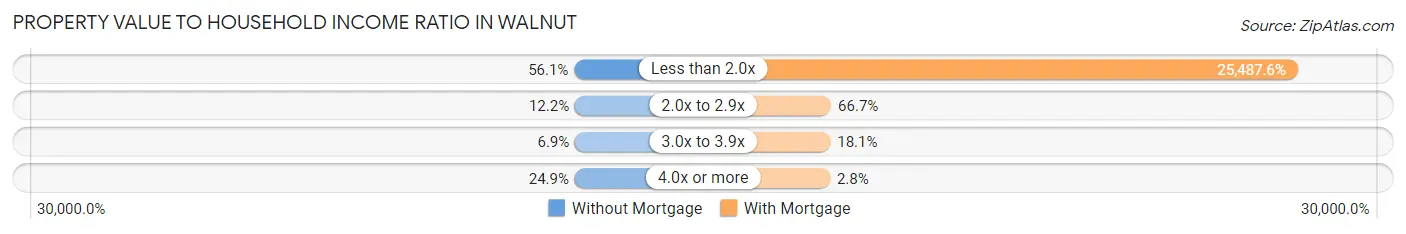
| Value-to-Income Ratio | Without Mortgage | With Mortgage |
| Less than 2.0x | 106 (56.1%) | 71,875 (25,487.6%) |
| 2.0x to 2.9x | 23 (12.2%) | 188 (66.7%) |
| 3.0x to 3.9x | 13 (6.9%) | 51 (18.1%) |
| 4.0x or more | 47 (24.9%) | 8 (2.8%) |
| Total | 189 (100.0%) | 282 (100.0%) |
Real Estate Taxes by Mortgage Status in Walnut
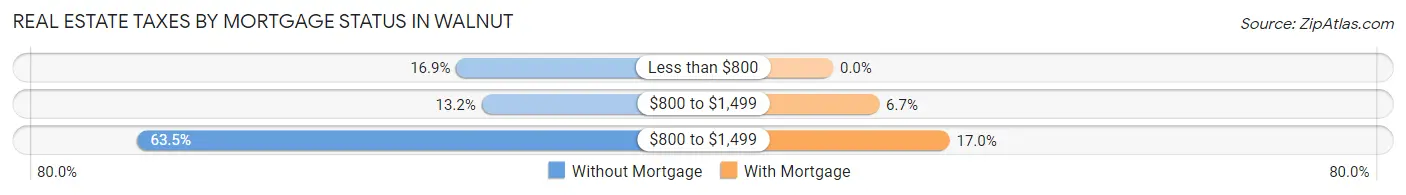
| Property Taxes | Without Mortgage | With Mortgage |
| Less than $800 | 32 (16.9%) | 0 (0.0%) |
| $800 to $1,499 | 25 (13.2%) | 19 (6.7%) |
| $800 to $1,499 | 120 (63.5%) | 48 (17.0%) |
| Total | 189 (100.0%) | 282 (100.0%) |
Health & Disability in Walnut
Health Insurance Coverage by Age in Walnut
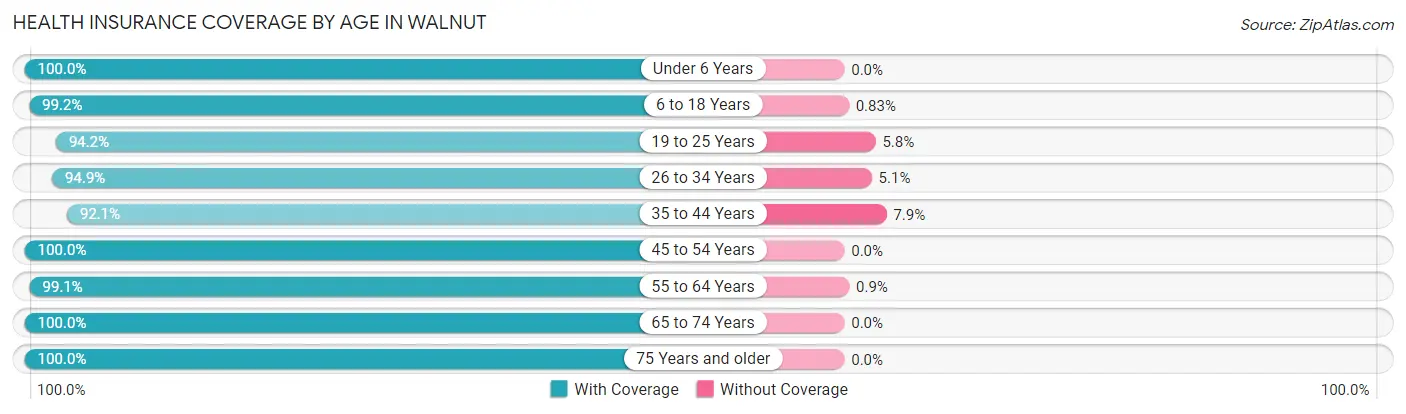
| Age Bracket | With Coverage | Without Coverage |
| Under 6 Years | 72 (100.0%) | 0 (0.0%) |
| 6 to 18 Years | 240 (99.2%) | 2 (0.8%) |
| 19 to 25 Years | 81 (94.2%) | 5 (5.8%) |
| 26 to 34 Years | 149 (94.9%) | 8 (5.1%) |
| 35 to 44 Years | 164 (92.1%) | 14 (7.9%) |
| 45 to 54 Years | 103 (100.0%) | 0 (0.0%) |
| 55 to 64 Years | 219 (99.1%) | 2 (0.9%) |
| 65 to 74 Years | 116 (100.0%) | 0 (0.0%) |
| 75 Years and older | 126 (100.0%) | 0 (0.0%) |
| Total | 1,270 (97.6%) | 31 (2.4%) |
Health Insurance Coverage by Citizenship Status in Walnut
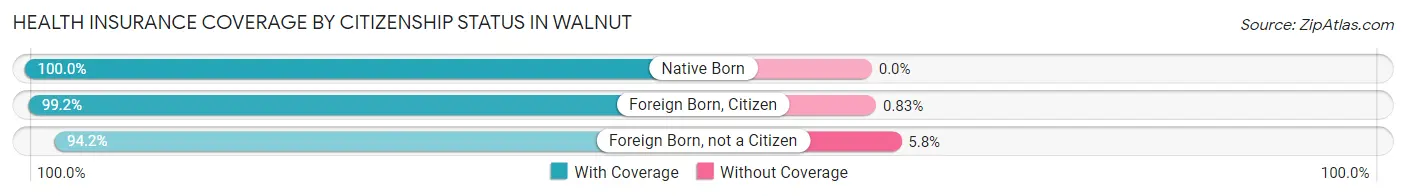
| Citizenship Status | With Coverage | Without Coverage |
| Native Born | 72 (100.0%) | 0 (0.0%) |
| Foreign Born, Citizen | 240 (99.2%) | 2 (0.8%) |
| Foreign Born, not a Citizen | 81 (94.2%) | 5 (5.8%) |
Health Insurance Coverage by Household Income in Walnut
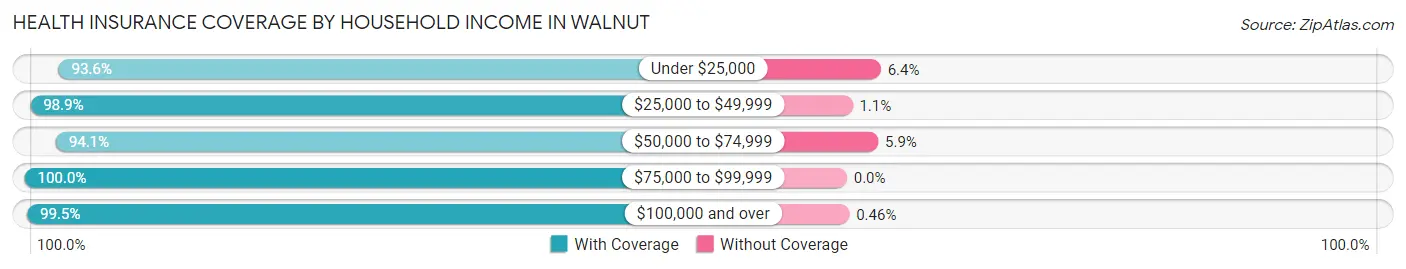
| Household Income | With Coverage | Without Coverage |
| Under $25,000 | 162 (93.6%) | 11 (6.4%) |
| $25,000 to $49,999 | 186 (98.9%) | 2 (1.1%) |
| $50,000 to $74,999 | 257 (94.1%) | 16 (5.9%) |
| $75,000 to $99,999 | 231 (100.0%) | 0 (0.0%) |
| $100,000 and over | 434 (99.5%) | 2 (0.5%) |
Public vs Private Health Insurance Coverage by Age in Walnut
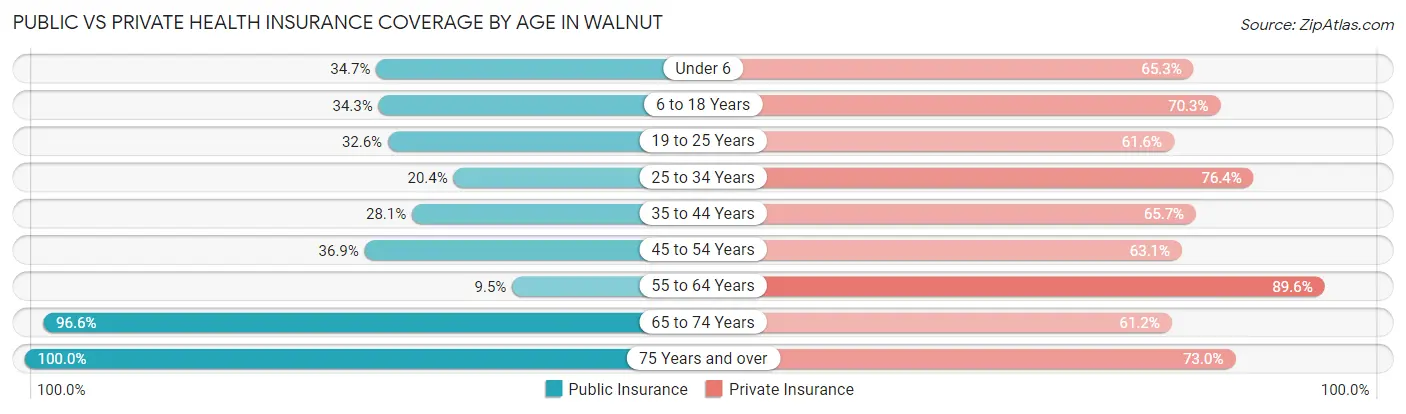
| Age Bracket | Public Insurance | Private Insurance |
| Under 6 | 25 (34.7%) | 47 (65.3%) |
| 6 to 18 Years | 83 (34.3%) | 170 (70.3%) |
| 19 to 25 Years | 28 (32.6%) | 53 (61.6%) |
| 25 to 34 Years | 32 (20.4%) | 120 (76.4%) |
| 35 to 44 Years | 50 (28.1%) | 117 (65.7%) |
| 45 to 54 Years | 38 (36.9%) | 65 (63.1%) |
| 55 to 64 Years | 21 (9.5%) | 198 (89.6%) |
| 65 to 74 Years | 112 (96.6%) | 71 (61.2%) |
| 75 Years and over | 126 (100.0%) | 92 (73.0%) |
| Total | 515 (39.6%) | 933 (71.7%) |
Disability Status by Sex by Age in Walnut
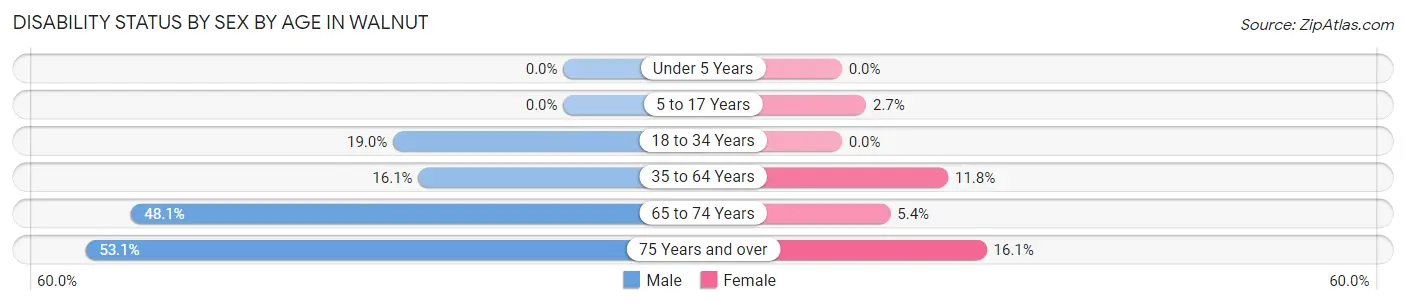
| Age Bracket | Male | Female |
| Under 5 Years | 0 (0.0%) | 0 (0.0%) |
| 5 to 17 Years | 0 (0.0%) | 3 (2.7%) |
| 18 to 34 Years | 22 (19.0%) | 0 (0.0%) |
| 35 to 64 Years | 36 (16.1%) | 33 (11.8%) |
| 65 to 74 Years | 38 (48.1%) | 2 (5.4%) |
| 75 Years and over | 34 (53.1%) | 10 (16.1%) |
Disability Class by Sex by Age in Walnut
Disability Class: Hearing Difficulty
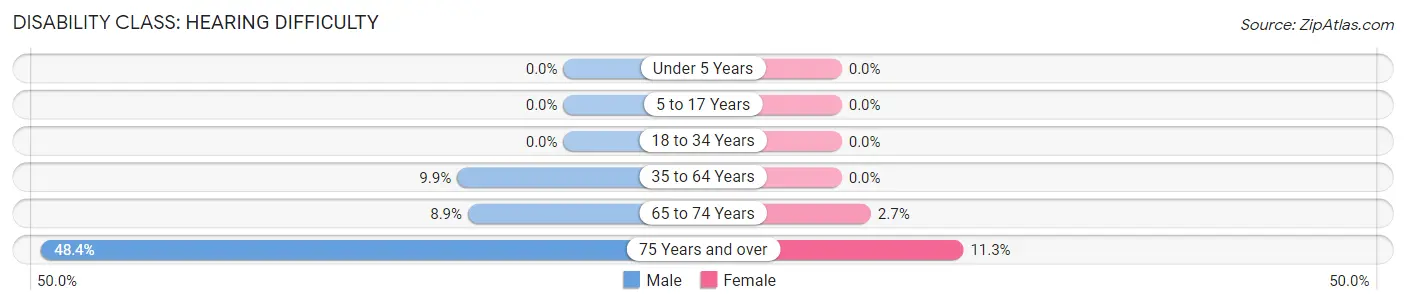
| Age Bracket | Male | Female |
| Under 5 Years | 0 (0.0%) | 0 (0.0%) |
| 5 to 17 Years | 0 (0.0%) | 0 (0.0%) |
| 18 to 34 Years | 0 (0.0%) | 0 (0.0%) |
| 35 to 64 Years | 22 (9.9%) | 0 (0.0%) |
| 65 to 74 Years | 7 (8.9%) | 1 (2.7%) |
| 75 Years and over | 31 (48.4%) | 7 (11.3%) |
Disability Class: Vision Difficulty
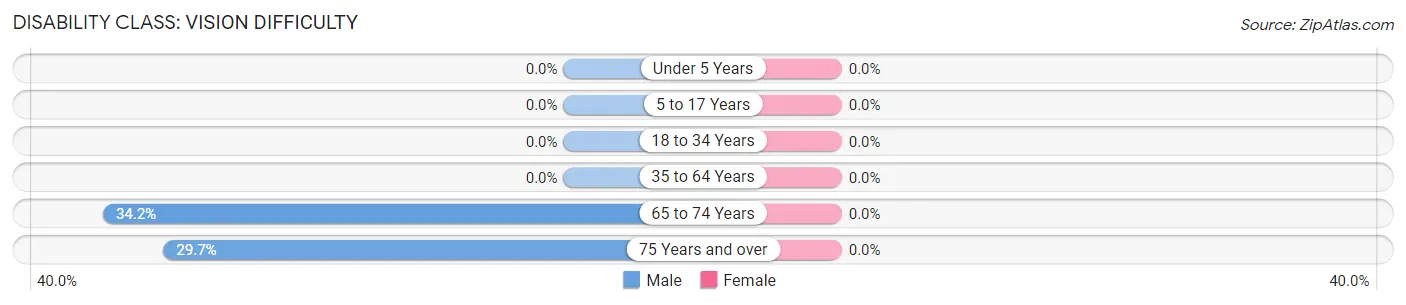
| Age Bracket | Male | Female |
| Under 5 Years | 0 (0.0%) | 0 (0.0%) |
| 5 to 17 Years | 0 (0.0%) | 0 (0.0%) |
| 18 to 34 Years | 0 (0.0%) | 0 (0.0%) |
| 35 to 64 Years | 0 (0.0%) | 0 (0.0%) |
| 65 to 74 Years | 27 (34.2%) | 0 (0.0%) |
| 75 Years and over | 19 (29.7%) | 0 (0.0%) |
Disability Class: Cognitive Difficulty
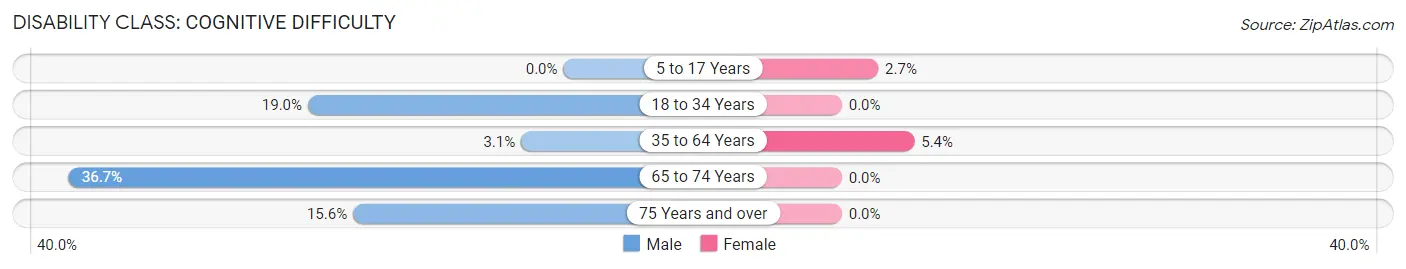
| Age Bracket | Male | Female |
| 5 to 17 Years | 0 (0.0%) | 3 (2.7%) |
| 18 to 34 Years | 22 (19.0%) | 0 (0.0%) |
| 35 to 64 Years | 7 (3.1%) | 15 (5.4%) |
| 65 to 74 Years | 29 (36.7%) | 0 (0.0%) |
| 75 Years and over | 10 (15.6%) | 0 (0.0%) |
Disability Class: Ambulatory Difficulty
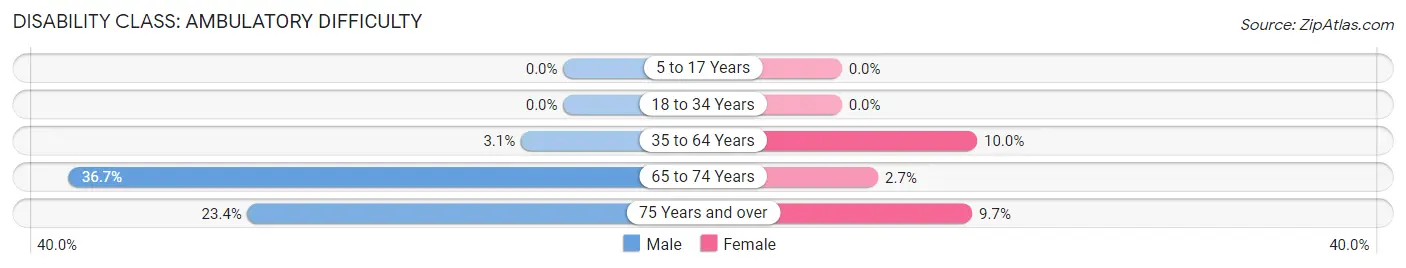
| Age Bracket | Male | Female |
| 5 to 17 Years | 0 (0.0%) | 0 (0.0%) |
| 18 to 34 Years | 0 (0.0%) | 0 (0.0%) |
| 35 to 64 Years | 7 (3.1%) | 28 (10.0%) |
| 65 to 74 Years | 29 (36.7%) | 1 (2.7%) |
| 75 Years and over | 15 (23.4%) | 6 (9.7%) |
Disability Class: Self-Care Difficulty
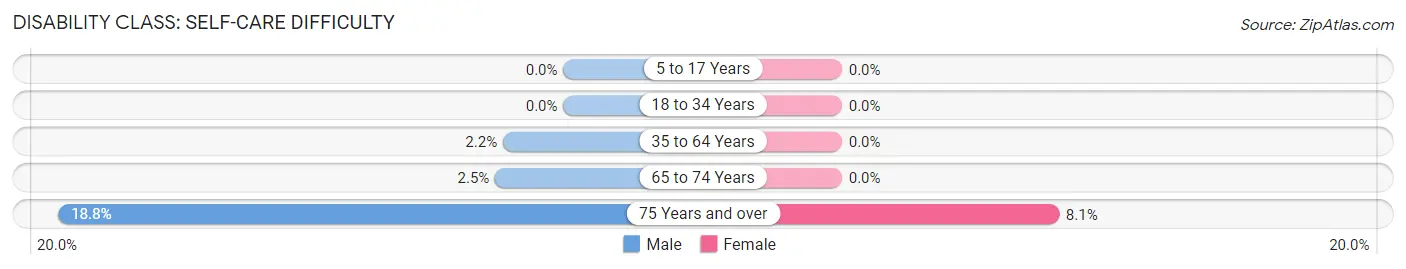
| Age Bracket | Male | Female |
| 5 to 17 Years | 0 (0.0%) | 0 (0.0%) |
| 18 to 34 Years | 0 (0.0%) | 0 (0.0%) |
| 35 to 64 Years | 5 (2.2%) | 0 (0.0%) |
| 65 to 74 Years | 2 (2.5%) | 0 (0.0%) |
| 75 Years and over | 12 (18.8%) | 5 (8.1%) |
Technology Access in Walnut
Computing Device Access in Walnut
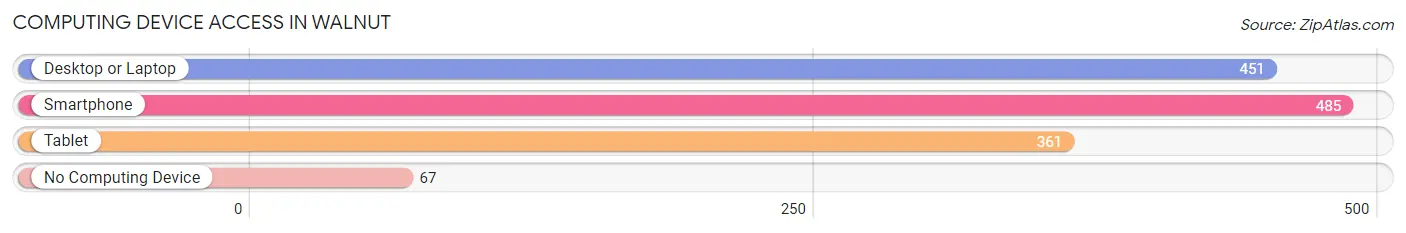
| Device Type | # Households | % Households |
| Desktop or Laptop | 451 | 77.4% |
| Smartphone | 485 | 83.2% |
| Tablet | 361 | 61.9% |
| No Computing Device | 67 | 11.5% |
| Total | 583 | 100.0% |
Internet Access in Walnut
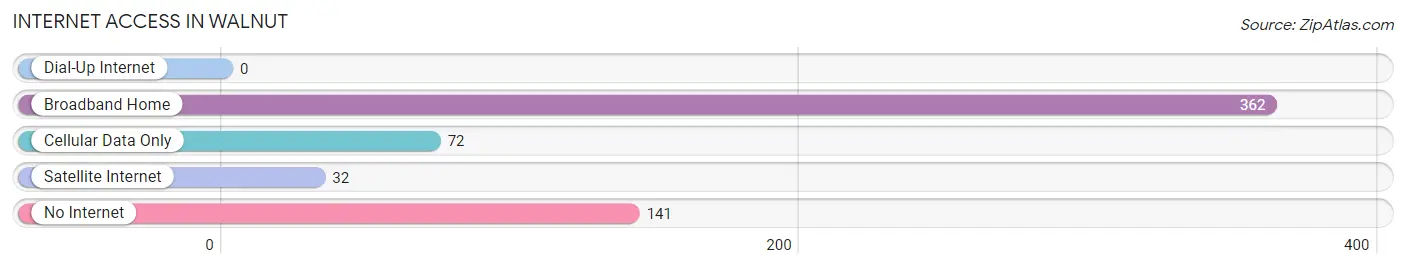
| Internet Type | # Households | % Households |
| Dial-Up Internet | 0 | 0.0% |
| Broadband Home | 362 | 62.1% |
| Cellular Data Only | 72 | 12.3% |
| Satellite Internet | 32 | 5.5% |
| No Internet | 141 | 24.2% |
| Total | 583 | 100.0% |
Walnut Summary
Walnut, Illinois is a small village located in Bureau County, Illinois. It is situated in the north-central part of the state, about 90 miles west of Chicago. The village has a population of approximately 1,000 people and covers an area of 0.6 square miles.
Walnut was founded in 1854 by a group of settlers from New York. The village was named after the walnut trees that grew in the area. The first post office was established in 1856 and the village was incorporated in 1872.
Walnut is located in the Illinois River Valley, which is part of the Midwest's Great Lakes region. The village is situated on the banks of the Illinois River, which provides a source of recreation and transportation. The village is surrounded by rolling hills and farmland, and is home to a variety of wildlife.
The economy of Walnut is largely based on agriculture. The village is home to several farms, which produce corn, soybeans, wheat, and other crops. The village also has a few small businesses, including a grocery store, a hardware store, and a few restaurants.
The population of Walnut is predominantly white, with a small percentage of African Americans and Hispanics. The median household income is around $45,000, and the median home value is around $90,000. The village has a low unemployment rate and a high rate of homeownership.
Walnut is served by the Walnut-LaMoille School District, which includes two elementary schools, a middle school, and a high school. The village also has a public library and a few churches.
Walnut is a small, rural village with a rich history and a strong sense of community. The village is home to a variety of wildlife and is surrounded by rolling hills and farmland. The village has a low unemployment rate and a high rate of homeownership, and is served by a strong school district. The village is a great place to live and work, and is a great place to raise a family.
Common Questions
What is Per Capita Income in Walnut?
Per Capita income in Walnut is $30,193.
What is the Median Family Income in Walnut?
Median Family Income in Walnut is $75,750.
What is the Median Household income in Walnut?
Median Household Income in Walnut is $55,515.
What is Income or Wage Gap in Walnut?
Income or Wage Gap in Walnut is 44.9%.
Women in Walnut earn 55.1 cents for every dollar earned by a man.
What is Inequality or Gini Index in Walnut?
Inequality or Gini Index in Walnut is 0.38.
What is the Total Population of Walnut?
Total Population of Walnut is 1,348.
What is the Total Male Population of Walnut?
Total Male Population of Walnut is 659.
What is the Total Female Population of Walnut?
Total Female Population of Walnut is 689.
What is the Ratio of Males per 100 Females in Walnut?
There are 95.65 Males per 100 Females in Walnut.
What is the Ratio of Females per 100 Males in Walnut?
There are 104.55 Females per 100 Males in Walnut.
What is the Median Population Age in Walnut?
Median Population Age in Walnut is 40.8 Years.
What is the Average Family Size in Walnut
Average Family Size in Walnut is 2.8 People.
What is the Average Household Size in Walnut
Average Household Size in Walnut is 2.2 People.
How Large is the Labor Force in Walnut?
There are 765 People in the Labor Forcein in Walnut.
What is the Percentage of People in the Labor Force in Walnut?
70.8% of People are in the Labor Force in Walnut.
What is the Unemployment Rate in Walnut?
Unemployment Rate in Walnut is 6.0%.