Virden, IL Map & Demographics
Virden Map
Virden Overview
$31,297
PER CAPITA INCOME
$87,617
AVG FAMILY INCOME
$70,292
AVG HOUSEHOLD INCOME
37.5%
WAGE / INCOME GAP [ % ]
62.5¢/ $1
WAGE / INCOME GAP [ $ ]
0.38
INEQUALITY / GINI INDEX
3,208
TOTAL POPULATION
1,357
MALE POPULATION
1,851
FEMALE POPULATION
73.31
MALES / 100 FEMALES
136.40
FEMALES / 100 MALES
39.3
MEDIAN AGE
3.2
AVG FAMILY SIZE
2.5
AVG HOUSEHOLD SIZE
1,536
LABOR FORCE [ PEOPLE ]
57.2%
PERCENT IN LABOR FORCE
6.9%
UNEMPLOYMENT RATE
Virden Zip Codes
Virden Area Codes
Income in Virden
Income Overview in Virden
Per Capita Income in Virden is $31,297, while median incomes of families and households are $87,617 and $70,292 respectively.
| Characteristic | Number | Measure |
| Per Capita Income | 3,208 | $31,297 |
| Median Family Income | 779 | $87,617 |
| Mean Family Income | 779 | $90,256 |
| Median Household Income | 1,249 | $70,292 |
| Mean Household Income | 1,249 | $75,867 |
| Income Deficit | 779 | $0 |
| Wage / Income Gap (%) | 3,208 | 37.49% |
| Wage / Income Gap ($) | 3,208 | 62.51¢ per $1 |
| Gini / Inequality Index | 3,208 | 0.38 |
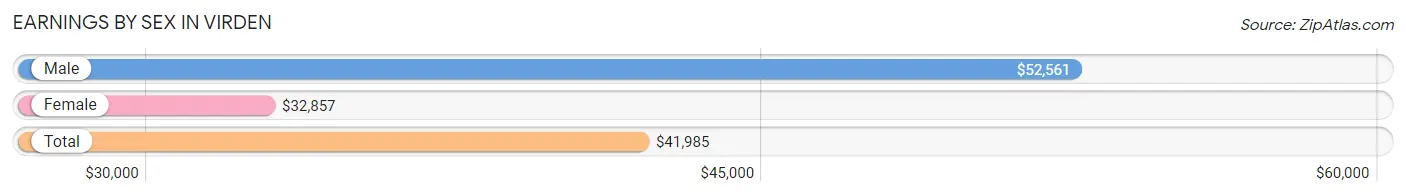
Earnings by Sex in Virden
Average Earnings in Virden are $41,985, $52,561 for men and $32,857 for women, a difference of 37.5%.
| Sex | Number | Average Earnings |
| Male | 776 (46.9%) | $52,561 |
| Female | 878 (53.1%) | $32,857 |
| Total | 1,654 (100.0%) | $41,985 |
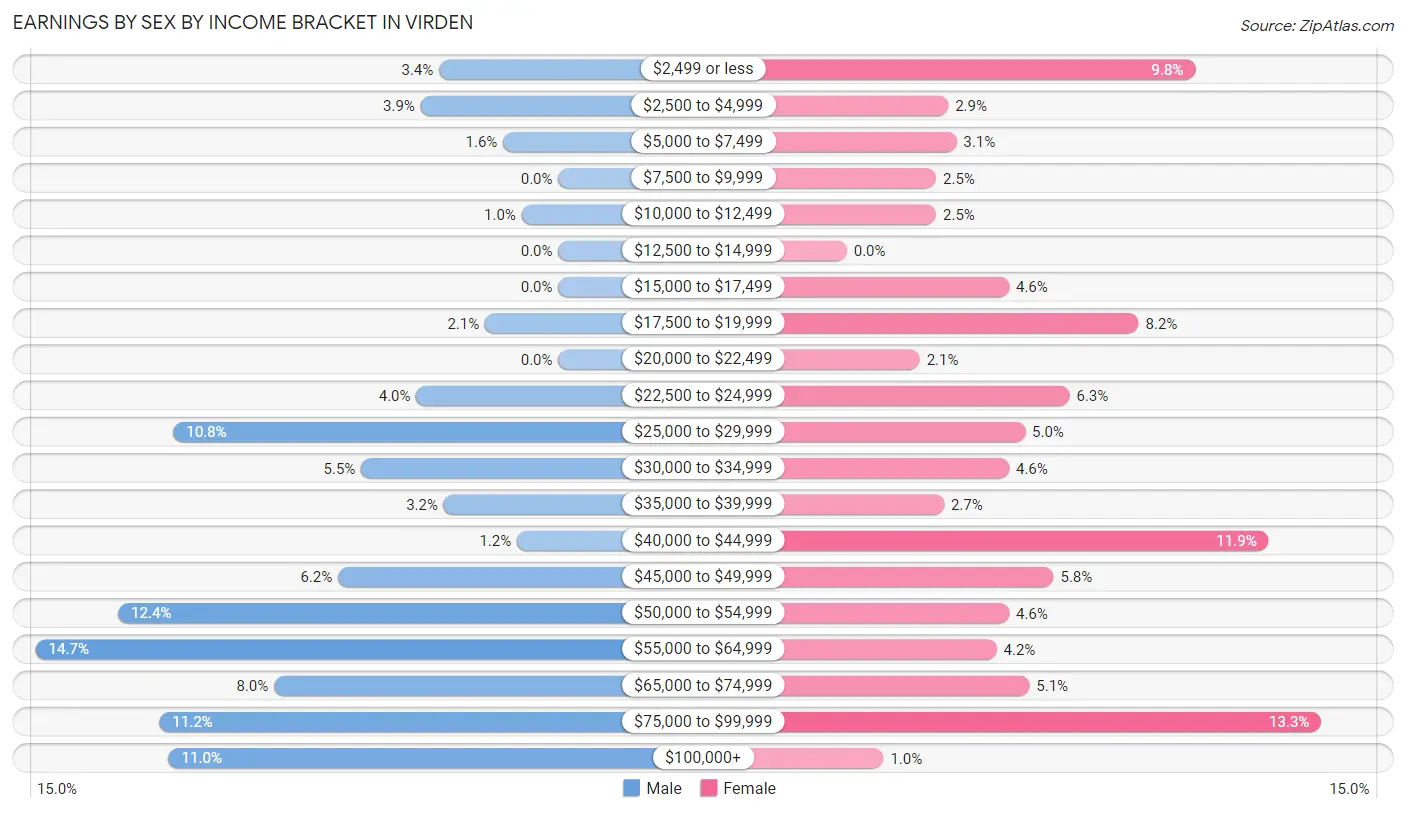
Earnings by Sex by Income Bracket in Virden
The most common earnings brackets in Virden are $55,000 to $64,999 for men (114 | 14.7%) and $75,000 to $99,999 for women (117 | 13.3%).
| Income | Male | Female |
| $2,499 or less | 26 (3.4%) | 86 (9.8%) |
| $2,500 to $4,999 | 30 (3.9%) | 25 (2.9%) |
| $5,000 to $7,499 | 12 (1.5%) | 27 (3.1%) |
| $7,500 to $9,999 | 0 (0.0%) | 22 (2.5%) |
| $10,000 to $12,499 | 8 (1.0%) | 22 (2.5%) |
| $12,500 to $14,999 | 0 (0.0%) | 0 (0.0%) |
| $15,000 to $17,499 | 0 (0.0%) | 40 (4.6%) |
| $17,500 to $19,999 | 16 (2.1%) | 72 (8.2%) |
| $20,000 to $22,499 | 0 (0.0%) | 18 (2.1%) |
| $22,500 to $24,999 | 31 (4.0%) | 55 (6.3%) |
| $25,000 to $29,999 | 84 (10.8%) | 44 (5.0%) |
| $30,000 to $34,999 | 43 (5.5%) | 40 (4.6%) |
| $35,000 to $39,999 | 25 (3.2%) | 24 (2.7%) |
| $40,000 to $44,999 | 9 (1.2%) | 104 (11.8%) |
| $45,000 to $49,999 | 48 (6.2%) | 51 (5.8%) |
| $50,000 to $54,999 | 96 (12.4%) | 40 (4.6%) |
| $55,000 to $64,999 | 114 (14.7%) | 37 (4.2%) |
| $65,000 to $74,999 | 62 (8.0%) | 45 (5.1%) |
| $75,000 to $99,999 | 87 (11.2%) | 117 (13.3%) |
| $100,000+ | 85 (11.0%) | 9 (1.0%) |
| Total | 776 (100.0%) | 878 (100.0%) |
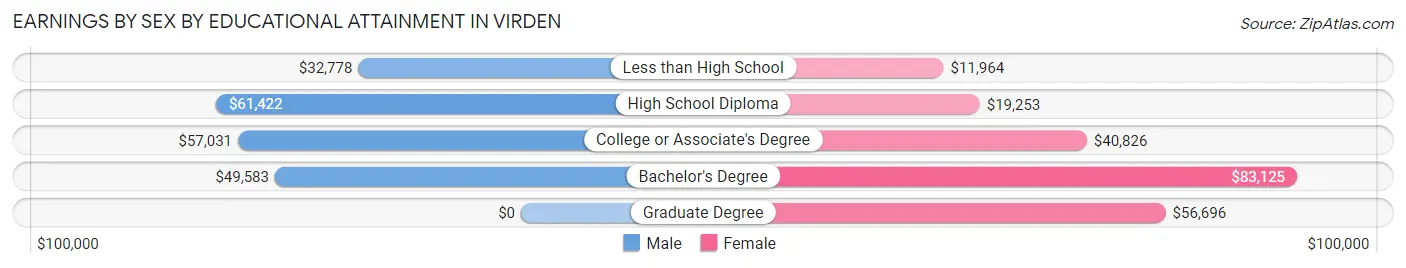
Earnings by Sex by Educational Attainment in Virden
Average earnings in Virden are $55,326 for men and $34,554 for women, a difference of 37.5%. Men with an educational attainment of high school diploma enjoy the highest average annual earnings of $61,422, while those with less than high school education earn the least with $32,778. Women with an educational attainment of bachelor's degree earn the most with the average annual earnings of $83,125, while those with less than high school education have the smallest earnings of $11,964.
| Educational Attainment | Male Income | Female Income |
| Less than High School | $32,778 | $11,964 |
| High School Diploma | $61,422 | $19,253 |
| College or Associate's Degree | $57,031 | $40,826 |
| Bachelor's Degree | $49,583 | $83,125 |
| Graduate Degree | - | - |
| Total | $55,326 | $34,554 |
Family Income in Virden
Family Income Brackets in Virden
According to the Virden family income data, there are 174 families falling into the $75,000 to $99,999 income range, which is the most common income bracket and makes up 22.3% of all families.
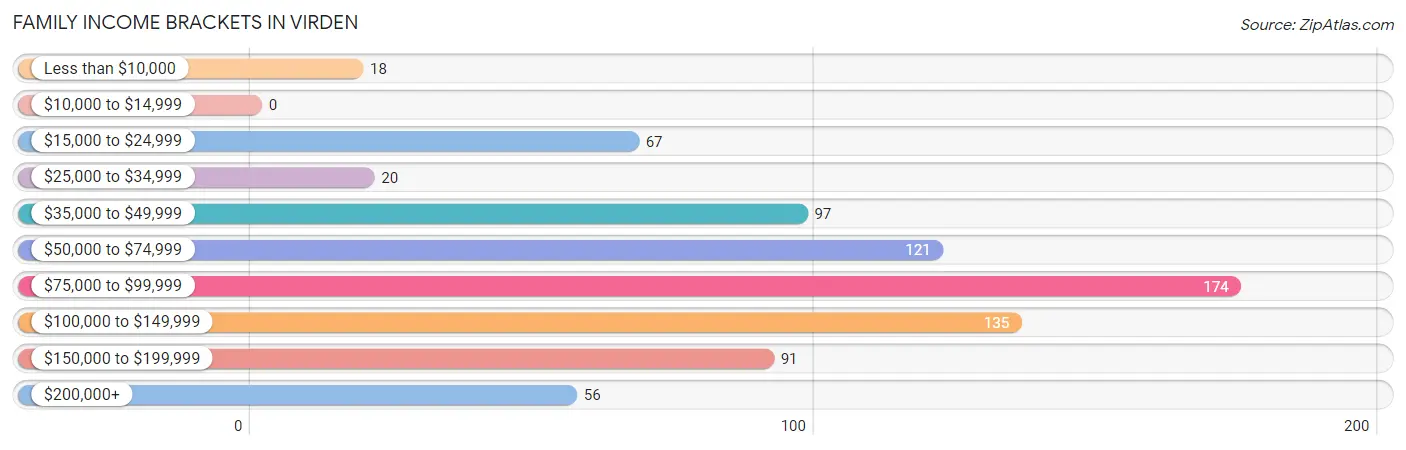
| Income Bracket | # Families | % Families |
| Less than $10,000 | 18 | 2.3% |
| $10,000 to $14,999 | 0 | 0.0% |
| $15,000 to $24,999 | 67 | 8.6% |
| $25,000 to $34,999 | 20 | 2.6% |
| $35,000 to $49,999 | 97 | 12.5% |
| $50,000 to $74,999 | 121 | 15.5% |
| $75,000 to $99,999 | 174 | 22.3% |
| $100,000 to $149,999 | 135 | 17.3% |
| $150,000 to $199,999 | 91 | 11.7% |
| $200,000+ | 56 | 7.2% |
Family Income by Famaliy Size in Virden
4-person families (71 | 9.1%) account for the highest median family income in Virden with $96,094 per family, while 2-person families (432 | 55.5%) have the highest median income of $31,875 per family member.
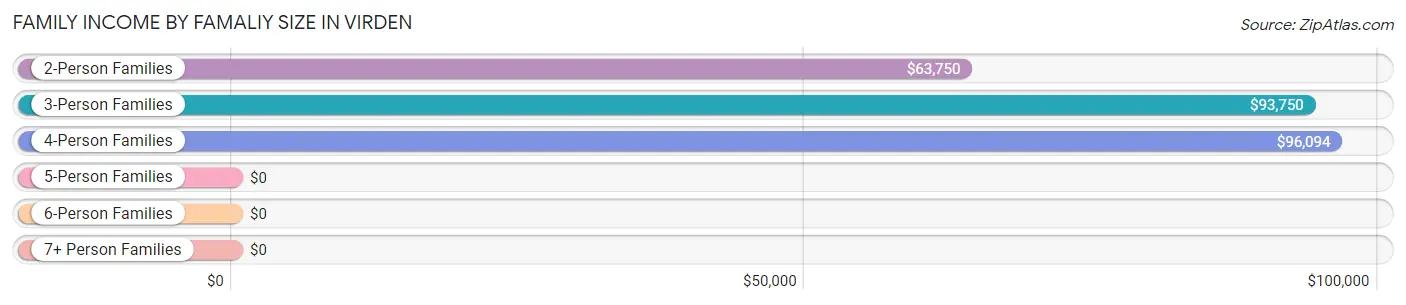
| Income Bracket | # Families | Median Income |
| 2-Person Families | 432 (55.5%) | $63,750 |
| 3-Person Families | 206 (26.4%) | $93,750 |
| 4-Person Families | 71 (9.1%) | $96,094 |
| 5-Person Families | 0 (0.0%) | $0 |
| 6-Person Families | 54 (6.9%) | $0 |
| 7+ Person Families | 16 (2.1%) | $0 |
| Total | 779 (100.0%) | $87,617 |
Family Income by Number of Earners in Virden
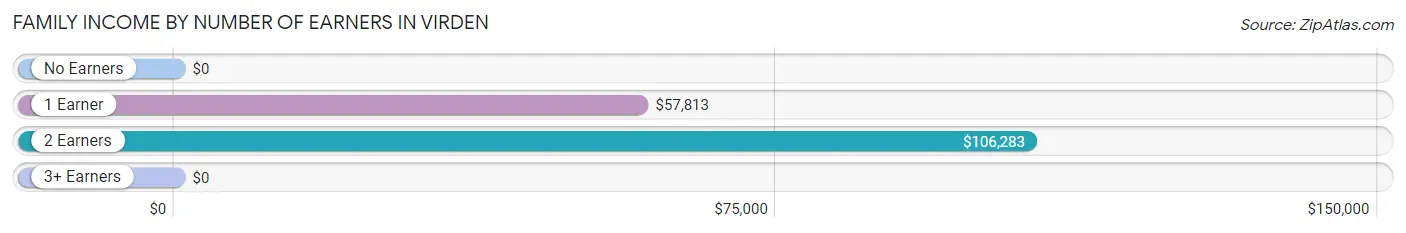
| Number of Earners | # Families | Median Income |
| No Earners | 150 (19.3%) | $0 |
| 1 Earner | 204 (26.2%) | $57,813 |
| 2 Earners | 387 (49.7%) | $106,283 |
| 3+ Earners | 38 (4.9%) | $0 |
| Total | 779 (100.0%) | $87,617 |
Household Income in Virden
Household Income Brackets in Virden
With 230 households falling in the category, the $75,000 to $99,999 income range is the most frequent in Virden, accounting for 18.4% of all households. In contrast, only 7 households (0.6%) fall into the $10,000 to $14,999 income bracket, making it the least populous group.
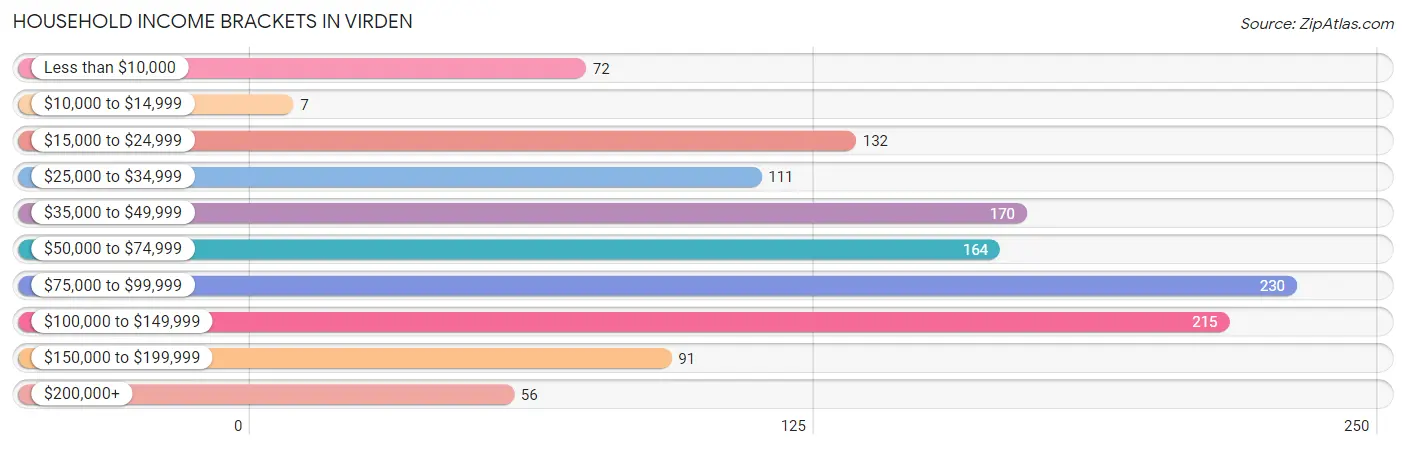
| Income Bracket | # Households | % Households |
| Less than $10,000 | 72 | 5.8% |
| $10,000 to $14,999 | 7 | 0.6% |
| $15,000 to $24,999 | 132 | 10.6% |
| $25,000 to $34,999 | 111 | 8.9% |
| $35,000 to $49,999 | 170 | 13.6% |
| $50,000 to $74,999 | 164 | 13.1% |
| $75,000 to $99,999 | 230 | 18.4% |
| $100,000 to $149,999 | 215 | 17.2% |
| $150,000 to $199,999 | 91 | 7.3% |
| $200,000+ | 56 | 4.5% |
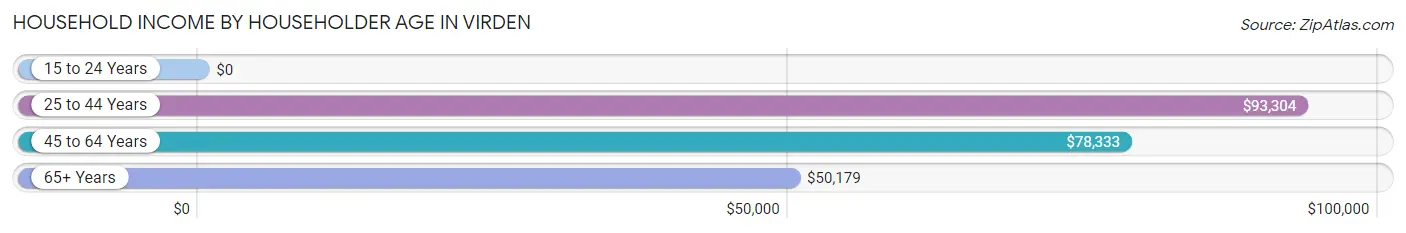
Household Income by Householder Age in Virden
The median household income in Virden is $70,292, with the highest median household income of $93,304 found in the 25 to 44 years age bracket for the primary householder. A total of 432 households (34.6%) fall into this category. Meanwhile, the 15 to 24 years age bracket for the primary householder has the lowest median household income of $0, with 32 households (2.6%) in this group.
| Income Bracket | # Households | Median Income |
| 15 to 24 Years | 32 (2.6%) | $0 |
| 25 to 44 Years | 432 (34.6%) | $93,304 |
| 45 to 64 Years | 494 (39.6%) | $78,333 |
| 65+ Years | 291 (23.3%) | $50,179 |
| Total | 1,249 (100.0%) | $70,292 |
Poverty in Virden
Income Below Poverty by Sex and Age in Virden
With 9.9% poverty level for males and 14.5% for females among the residents of Virden, 5 year old males and 55 to 64 year old females are the most vulnerable to poverty, with 14 males (42.4%) and 84 females (30.7%) in their respective age groups living below the poverty level.
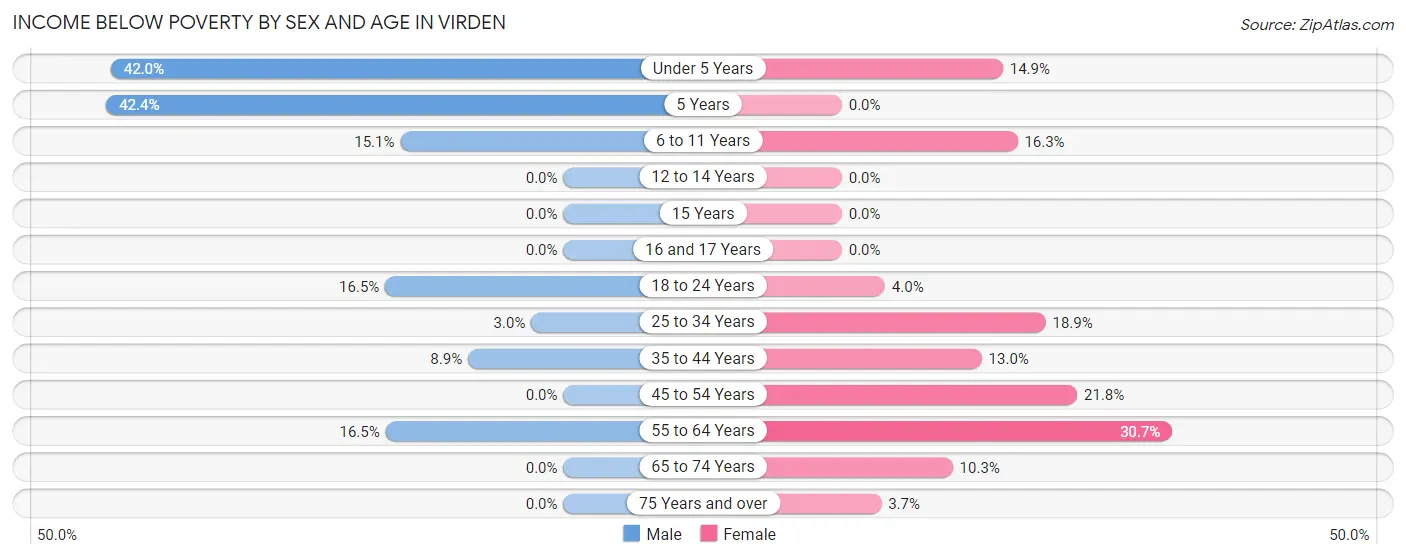
| Age Bracket | Male | Female |
| Under 5 Years | 21 (42.0%) | 13 (14.9%) |
| 5 Years | 14 (42.4%) | 0 (0.0%) |
| 6 to 11 Years | 18 (15.1%) | 15 (16.3%) |
| 12 to 14 Years | 0 (0.0%) | 0 (0.0%) |
| 15 Years | 0 (0.0%) | 0 (0.0%) |
| 16 and 17 Years | 0 (0.0%) | 0 (0.0%) |
| 18 to 24 Years | 22 (16.5%) | 4 (4.0%) |
| 25 to 34 Years | 5 (3.0%) | 45 (18.9%) |
| 35 to 44 Years | 20 (8.8%) | 34 (13.0%) |
| 45 to 54 Years | 0 (0.0%) | 38 (21.8%) |
| 55 to 64 Years | 33 (16.5%) | 84 (30.7%) |
| 65 to 74 Years | 0 (0.0%) | 25 (10.3%) |
| 75 Years and over | 0 (0.0%) | 3 (3.7%) |
| Total | 133 (9.9%) | 261 (14.5%) |
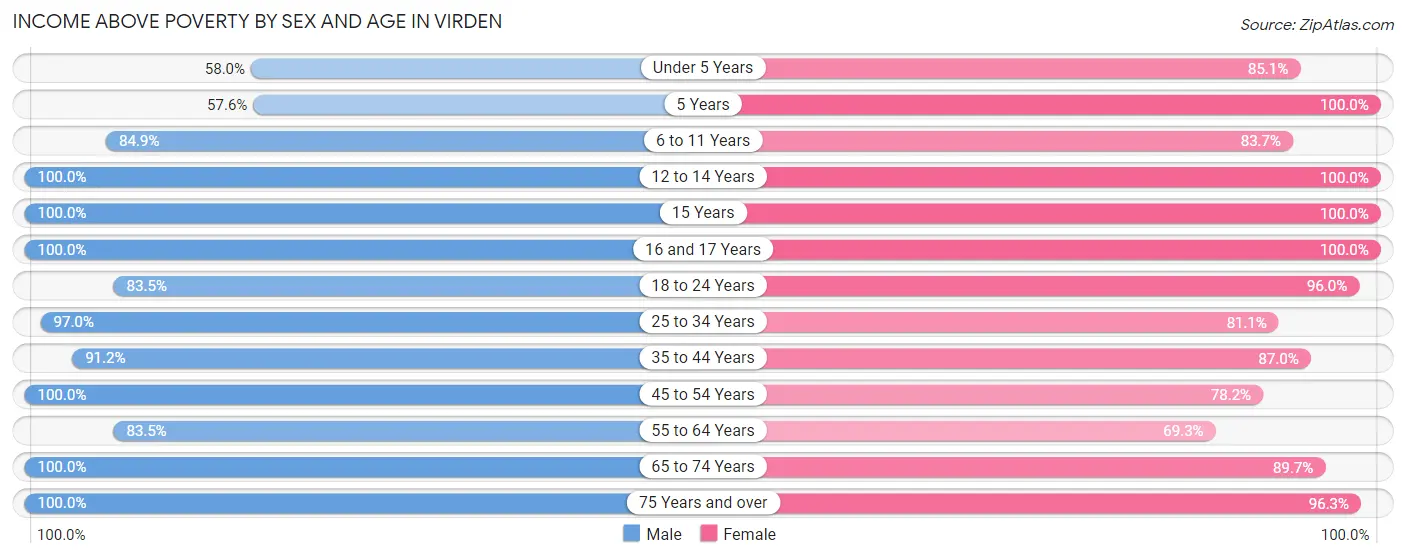
Income Above Poverty by Sex and Age in Virden
According to the poverty statistics in Virden, males aged 12 to 14 years and females aged 5 years are the age groups that are most secure financially, with 100.0% of males and 100.0% of females in these age groups living above the poverty line.
| Age Bracket | Male | Female |
| Under 5 Years | 29 (58.0%) | 74 (85.1%) |
| 5 Years | 19 (57.6%) | 23 (100.0%) |
| 6 to 11 Years | 101 (84.9%) | 77 (83.7%) |
| 12 to 14 Years | 32 (100.0%) | 34 (100.0%) |
| 15 Years | 26 (100.0%) | 26 (100.0%) |
| 16 and 17 Years | 48 (100.0%) | 160 (100.0%) |
| 18 to 24 Years | 111 (83.5%) | 96 (96.0%) |
| 25 to 34 Years | 163 (97.0%) | 193 (81.1%) |
| 35 to 44 Years | 206 (91.1%) | 228 (87.0%) |
| 45 to 54 Years | 143 (100.0%) | 136 (78.2%) |
| 55 to 64 Years | 167 (83.5%) | 190 (69.3%) |
| 65 to 74 Years | 102 (100.0%) | 218 (89.7%) |
| 75 Years and over | 67 (100.0%) | 79 (96.3%) |
| Total | 1,214 (90.1%) | 1,534 (85.5%) |
Income Below Poverty Among Married-Couple Families in Virden
The poverty statistics for married-couple families in Virden show that 1.8% or 10 of the total 542 families live below the poverty line. Families with no children have the highest poverty rate of 3.2%, comprising of 10 families. On the other hand, families with 1 or 2 children have the lowest poverty rate of 0.0%, which includes 0 families.
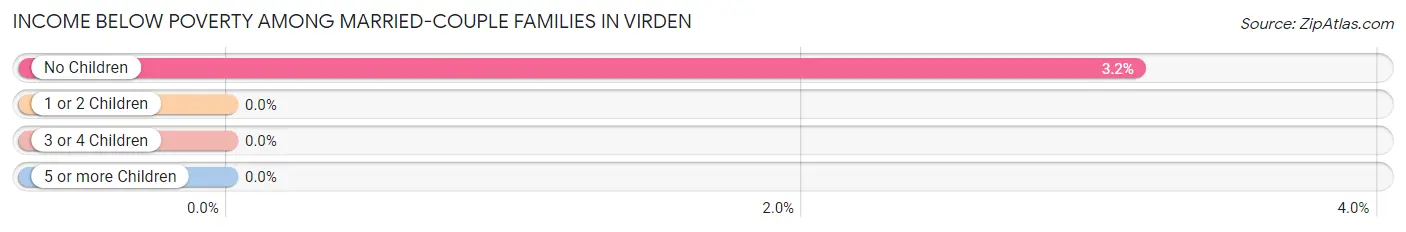
| Children | Above Poverty | Below Poverty |
| No Children | 306 (96.8%) | 10 (3.2%) |
| 1 or 2 Children | 180 (100.0%) | 0 (0.0%) |
| 3 or 4 Children | 30 (100.0%) | 0 (0.0%) |
| 5 or more Children | 16 (100.0%) | 0 (0.0%) |
| Total | 532 (98.2%) | 10 (1.8%) |
Income Below Poverty Among Single-Parent Households in Virden
According to the poverty data in Virden, 15.1% or 5 single-father households and 22.6% or 46 single-mother households are living below the poverty line. Among single-father households, those with 1 or 2 children have the highest poverty rate, with 5 households (41.7%) experiencing poverty. Likewise, among single-mother households, those with 1 or 2 children have the highest poverty rate, with 46 households (26.3%) falling below the poverty line.
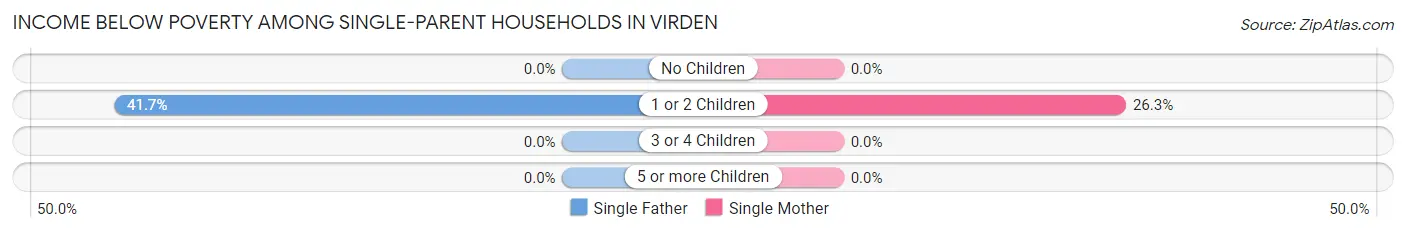
| Children | Single Father | Single Mother |
| No Children | 0 (0.0%) | 0 (0.0%) |
| 1 or 2 Children | 5 (41.7%) | 46 (26.3%) |
| 3 or 4 Children | 0 (0.0%) | 0 (0.0%) |
| 5 or more Children | 0 (0.0%) | 0 (0.0%) |
| Total | 5 (15.1%) | 46 (22.6%) |
Income Below Poverty Among Married-Couple vs Single-Parent Households in Virden
The poverty data for Virden shows that 10 of the married-couple family households (1.8%) and 51 of the single-parent households (21.5%) are living below the poverty level. Within the married-couple family households, those with no children have the highest poverty rate, with 10 households (3.2%) falling below the poverty line. Among the single-parent households, those with 1 or 2 children have the highest poverty rate, with 51 household (27.3%) living below poverty.
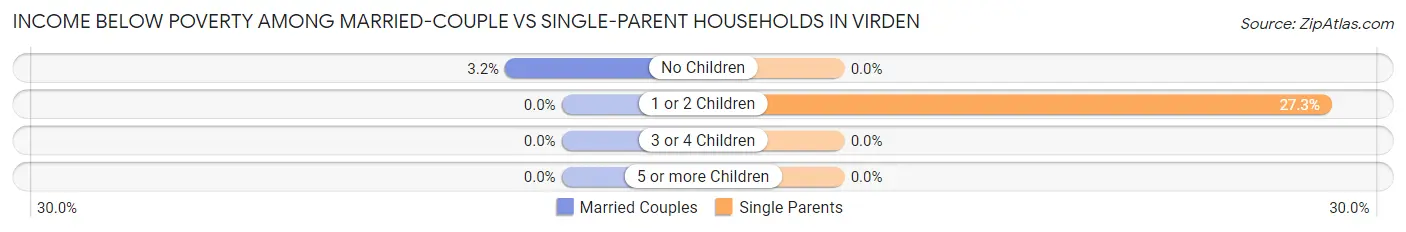
| Children | Married-Couple Families | Single-Parent Households |
| No Children | 10 (3.2%) | 0 (0.0%) |
| 1 or 2 Children | 0 (0.0%) | 51 (27.3%) |
| 3 or 4 Children | 0 (0.0%) | 0 (0.0%) |
| 5 or more Children | 0 (0.0%) | 0 (0.0%) |
| Total | 10 (1.8%) | 51 (21.5%) |
Race in Virden
The most populous races in Virden are White / Caucasian (3,184 | 99.3%), Asian (19 | 0.6%), and Two or more Races (5 | 0.2%).
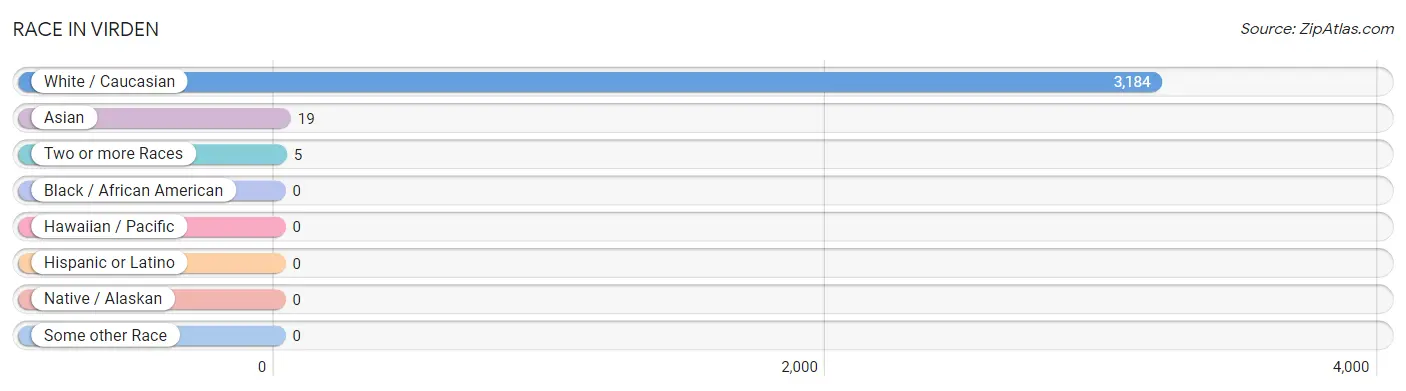
| Race | # Population | % Population |
| Asian | 19 | 0.6% |
| Black / African American | 0 | 0.0% |
| Hawaiian / Pacific | 0 | 0.0% |
| Hispanic or Latino | 0 | 0.0% |
| Native / Alaskan | 0 | 0.0% |
| White / Caucasian | 3,184 | 99.3% |
| Two or more Races | 5 | 0.2% |
| Some other Race | 0 | 0.0% |
| Total | 3,208 | 100.0% |
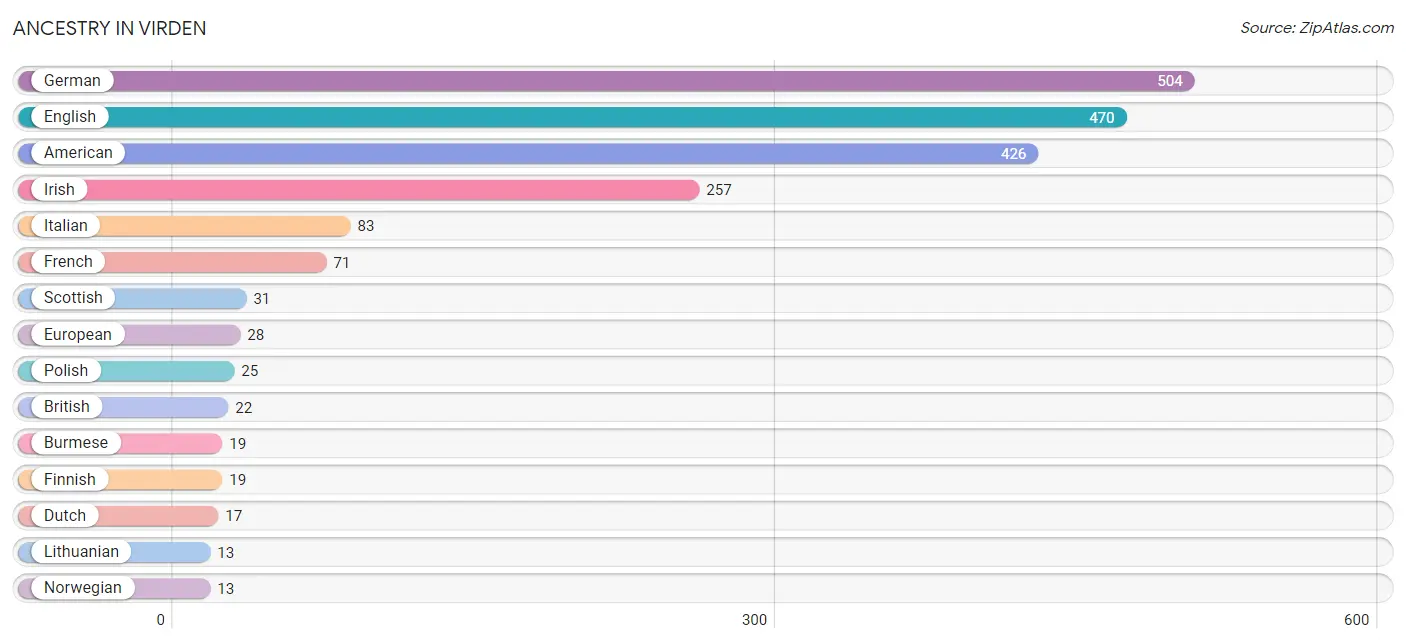
Ancestry in Virden
The most populous ancestries reported in Virden are German (504 | 15.7%), English (470 | 14.6%), American (426 | 13.3%), Irish (257 | 8.0%), and Italian (83 | 2.6%), together accounting for 54.2% of all Virden residents.
| Ancestry | # Population | % Population |
| American | 426 | 13.3% |
| Austrian | 7 | 0.2% |
| Belgian | 8 | 0.3% |
| British | 22 | 0.7% |
| Burmese | 19 | 0.6% |
| Croatian | 5 | 0.2% |
| Dutch | 17 | 0.5% |
| English | 470 | 14.6% |
| European | 28 | 0.9% |
| Finnish | 19 | 0.6% |
| French | 71 | 2.2% |
| German | 504 | 15.7% |
| Hungarian | 7 | 0.2% |
| Irish | 257 | 8.0% |
| Italian | 83 | 2.6% |
| Lithuanian | 13 | 0.4% |
| Norwegian | 13 | 0.4% |
| Polish | 25 | 0.8% |
| Portuguese | 8 | 0.3% |
| Scottish | 31 | 1.0% |
| Ukrainian | 7 | 0.2% |
| Welsh | 5 | 0.2% | View All 22 Rows |
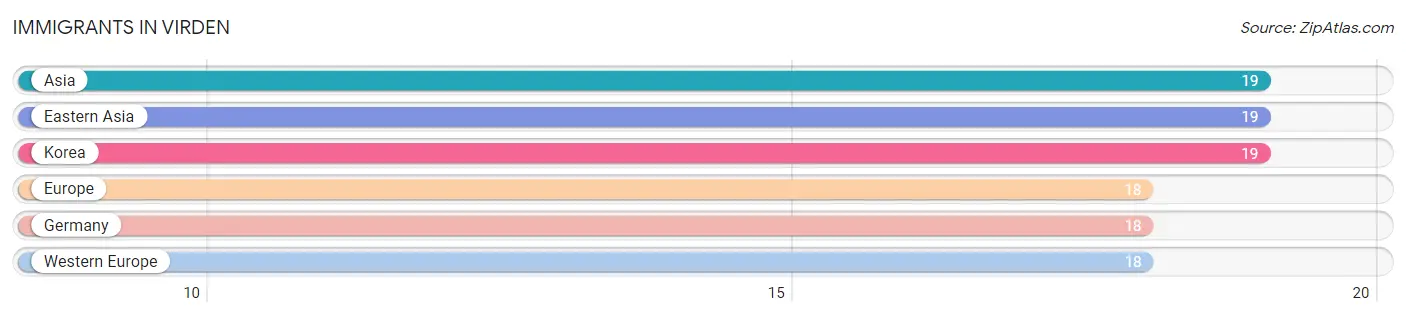
Immigrants in Virden
The most numerous immigrant groups reported in Virden came from Asia (19 | 0.6%), Eastern Asia (19 | 0.6%), Korea (19 | 0.6%), Europe (18 | 0.6%), and Germany (18 | 0.6%), together accounting for 2.9% of all Virden residents.
| Immigration Origin | # Population | % Population |
| Asia | 19 | 0.6% |
| Eastern Asia | 19 | 0.6% |
| Europe | 18 | 0.6% |
| Germany | 18 | 0.6% |
| Korea | 19 | 0.6% |
| Western Europe | 18 | 0.6% | View All 6 Rows |
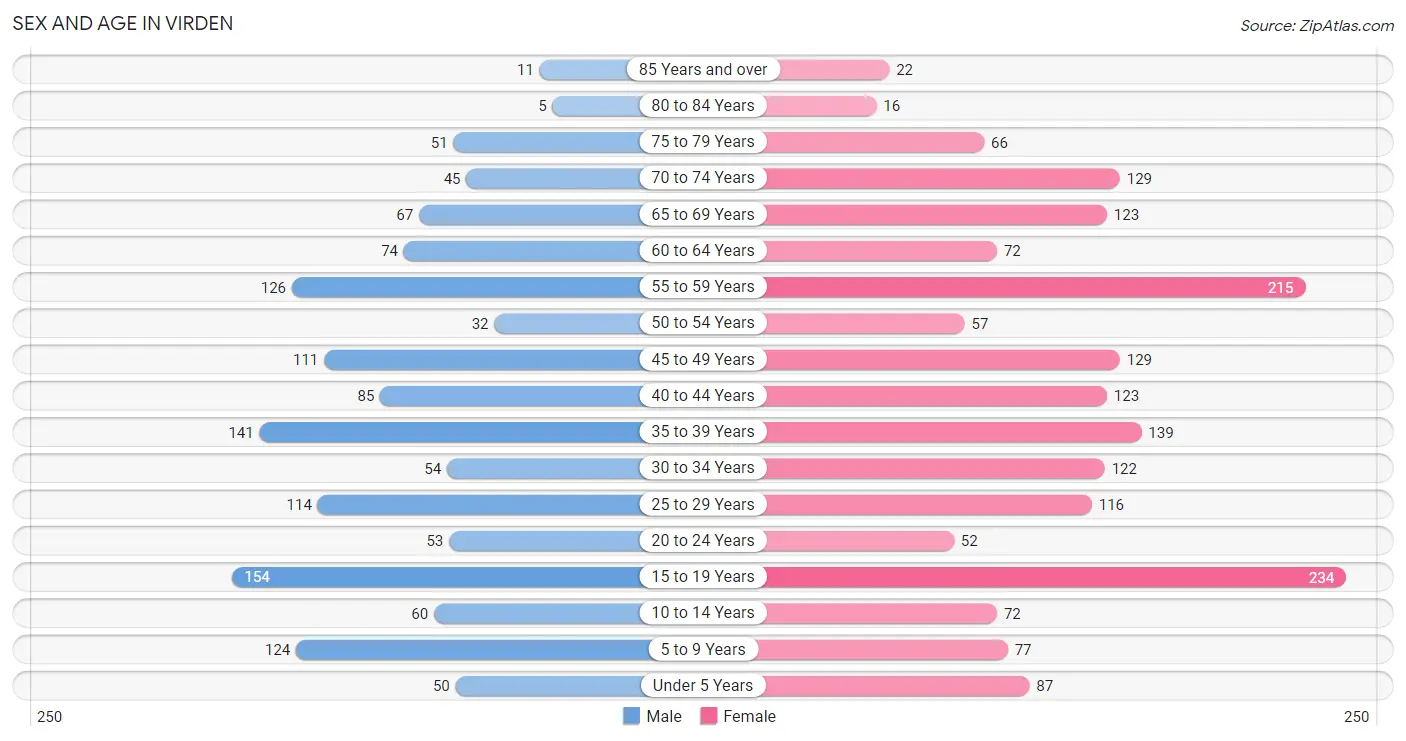
Sex and Age in Virden
Sex and Age in Virden
The most populous age groups in Virden are 15 to 19 Years (154 | 11.4%) for men and 15 to 19 Years (234 | 12.6%) for women.
| Age Bracket | Male | Female |
| Under 5 Years | 50 (3.7%) | 87 (4.7%) |
| 5 to 9 Years | 124 (9.1%) | 77 (4.2%) |
| 10 to 14 Years | 60 (4.4%) | 72 (3.9%) |
| 15 to 19 Years | 154 (11.4%) | 234 (12.6%) |
| 20 to 24 Years | 53 (3.9%) | 52 (2.8%) |
| 25 to 29 Years | 114 (8.4%) | 116 (6.3%) |
| 30 to 34 Years | 54 (4.0%) | 122 (6.6%) |
| 35 to 39 Years | 141 (10.4%) | 139 (7.5%) |
| 40 to 44 Years | 85 (6.3%) | 123 (6.7%) |
| 45 to 49 Years | 111 (8.2%) | 129 (7.0%) |
| 50 to 54 Years | 32 (2.4%) | 57 (3.1%) |
| 55 to 59 Years | 126 (9.3%) | 215 (11.6%) |
| 60 to 64 Years | 74 (5.4%) | 72 (3.9%) |
| 65 to 69 Years | 67 (4.9%) | 123 (6.7%) |
| 70 to 74 Years | 45 (3.3%) | 129 (7.0%) |
| 75 to 79 Years | 51 (3.8%) | 66 (3.6%) |
| 80 to 84 Years | 5 (0.4%) | 16 (0.9%) |
| 85 Years and over | 11 (0.8%) | 22 (1.2%) |
| Total | 1,357 (100.0%) | 1,851 (100.0%) |
Families and Households in Virden
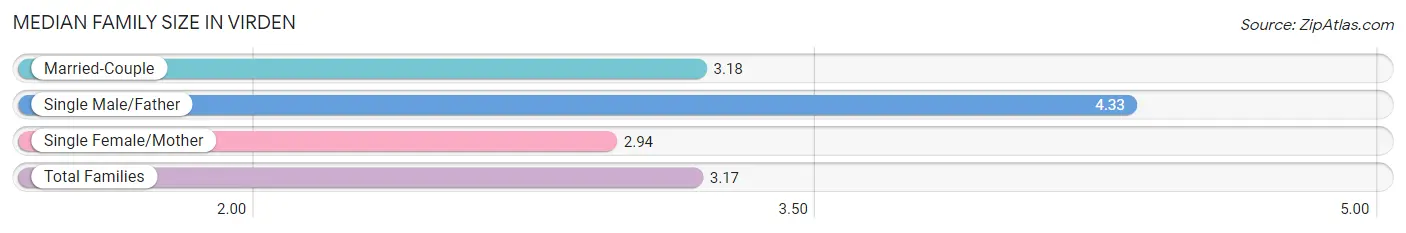
Median Family Size in Virden
The median family size in Virden is 3.17 persons per family, with single male/father families (33 | 4.2%) accounting for the largest median family size of 4.33 persons per family. On the other hand, single female/mother families (204 | 26.2%) represent the smallest median family size with 2.94 persons per family.
| Family Type | # Families | Family Size |
| Married-Couple | 542 (69.6%) | 3.18 |
| Single Male/Father | 33 (4.2%) | 4.33 |
| Single Female/Mother | 204 (26.2%) | 2.94 |
| Total Families | 779 (100.0%) | 3.17 |
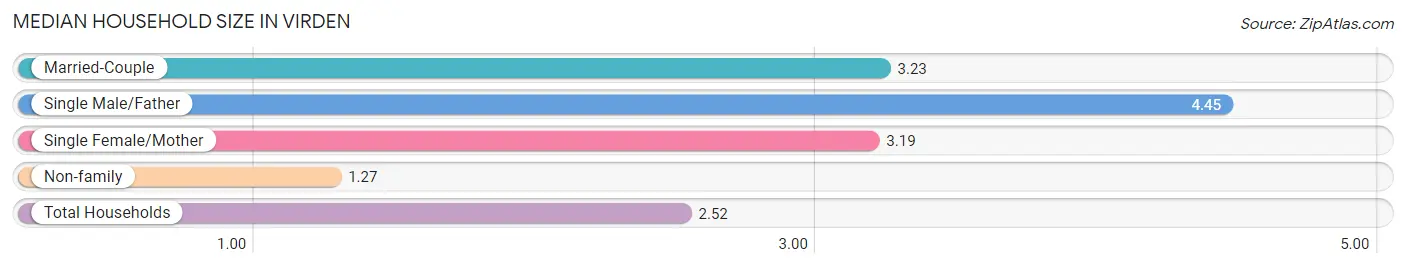
Median Household Size in Virden
The median household size in Virden is 2.52 persons per household, with single male/father households (33 | 2.6%) accounting for the largest median household size of 4.45 persons per household. non-family households (470 | 37.6%) represent the smallest median household size with 1.27 persons per household.
| Household Type | # Households | Household Size |
| Married-Couple | 542 (43.4%) | 3.23 |
| Single Male/Father | 33 (2.6%) | 4.45 |
| Single Female/Mother | 204 (16.3%) | 3.19 |
| Non-family | 470 (37.6%) | 1.27 |
| Total Households | 1,249 (100.0%) | 2.52 |
Household Size by Marriage Status in Virden
Out of a total of 1,249 households in Virden, 779 (62.4%) are family households, while 470 (37.6%) are nonfamily households. The most numerous type of family households are 2-person households, comprising 351, and the most common type of nonfamily households are 1-person households, comprising 351.
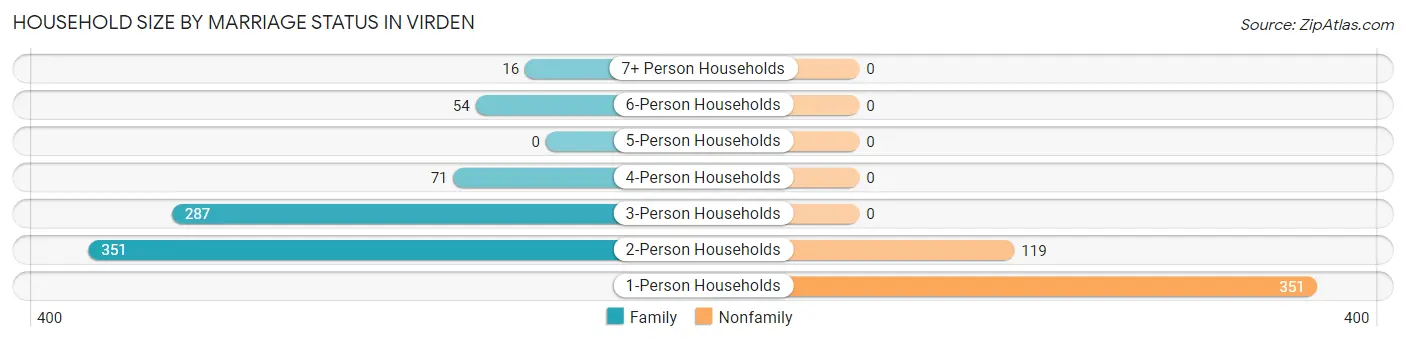
| Household Size | Family Households | Nonfamily Households |
| 1-Person Households | - | 351 (28.1%) |
| 2-Person Households | 351 (28.1%) | 119 (9.5%) |
| 3-Person Households | 287 (23.0%) | 0 (0.0%) |
| 4-Person Households | 71 (5.7%) | 0 (0.0%) |
| 5-Person Households | 0 (0.0%) | 0 (0.0%) |
| 6-Person Households | 54 (4.3%) | 0 (0.0%) |
| 7+ Person Households | 16 (1.3%) | 0 (0.0%) |
| Total | 779 (62.4%) | 470 (37.6%) |
Female Fertility in Virden
Fertility by Age in Virden
Average fertility rate in Virden is 55.0 births per 1,000 women. Women in the age bracket of 20 to 34 years have the highest fertility rate with 155.0 births per 1,000 women. Women in the age bracket of 20 to 34 years acount for 86.5% of all women with births.
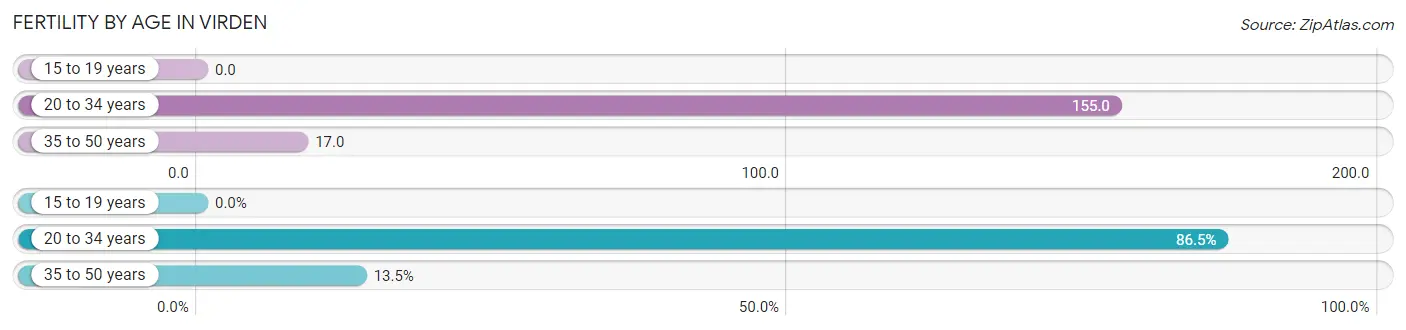
| Age Bracket | Women with Births | Births / 1,000 Women |
| 15 to 19 years | 0 (0.0%) | 0.0 |
| 20 to 34 years | 45 (86.5%) | 155.0 |
| 35 to 50 years | 7 (13.5%) | 17.0 |
| Total | 52 (100.0%) | 55.0 |
Fertility by Age by Marriage Status in Virden
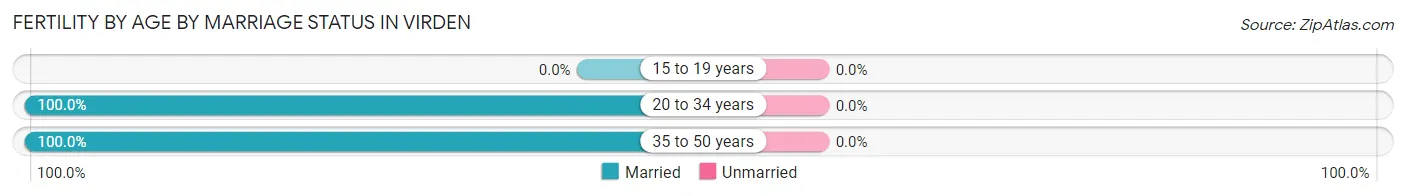
| Age Bracket | Married | Unmarried |
| 15 to 19 years | 0 (0.0%) | 0 (0.0%) |
| 20 to 34 years | 45 (100.0%) | 0 (0.0%) |
| 35 to 50 years | 7 (100.0%) | 0 (0.0%) |
| Total | 52 (100.0%) | 0 (0.0%) |
Fertility by Education in Virden
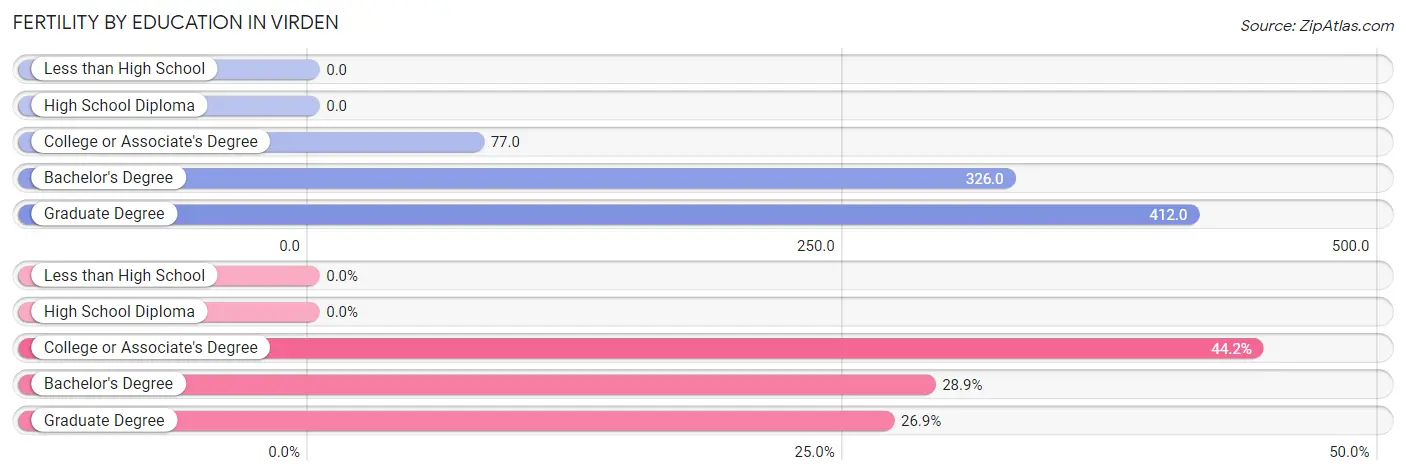
| Educational Attainment | Women with Births | Births / 1,000 Women |
| Less than High School | 0 (0.0%) | 0.0 |
| High School Diploma | 0 (0.0%) | 0.0 |
| College or Associate's Degree | 23 (44.2%) | 77.0 |
| Bachelor's Degree | 15 (28.8%) | 326.0 |
| Graduate Degree | 14 (26.9%) | 412.0 |
| Total | 52 (100.0%) | 55.0 |
Fertility by Education by Marriage Status in Virden
| Educational Attainment | Married | Unmarried |
| Less than High School | 0 (0.0%) | 0 (0.0%) |
| High School Diploma | 0 (0.0%) | 0 (0.0%) |
| College or Associate's Degree | 23 (100.0%) | 0 (0.0%) |
| Bachelor's Degree | 15 (100.0%) | 0 (0.0%) |
| Graduate Degree | 14 (100.0%) | 0 (0.0%) |
| Total | 52 (100.0%) | 0 (0.0%) |
Employment Characteristics in Virden
Employment by Class of Employer in Virden
Among the 1,368 employed individuals in Virden, private company employees (1,090 | 79.7%), state government employees (105 | 7.7%), and not-for-profit organizations (71 | 5.2%) make up the most common classes of employment.
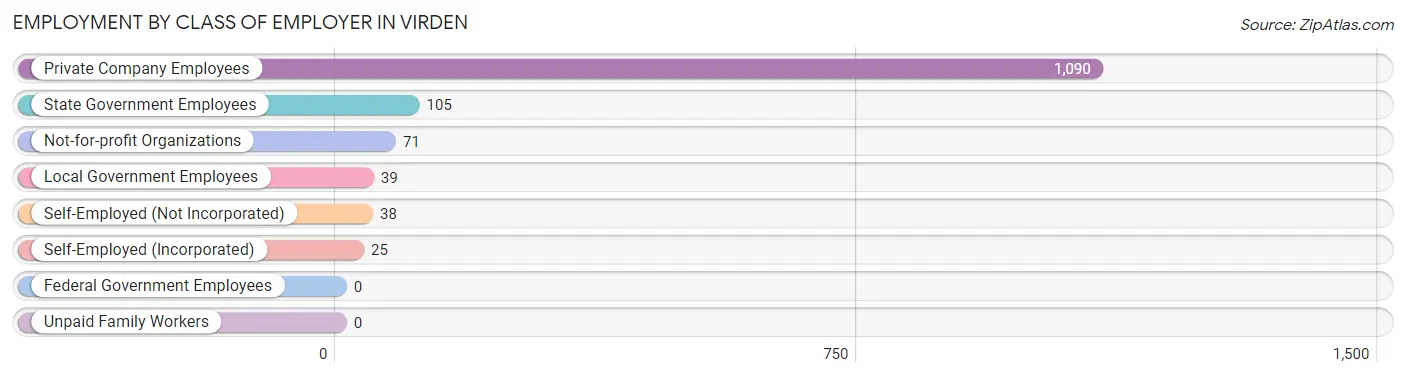
| Employer Class | # Employees | % Employees |
| Private Company Employees | 1,090 | 79.7% |
| Self-Employed (Incorporated) | 25 | 1.8% |
| Self-Employed (Not Incorporated) | 38 | 2.8% |
| Not-for-profit Organizations | 71 | 5.2% |
| Local Government Employees | 39 | 2.9% |
| State Government Employees | 105 | 7.7% |
| Federal Government Employees | 0 | 0.0% |
| Unpaid Family Workers | 0 | 0.0% |
| Total | 1,368 | 100.0% |
Employment Status by Age in Virden
According to the labor force statistics for Virden, out of the total population over 16 years of age (2,686), 57.2% or 1,536 individuals are in the labor force, with 6.9% or 106 of them unemployed. The age group with the highest labor force participation rate is 20 to 24 years, with 99.0% or 104 individuals in the labor force. Within the labor force, the 45 to 54 years age range has the highest percentage of unemployed individuals, with 10.6% or 32 of them being unemployed.
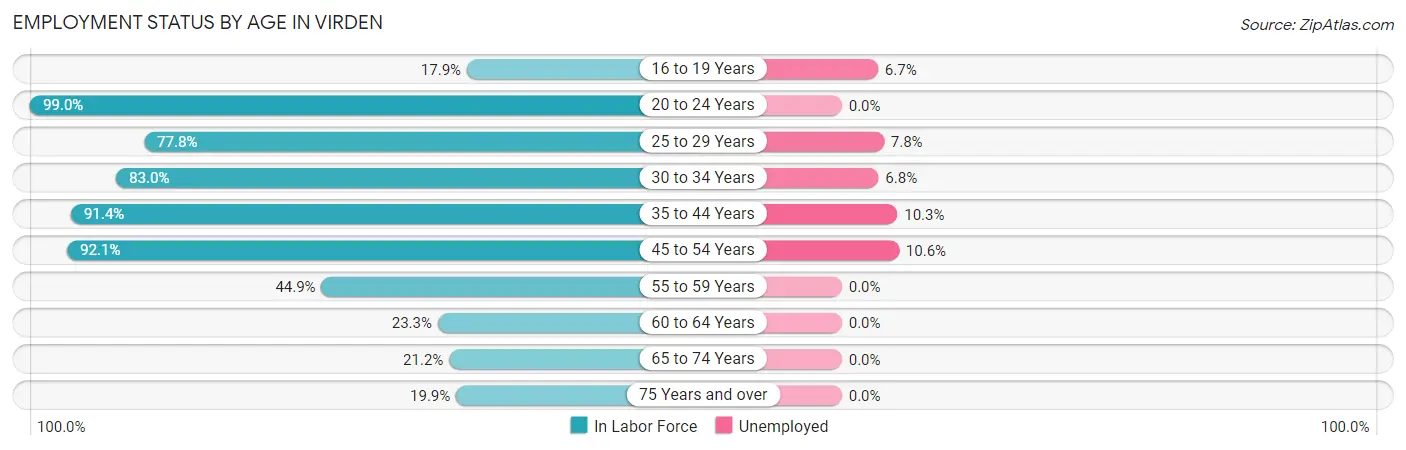
| Age Bracket | In Labor Force | Unemployed |
| 16 to 19 Years | 60 (17.9%) | 4 (6.7%) |
| 20 to 24 Years | 104 (99.0%) | 0 (0.0%) |
| 25 to 29 Years | 179 (77.8%) | 14 (7.8%) |
| 30 to 34 Years | 146 (83.0%) | 10 (6.8%) |
| 35 to 44 Years | 446 (91.4%) | 46 (10.3%) |
| 45 to 54 Years | 303 (92.1%) | 32 (10.6%) |
| 55 to 59 Years | 153 (44.9%) | 0 (0.0%) |
| 60 to 64 Years | 34 (23.3%) | 0 (0.0%) |
| 65 to 74 Years | 77 (21.2%) | 0 (0.0%) |
| 75 Years and over | 34 (19.9%) | 0 (0.0%) |
| Total | 1,536 (57.2%) | 106 (6.9%) |
Employment Status by Educational Attainment in Virden
According to labor force statistics for Virden, 73.7% of individuals (1,260) out of the total population between 25 and 64 years of age (1,710) are in the labor force, with 8.1% or 102 of them being unemployed. The group with the highest labor force participation rate are those with the educational attainment of college / associate degree, with 76.8% or 487 individuals in the labor force. Within the labor force, individuals with high school diploma education have the highest percentage of unemployment, with 9.6% or 56 of them being unemployed.
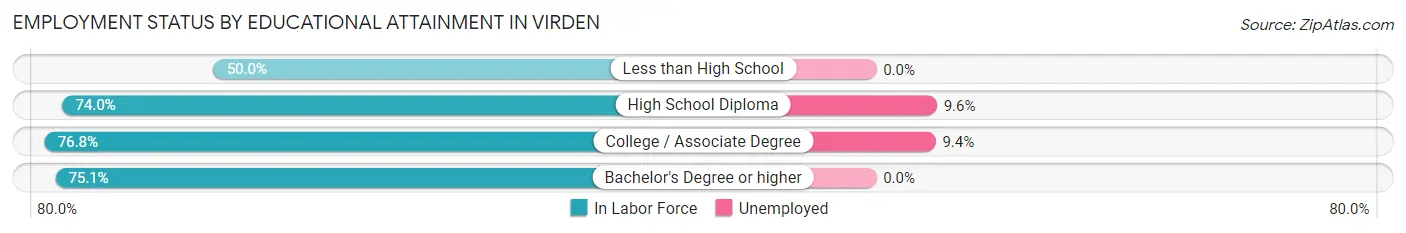
| Educational Attainment | In Labor Force | Unemployed |
| Less than High School | 51 (50.0%) | 0 (0.0%) |
| High School Diploma | 581 (74.0%) | 75 (9.6%) |
| College / Associate Degree | 487 (76.8%) | 60 (9.4%) |
| Bachelor's Degree or higher | 142 (75.1%) | 0 (0.0%) |
| Total | 1,260 (73.7%) | 139 (8.1%) |
Employment Occupations by Sex in Virden
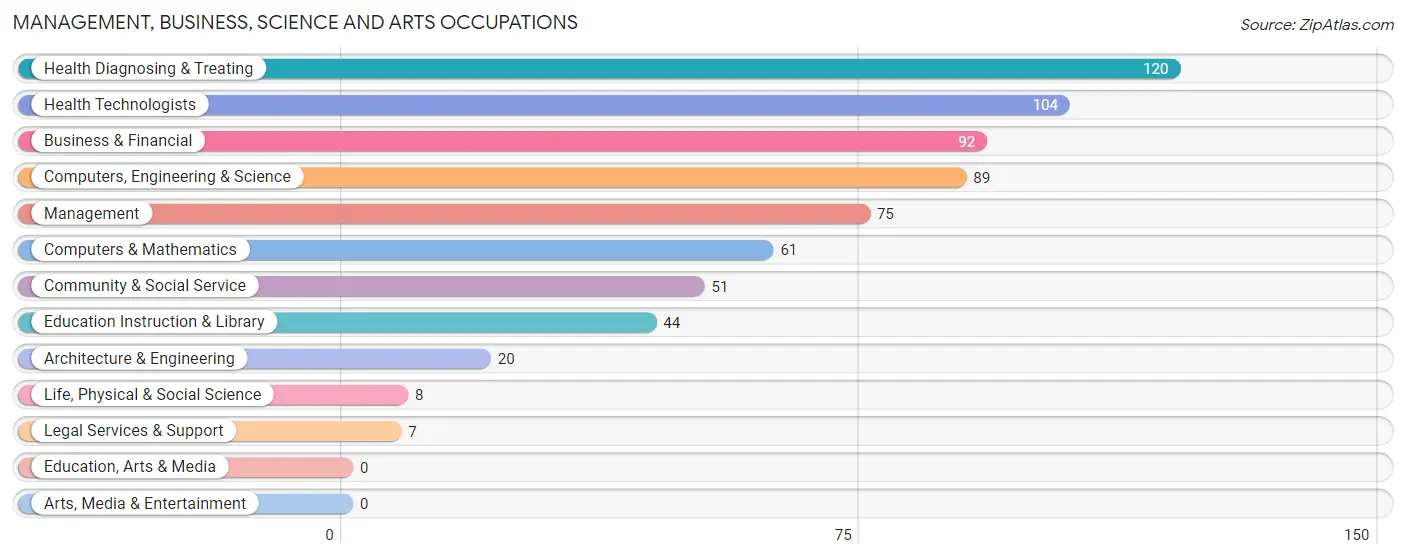
Management, Business, Science and Arts Occupations
The most common Management, Business, Science and Arts occupations in Virden are Health Diagnosing & Treating (120 | 8.4%), Health Technologists (104 | 7.3%), Business & Financial (92 | 6.4%), Computers, Engineering & Science (89 | 6.2%), and Management (75 | 5.2%).
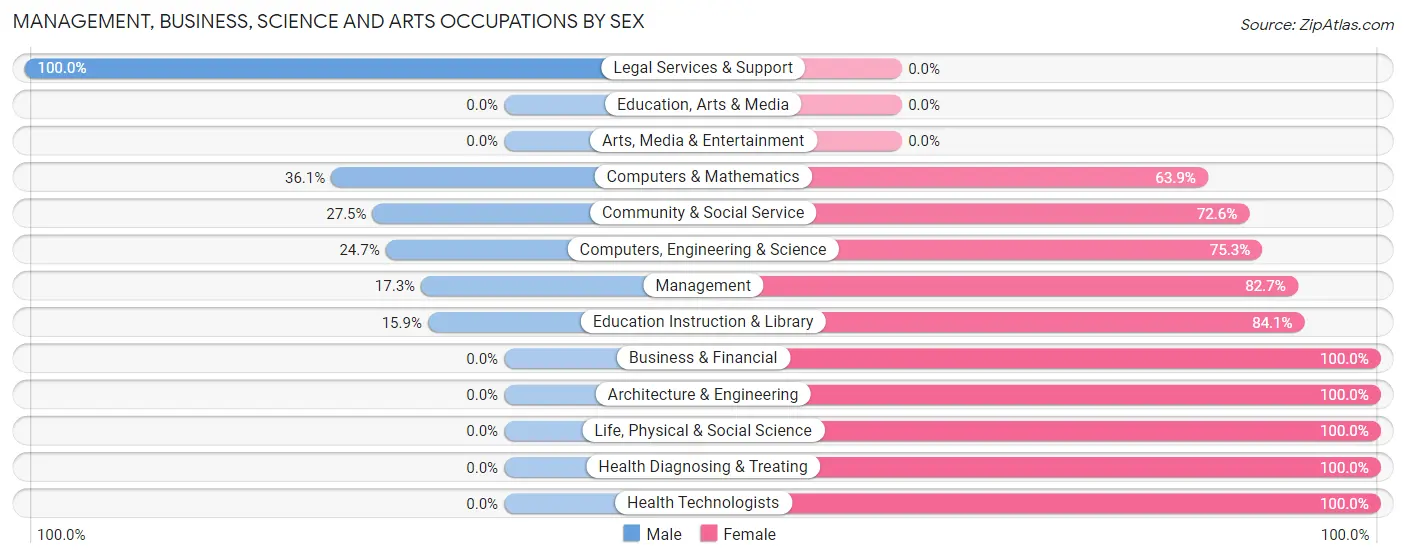
Management, Business, Science and Arts Occupations by Sex
Within the Management, Business, Science and Arts occupations in Virden, the most male-oriented occupations are Legal Services & Support (100.0%), Computers & Mathematics (36.1%), and Community & Social Service (27.5%), while the most female-oriented occupations are Business & Financial (100.0%), Architecture & Engineering (100.0%), and Life, Physical & Social Science (100.0%).
| Occupation | Male | Female |
| Management | 13 (17.3%) | 62 (82.7%) |
| Business & Financial | 0 (0.0%) | 92 (100.0%) |
| Computers, Engineering & Science | 22 (24.7%) | 67 (75.3%) |
| Computers & Mathematics | 22 (36.1%) | 39 (63.9%) |
| Architecture & Engineering | 0 (0.0%) | 20 (100.0%) |
| Life, Physical & Social Science | 0 (0.0%) | 8 (100.0%) |
| Community & Social Service | 14 (27.5%) | 37 (72.6%) |
| Education, Arts & Media | 0 (0.0%) | 0 (0.0%) |
| Legal Services & Support | 7 (100.0%) | 0 (0.0%) |
| Education Instruction & Library | 7 (15.9%) | 37 (84.1%) |
| Arts, Media & Entertainment | 0 (0.0%) | 0 (0.0%) |
| Health Diagnosing & Treating | 0 (0.0%) | 120 (100.0%) |
| Health Technologists | 0 (0.0%) | 104 (100.0%) |
| Total (Category) | 49 (11.5%) | 378 (88.5%) |
| Total (Overall) | 617 (43.1%) | 813 (56.9%) |
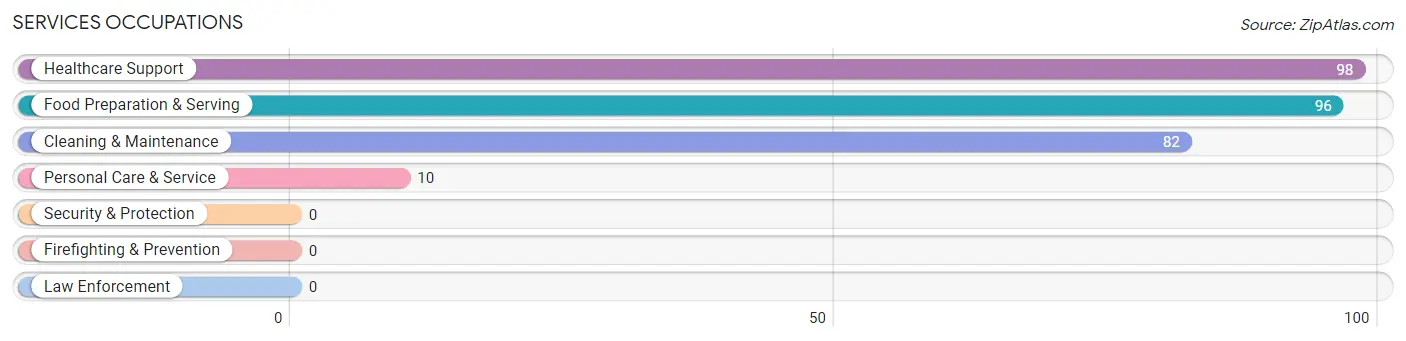
Services Occupations
The most common Services occupations in Virden are Healthcare Support (98 | 6.9%), Food Preparation & Serving (96 | 6.7%), Cleaning & Maintenance (82 | 5.7%), and Personal Care & Service (10 | 0.7%).
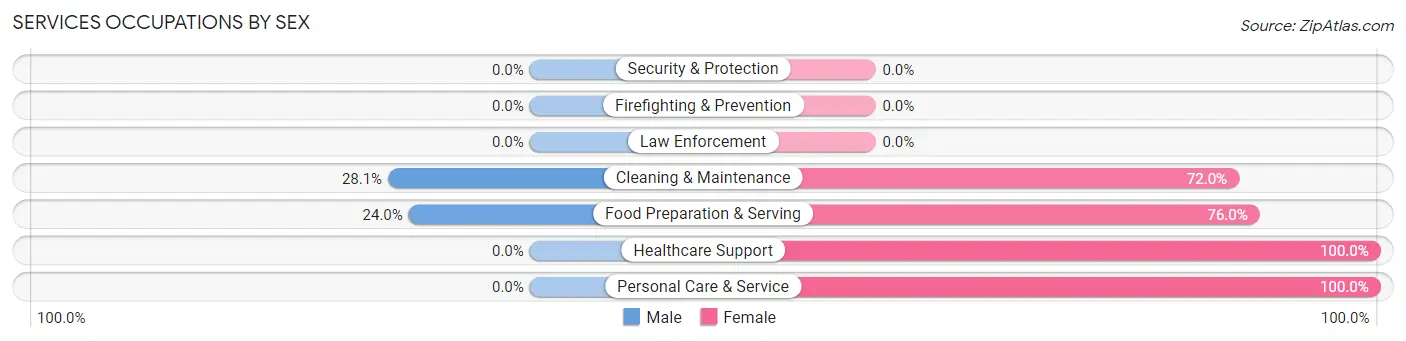
Services Occupations by Sex
Within the Services occupations in Virden, the most male-oriented occupations are Cleaning & Maintenance (28.1%), and Food Preparation & Serving (24.0%), while the most female-oriented occupations are Healthcare Support (100.0%), Personal Care & Service (100.0%), and Food Preparation & Serving (76.0%).
| Occupation | Male | Female |
| Healthcare Support | 0 (0.0%) | 98 (100.0%) |
| Security & Protection | 0 (0.0%) | 0 (0.0%) |
| Firefighting & Prevention | 0 (0.0%) | 0 (0.0%) |
| Law Enforcement | 0 (0.0%) | 0 (0.0%) |
| Food Preparation & Serving | 23 (24.0%) | 73 (76.0%) |
| Cleaning & Maintenance | 23 (28.1%) | 59 (72.0%) |
| Personal Care & Service | 0 (0.0%) | 10 (100.0%) |
| Total (Category) | 46 (16.1%) | 240 (83.9%) |
| Total (Overall) | 617 (43.1%) | 813 (56.9%) |
Sales and Office Occupations
The most common Sales and Office occupations in Virden are Sales & Related (143 | 10.0%), and Office & Administration (116 | 8.1%).
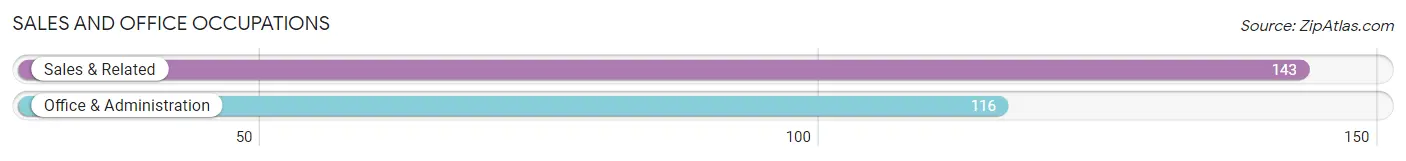
Sales and Office Occupations by Sex
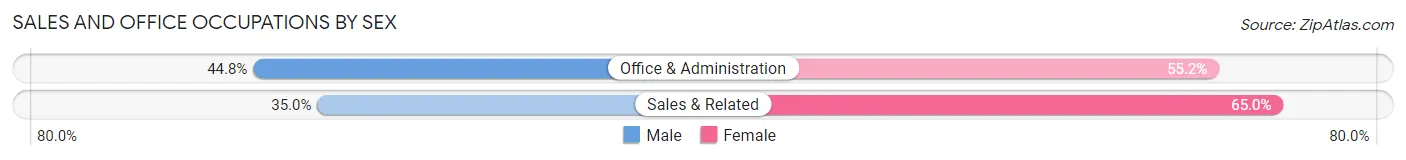
| Occupation | Male | Female |
| Sales & Related | 50 (35.0%) | 93 (65.0%) |
| Office & Administration | 52 (44.8%) | 64 (55.2%) |
| Total (Category) | 102 (39.4%) | 157 (60.6%) |
| Total (Overall) | 617 (43.1%) | 813 (56.9%) |
Natural Resources, Construction and Maintenance Occupations
The most common Natural Resources, Construction and Maintenance occupations in Virden are Construction & Extraction (171 | 12.0%), Installation, Maintenance & Repair (58 | 4.1%), and Farming, Fishing & Forestry (10 | 0.7%).
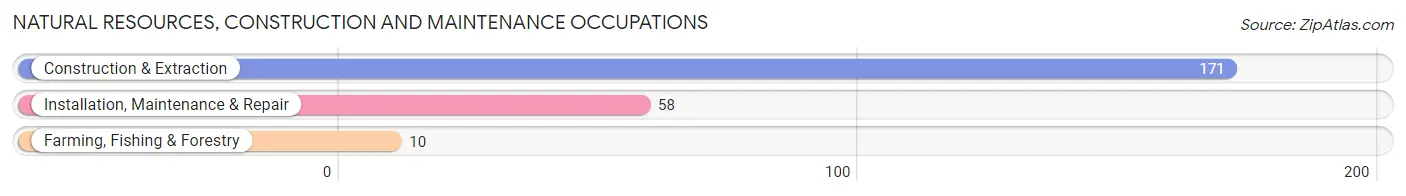
Natural Resources, Construction and Maintenance Occupations by Sex
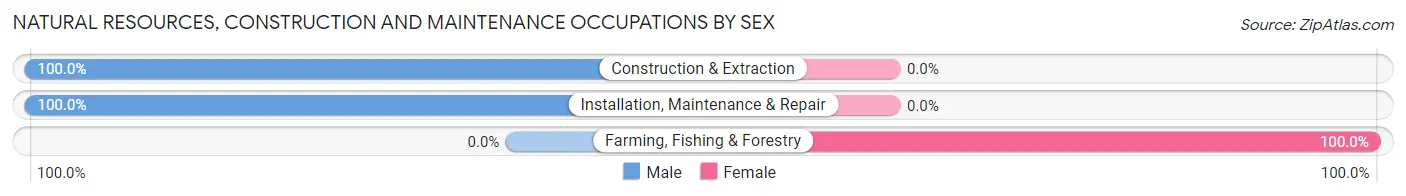
| Occupation | Male | Female |
| Farming, Fishing & Forestry | 0 (0.0%) | 10 (100.0%) |
| Construction & Extraction | 171 (100.0%) | 0 (0.0%) |
| Installation, Maintenance & Repair | 58 (100.0%) | 0 (0.0%) |
| Total (Category) | 229 (95.8%) | 10 (4.2%) |
| Total (Overall) | 617 (43.1%) | 813 (56.9%) |
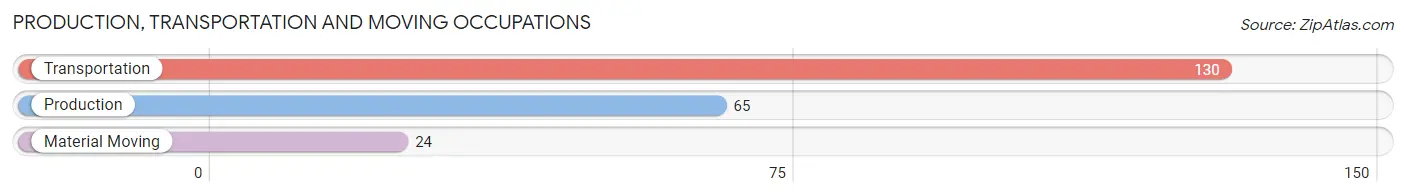
Production, Transportation and Moving Occupations
The most common Production, Transportation and Moving occupations in Virden are Transportation (130 | 9.1%), Production (65 | 4.5%), and Material Moving (24 | 1.7%).
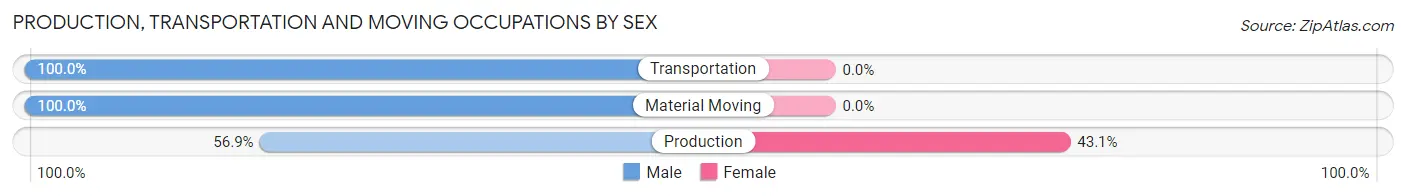
Production, Transportation and Moving Occupations by Sex
| Occupation | Male | Female |
| Production | 37 (56.9%) | 28 (43.1%) |
| Transportation | 130 (100.0%) | 0 (0.0%) |
| Material Moving | 24 (100.0%) | 0 (0.0%) |
| Total (Category) | 191 (87.2%) | 28 (12.8%) |
| Total (Overall) | 617 (43.1%) | 813 (56.9%) |
Employment Industries by Sex in Virden
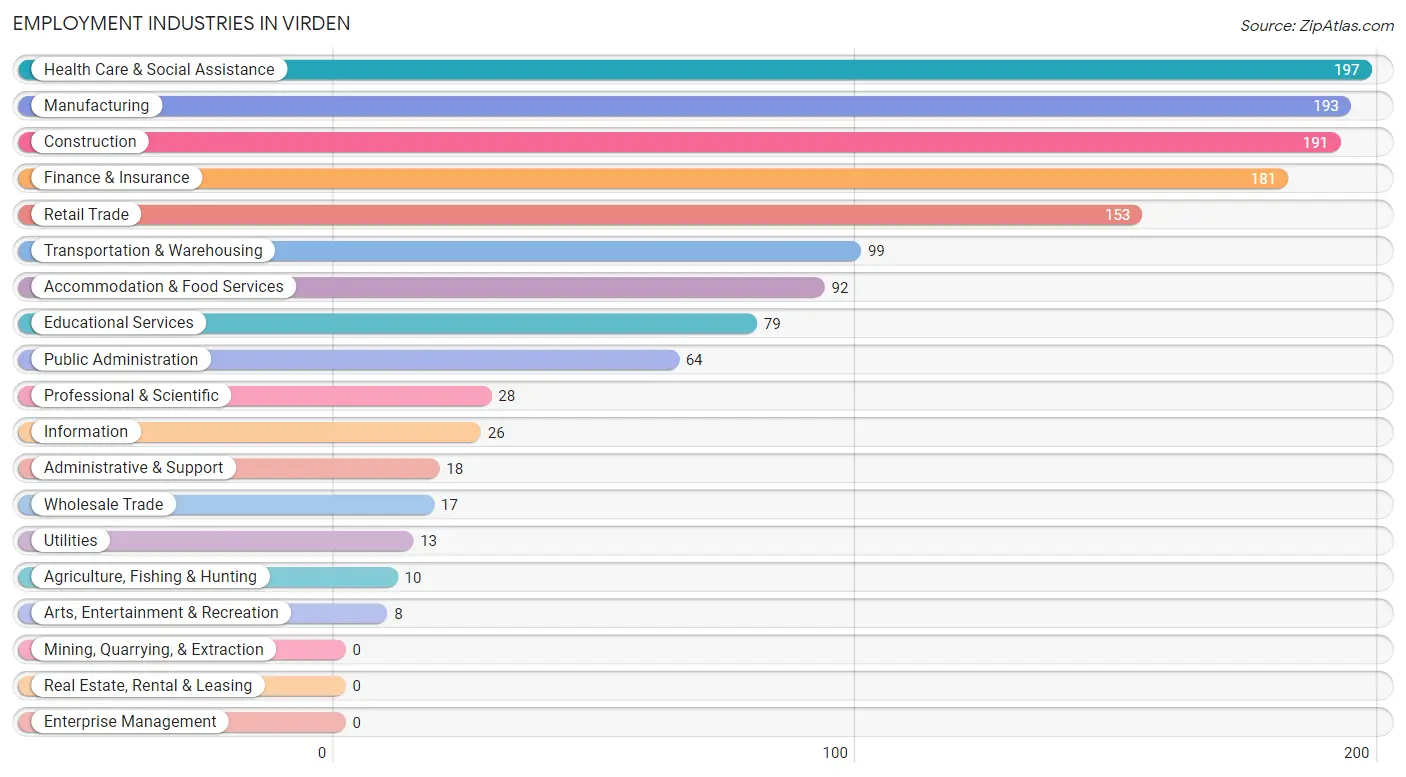
Employment Industries in Virden
The major employment industries in Virden include Health Care & Social Assistance (197 | 13.8%), Manufacturing (193 | 13.5%), Construction (191 | 13.4%), Finance & Insurance (181 | 12.7%), and Retail Trade (153 | 10.7%).
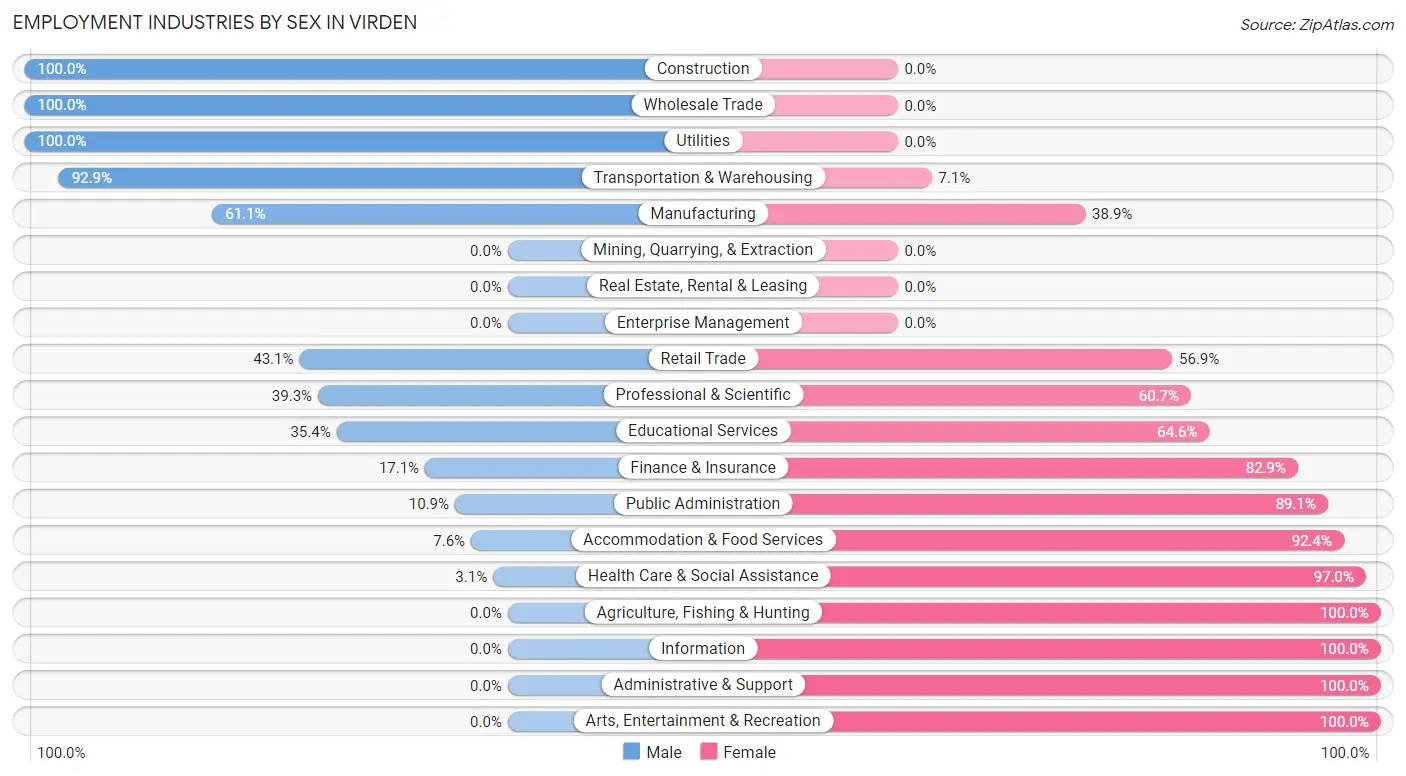
Employment Industries by Sex in Virden
The Virden industries that see more men than women are Construction (100.0%), Wholesale Trade (100.0%), and Utilities (100.0%), whereas the industries that tend to have a higher number of women are Agriculture, Fishing & Hunting (100.0%), Information (100.0%), and Administrative & Support (100.0%).
| Industry | Male | Female |
| Agriculture, Fishing & Hunting | 0 (0.0%) | 10 (100.0%) |
| Mining, Quarrying, & Extraction | 0 (0.0%) | 0 (0.0%) |
| Construction | 191 (100.0%) | 0 (0.0%) |
| Manufacturing | 118 (61.1%) | 75 (38.9%) |
| Wholesale Trade | 17 (100.0%) | 0 (0.0%) |
| Retail Trade | 66 (43.1%) | 87 (56.9%) |
| Transportation & Warehousing | 92 (92.9%) | 7 (7.1%) |
| Utilities | 13 (100.0%) | 0 (0.0%) |
| Information | 0 (0.0%) | 26 (100.0%) |
| Finance & Insurance | 31 (17.1%) | 150 (82.9%) |
| Real Estate, Rental & Leasing | 0 (0.0%) | 0 (0.0%) |
| Professional & Scientific | 11 (39.3%) | 17 (60.7%) |
| Enterprise Management | 0 (0.0%) | 0 (0.0%) |
| Administrative & Support | 0 (0.0%) | 18 (100.0%) |
| Educational Services | 28 (35.4%) | 51 (64.6%) |
| Health Care & Social Assistance | 6 (3.0%) | 191 (97.0%) |
| Arts, Entertainment & Recreation | 0 (0.0%) | 8 (100.0%) |
| Accommodation & Food Services | 7 (7.6%) | 85 (92.4%) |
| Public Administration | 7 (10.9%) | 57 (89.1%) |
| Total | 617 (43.1%) | 813 (56.9%) |
Education in Virden
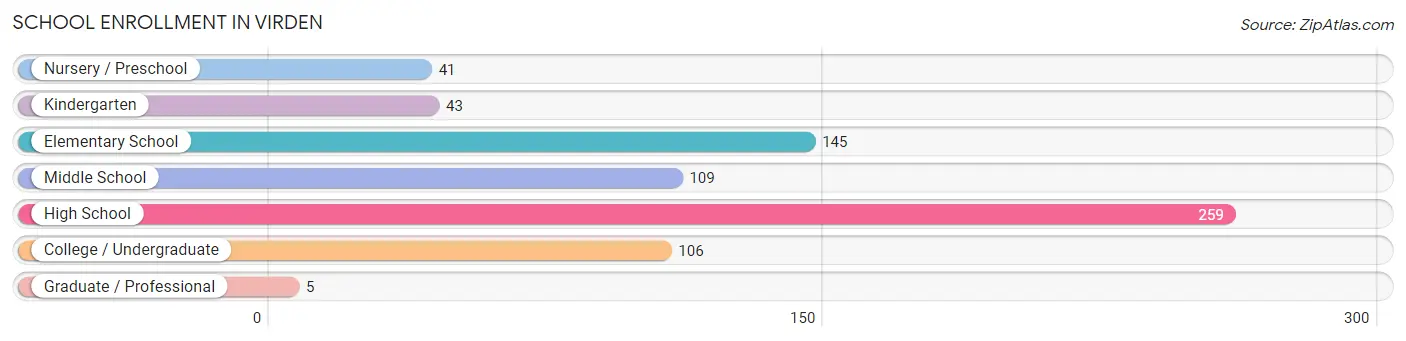
School Enrollment in Virden
The most common levels of schooling among the 708 students in Virden are high school (259 | 36.6%), elementary school (145 | 20.5%), and middle school (109 | 15.4%).
| School Level | # Students | % Students |
| Nursery / Preschool | 41 | 5.8% |
| Kindergarten | 43 | 6.1% |
| Elementary School | 145 | 20.5% |
| Middle School | 109 | 15.4% |
| High School | 259 | 36.6% |
| College / Undergraduate | 106 | 15.0% |
| Graduate / Professional | 5 | 0.7% |
| Total | 708 | 100.0% |
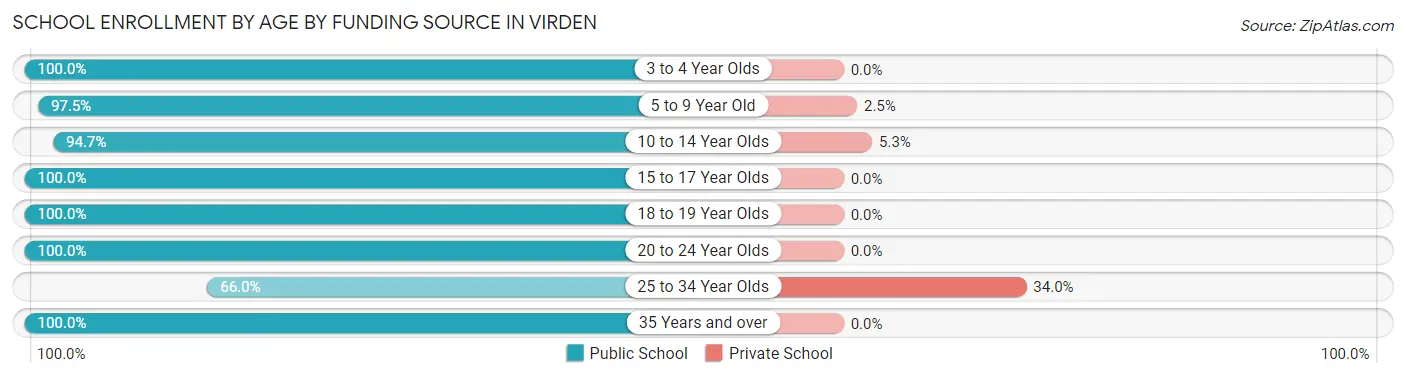
School Enrollment by Age by Funding Source in Virden
Out of a total of 708 students who are enrolled in schools in Virden, 28 (4.0%) attend a private institution, while the remaining 680 (96.0%) are enrolled in public schools. The age group of 25 to 34 year olds has the highest likelihood of being enrolled in private schools, with 16 (34.0% in the age bracket) enrolled. Conversely, the age group of 3 to 4 year olds has the lowest likelihood of being enrolled in a private school, with 28 (100.0% in the age bracket) attending a public institution.
| Age Bracket | Public School | Private School |
| 3 to 4 Year Olds | 28 (100.0%) | 0 (0.0%) |
| 5 to 9 Year Old | 196 (97.5%) | 5 (2.5%) |
| 10 to 14 Year Olds | 125 (94.7%) | 7 (5.3%) |
| 15 to 17 Year Olds | 210 (100.0%) | 0 (0.0%) |
| 18 to 19 Year Olds | 73 (100.0%) | 0 (0.0%) |
| 20 to 24 Year Olds | 12 (100.0%) | 0 (0.0%) |
| 25 to 34 Year Olds | 31 (66.0%) | 16 (34.0%) |
| 35 Years and over | 5 (100.0%) | 0 (0.0%) |
| Total | 680 (96.0%) | 28 (4.0%) |
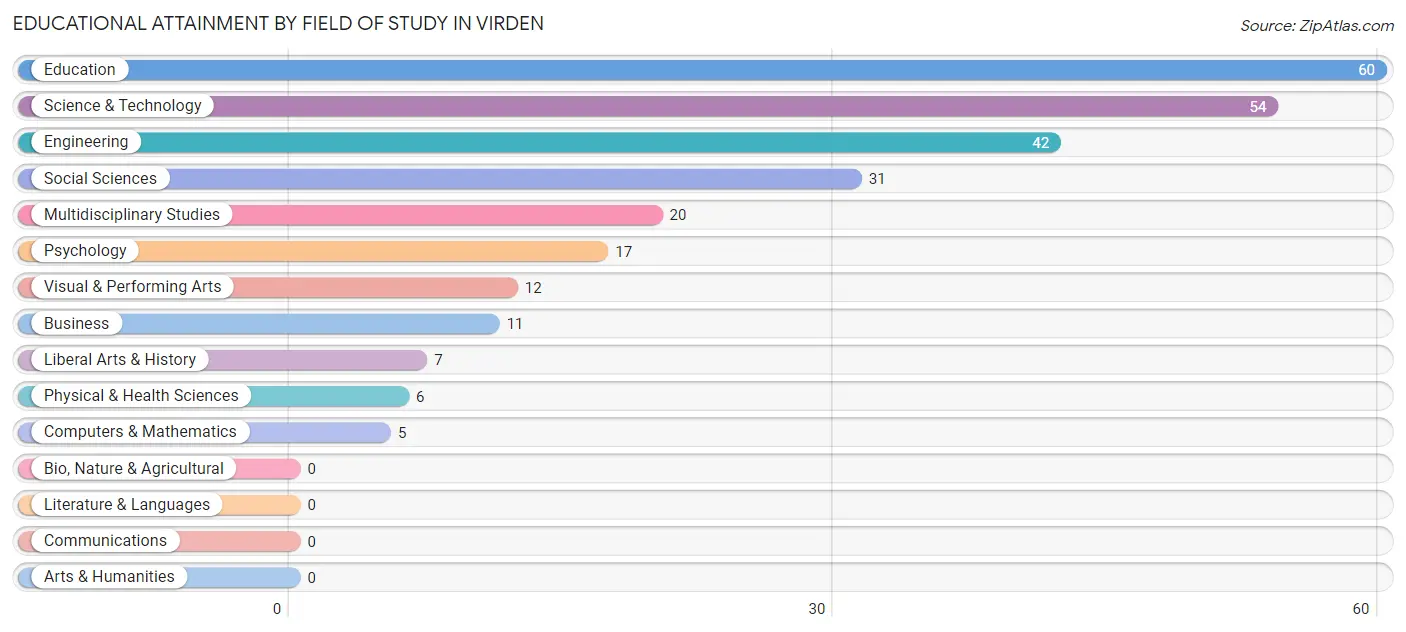
Educational Attainment by Field of Study in Virden
Education (60 | 22.6%), science & technology (54 | 20.4%), engineering (42 | 15.9%), social sciences (31 | 11.7%), and multidisciplinary studies (20 | 7.5%) are the most common fields of study among 265 individuals in Virden who have obtained a bachelor's degree or higher.
| Field of Study | # Graduates | % Graduates |
| Computers & Mathematics | 5 | 1.9% |
| Bio, Nature & Agricultural | 0 | 0.0% |
| Physical & Health Sciences | 6 | 2.3% |
| Psychology | 17 | 6.4% |
| Social Sciences | 31 | 11.7% |
| Engineering | 42 | 15.9% |
| Multidisciplinary Studies | 20 | 7.5% |
| Science & Technology | 54 | 20.4% |
| Business | 11 | 4.2% |
| Education | 60 | 22.6% |
| Literature & Languages | 0 | 0.0% |
| Liberal Arts & History | 7 | 2.6% |
| Visual & Performing Arts | 12 | 4.5% |
| Communications | 0 | 0.0% |
| Arts & Humanities | 0 | 0.0% |
| Total | 265 | 100.0% |
Transportation & Commute in Virden
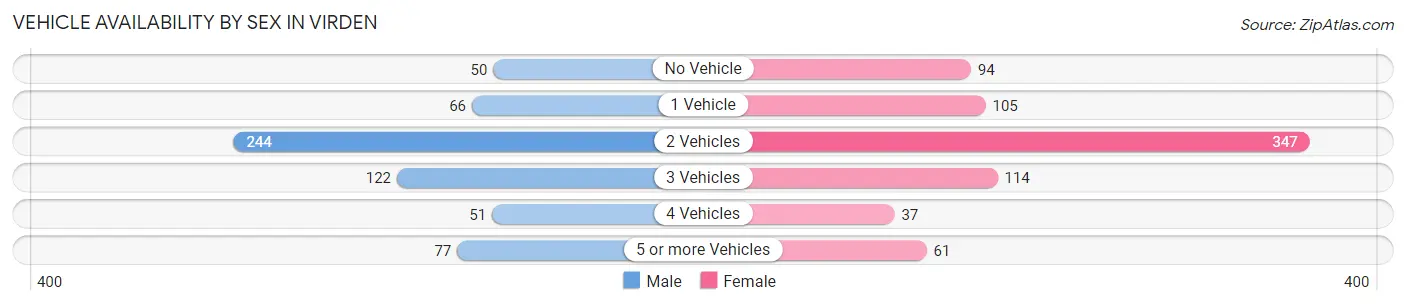
Vehicle Availability by Sex in Virden
The most prevalent vehicle ownership categories in Virden are males with 2 vehicles (244, accounting for 40.0%) and females with 2 vehicles (347, making up 32.2%).
| Vehicles Available | Male | Female |
| No Vehicle | 50 (8.2%) | 94 (12.4%) |
| 1 Vehicle | 66 (10.8%) | 105 (13.9%) |
| 2 Vehicles | 244 (40.0%) | 347 (45.8%) |
| 3 Vehicles | 122 (20.0%) | 114 (15.0%) |
| 4 Vehicles | 51 (8.4%) | 37 (4.9%) |
| 5 or more Vehicles | 77 (12.6%) | 61 (8.1%) |
| Total | 610 (100.0%) | 758 (100.0%) |
Commute Time in Virden
The most frequently occuring commute durations in Virden are 30 to 34 minutes (380 commuters, 29.6%), 5 to 9 minutes (225 commuters, 17.5%), and 10 to 14 minutes (160 commuters, 12.5%).
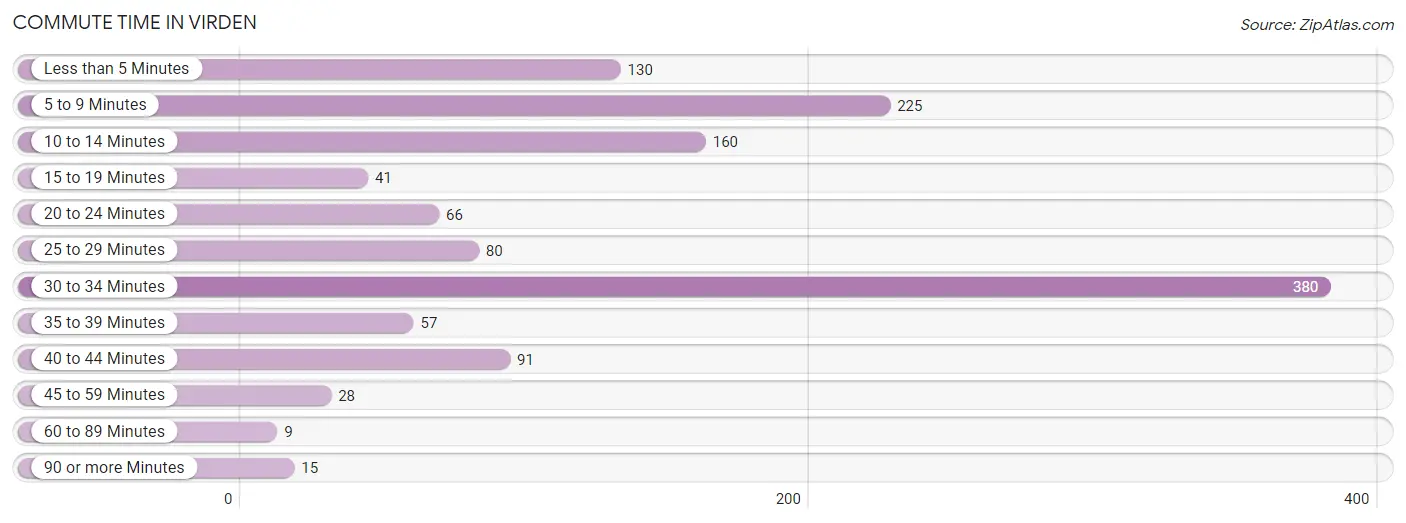
| Commute Time | # Commuters | % Commuters |
| Less than 5 Minutes | 130 | 10.1% |
| 5 to 9 Minutes | 225 | 17.5% |
| 10 to 14 Minutes | 160 | 12.5% |
| 15 to 19 Minutes | 41 | 3.2% |
| 20 to 24 Minutes | 66 | 5.1% |
| 25 to 29 Minutes | 80 | 6.2% |
| 30 to 34 Minutes | 380 | 29.6% |
| 35 to 39 Minutes | 57 | 4.4% |
| 40 to 44 Minutes | 91 | 7.1% |
| 45 to 59 Minutes | 28 | 2.2% |
| 60 to 89 Minutes | 9 | 0.7% |
| 90 or more Minutes | 15 | 1.2% |
Commute Time by Sex in Virden
The most common commute times in Virden are less than 5 minutes (124 commuters, 20.9%) for males and 30 to 34 minutes (257 commuters, 37.3%) for females.
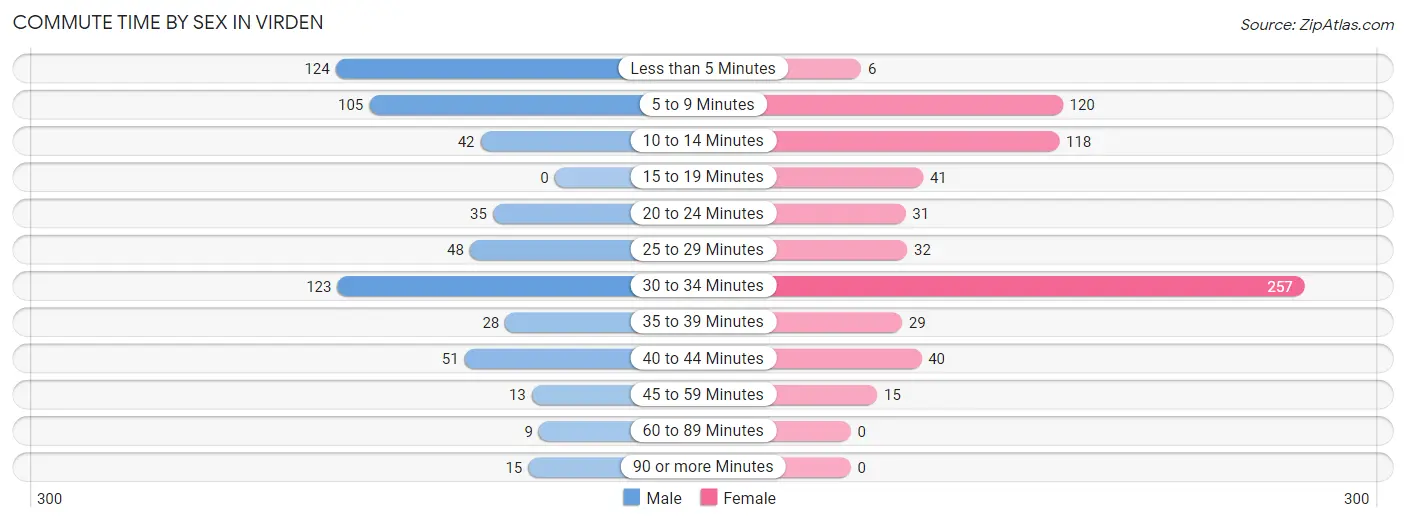
| Commute Time | Male | Female |
| Less than 5 Minutes | 124 (20.9%) | 6 (0.9%) |
| 5 to 9 Minutes | 105 (17.7%) | 120 (17.4%) |
| 10 to 14 Minutes | 42 (7.1%) | 118 (17.1%) |
| 15 to 19 Minutes | 0 (0.0%) | 41 (5.9%) |
| 20 to 24 Minutes | 35 (5.9%) | 31 (4.5%) |
| 25 to 29 Minutes | 48 (8.1%) | 32 (4.6%) |
| 30 to 34 Minutes | 123 (20.7%) | 257 (37.3%) |
| 35 to 39 Minutes | 28 (4.7%) | 29 (4.2%) |
| 40 to 44 Minutes | 51 (8.6%) | 40 (5.8%) |
| 45 to 59 Minutes | 13 (2.2%) | 15 (2.2%) |
| 60 to 89 Minutes | 9 (1.5%) | 0 (0.0%) |
| 90 or more Minutes | 15 (2.5%) | 0 (0.0%) |
Time of Departure to Work by Sex in Virden
The most frequent times of departure to work in Virden are 6:30 AM to 6:59 AM (92, 15.5%) for males and 7:30 AM to 7:59 AM (289, 41.9%) for females.
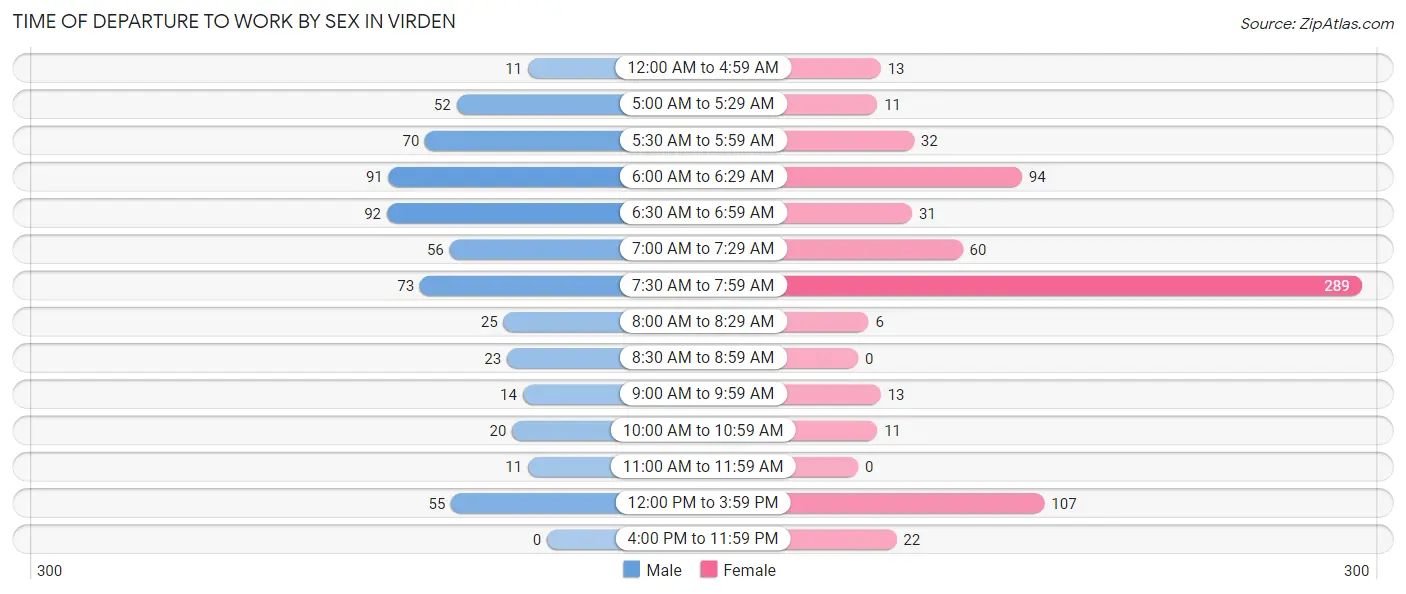
| Time of Departure | Male | Female |
| 12:00 AM to 4:59 AM | 11 (1.8%) | 13 (1.9%) |
| 5:00 AM to 5:29 AM | 52 (8.8%) | 11 (1.6%) |
| 5:30 AM to 5:59 AM | 70 (11.8%) | 32 (4.6%) |
| 6:00 AM to 6:29 AM | 91 (15.3%) | 94 (13.6%) |
| 6:30 AM to 6:59 AM | 92 (15.5%) | 31 (4.5%) |
| 7:00 AM to 7:29 AM | 56 (9.4%) | 60 (8.7%) |
| 7:30 AM to 7:59 AM | 73 (12.3%) | 289 (41.9%) |
| 8:00 AM to 8:29 AM | 25 (4.2%) | 6 (0.9%) |
| 8:30 AM to 8:59 AM | 23 (3.9%) | 0 (0.0%) |
| 9:00 AM to 9:59 AM | 14 (2.4%) | 13 (1.9%) |
| 10:00 AM to 10:59 AM | 20 (3.4%) | 11 (1.6%) |
| 11:00 AM to 11:59 AM | 11 (1.8%) | 0 (0.0%) |
| 12:00 PM to 3:59 PM | 55 (9.3%) | 107 (15.5%) |
| 4:00 PM to 11:59 PM | 0 (0.0%) | 22 (3.2%) |
| Total | 593 (100.0%) | 689 (100.0%) |
Housing Occupancy in Virden
Occupancy by Ownership in Virden
Of the total 1,249 dwellings in Virden, owner-occupied units account for 869 (69.6%), while renter-occupied units make up 380 (30.4%).
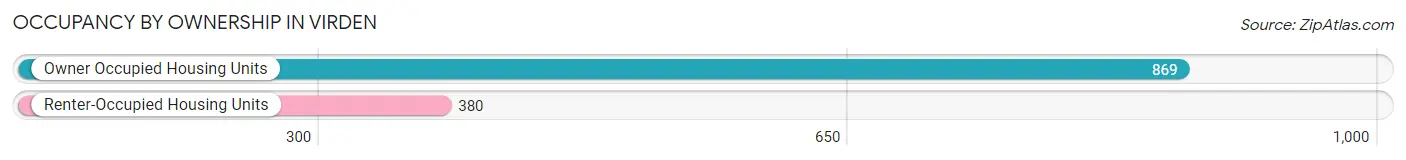
| Occupancy | # Housing Units | % Housing Units |
| Owner Occupied Housing Units | 869 | 69.6% |
| Renter-Occupied Housing Units | 380 | 30.4% |
| Total Occupied Housing Units | 1,249 | 100.0% |
Occupancy by Household Size in Virden
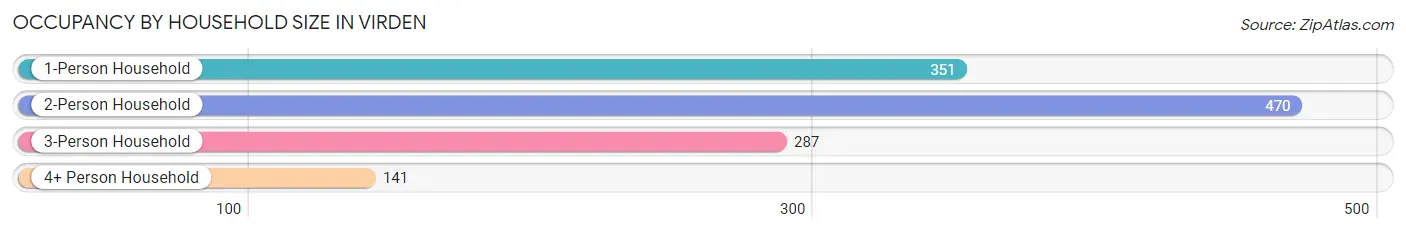
| Household Size | # Housing Units | % Housing Units |
| 1-Person Household | 351 | 28.1% |
| 2-Person Household | 470 | 37.6% |
| 3-Person Household | 287 | 23.0% |
| 4+ Person Household | 141 | 11.3% |
| Total Housing Units | 1,249 | 100.0% |
Occupancy by Ownership by Household Size in Virden
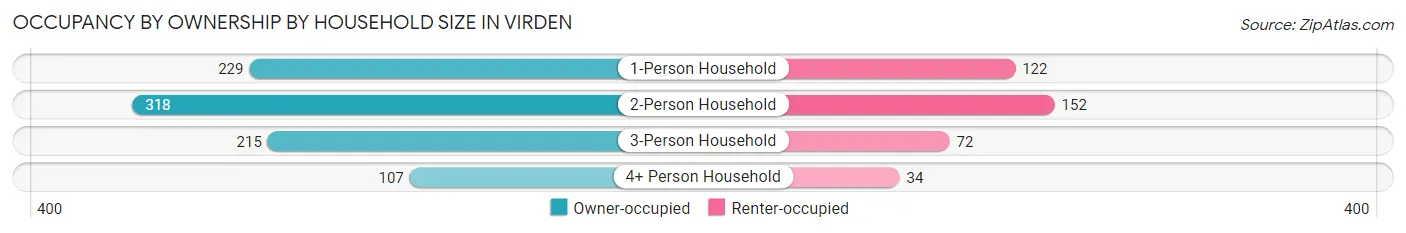
| Household Size | Owner-occupied | Renter-occupied |
| 1-Person Household | 229 (65.2%) | 122 (34.8%) |
| 2-Person Household | 318 (67.7%) | 152 (32.3%) |
| 3-Person Household | 215 (74.9%) | 72 (25.1%) |
| 4+ Person Household | 107 (75.9%) | 34 (24.1%) |
| Total Housing Units | 869 (69.6%) | 380 (30.4%) |
Occupancy by Educational Attainment in Virden
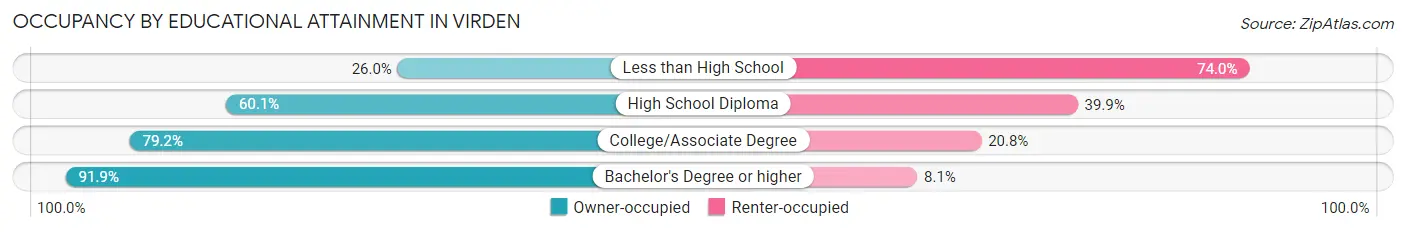
| Household Size | Owner-occupied | Renter-occupied |
| Less than High School | 19 (26.0%) | 54 (74.0%) |
| High School Diploma | 319 (60.1%) | 212 (39.9%) |
| College/Associate Degree | 384 (79.2%) | 101 (20.8%) |
| Bachelor's Degree or higher | 147 (91.9%) | 13 (8.1%) |
Occupancy by Age of Householder in Virden
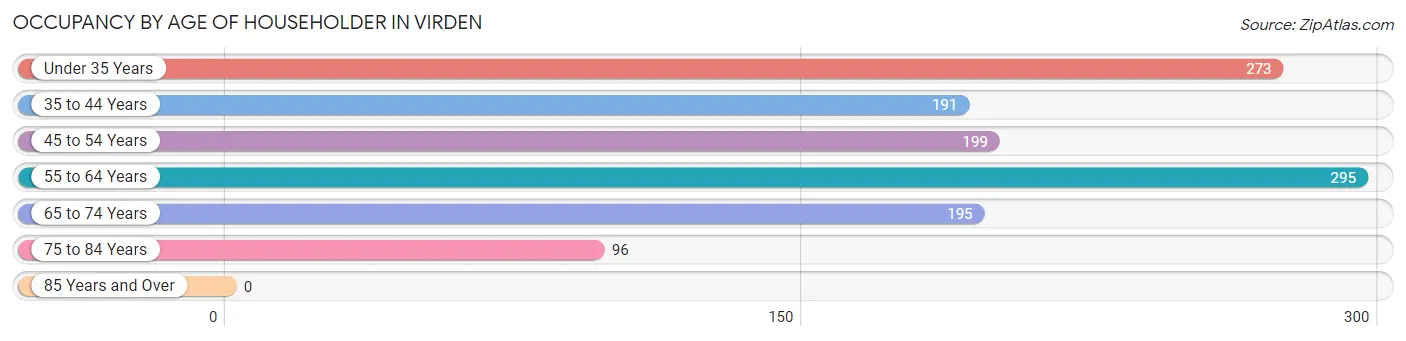
| Age Bracket | # Households | % Households |
| Under 35 Years | 273 | 21.9% |
| 35 to 44 Years | 191 | 15.3% |
| 45 to 54 Years | 199 | 15.9% |
| 55 to 64 Years | 295 | 23.6% |
| 65 to 74 Years | 195 | 15.6% |
| 75 to 84 Years | 96 | 7.7% |
| 85 Years and Over | 0 | 0.0% |
| Total | 1,249 | 100.0% |
Housing Finances in Virden
Median Income by Occupancy in Virden
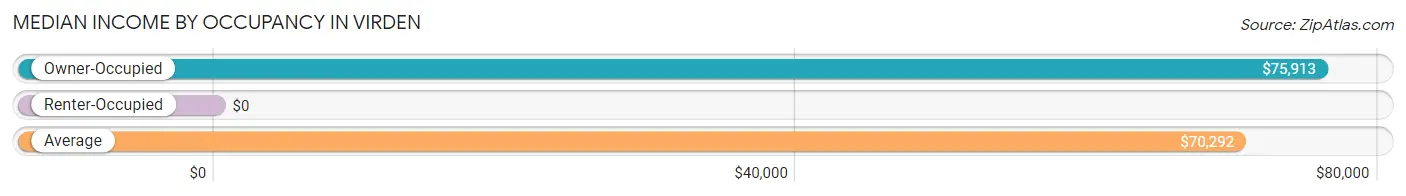
| Occupancy Type | # Households | Median Income |
| Owner-Occupied | 869 (69.6%) | $75,913 |
| Renter-Occupied | 380 (30.4%) | $0 |
| Average | 1,249 (100.0%) | $70,292 |
Occupancy by Householder Income Bracket in Virden
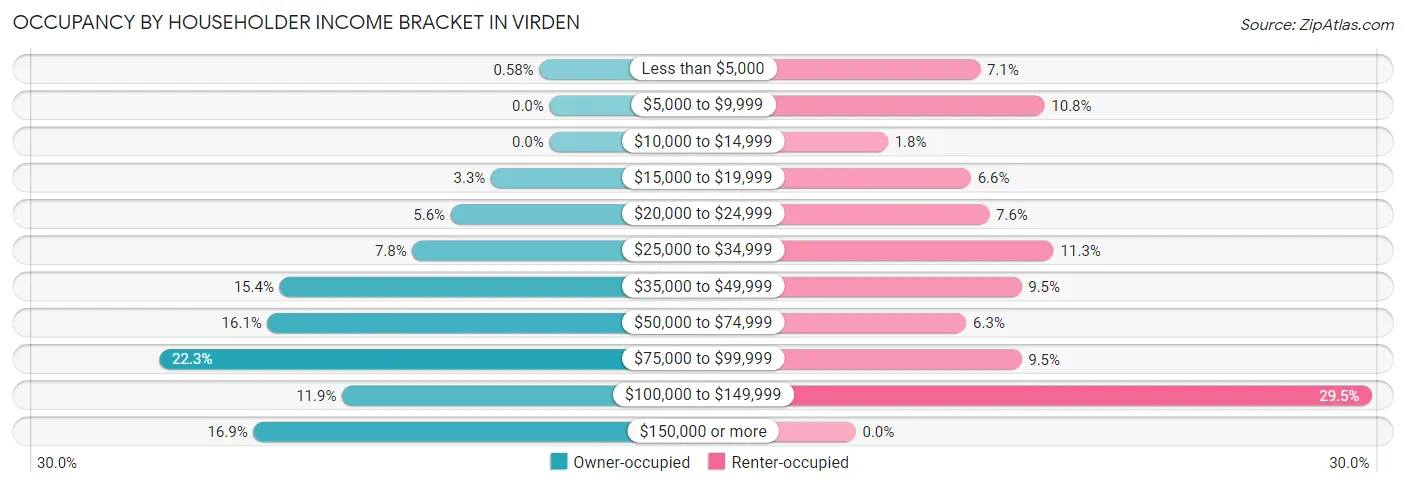
| Income Bracket | Owner-occupied | Renter-occupied |
| Less than $5,000 | 5 (0.6%) | 27 (7.1%) |
| $5,000 to $9,999 | 0 (0.0%) | 41 (10.8%) |
| $10,000 to $14,999 | 0 (0.0%) | 7 (1.8%) |
| $15,000 to $19,999 | 29 (3.3%) | 25 (6.6%) |
| $20,000 to $24,999 | 49 (5.6%) | 29 (7.6%) |
| $25,000 to $34,999 | 68 (7.8%) | 43 (11.3%) |
| $35,000 to $49,999 | 134 (15.4%) | 36 (9.5%) |
| $50,000 to $74,999 | 140 (16.1%) | 24 (6.3%) |
| $75,000 to $99,999 | 194 (22.3%) | 36 (9.5%) |
| $100,000 to $149,999 | 103 (11.8%) | 112 (29.5%) |
| $150,000 or more | 147 (16.9%) | 0 (0.0%) |
| Total | 869 (100.0%) | 380 (100.0%) |
Monthly Housing Cost Tiers in Virden
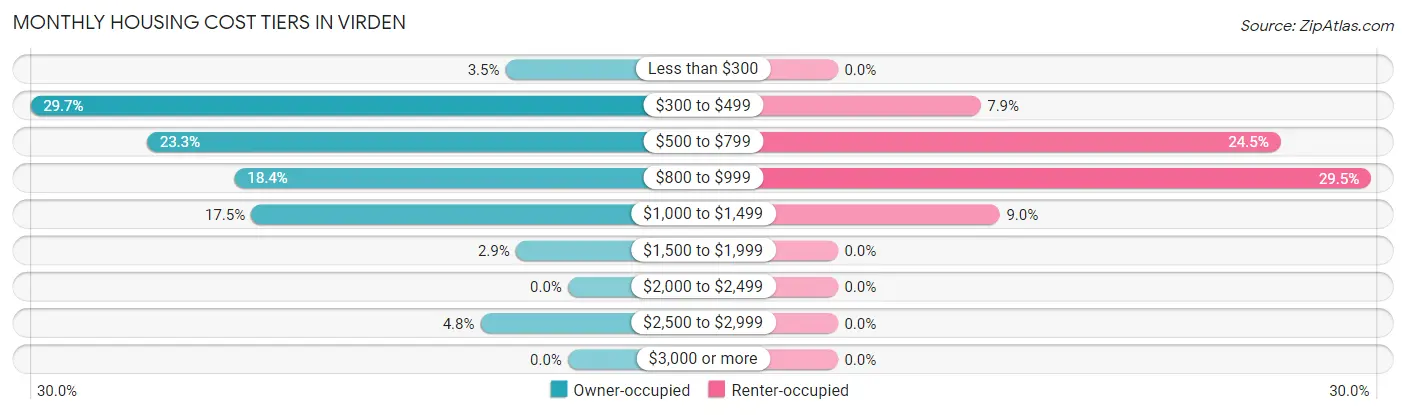
| Monthly Cost | Owner-occupied | Renter-occupied |
| Less than $300 | 30 (3.5%) | 0 (0.0%) |
| $300 to $499 | 258 (29.7%) | 30 (7.9%) |
| $500 to $799 | 202 (23.3%) | 93 (24.5%) |
| $800 to $999 | 160 (18.4%) | 112 (29.5%) |
| $1,000 to $1,499 | 152 (17.5%) | 34 (8.9%) |
| $1,500 to $1,999 | 25 (2.9%) | 0 (0.0%) |
| $2,000 to $2,499 | 0 (0.0%) | 0 (0.0%) |
| $2,500 to $2,999 | 42 (4.8%) | 0 (0.0%) |
| $3,000 or more | 0 (0.0%) | 0 (0.0%) |
| Total | 869 (100.0%) | 380 (100.0%) |
Physical Housing Characteristics in Virden
Housing Structures in Virden
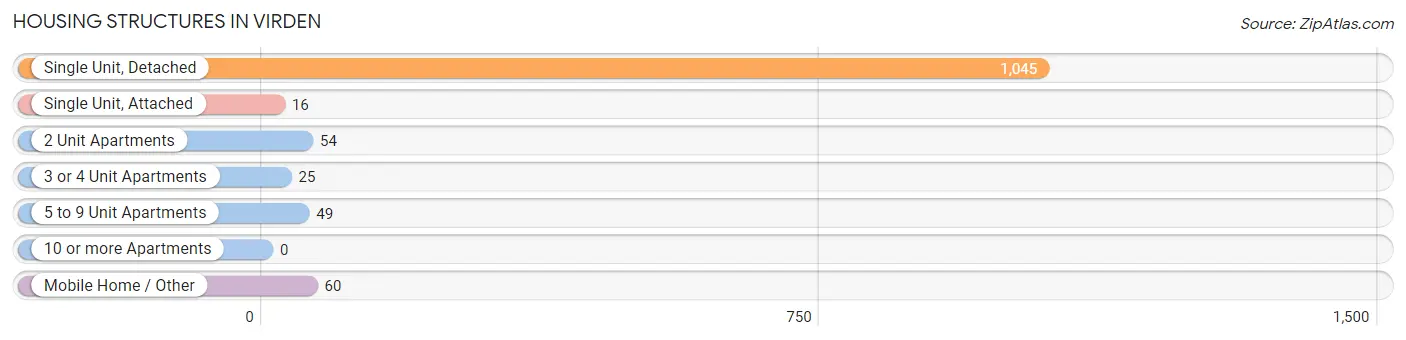
| Structure Type | # Housing Units | % Housing Units |
| Single Unit, Detached | 1,045 | 83.7% |
| Single Unit, Attached | 16 | 1.3% |
| 2 Unit Apartments | 54 | 4.3% |
| 3 or 4 Unit Apartments | 25 | 2.0% |
| 5 to 9 Unit Apartments | 49 | 3.9% |
| 10 or more Apartments | 0 | 0.0% |
| Mobile Home / Other | 60 | 4.8% |
| Total | 1,249 | 100.0% |
Housing Structures by Occupancy in Virden
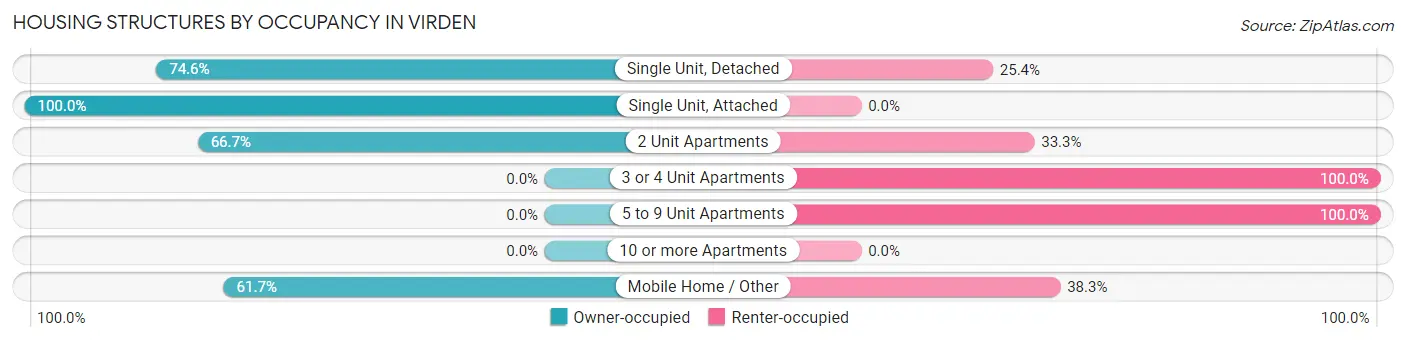
| Structure Type | Owner-occupied | Renter-occupied |
| Single Unit, Detached | 780 (74.6%) | 265 (25.4%) |
| Single Unit, Attached | 16 (100.0%) | 0 (0.0%) |
| 2 Unit Apartments | 36 (66.7%) | 18 (33.3%) |
| 3 or 4 Unit Apartments | 0 (0.0%) | 25 (100.0%) |
| 5 to 9 Unit Apartments | 0 (0.0%) | 49 (100.0%) |
| 10 or more Apartments | 0 (0.0%) | 0 (0.0%) |
| Mobile Home / Other | 37 (61.7%) | 23 (38.3%) |
| Total | 869 (69.6%) | 380 (30.4%) |
Housing Structures by Number of Rooms in Virden
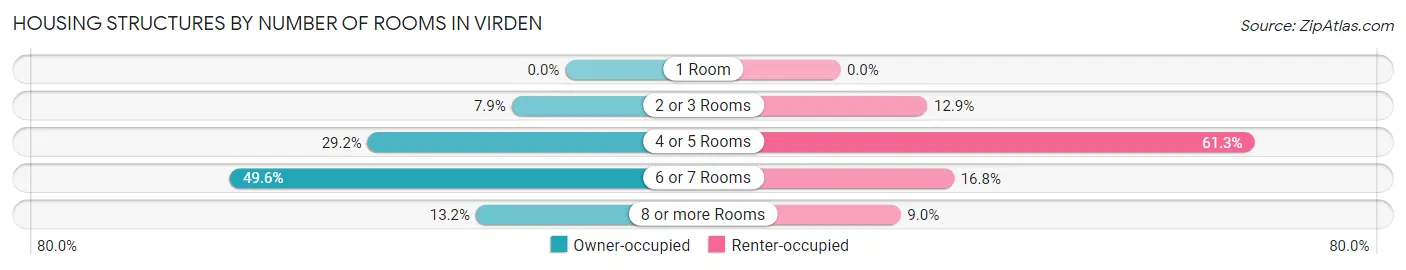
| Number of Rooms | Owner-occupied | Renter-occupied |
| 1 Room | 0 (0.0%) | 0 (0.0%) |
| 2 or 3 Rooms | 69 (7.9%) | 49 (12.9%) |
| 4 or 5 Rooms | 254 (29.2%) | 233 (61.3%) |
| 6 or 7 Rooms | 431 (49.6%) | 64 (16.8%) |
| 8 or more Rooms | 115 (13.2%) | 34 (8.9%) |
| Total | 869 (100.0%) | 380 (100.0%) |
Housing Structure by Heating Type in Virden
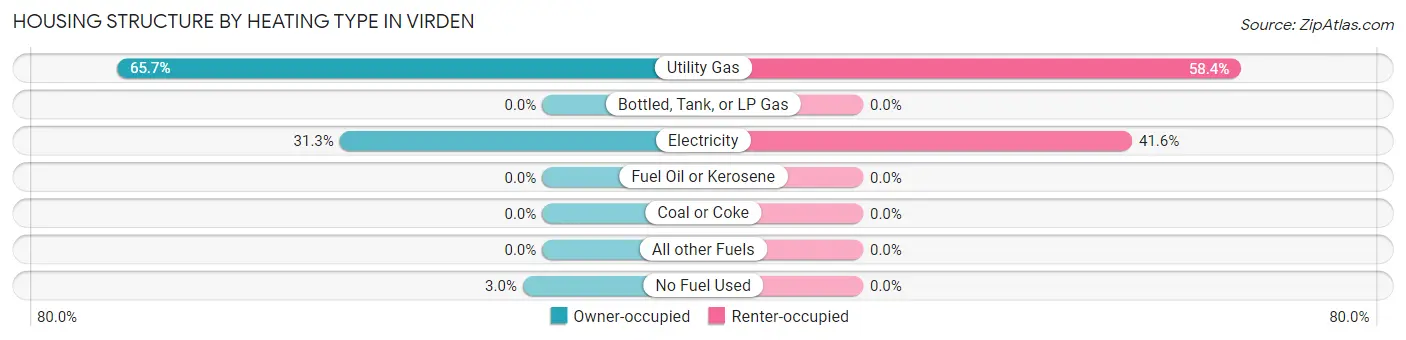
| Heating Type | Owner-occupied | Renter-occupied |
| Utility Gas | 571 (65.7%) | 222 (58.4%) |
| Bottled, Tank, or LP Gas | 0 (0.0%) | 0 (0.0%) |
| Electricity | 272 (31.3%) | 158 (41.6%) |
| Fuel Oil or Kerosene | 0 (0.0%) | 0 (0.0%) |
| Coal or Coke | 0 (0.0%) | 0 (0.0%) |
| All other Fuels | 0 (0.0%) | 0 (0.0%) |
| No Fuel Used | 26 (3.0%) | 0 (0.0%) |
| Total | 869 (100.0%) | 380 (100.0%) |
Household Vehicle Usage in Virden
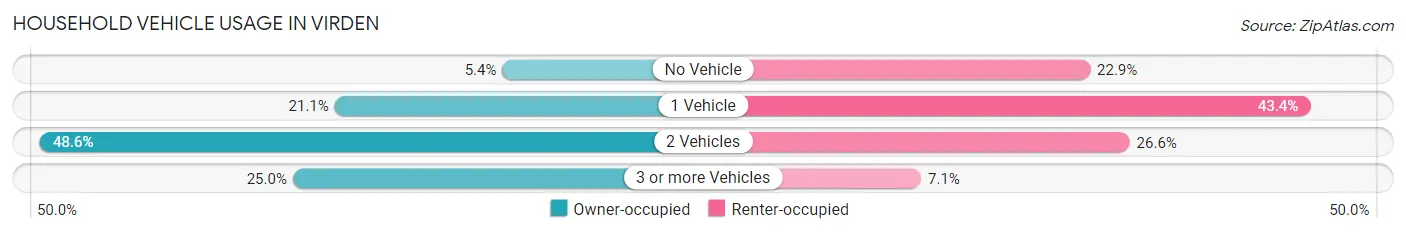
| Vehicles per Household | Owner-occupied | Renter-occupied |
| No Vehicle | 47 (5.4%) | 87 (22.9%) |
| 1 Vehicle | 183 (21.1%) | 165 (43.4%) |
| 2 Vehicles | 422 (48.6%) | 101 (26.6%) |
| 3 or more Vehicles | 217 (25.0%) | 27 (7.1%) |
| Total | 869 (100.0%) | 380 (100.0%) |
Real Estate & Mortgages in Virden
Real Estate and Mortgage Overview in Virden
| Characteristic | Without Mortgage | With Mortgage |
| Housing Units | 395 | 474 |
| Median Property Value | $84,100 | $106,900 |
| Median Household Income | $67,232 | $90 |
| Monthly Housing Costs | $413 | $0 |
| Real Estate Taxes | $1,516 | $0 |
Property Value by Mortgage Status in Virden
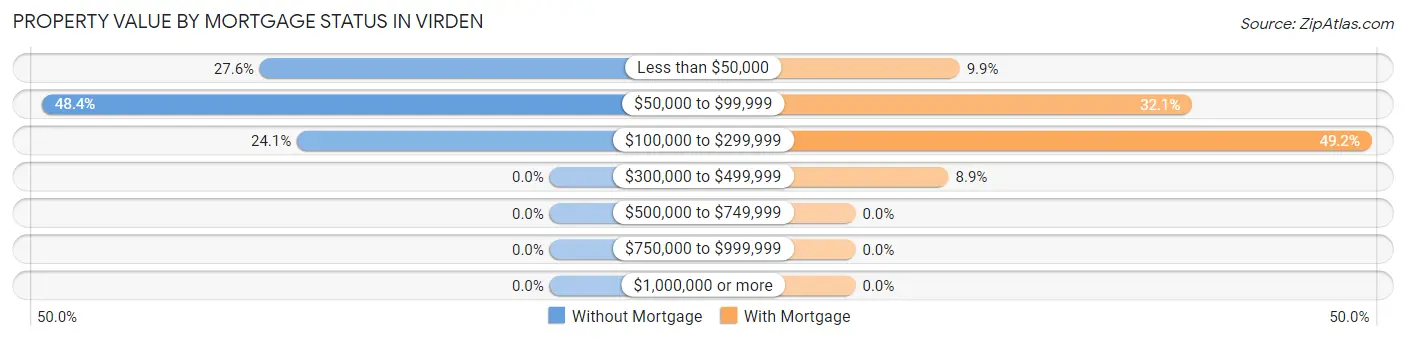
| Property Value | Without Mortgage | With Mortgage |
| Less than $50,000 | 109 (27.6%) | 47 (9.9%) |
| $50,000 to $99,999 | 191 (48.3%) | 152 (32.1%) |
| $100,000 to $299,999 | 95 (24.0%) | 233 (49.2%) |
| $300,000 to $499,999 | 0 (0.0%) | 42 (8.9%) |
| $500,000 to $749,999 | 0 (0.0%) | 0 (0.0%) |
| $750,000 to $999,999 | 0 (0.0%) | 0 (0.0%) |
| $1,000,000 or more | 0 (0.0%) | 0 (0.0%) |
| Total | 395 (100.0%) | 474 (100.0%) |
Household Income by Mortgage Status in Virden
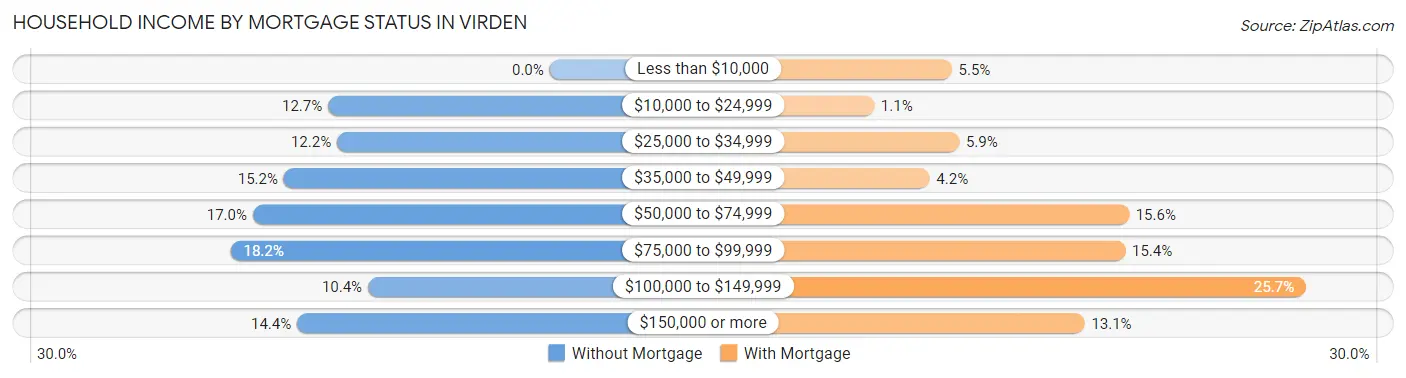
| Household Income | Without Mortgage | With Mortgage |
| Less than $10,000 | 0 (0.0%) | 26 (5.5%) |
| $10,000 to $24,999 | 50 (12.7%) | 5 (1.1%) |
| $25,000 to $34,999 | 48 (12.1%) | 28 (5.9%) |
| $35,000 to $49,999 | 60 (15.2%) | 20 (4.2%) |
| $50,000 to $74,999 | 67 (17.0%) | 74 (15.6%) |
| $75,000 to $99,999 | 72 (18.2%) | 73 (15.4%) |
| $100,000 to $149,999 | 41 (10.4%) | 122 (25.7%) |
| $150,000 or more | 57 (14.4%) | 62 (13.1%) |
| Total | 395 (100.0%) | 474 (100.0%) |
Property Value to Household Income Ratio in Virden
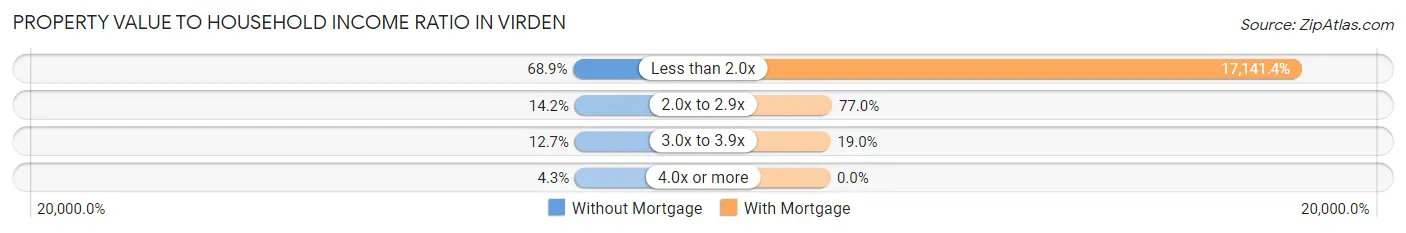
| Value-to-Income Ratio | Without Mortgage | With Mortgage |
| Less than 2.0x | 272 (68.9%) | 81,250 (17,141.3%) |
| 2.0x to 2.9x | 56 (14.2%) | 365 (77.0%) |
| 3.0x to 3.9x | 50 (12.7%) | 90 (19.0%) |
| 4.0x or more | 17 (4.3%) | 0 (0.0%) |
| Total | 395 (100.0%) | 474 (100.0%) |
Real Estate Taxes by Mortgage Status in Virden
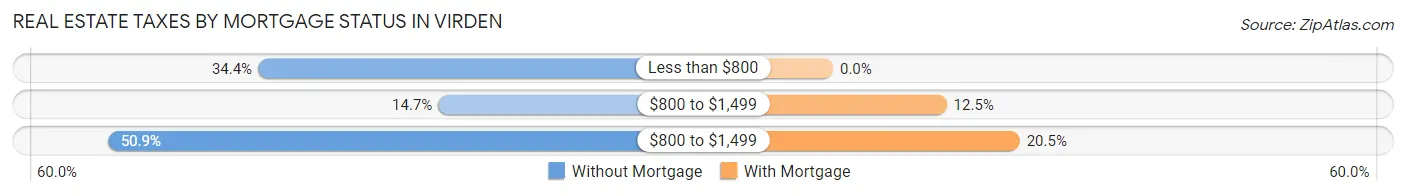
| Property Taxes | Without Mortgage | With Mortgage |
| Less than $800 | 136 (34.4%) | 0 (0.0%) |
| $800 to $1,499 | 58 (14.7%) | 59 (12.4%) |
| $800 to $1,499 | 201 (50.9%) | 97 (20.5%) |
| Total | 395 (100.0%) | 474 (100.0%) |
Health & Disability in Virden
Health Insurance Coverage by Age in Virden
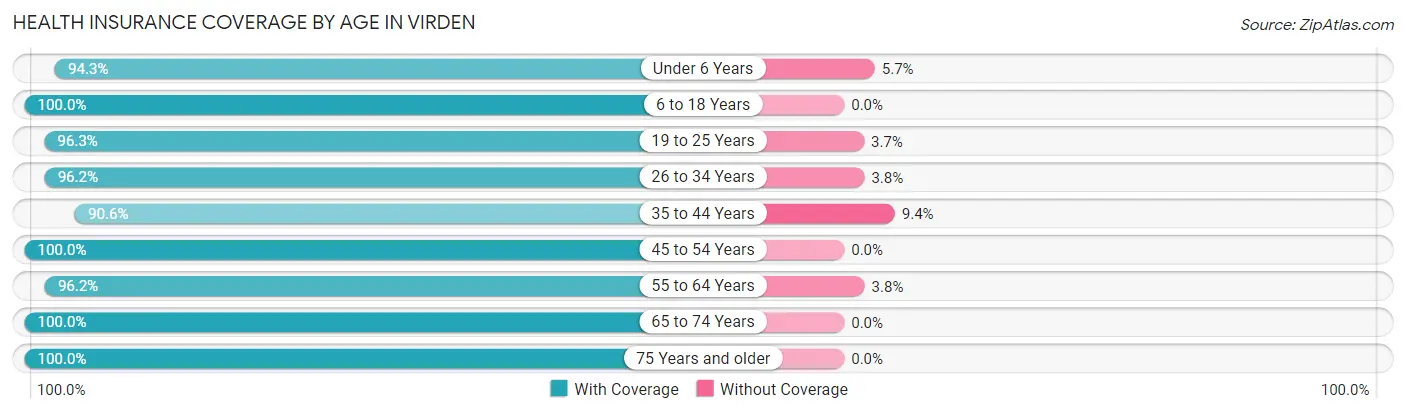
| Age Bracket | With Coverage | Without Coverage |
| Under 6 Years | 182 (94.3%) | 11 (5.7%) |
| 6 to 18 Years | 615 (100.0%) | 0 (0.0%) |
| 19 to 25 Years | 182 (96.3%) | 7 (3.7%) |
| 26 to 34 Years | 358 (96.2%) | 14 (3.8%) |
| 35 to 44 Years | 442 (90.6%) | 46 (9.4%) |
| 45 to 54 Years | 317 (100.0%) | 0 (0.0%) |
| 55 to 64 Years | 456 (96.2%) | 18 (3.8%) |
| 65 to 74 Years | 345 (100.0%) | 0 (0.0%) |
| 75 Years and older | 149 (100.0%) | 0 (0.0%) |
| Total | 3,046 (96.9%) | 96 (3.1%) |
Health Insurance Coverage by Citizenship Status in Virden
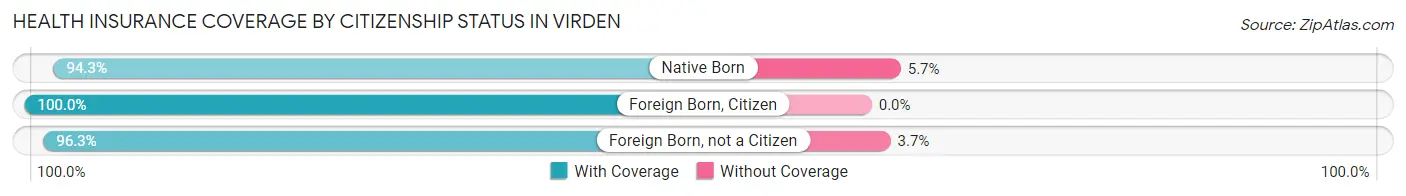
| Citizenship Status | With Coverage | Without Coverage |
| Native Born | 182 (94.3%) | 11 (5.7%) |
| Foreign Born, Citizen | 615 (100.0%) | 0 (0.0%) |
| Foreign Born, not a Citizen | 182 (96.3%) | 7 (3.7%) |
Health Insurance Coverage by Household Income in Virden
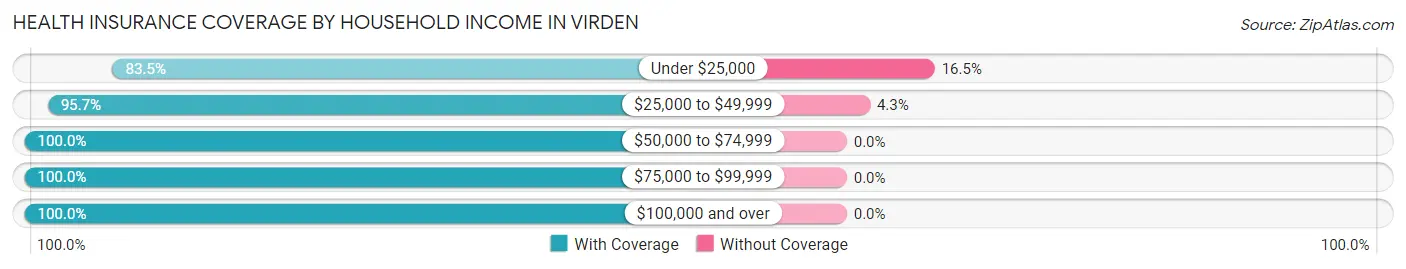
| Household Income | With Coverage | Without Coverage |
| Under $25,000 | 375 (83.5%) | 74 (16.5%) |
| $25,000 to $49,999 | 485 (95.7%) | 22 (4.3%) |
| $50,000 to $74,999 | 381 (100.0%) | 0 (0.0%) |
| $75,000 to $99,999 | 661 (100.0%) | 0 (0.0%) |
| $100,000 and over | 1,144 (100.0%) | 0 (0.0%) |
Public vs Private Health Insurance Coverage by Age in Virden
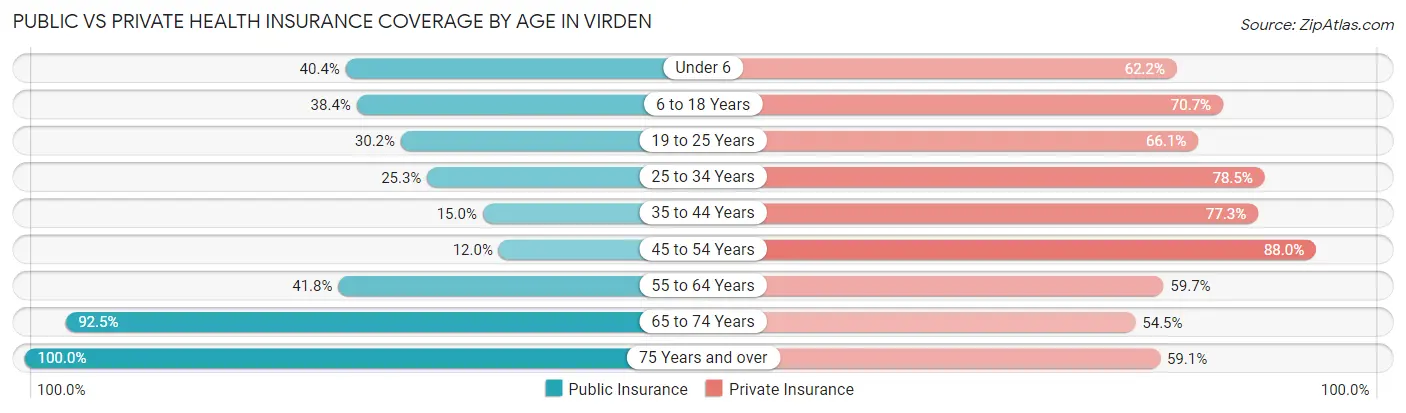
| Age Bracket | Public Insurance | Private Insurance |
| Under 6 | 78 (40.4%) | 120 (62.2%) |
| 6 to 18 Years | 236 (38.4%) | 435 (70.7%) |
| 19 to 25 Years | 57 (30.2%) | 125 (66.1%) |
| 25 to 34 Years | 94 (25.3%) | 292 (78.5%) |
| 35 to 44 Years | 73 (15.0%) | 377 (77.2%) |
| 45 to 54 Years | 38 (12.0%) | 279 (88.0%) |
| 55 to 64 Years | 198 (41.8%) | 283 (59.7%) |
| 65 to 74 Years | 319 (92.5%) | 188 (54.5%) |
| 75 Years and over | 149 (100.0%) | 88 (59.1%) |
| Total | 1,242 (39.5%) | 2,187 (69.6%) |
Disability Status by Sex by Age in Virden
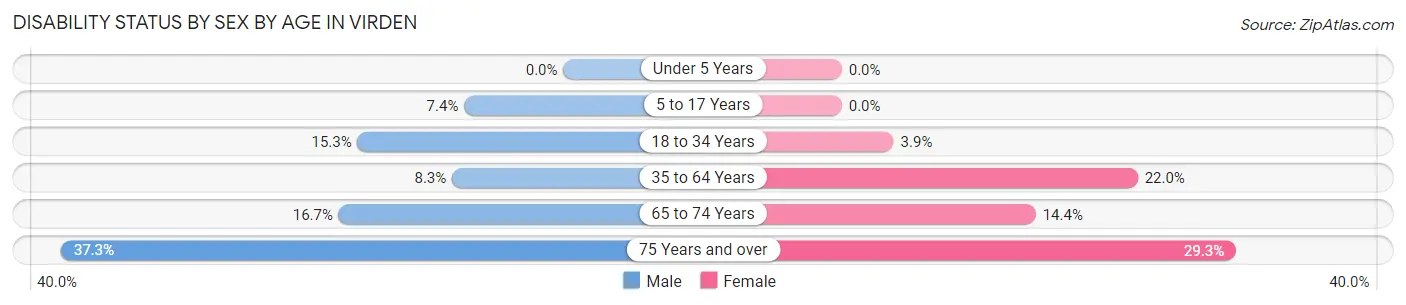
| Age Bracket | Male | Female |
| Under 5 Years | 0 (0.0%) | 0 (0.0%) |
| 5 to 17 Years | 19 (7.4%) | 0 (0.0%) |
| 18 to 34 Years | 46 (15.3%) | 13 (3.8%) |
| 35 to 64 Years | 47 (8.3%) | 156 (22.0%) |
| 65 to 74 Years | 17 (16.7%) | 35 (14.4%) |
| 75 Years and over | 25 (37.3%) | 24 (29.3%) |
Disability Class by Sex by Age in Virden
Disability Class: Hearing Difficulty
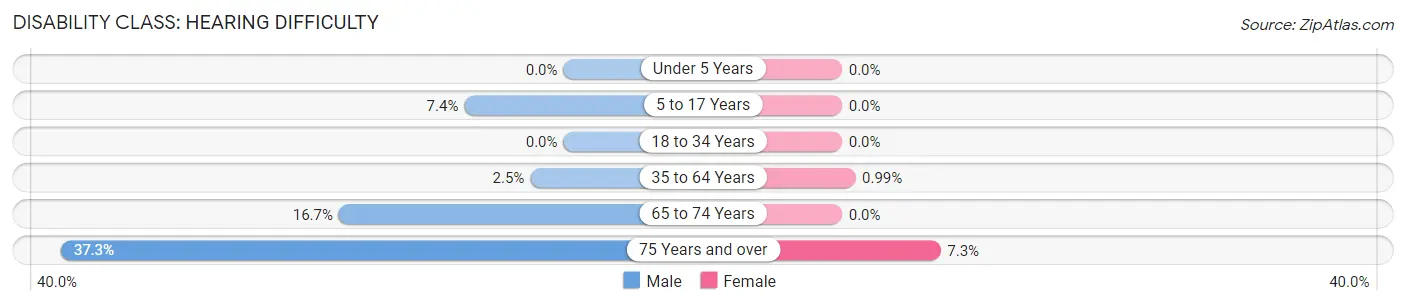
| Age Bracket | Male | Female |
| Under 5 Years | 0 (0.0%) | 0 (0.0%) |
| 5 to 17 Years | 19 (7.4%) | 0 (0.0%) |
| 18 to 34 Years | 0 (0.0%) | 0 (0.0%) |
| 35 to 64 Years | 14 (2.5%) | 7 (1.0%) |
| 65 to 74 Years | 17 (16.7%) | 0 (0.0%) |
| 75 Years and over | 25 (37.3%) | 6 (7.3%) |
Disability Class: Vision Difficulty
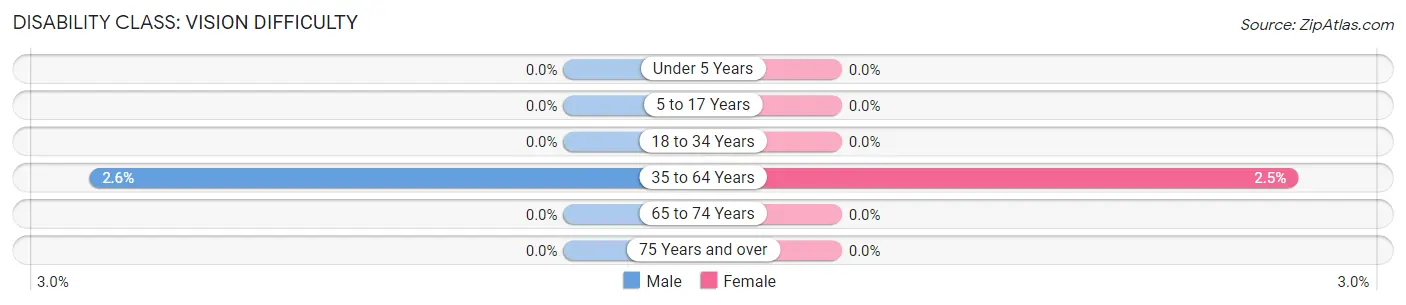
| Age Bracket | Male | Female |
| Under 5 Years | 0 (0.0%) | 0 (0.0%) |
| 5 to 17 Years | 0 (0.0%) | 0 (0.0%) |
| 18 to 34 Years | 0 (0.0%) | 0 (0.0%) |
| 35 to 64 Years | 15 (2.6%) | 18 (2.5%) |
| 65 to 74 Years | 0 (0.0%) | 0 (0.0%) |
| 75 Years and over | 0 (0.0%) | 0 (0.0%) |
Disability Class: Cognitive Difficulty
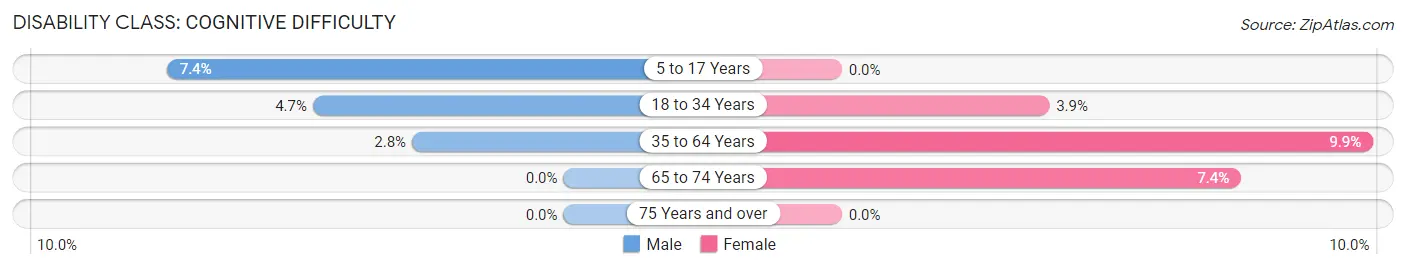
| Age Bracket | Male | Female |
| 5 to 17 Years | 19 (7.4%) | 0 (0.0%) |
| 18 to 34 Years | 14 (4.6%) | 13 (3.8%) |
| 35 to 64 Years | 16 (2.8%) | 70 (9.9%) |
| 65 to 74 Years | 0 (0.0%) | 18 (7.4%) |
| 75 Years and over | 0 (0.0%) | 0 (0.0%) |
Disability Class: Ambulatory Difficulty
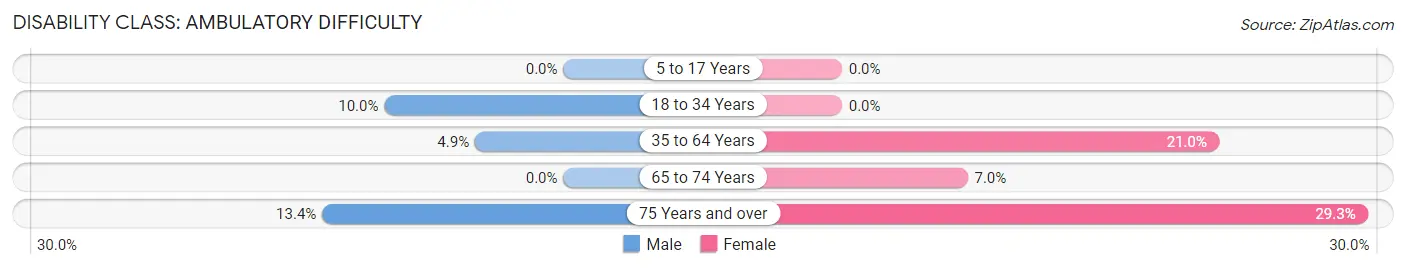
| Age Bracket | Male | Female |
| 5 to 17 Years | 0 (0.0%) | 0 (0.0%) |
| 18 to 34 Years | 30 (10.0%) | 0 (0.0%) |
| 35 to 64 Years | 28 (4.9%) | 149 (21.0%) |
| 65 to 74 Years | 0 (0.0%) | 17 (7.0%) |
| 75 Years and over | 9 (13.4%) | 24 (29.3%) |
Disability Class: Self-Care Difficulty
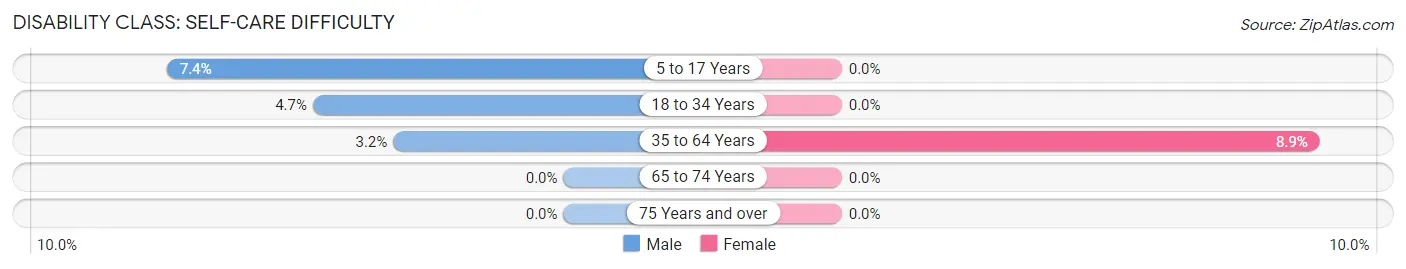
| Age Bracket | Male | Female |
| 5 to 17 Years | 19 (7.4%) | 0 (0.0%) |
| 18 to 34 Years | 14 (4.6%) | 0 (0.0%) |
| 35 to 64 Years | 18 (3.2%) | 63 (8.9%) |
| 65 to 74 Years | 0 (0.0%) | 0 (0.0%) |
| 75 Years and over | 0 (0.0%) | 0 (0.0%) |
Technology Access in Virden
Computing Device Access in Virden
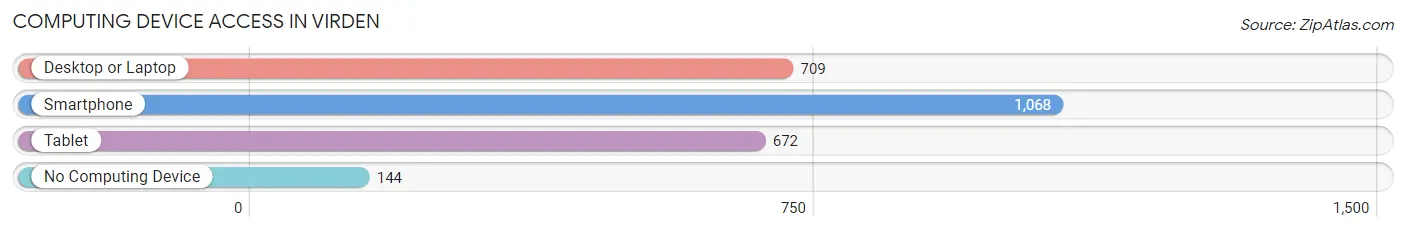
| Device Type | # Households | % Households |
| Desktop or Laptop | 709 | 56.8% |
| Smartphone | 1,068 | 85.5% |
| Tablet | 672 | 53.8% |
| No Computing Device | 144 | 11.5% |
| Total | 1,249 | 100.0% |
Internet Access in Virden
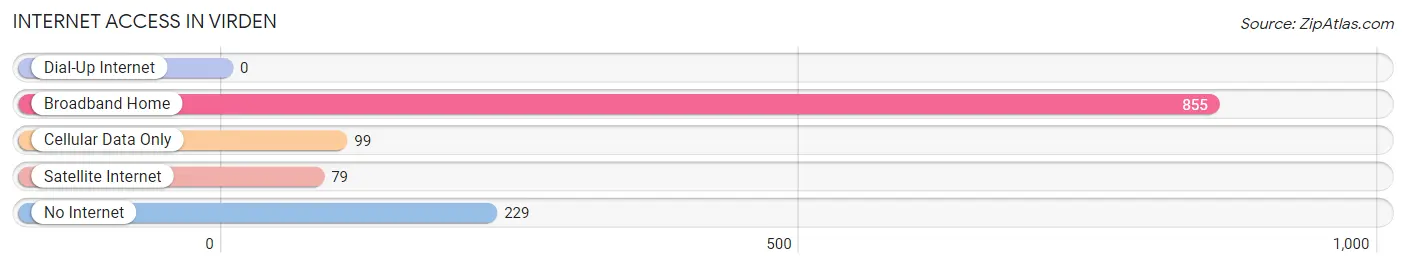
| Internet Type | # Households | % Households |
| Dial-Up Internet | 0 | 0.0% |
| Broadband Home | 855 | 68.4% |
| Cellular Data Only | 99 | 7.9% |
| Satellite Internet | 79 | 6.3% |
| No Internet | 229 | 18.3% |
| Total | 1,249 | 100.0% |
Virden Summary
Virden, Illinois is a small town located in Macoupin County, Illinois. It is situated in the central part of the state, about 25 miles south of Springfield. The town was founded in 1854 and has a population of approximately 2,000 people.
History
Virden was founded in 1854 by a group of settlers from Ohio. The town was named after a local family, the Virdens, who had settled in the area in the early 1800s. The town was originally a farming community, but it soon developed into a small industrial center. The first industry in Virden was a sawmill, which was built in 1856. This was followed by a grist mill, a brickyard, and a woolen mill.
In the late 1800s, Virden experienced a period of growth and prosperity. The town was home to several businesses, including a bank, a hotel, a newspaper, and a variety of stores. The town also had a railroad station, which connected it to other towns in the area.
In the early 1900s, Virden experienced a period of decline. The railroad station closed in the 1920s, and many of the businesses in town closed as well. The population of the town decreased significantly during this time.
In the late 20th century, Virden experienced a period of revitalization. The town was designated as a National Historic District in 1978, and several of the historic buildings in town were restored. The town also experienced a population increase, as people moved to the area to take advantage of the town’s rural charm.
Geography
Virden is located in Macoupin County, Illinois. It is situated in the central part of the state, about 25 miles south of Springfield. The town is located in the Sangamon River Valley, and is surrounded by rolling hills and farmland.
The climate in Virden is typical of the Midwest. Summers are hot and humid, while winters are cold and snowy. The average annual temperature is around 50 degrees Fahrenheit.
Economy
The economy of Virden is largely based on agriculture. The town is home to several farms, which produce a variety of crops, including corn, soybeans, and wheat. The town also has a few small businesses, including a grocery store, a hardware store, and a few restaurants.
Demographics
As of the 2010 census, the population of Virden was 2,039. The racial makeup of the town was 97.3% White, 0.7% African American, 0.3% Native American, 0.2% Asian, and 1.5% from other races. The median household income was $41,250, and the median home value was $90,000.
Virden is a small town with a rich history and a strong sense of community. The town is home to a variety of businesses, and its residents enjoy a rural lifestyle. The town is a great place to live, work, and raise a family.
Common Questions
What is Per Capita Income in Virden?
Per Capita income in Virden is $31,297.
What is the Median Family Income in Virden?
Median Family Income in Virden is $87,617.
What is the Median Household income in Virden?
Median Household Income in Virden is $70,292.
What is Income or Wage Gap in Virden?
Income or Wage Gap in Virden is 37.5%.
Women in Virden earn 62.5 cents for every dollar earned by a man.
What is Inequality or Gini Index in Virden?
Inequality or Gini Index in Virden is 0.38.
What is the Total Population of Virden?
Total Population of Virden is 3,208.
What is the Total Male Population of Virden?
Total Male Population of Virden is 1,357.
What is the Total Female Population of Virden?
Total Female Population of Virden is 1,851.
What is the Ratio of Males per 100 Females in Virden?
There are 73.31 Males per 100 Females in Virden.
What is the Ratio of Females per 100 Males in Virden?
There are 136.40 Females per 100 Males in Virden.
What is the Median Population Age in Virden?
Median Population Age in Virden is 39.3 Years.
What is the Average Family Size in Virden
Average Family Size in Virden is 3.2 People.
What is the Average Household Size in Virden
Average Household Size in Virden is 2.5 People.
How Large is the Labor Force in Virden?
There are 1,536 People in the Labor Forcein in Virden.
What is the Percentage of People in the Labor Force in Virden?
57.2% of People are in the Labor Force in Virden.
What is the Unemployment Rate in Virden?
Unemployment Rate in Virden is 6.9%.