Tennessee, IL Map & Demographics
Tennessee Map
Tennessee Overview
$28,991
PER CAPITA INCOME
$58,333
AVG FAMILY INCOME
$61,250
AVG HOUSEHOLD INCOME
11.0%
WAGE / INCOME GAP [ % ]
89.0¢/ $1
WAGE / INCOME GAP [ $ ]
0.33
INEQUALITY / GINI INDEX
119
TOTAL POPULATION
59
MALE POPULATION
60
FEMALE POPULATION
98.33
MALES / 100 FEMALES
101.69
FEMALES / 100 MALES
39.2
MEDIAN AGE
2.4
AVG FAMILY SIZE
2.1
AVG HOUSEHOLD SIZE
79
LABOR FORCE [ PEOPLE ]
82.3%
PERCENT IN LABOR FORCE
8.9%
UNEMPLOYMENT RATE
Tennessee Zip Codes
Tennessee Area Codes
Income in Tennessee
Income Overview in Tennessee
Per Capita Income in Tennessee is $28,991, while median incomes of families and households are $58,333 and $61,250 respectively.
| Characteristic | Number | Measure |
| Per Capita Income | 119 | $28,991 |
| Median Family Income | 26 | $58,333 |
| Mean Family Income | 26 | $65,258 |
| Median Household Income | 57 | $61,250 |
| Mean Household Income | 57 | $61,514 |
| Income Deficit | 26 | $0 |
| Wage / Income Gap (%) | 119 | 11.03% |
| Wage / Income Gap ($) | 119 | 88.97¢ per $1 |
| Gini / Inequality Index | 119 | 0.33 |
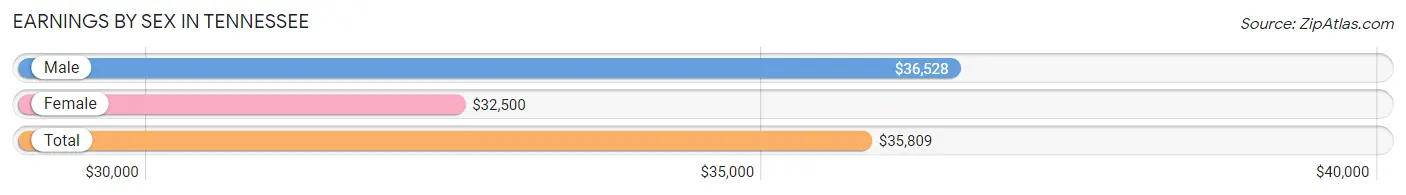
Earnings by Sex in Tennessee
Average Earnings in Tennessee are $35,809, $36,528 for men and $32,500 for women, a difference of 11.0%.
| Sex | Number | Average Earnings |
| Male | 39 (49.4%) | $36,528 |
| Female | 40 (50.6%) | $32,500 |
| Total | 79 (100.0%) | $35,809 |
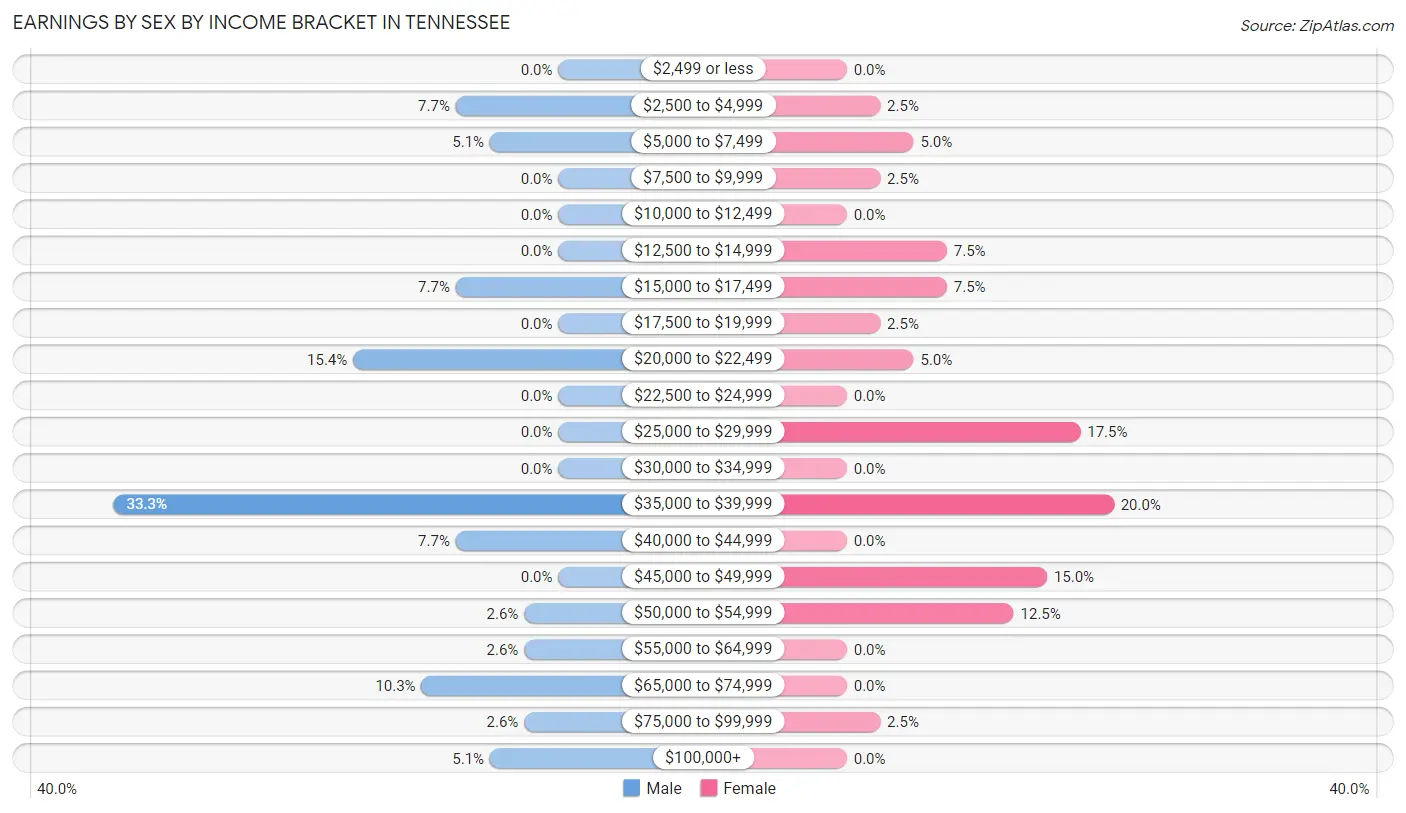
Earnings by Sex by Income Bracket in Tennessee
The most common earnings brackets in Tennessee are $35,000 to $39,999 for men (13 | 33.3%) and $35,000 to $39,999 for women (8 | 20.0%).
| Income | Male | Female |
| $2,499 or less | 0 (0.0%) | 0 (0.0%) |
| $2,500 to $4,999 | 3 (7.7%) | 1 (2.5%) |
| $5,000 to $7,499 | 2 (5.1%) | 2 (5.0%) |
| $7,500 to $9,999 | 0 (0.0%) | 1 (2.5%) |
| $10,000 to $12,499 | 0 (0.0%) | 0 (0.0%) |
| $12,500 to $14,999 | 0 (0.0%) | 3 (7.5%) |
| $15,000 to $17,499 | 3 (7.7%) | 3 (7.5%) |
| $17,500 to $19,999 | 0 (0.0%) | 1 (2.5%) |
| $20,000 to $22,499 | 6 (15.4%) | 2 (5.0%) |
| $22,500 to $24,999 | 0 (0.0%) | 0 (0.0%) |
| $25,000 to $29,999 | 0 (0.0%) | 7 (17.5%) |
| $30,000 to $34,999 | 0 (0.0%) | 0 (0.0%) |
| $35,000 to $39,999 | 13 (33.3%) | 8 (20.0%) |
| $40,000 to $44,999 | 3 (7.7%) | 0 (0.0%) |
| $45,000 to $49,999 | 0 (0.0%) | 6 (15.0%) |
| $50,000 to $54,999 | 1 (2.6%) | 5 (12.5%) |
| $55,000 to $64,999 | 1 (2.6%) | 0 (0.0%) |
| $65,000 to $74,999 | 4 (10.3%) | 0 (0.0%) |
| $75,000 to $99,999 | 1 (2.6%) | 1 (2.5%) |
| $100,000+ | 2 (5.1%) | 0 (0.0%) |
| Total | 39 (100.0%) | 40 (100.0%) |
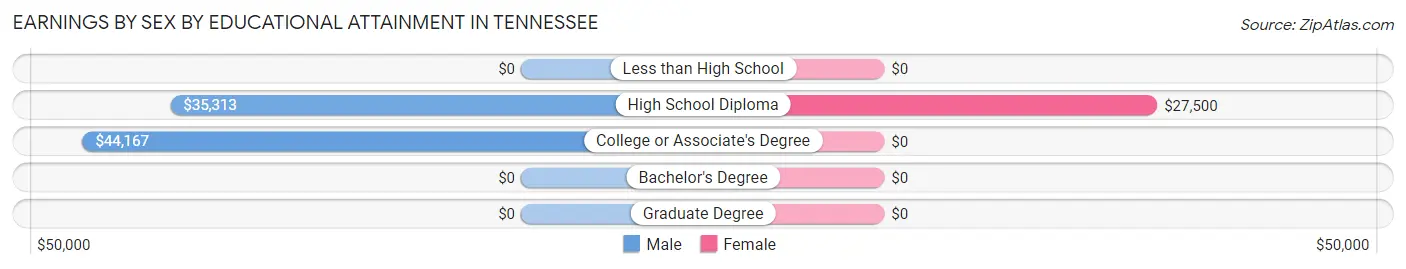
Earnings by Sex by Educational Attainment in Tennessee
| Educational Attainment | Male Income | Female Income |
| Less than High School | - | - |
| High School Diploma | $35,313 | $27,500 |
| College or Associate's Degree | $44,167 | $0 |
| Bachelor's Degree | - | - |
| Graduate Degree | - | - |
| Total | $36,528 | $0 |
Family Income in Tennessee
Family Income Brackets in Tennessee
According to the Tennessee family income data, there are 11 families falling into the $35,000 to $49,999 income range, which is the most common income bracket and makes up 42.3% of all families.
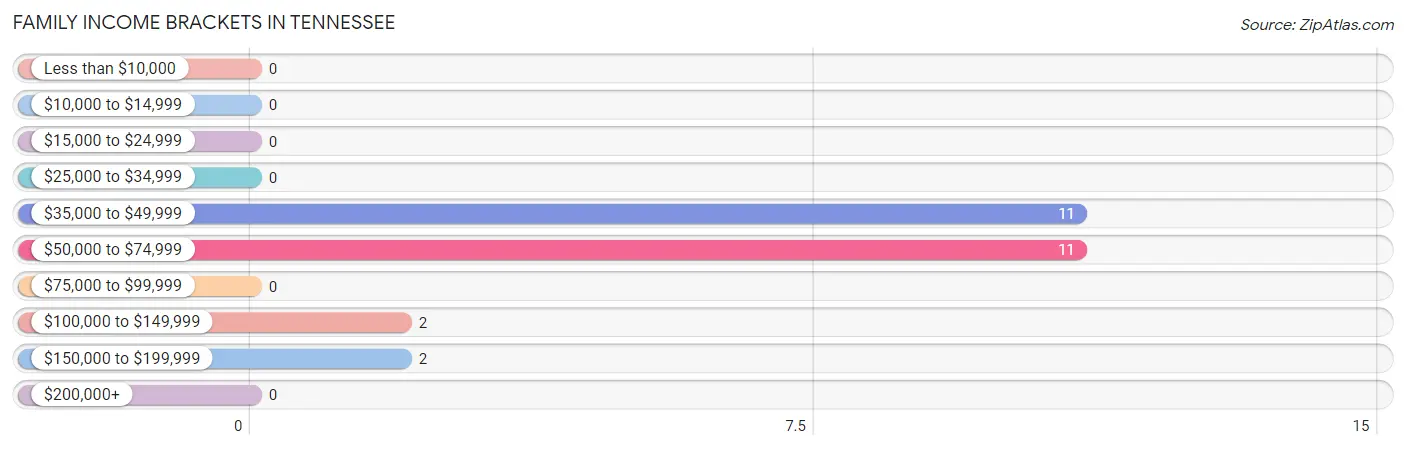
| Income Bracket | # Families | % Families |
| Less than $10,000 | 0 | 0.0% |
| $10,000 to $14,999 | 0 | 0.0% |
| $15,000 to $24,999 | 0 | 0.0% |
| $25,000 to $34,999 | 0 | 0.0% |
| $35,000 to $49,999 | 11 | 42.3% |
| $50,000 to $74,999 | 11 | 42.3% |
| $75,000 to $99,999 | 0 | 0.0% |
| $100,000 to $149,999 | 2 | 7.7% |
| $150,000 to $199,999 | 2 | 7.7% |
| $200,000+ | 0 | 0.0% |
Family Income by Famaliy Size in Tennessee
2-person families (20 | 76.9%) account for the highest median family income in Tennessee with $41,250 per family, while 2-person families (20 | 76.9%) have the highest median income of $20,625 per family member.
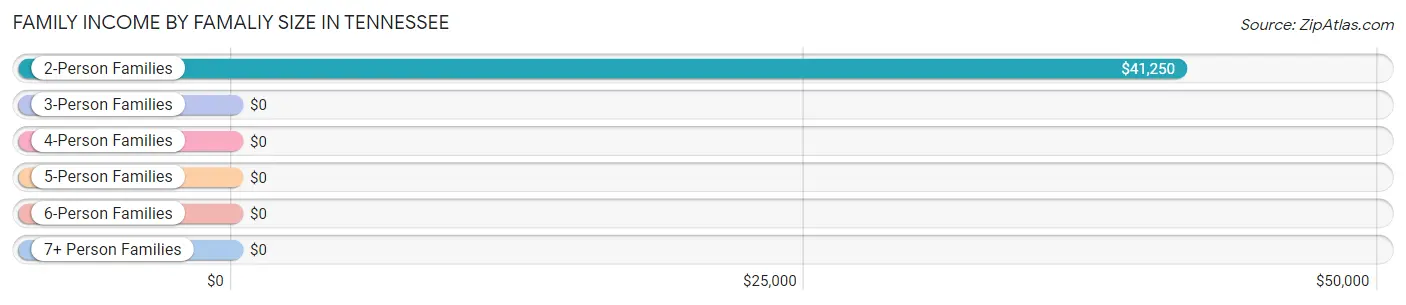
| Income Bracket | # Families | Median Income |
| 2-Person Families | 20 (76.9%) | $41,250 |
| 3-Person Families | 0 (0.0%) | $0 |
| 4-Person Families | 5 (19.2%) | $0 |
| 5-Person Families | 1 (3.8%) | $0 |
| 6-Person Families | 0 (0.0%) | $0 |
| 7+ Person Families | 0 (0.0%) | $0 |
| Total | 26 (100.0%) | $58,333 |
Family Income by Number of Earners in Tennessee
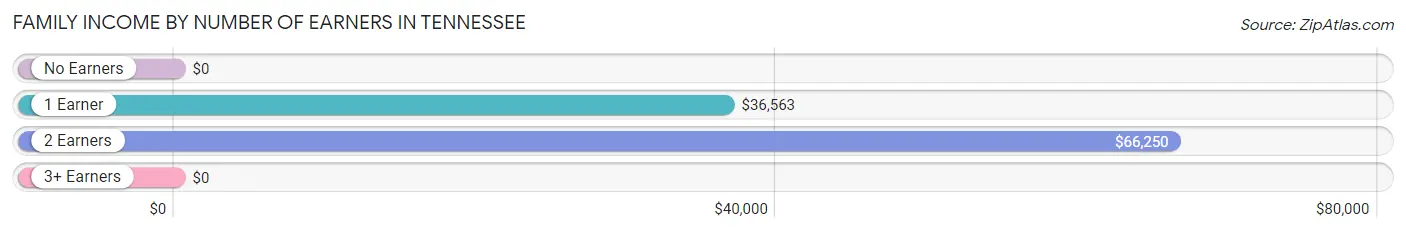
| Number of Earners | # Families | Median Income |
| No Earners | 2 (7.7%) | $0 |
| 1 Earner | 10 (38.5%) | $36,563 |
| 2 Earners | 14 (53.8%) | $66,250 |
| 3+ Earners | 0 (0.0%) | $0 |
| Total | 26 (100.0%) | $58,333 |
Household Income in Tennessee
Household Income Brackets in Tennessee
With 13 households falling in the category, the $50,000 to $74,999 income range is the most frequent in Tennessee, accounting for 22.8% of all households.
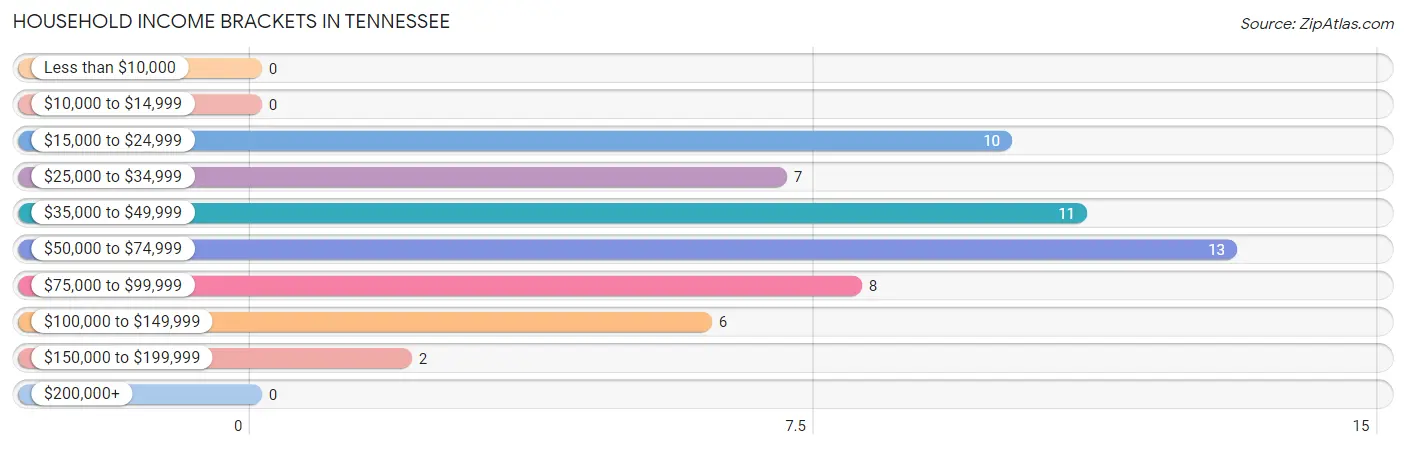
| Income Bracket | # Households | % Households |
| Less than $10,000 | 0 | 0.0% |
| $10,000 to $14,999 | 0 | 0.0% |
| $15,000 to $24,999 | 10 | 17.5% |
| $25,000 to $34,999 | 7 | 12.3% |
| $35,000 to $49,999 | 11 | 19.3% |
| $50,000 to $74,999 | 13 | 22.8% |
| $75,000 to $99,999 | 8 | 14.0% |
| $100,000 to $149,999 | 6 | 10.5% |
| $150,000 to $199,999 | 2 | 3.5% |
| $200,000+ | 0 | 0.0% |
Household Income by Householder Age in Tennessee
The median household income in Tennessee is $61,250, with the highest median household income of $72,083 found in the 25 to 44 years age bracket for the primary householder. A total of 13 households (22.8%) fall into this category. Meanwhile, the 15 to 24 years age bracket for the primary householder has the lowest median household income of $0, with 8 households (14.0%) in this group.
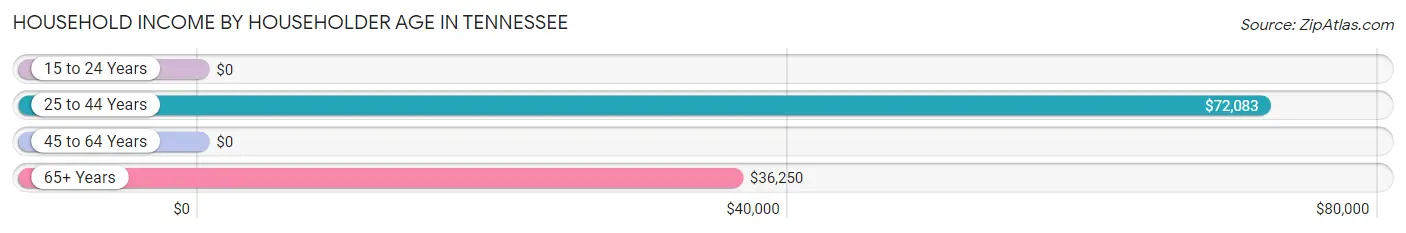
| Income Bracket | # Households | Median Income |
| 15 to 24 Years | 8 (14.0%) | $0 |
| 25 to 44 Years | 13 (22.8%) | $72,083 |
| 45 to 64 Years | 26 (45.6%) | $0 |
| 65+ Years | 10 (17.5%) | $36,250 |
| Total | 57 (100.0%) | $61,250 |
Poverty in Tennessee
Income Below Poverty by Sex and Age in Tennessee
With 10.2% poverty level for males and 5.3% for females among the residents of Tennessee, 15 year old males and 35 to 44 year old females are the most vulnerable to poverty, with 3 males (100.0%) and 3 females (21.4%) in their respective age groups living below the poverty level.
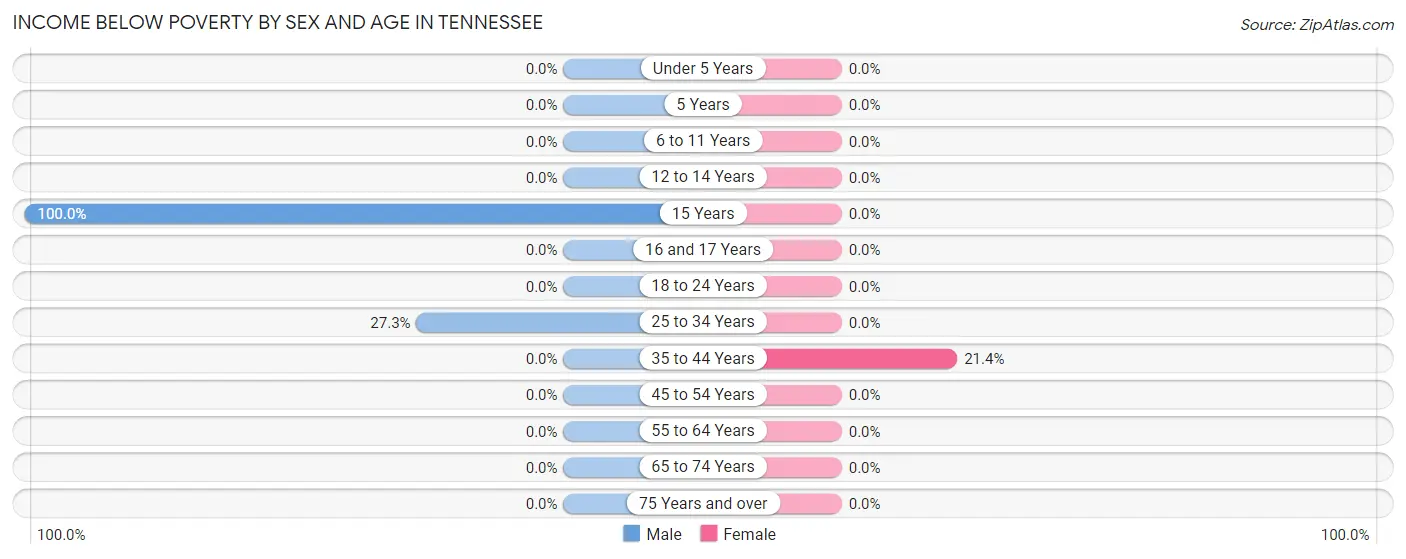
| Age Bracket | Male | Female |
| Under 5 Years | 0 (0.0%) | 0 (0.0%) |
| 5 Years | 0 (0.0%) | 0 (0.0%) |
| 6 to 11 Years | 0 (0.0%) | 0 (0.0%) |
| 12 to 14 Years | 0 (0.0%) | 0 (0.0%) |
| 15 Years | 3 (100.0%) | 0 (0.0%) |
| 16 and 17 Years | 0 (0.0%) | 0 (0.0%) |
| 18 to 24 Years | 0 (0.0%) | 0 (0.0%) |
| 25 to 34 Years | 3 (27.3%) | 0 (0.0%) |
| 35 to 44 Years | 0 (0.0%) | 3 (21.4%) |
| 45 to 54 Years | 0 (0.0%) | 0 (0.0%) |
| 55 to 64 Years | 0 (0.0%) | 0 (0.0%) |
| 65 to 74 Years | 0 (0.0%) | 0 (0.0%) |
| 75 Years and over | 0 (0.0%) | 0 (0.0%) |
| Total | 6 (10.2%) | 3 (5.3%) |
Income Above Poverty by Sex and Age in Tennessee
According to the poverty statistics in Tennessee, males aged under 5 years and females aged under 5 years are the age groups that are most secure financially, with 100.0% of males and 100.0% of females in these age groups living above the poverty line.
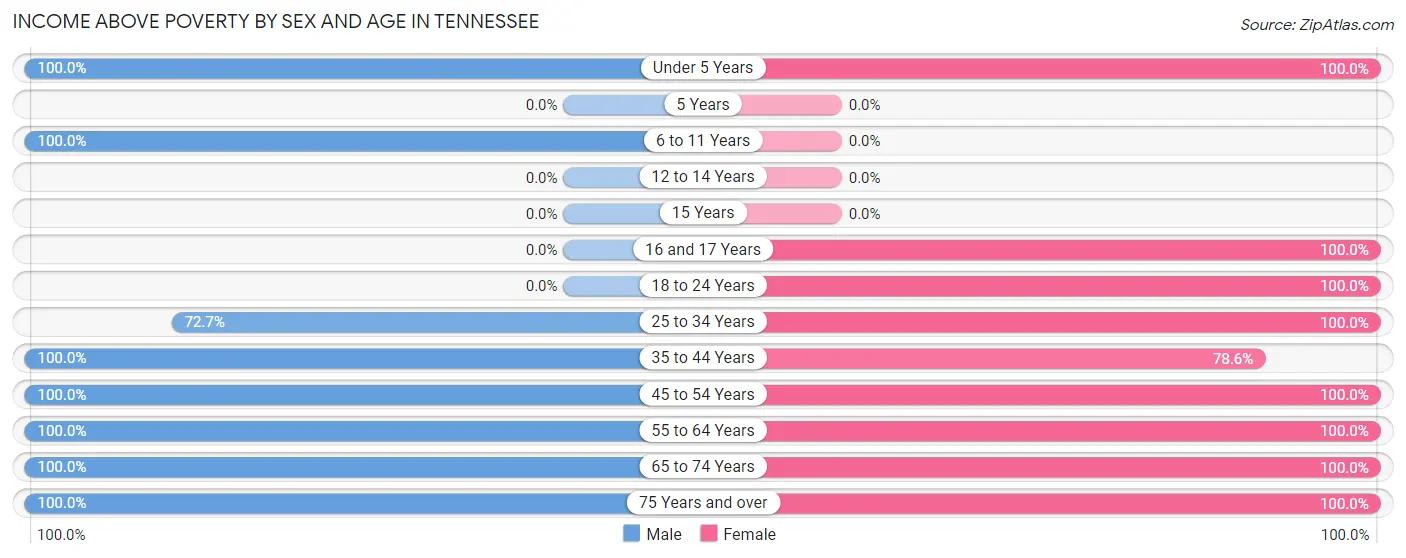
| Age Bracket | Male | Female |
| Under 5 Years | 10 (100.0%) | 4 (100.0%) |
| 5 Years | 0 (0.0%) | 0 (0.0%) |
| 6 to 11 Years | 3 (100.0%) | 0 (0.0%) |
| 12 to 14 Years | 0 (0.0%) | 0 (0.0%) |
| 15 Years | 0 (0.0%) | 0 (0.0%) |
| 16 and 17 Years | 0 (0.0%) | 3 (100.0%) |
| 18 to 24 Years | 0 (0.0%) | 8 (100.0%) |
| 25 to 34 Years | 8 (72.7%) | 8 (100.0%) |
| 35 to 44 Years | 4 (100.0%) | 11 (78.6%) |
| 45 to 54 Years | 15 (100.0%) | 5 (100.0%) |
| 55 to 64 Years | 8 (100.0%) | 7 (100.0%) |
| 65 to 74 Years | 3 (100.0%) | 3 (100.0%) |
| 75 Years and over | 2 (100.0%) | 5 (100.0%) |
| Total | 53 (89.8%) | 54 (94.7%) |
Income Below Poverty Among Married-Couple Families in Tennessee
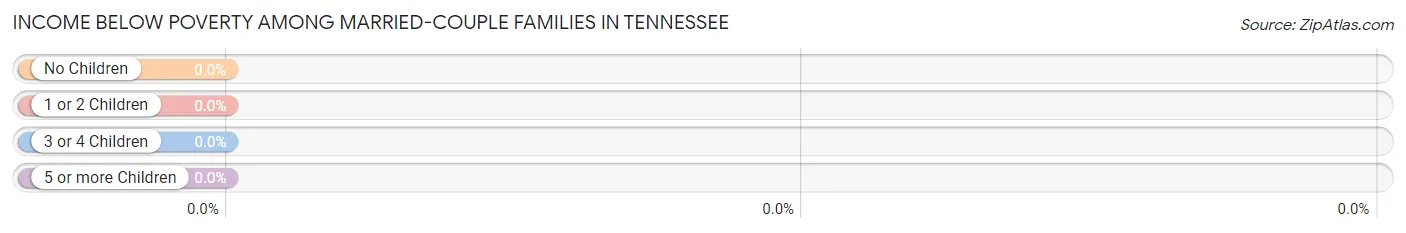
| Children | Above Poverty | Below Poverty |
| No Children | 6 (100.0%) | 0 (0.0%) |
| 1 or 2 Children | 5 (100.0%) | 0 (0.0%) |
| 3 or 4 Children | 1 (100.0%) | 0 (0.0%) |
| 5 or more Children | 0 (0.0%) | 0 (0.0%) |
| Total | 12 (100.0%) | 0 (0.0%) |
Income Below Poverty Among Single-Parent Households in Tennessee
| Children | Single Father | Single Mother |
| No Children | 0 (0.0%) | 0 (0.0%) |
| 1 or 2 Children | 0 (0.0%) | 0 (0.0%) |
| 3 or 4 Children | 0 (0.0%) | 0 (0.0%) |
| 5 or more Children | 0 (0.0%) | 0 (0.0%) |
| Total | 0 (0.0%) | 0 (0.0%) |
Income Below Poverty Among Married-Couple vs Single-Parent Households in Tennessee
| Children | Married-Couple Families | Single-Parent Households |
| No Children | 0 (0.0%) | 0 (0.0%) |
| 1 or 2 Children | 0 (0.0%) | 0 (0.0%) |
| 3 or 4 Children | 0 (0.0%) | 0 (0.0%) |
| 5 or more Children | 0 (0.0%) | 0 (0.0%) |
| Total | 0 (0.0%) | 0 (0.0%) |
Race in Tennessee
The most populous races in Tennessee are , and White / Caucasian (119 | 100.0%).
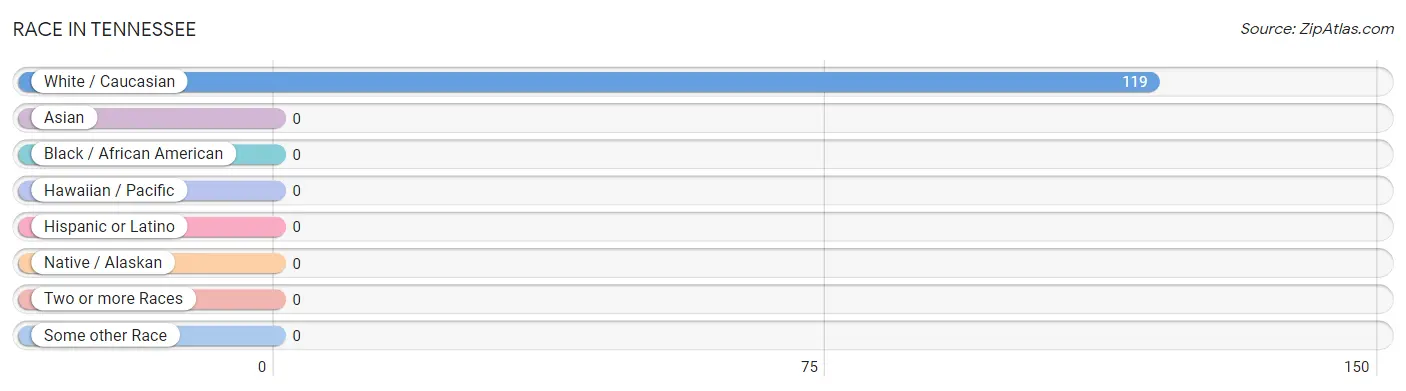
| Race | # Population | % Population |
| Asian | 0 | 0.0% |
| Black / African American | 0 | 0.0% |
| Hawaiian / Pacific | 0 | 0.0% |
| Hispanic or Latino | 0 | 0.0% |
| Native / Alaskan | 0 | 0.0% |
| White / Caucasian | 119 | 100.0% |
| Two or more Races | 0 | 0.0% |
| Some other Race | 0 | 0.0% |
| Total | 119 | 100.0% |
Ancestry in Tennessee
The most populous ancestries reported in Tennessee are German (28 | 23.5%), American (21 | 17.6%), Irish (19 | 16.0%), English (16 | 13.5%), and Arab (7 | 5.9%), together accounting for 76.5% of all Tennessee residents.
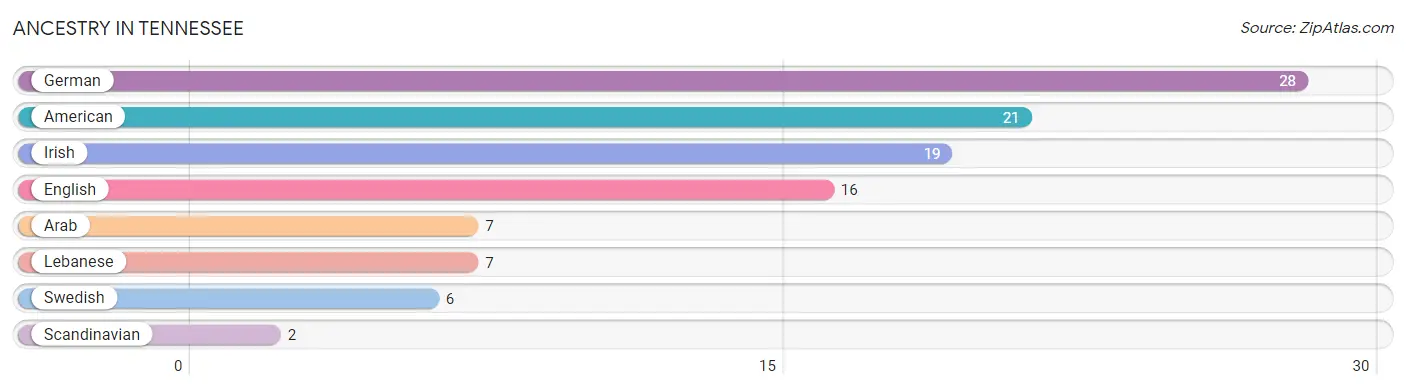
| Ancestry | # Population | % Population |
| American | 21 | 17.6% |
| Arab | 7 | 5.9% |
| English | 16 | 13.5% |
| German | 28 | 23.5% |
| Irish | 19 | 16.0% |
| Lebanese | 7 | 5.9% |
| Scandinavian | 2 | 1.7% |
| Swedish | 6 | 5.0% | View All 8 Rows |
Immigrants in Tennessee

| Immigration Origin | # Population | % Population | View All 0 Rows |
Sex and Age in Tennessee
Sex and Age in Tennessee
The most populous age groups in Tennessee are 25 to 29 Years (11 | 18.6%) for men and 20 to 24 Years (8 | 13.3%) for women.
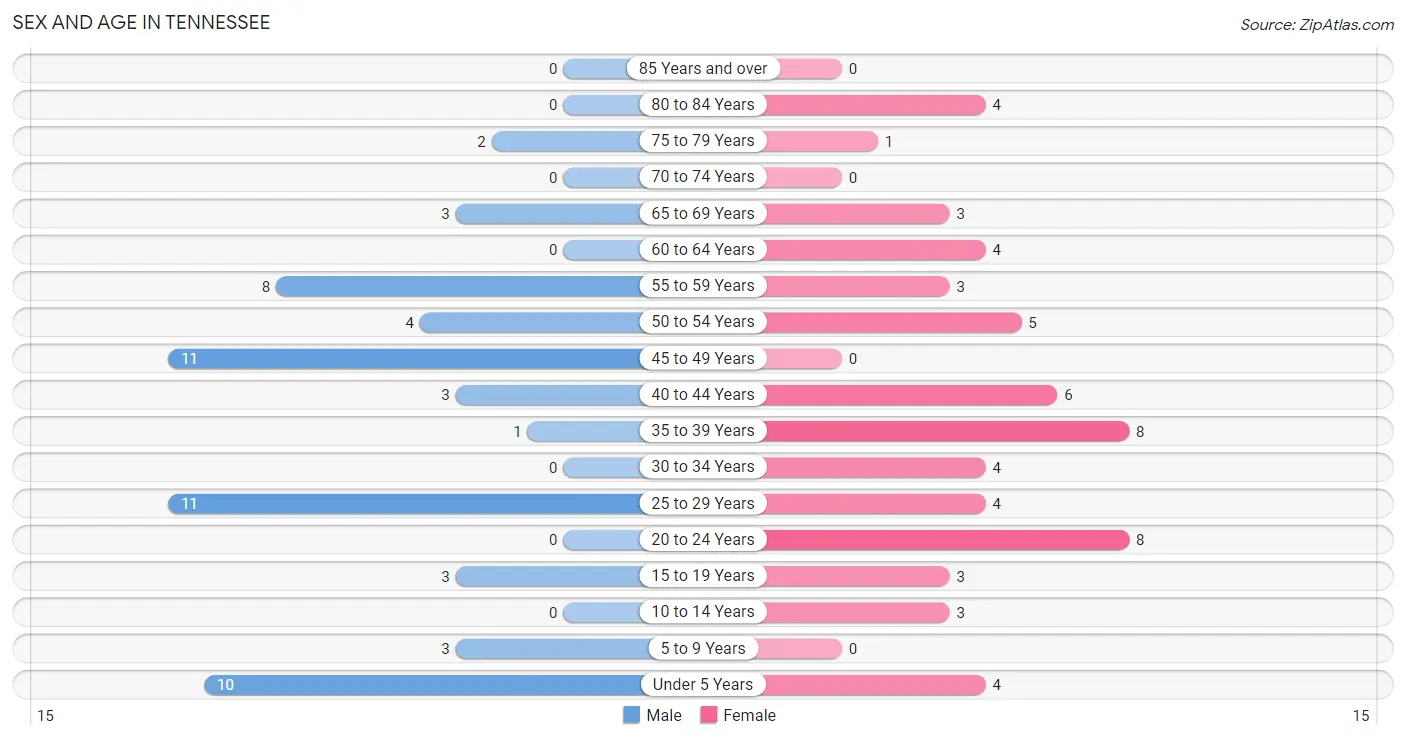
| Age Bracket | Male | Female |
| Under 5 Years | 10 (17.0%) | 4 (6.7%) |
| 5 to 9 Years | 3 (5.1%) | 0 (0.0%) |
| 10 to 14 Years | 0 (0.0%) | 3 (5.0%) |
| 15 to 19 Years | 3 (5.1%) | 3 (5.0%) |
| 20 to 24 Years | 0 (0.0%) | 8 (13.3%) |
| 25 to 29 Years | 11 (18.6%) | 4 (6.7%) |
| 30 to 34 Years | 0 (0.0%) | 4 (6.7%) |
| 35 to 39 Years | 1 (1.7%) | 8 (13.3%) |
| 40 to 44 Years | 3 (5.1%) | 6 (10.0%) |
| 45 to 49 Years | 11 (18.6%) | 0 (0.0%) |
| 50 to 54 Years | 4 (6.8%) | 5 (8.3%) |
| 55 to 59 Years | 8 (13.6%) | 3 (5.0%) |
| 60 to 64 Years | 0 (0.0%) | 4 (6.7%) |
| 65 to 69 Years | 3 (5.1%) | 3 (5.0%) |
| 70 to 74 Years | 0 (0.0%) | 0 (0.0%) |
| 75 to 79 Years | 2 (3.4%) | 1 (1.7%) |
| 80 to 84 Years | 0 (0.0%) | 4 (6.7%) |
| 85 Years and over | 0 (0.0%) | 0 (0.0%) |
| Total | 59 (100.0%) | 60 (100.0%) |
Families and Households in Tennessee
Median Family Size in Tennessee
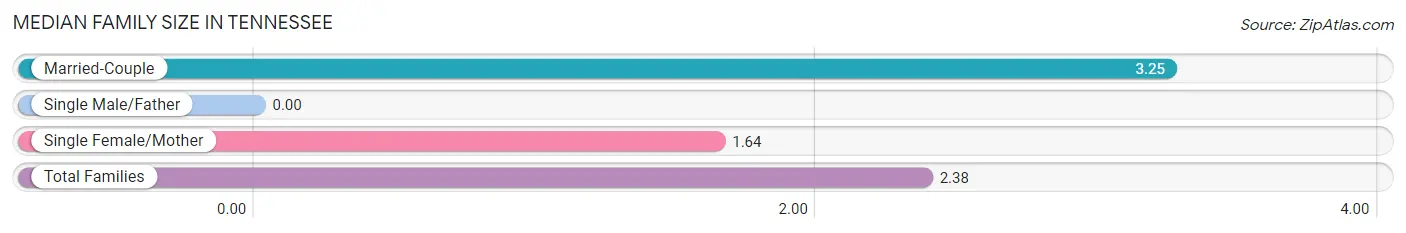
| Family Type | # Families | Family Size |
| Married-Couple | 12 (46.2%) | 3.25 |
| Single Male/Father | 0 (0.0%) | - |
| Single Female/Mother | 14 (53.8%) | 1.64 |
| Total Families | 26 (100.0%) | 2.38 |
Median Household Size in Tennessee
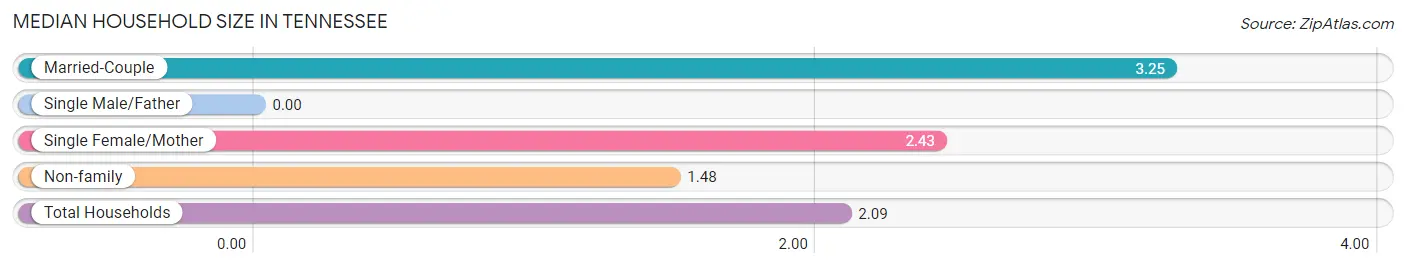
| Household Type | # Households | Household Size |
| Married-Couple | 12 (21.0%) | 3.25 |
| Single Male/Father | 0 (0.0%) | - |
| Single Female/Mother | 14 (24.6%) | 2.43 |
| Non-family | 31 (54.4%) | 1.48 |
| Total Households | 57 (100.0%) | 2.09 |
Household Size by Marriage Status in Tennessee
Out of a total of 57 households in Tennessee, 26 (45.6%) are family households, while 31 (54.4%) are nonfamily households. The most numerous type of family households are 3-person households, comprising 14, and the most common type of nonfamily households are 1-person households, comprising 23.
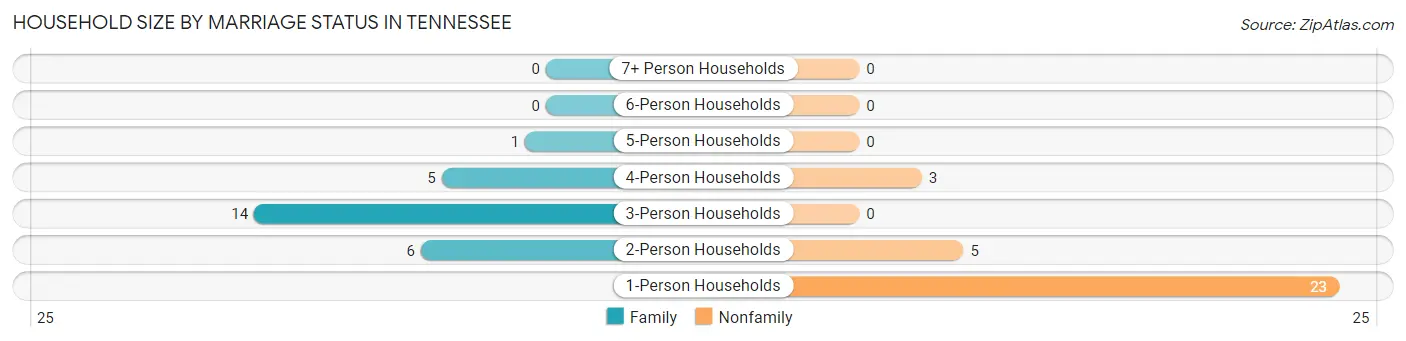
| Household Size | Family Households | Nonfamily Households |
| 1-Person Households | - | 23 (40.4%) |
| 2-Person Households | 6 (10.5%) | 5 (8.8%) |
| 3-Person Households | 14 (24.6%) | 0 (0.0%) |
| 4-Person Households | 5 (8.8%) | 3 (5.3%) |
| 5-Person Households | 1 (1.8%) | 0 (0.0%) |
| 6-Person Households | 0 (0.0%) | 0 (0.0%) |
| 7+ Person Households | 0 (0.0%) | 0 (0.0%) |
| Total | 26 (45.6%) | 31 (54.4%) |
Female Fertility in Tennessee
Fertility by Age in Tennessee
Average fertility rate in Tennessee is 86.0 births per 1,000 women. Women in the age bracket of 20 to 34 years have the highest fertility rate with 188.0 births per 1,000 women. Women in the age bracket of 20 to 34 years acount for 100.0% of all women with births.
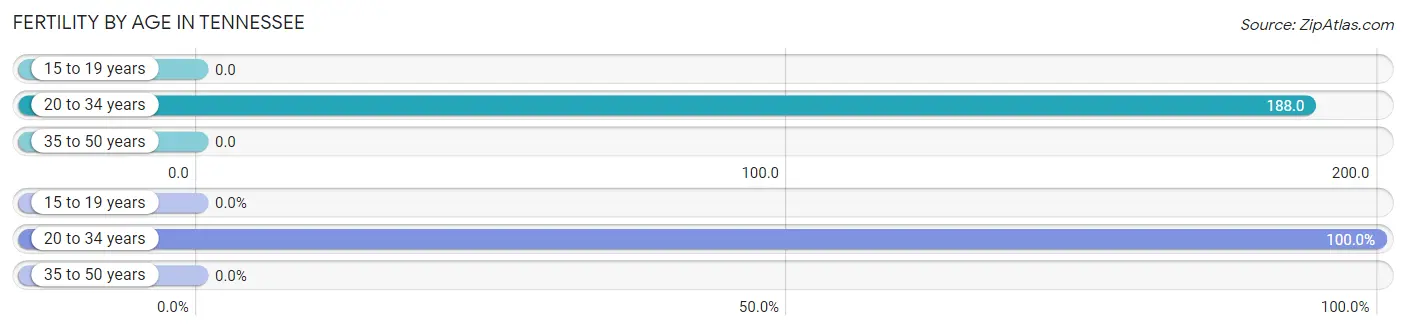
| Age Bracket | Women with Births | Births / 1,000 Women |
| 15 to 19 years | 0 (0.0%) | 0.0 |
| 20 to 34 years | 3 (100.0%) | 188.0 |
| 35 to 50 years | 0 (0.0%) | 0.0 |
| Total | 3 (100.0%) | 86.0 |
Fertility by Age by Marriage Status in Tennessee
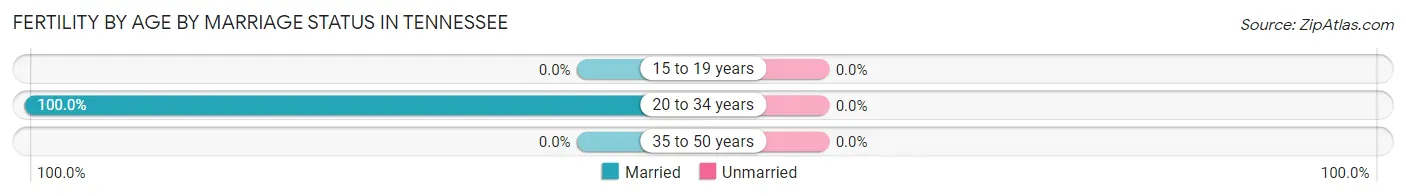
| Age Bracket | Married | Unmarried |
| 15 to 19 years | 0 (0.0%) | 0 (0.0%) |
| 20 to 34 years | 3 (100.0%) | 0 (0.0%) |
| 35 to 50 years | 0 (0.0%) | 0 (0.0%) |
| Total | 3 (100.0%) | 0 (0.0%) |
Fertility by Education in Tennessee
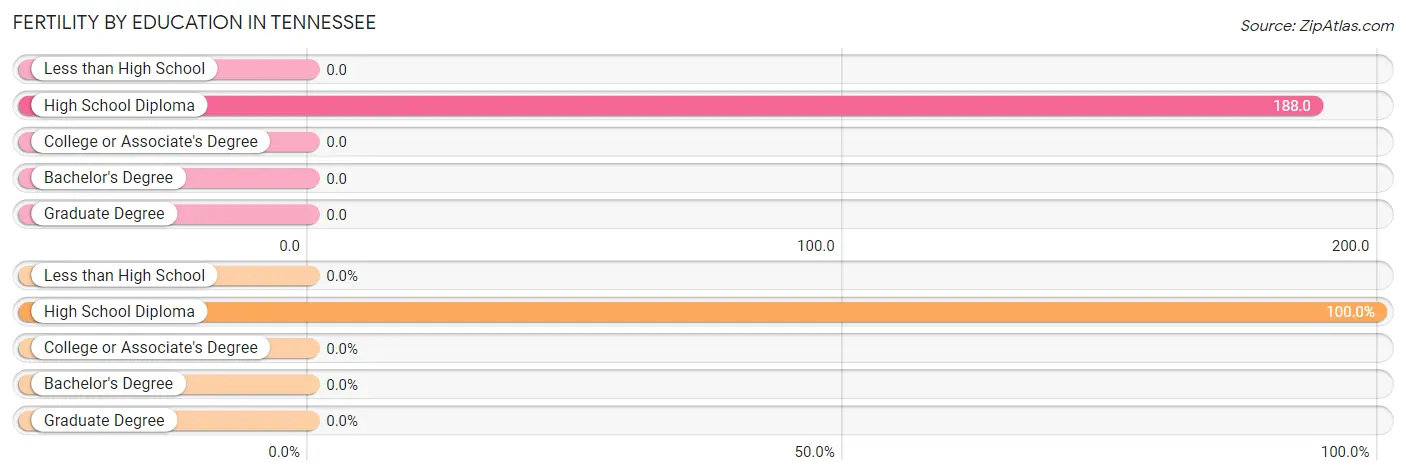
| Educational Attainment | Women with Births | Births / 1,000 Women |
| Less than High School | 0 (0.0%) | 0.0 |
| High School Diploma | 3 (100.0%) | 188.0 |
| College or Associate's Degree | 0 (0.0%) | 0.0 |
| Bachelor's Degree | 0 (0.0%) | 0.0 |
| Graduate Degree | 0 (0.0%) | 0.0 |
| Total | 3 (100.0%) | 86.0 |
Fertility by Education by Marriage Status in Tennessee
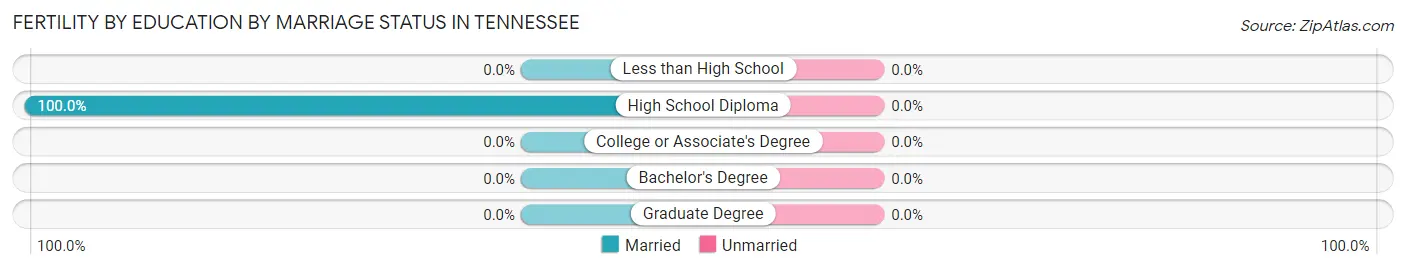
| Educational Attainment | Married | Unmarried |
| Less than High School | 0 (0.0%) | 0 (0.0%) |
| High School Diploma | 3 (100.0%) | 0 (0.0%) |
| College or Associate's Degree | 0 (0.0%) | 0 (0.0%) |
| Bachelor's Degree | 0 (0.0%) | 0 (0.0%) |
| Graduate Degree | 0 (0.0%) | 0 (0.0%) |
| Total | 3 (100.0%) | 0 (0.0%) |
Employment Characteristics in Tennessee
Employment by Class of Employer in Tennessee
Among the 72 employed individuals in Tennessee, private company employees (48 | 66.7%), self-employed (not incorporated) (9 | 12.5%), and local government employees (8 | 11.1%) make up the most common classes of employment.
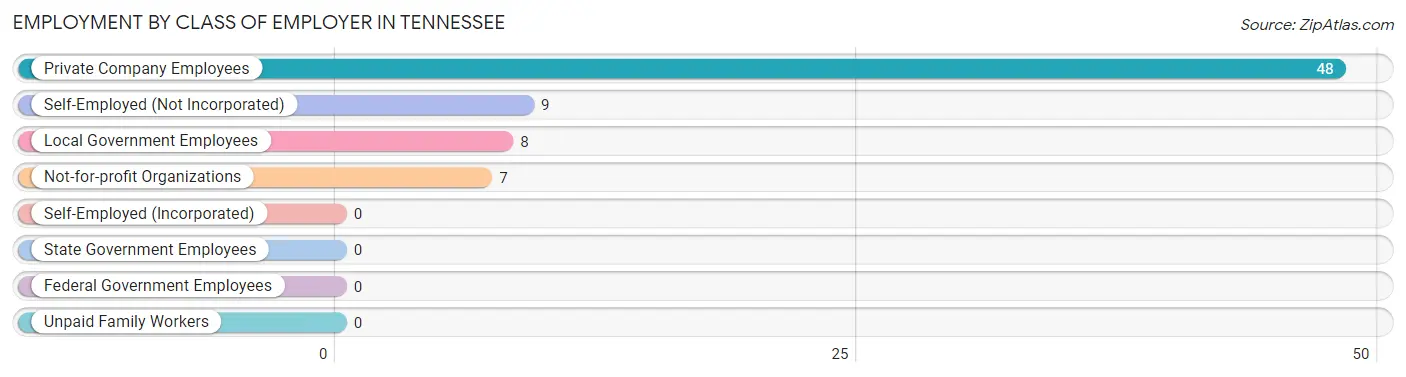
| Employer Class | # Employees | % Employees |
| Private Company Employees | 48 | 66.7% |
| Self-Employed (Incorporated) | 0 | 0.0% |
| Self-Employed (Not Incorporated) | 9 | 12.5% |
| Not-for-profit Organizations | 7 | 9.7% |
| Local Government Employees | 8 | 11.1% |
| State Government Employees | 0 | 0.0% |
| Federal Government Employees | 0 | 0.0% |
| Unpaid Family Workers | 0 | 0.0% |
| Total | 72 | 100.0% |
Employment Status by Age in Tennessee
According to the labor force statistics for Tennessee, out of the total population over 16 years of age (96), 82.3% or 79 individuals are in the labor force, with 8.9% or 7 of them unemployed. The age group with the highest labor force participation rate is 16 to 19 years, with 100.0% or 3 individuals in the labor force. Within the labor force, the 45 to 54 years age range has the highest percentage of unemployed individuals, with 43.8% or 7 of them being unemployed.
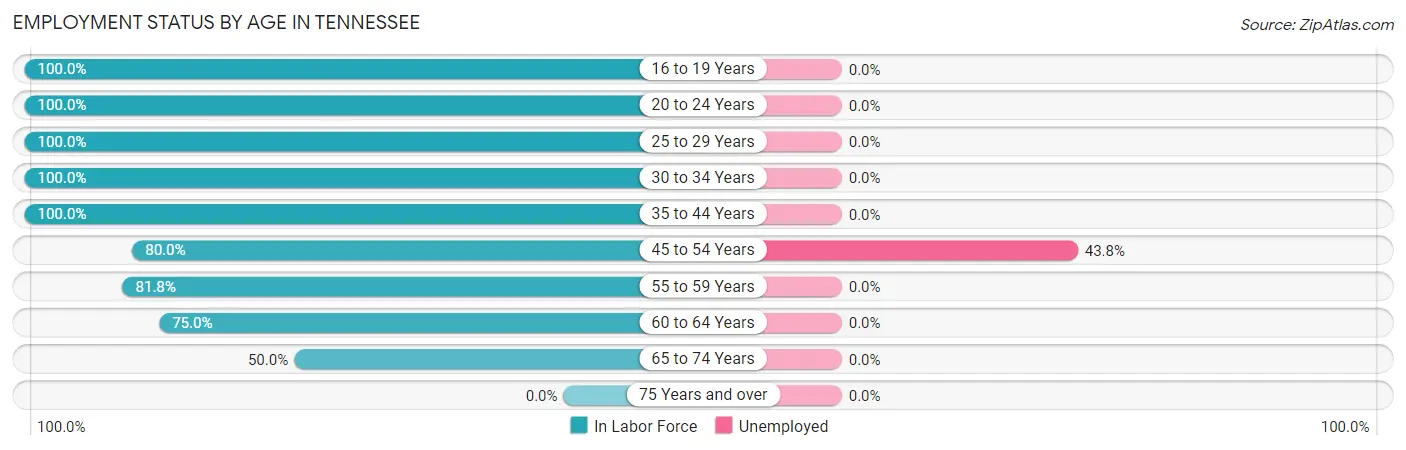
| Age Bracket | In Labor Force | Unemployed |
| 16 to 19 Years | 3 (100.0%) | 0 (0.0%) |
| 20 to 24 Years | 8 (100.0%) | 0 (0.0%) |
| 25 to 29 Years | 15 (100.0%) | 0 (0.0%) |
| 30 to 34 Years | 4 (100.0%) | 0 (0.0%) |
| 35 to 44 Years | 18 (100.0%) | 0 (0.0%) |
| 45 to 54 Years | 16 (80.0%) | 7 (43.8%) |
| 55 to 59 Years | 9 (81.8%) | 0 (0.0%) |
| 60 to 64 Years | 3 (75.0%) | 0 (0.0%) |
| 65 to 74 Years | 3 (50.0%) | 0 (0.0%) |
| 75 Years and over | 0 (0.0%) | 0 (0.0%) |
| Total | 79 (82.3%) | 7 (8.9%) |
Employment Status by Educational Attainment in Tennessee
According to labor force statistics for Tennessee, 90.3% of individuals (65) out of the total population between 25 and 64 years of age (72) are in the labor force, with 10.8% or 7 of them being unemployed. The group with the highest labor force participation rate are those with the educational attainment of high school diploma, with 100.0% or 38 individuals in the labor force. Within the labor force, individuals with college / associate degree education have the highest percentage of unemployment, with 31.8% or 7 of them being unemployed.
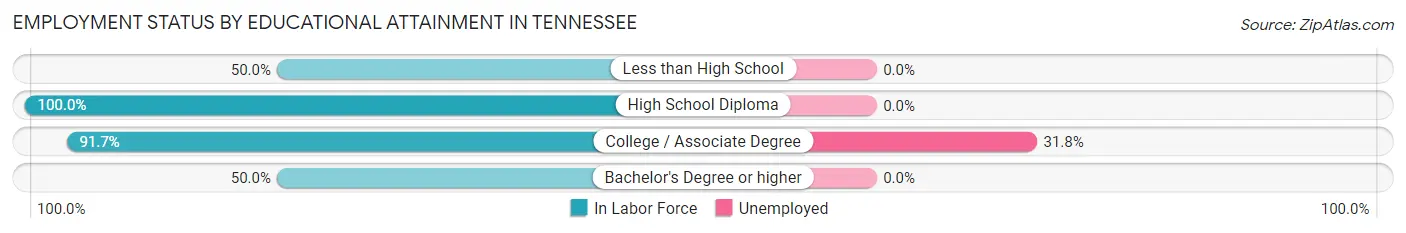
| Educational Attainment | In Labor Force | Unemployed |
| Less than High School | 4 (50.0%) | 0 (0.0%) |
| High School Diploma | 38 (100.0%) | 0 (0.0%) |
| College / Associate Degree | 22 (91.7%) | 8 (31.8%) |
| Bachelor's Degree or higher | 1 (50.0%) | 0 (0.0%) |
| Total | 65 (90.3%) | 8 (10.8%) |
Employment Occupations by Sex in Tennessee
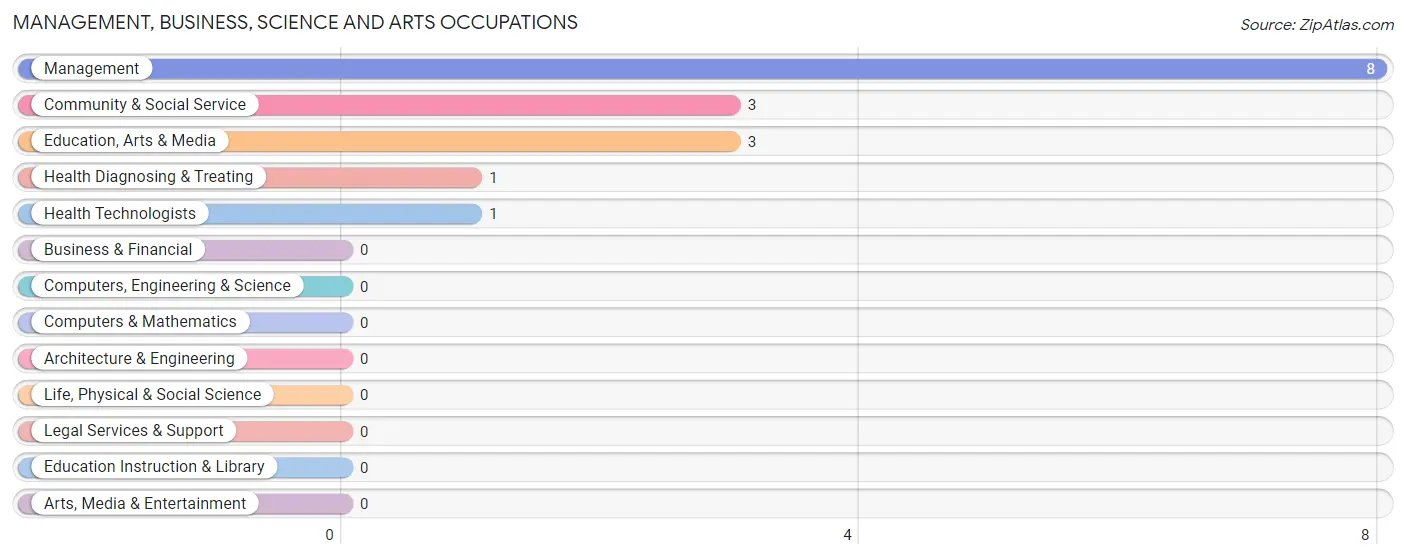
Management, Business, Science and Arts Occupations
The most common Management, Business, Science and Arts occupations in Tennessee are Management (8 | 11.1%), Community & Social Service (3 | 4.2%), Education, Arts & Media (3 | 4.2%), Health Diagnosing & Treating (1 | 1.4%), and Health Technologists (1 | 1.4%).
Management, Business, Science and Arts Occupations by Sex
Within the Management, Business, Science and Arts occupations in Tennessee, the most male-oriented occupations are Community & Social Service (33.3%), and Education, Arts & Media (33.3%), while the most female-oriented occupations are Management (100.0%), Health Diagnosing & Treating (100.0%), and Health Technologists (100.0%).
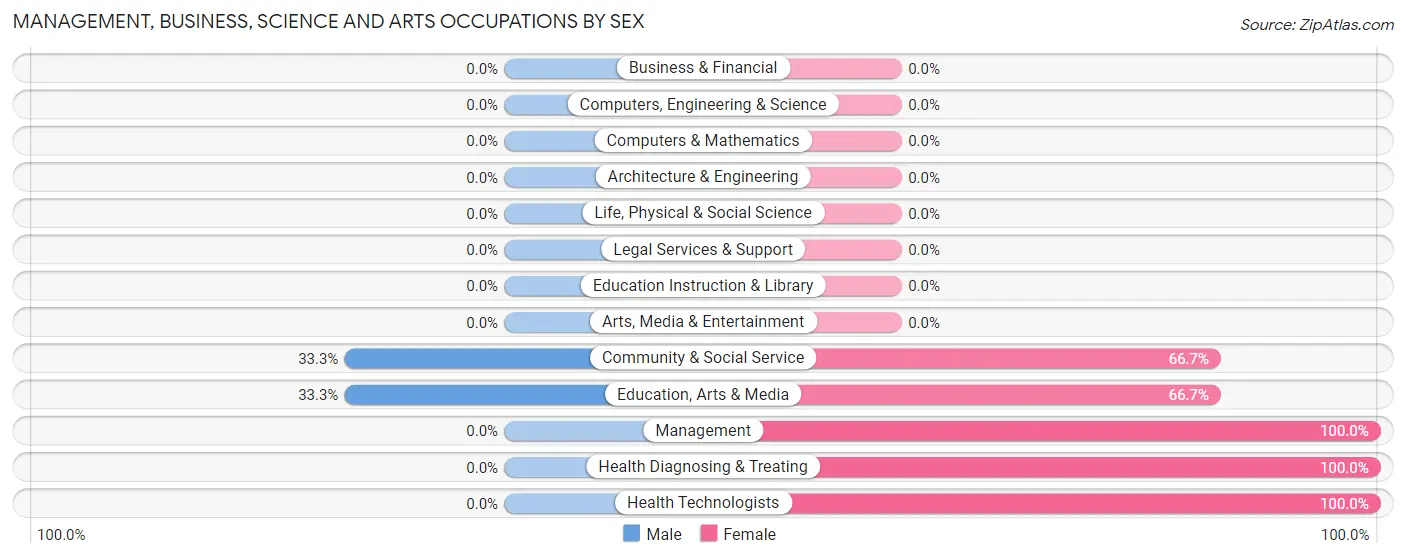
| Occupation | Male | Female |
| Management | 0 (0.0%) | 8 (100.0%) |
| Business & Financial | 0 (0.0%) | 0 (0.0%) |
| Computers, Engineering & Science | 0 (0.0%) | 0 (0.0%) |
| Computers & Mathematics | 0 (0.0%) | 0 (0.0%) |
| Architecture & Engineering | 0 (0.0%) | 0 (0.0%) |
| Life, Physical & Social Science | 0 (0.0%) | 0 (0.0%) |
| Community & Social Service | 1 (33.3%) | 2 (66.7%) |
| Education, Arts & Media | 1 (33.3%) | 2 (66.7%) |
| Legal Services & Support | 0 (0.0%) | 0 (0.0%) |
| Education Instruction & Library | 0 (0.0%) | 0 (0.0%) |
| Arts, Media & Entertainment | 0 (0.0%) | 0 (0.0%) |
| Health Diagnosing & Treating | 0 (0.0%) | 1 (100.0%) |
| Health Technologists | 0 (0.0%) | 1 (100.0%) |
| Total (Category) | 1 (8.3%) | 11 (91.7%) |
| Total (Overall) | 32 (44.4%) | 40 (55.6%) |
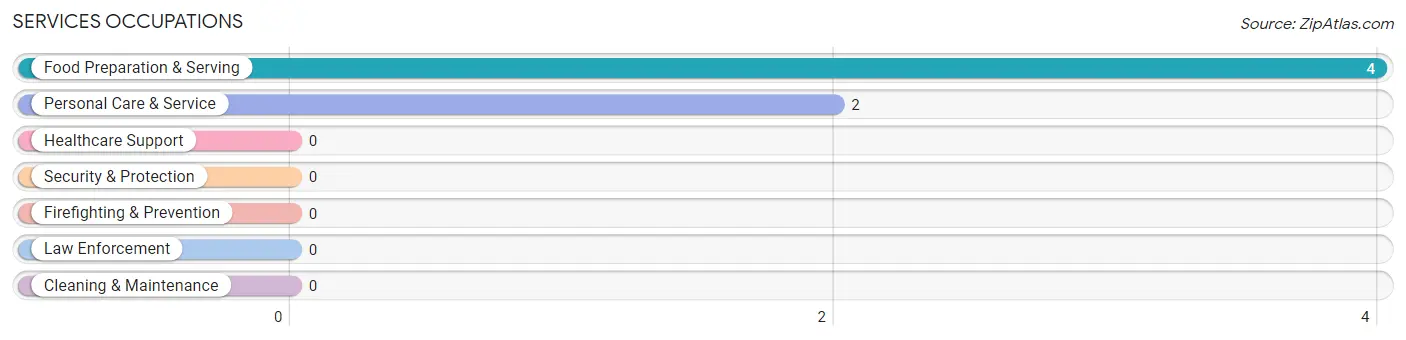
Services Occupations
The most common Services occupations in Tennessee are Food Preparation & Serving (4 | 5.6%), and Personal Care & Service (2 | 2.8%).
Services Occupations by Sex
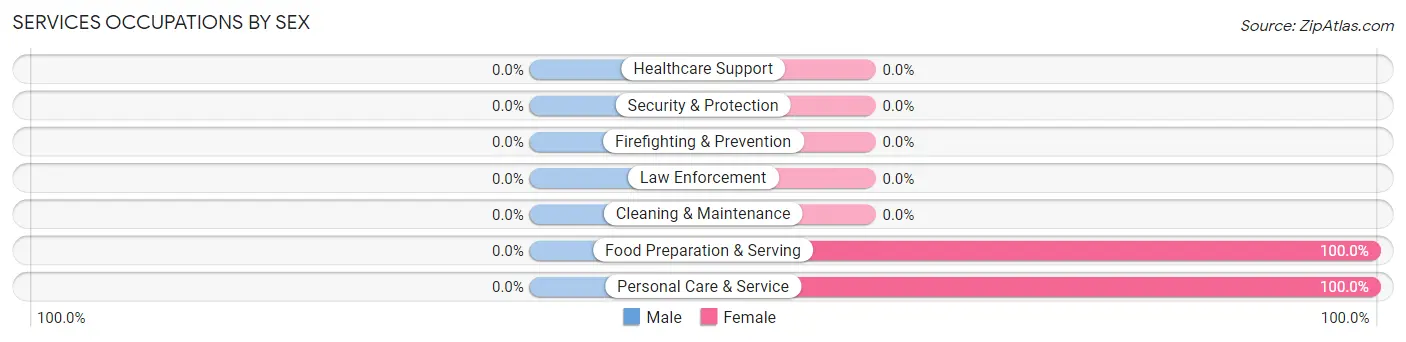
| Occupation | Male | Female |
| Healthcare Support | 0 (0.0%) | 0 (0.0%) |
| Security & Protection | 0 (0.0%) | 0 (0.0%) |
| Firefighting & Prevention | 0 (0.0%) | 0 (0.0%) |
| Law Enforcement | 0 (0.0%) | 0 (0.0%) |
| Food Preparation & Serving | 0 (0.0%) | 4 (100.0%) |
| Cleaning & Maintenance | 0 (0.0%) | 0 (0.0%) |
| Personal Care & Service | 0 (0.0%) | 2 (100.0%) |
| Total (Category) | 0 (0.0%) | 6 (100.0%) |
| Total (Overall) | 32 (44.4%) | 40 (55.6%) |
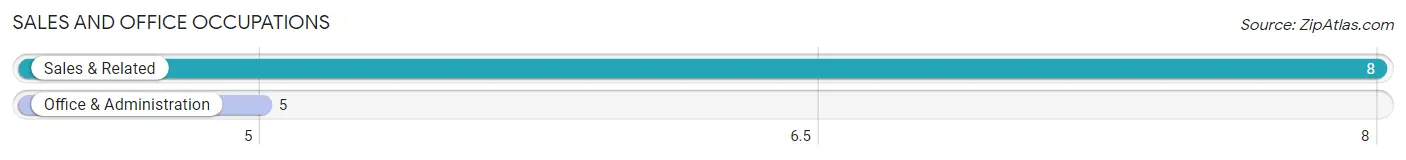
Sales and Office Occupations
The most common Sales and Office occupations in Tennessee are Sales & Related (8 | 11.1%), and Office & Administration (5 | 6.9%).
Sales and Office Occupations by Sex

| Occupation | Male | Female |
| Sales & Related | 8 (100.0%) | 0 (0.0%) |
| Office & Administration | 0 (0.0%) | 5 (100.0%) |
| Total (Category) | 8 (61.5%) | 5 (38.5%) |
| Total (Overall) | 32 (44.4%) | 40 (55.6%) |
Natural Resources, Construction and Maintenance Occupations
The most common Natural Resources, Construction and Maintenance occupations in Tennessee are Construction & Extraction (4 | 5.6%), and Installation, Maintenance & Repair (4 | 5.6%).
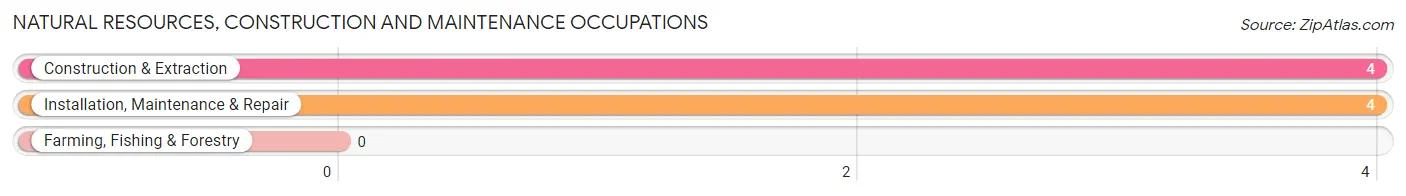
Natural Resources, Construction and Maintenance Occupations by Sex
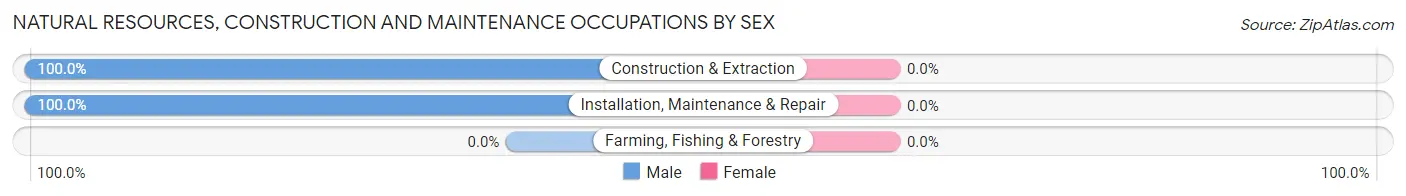
| Occupation | Male | Female |
| Farming, Fishing & Forestry | 0 (0.0%) | 0 (0.0%) |
| Construction & Extraction | 4 (100.0%) | 0 (0.0%) |
| Installation, Maintenance & Repair | 4 (100.0%) | 0 (0.0%) |
| Total (Category) | 8 (100.0%) | 0 (0.0%) |
| Total (Overall) | 32 (44.4%) | 40 (55.6%) |
Production, Transportation and Moving Occupations
The most common Production, Transportation and Moving occupations in Tennessee are Production (30 | 41.7%), and Transportation (3 | 4.2%).
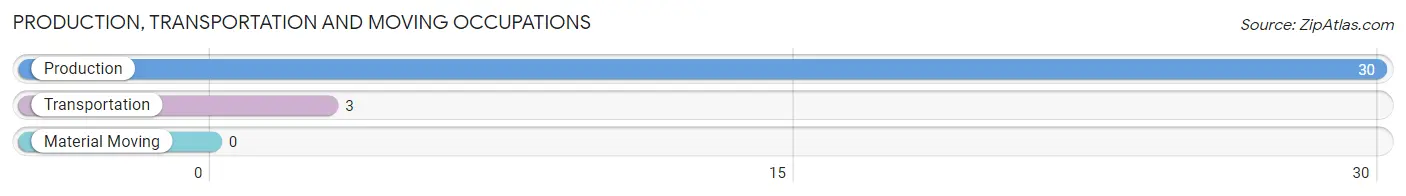
Production, Transportation and Moving Occupations by Sex
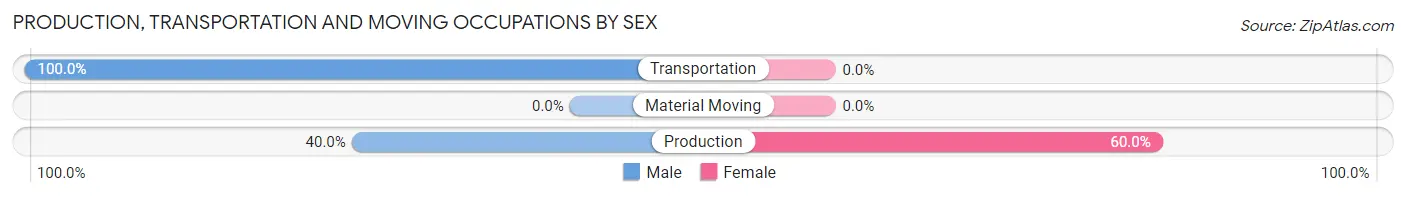
| Occupation | Male | Female |
| Production | 12 (40.0%) | 18 (60.0%) |
| Transportation | 3 (100.0%) | 0 (0.0%) |
| Material Moving | 0 (0.0%) | 0 (0.0%) |
| Total (Category) | 15 (45.5%) | 18 (54.5%) |
| Total (Overall) | 32 (44.4%) | 40 (55.6%) |
Employment Industries by Sex in Tennessee
Employment Industries in Tennessee
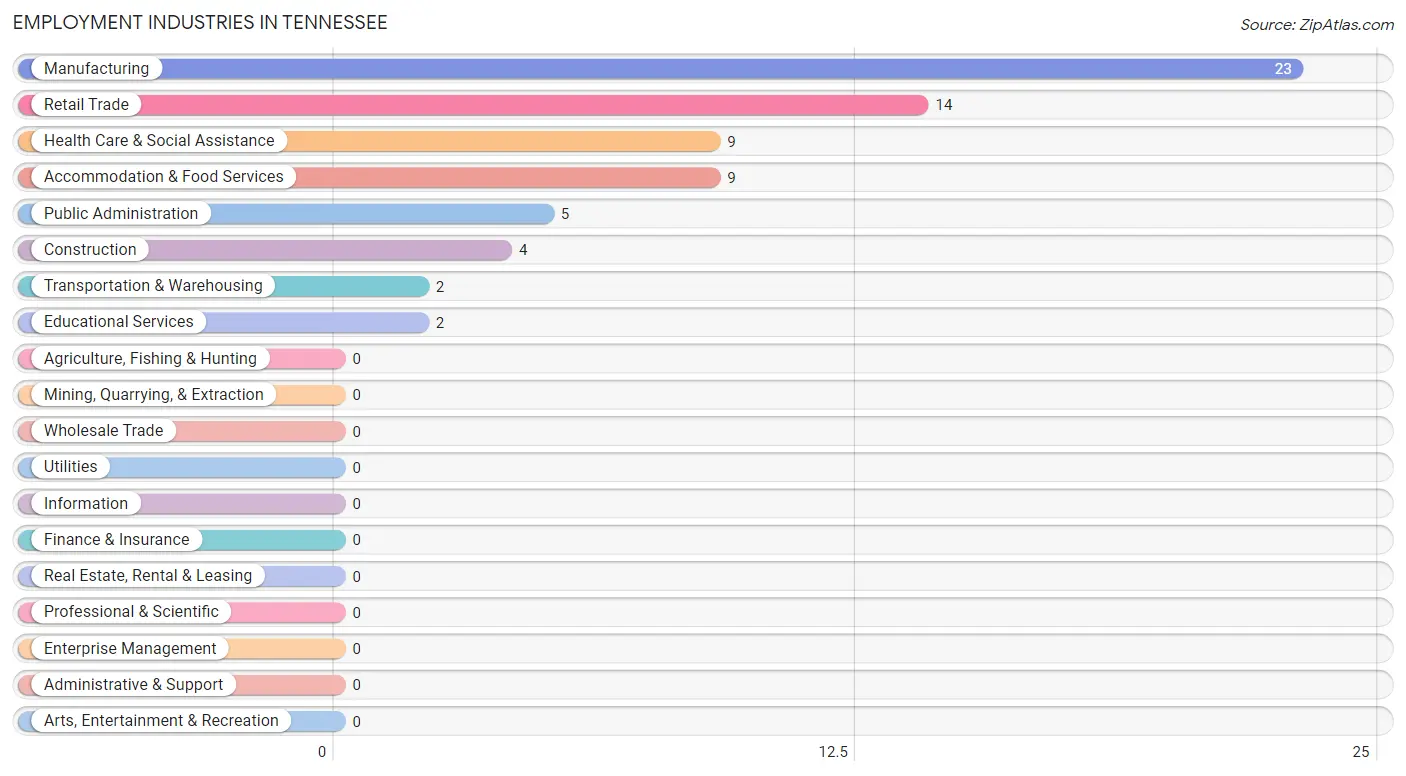
The major employment industries in Tennessee include Manufacturing (23 | 31.9%), Retail Trade (14 | 19.4%), Health Care & Social Assistance (9 | 12.5%), Accommodation & Food Services (9 | 12.5%), and Public Administration (5 | 6.9%).
Employment Industries by Sex in Tennessee
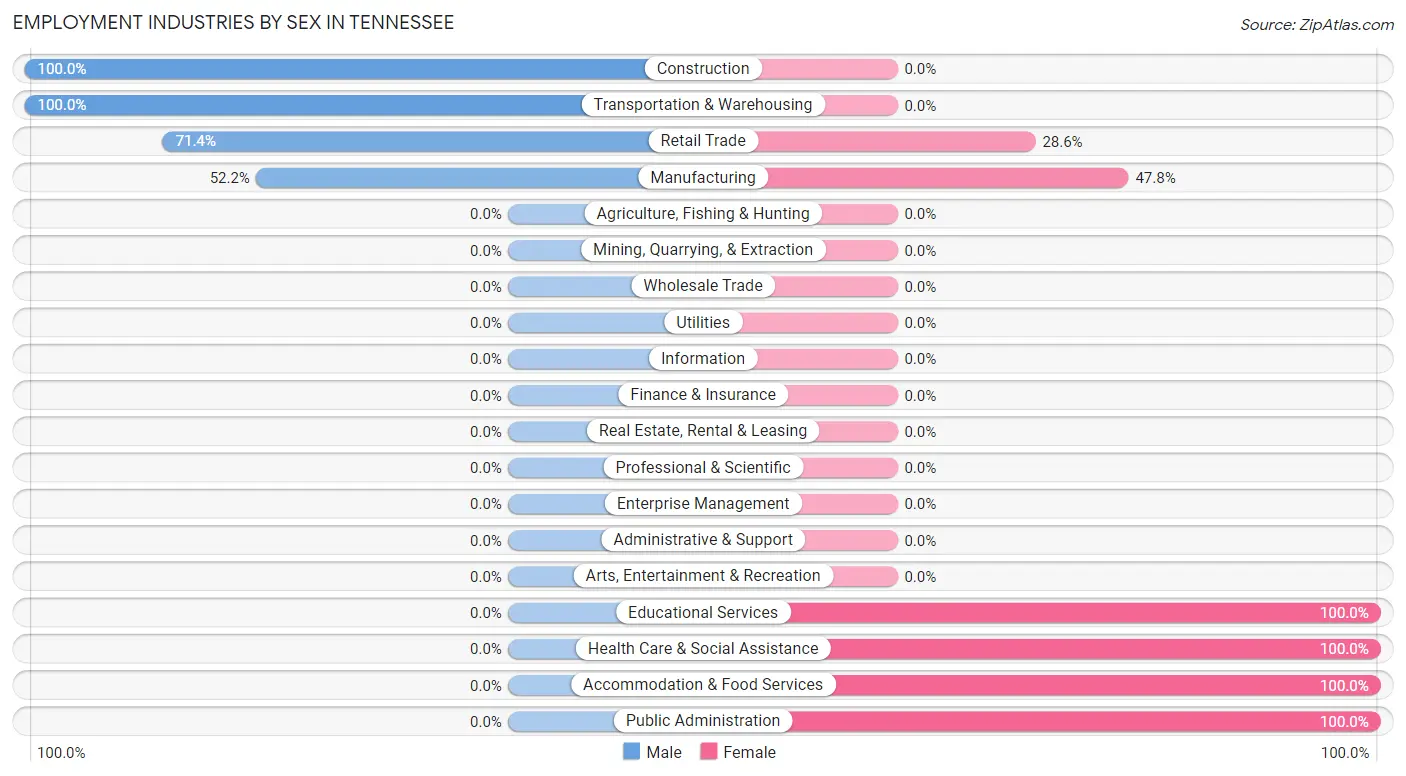
The Tennessee industries that see more men than women are Construction (100.0%), Transportation & Warehousing (100.0%), and Retail Trade (71.4%), whereas the industries that tend to have a higher number of women are Educational Services (100.0%), Health Care & Social Assistance (100.0%), and Accommodation & Food Services (100.0%).
| Industry | Male | Female |
| Agriculture, Fishing & Hunting | 0 (0.0%) | 0 (0.0%) |
| Mining, Quarrying, & Extraction | 0 (0.0%) | 0 (0.0%) |
| Construction | 4 (100.0%) | 0 (0.0%) |
| Manufacturing | 12 (52.2%) | 11 (47.8%) |
| Wholesale Trade | 0 (0.0%) | 0 (0.0%) |
| Retail Trade | 10 (71.4%) | 4 (28.6%) |
| Transportation & Warehousing | 2 (100.0%) | 0 (0.0%) |
| Utilities | 0 (0.0%) | 0 (0.0%) |
| Information | 0 (0.0%) | 0 (0.0%) |
| Finance & Insurance | 0 (0.0%) | 0 (0.0%) |
| Real Estate, Rental & Leasing | 0 (0.0%) | 0 (0.0%) |
| Professional & Scientific | 0 (0.0%) | 0 (0.0%) |
| Enterprise Management | 0 (0.0%) | 0 (0.0%) |
| Administrative & Support | 0 (0.0%) | 0 (0.0%) |
| Educational Services | 0 (0.0%) | 2 (100.0%) |
| Health Care & Social Assistance | 0 (0.0%) | 9 (100.0%) |
| Arts, Entertainment & Recreation | 0 (0.0%) | 0 (0.0%) |
| Accommodation & Food Services | 0 (0.0%) | 9 (100.0%) |
| Public Administration | 0 (0.0%) | 5 (100.0%) |
| Total | 32 (44.4%) | 40 (55.6%) |
Education in Tennessee
School Enrollment in Tennessee
The most common levels of schooling among the 14 students in Tennessee are high school (6 | 42.9%), elementary school (3 | 21.4%), and middle school (3 | 21.4%).
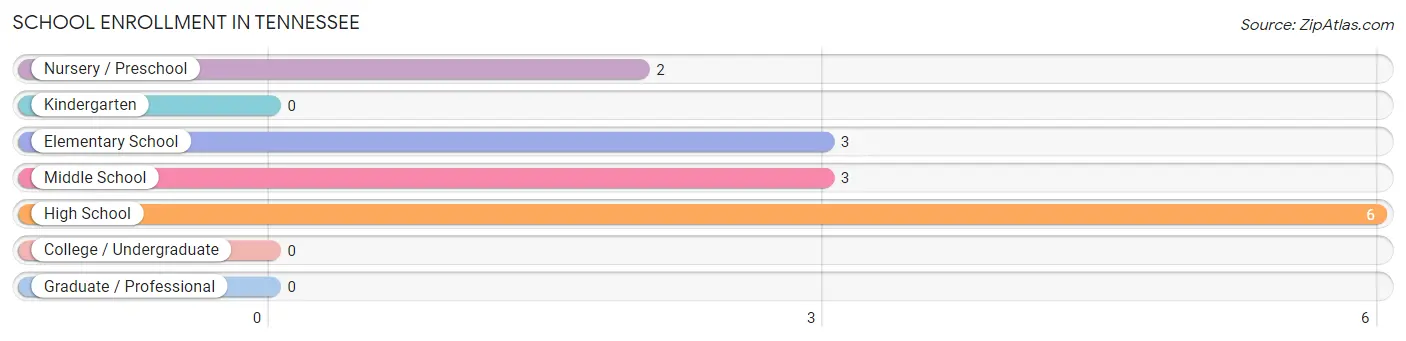
| School Level | # Students | % Students |
| Nursery / Preschool | 2 | 14.3% |
| Kindergarten | 0 | 0.0% |
| Elementary School | 3 | 21.4% |
| Middle School | 3 | 21.4% |
| High School | 6 | 42.9% |
| College / Undergraduate | 0 | 0.0% |
| Graduate / Professional | 0 | 0.0% |
| Total | 14 | 100.0% |
School Enrollment by Age by Funding Source in Tennessee
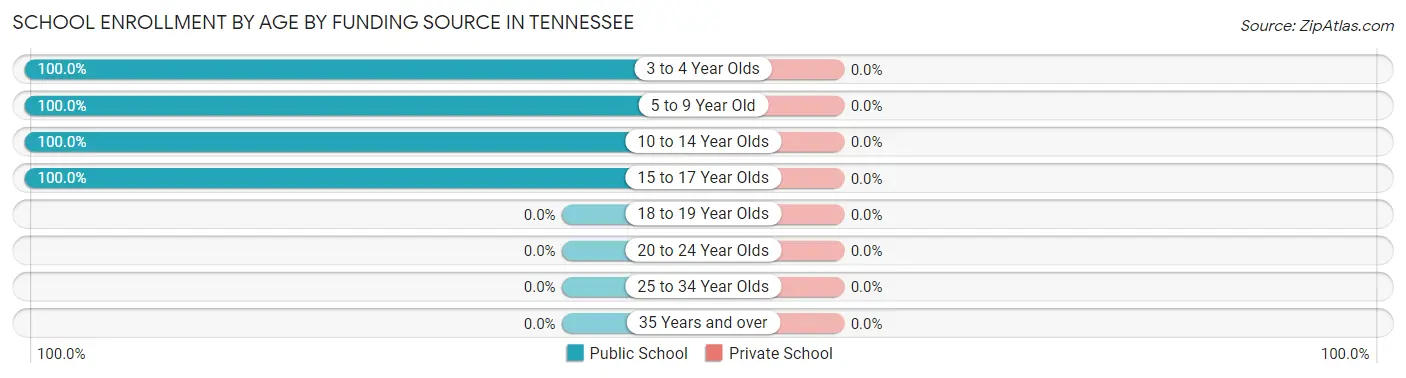
| Age Bracket | Public School | Private School |
| 3 to 4 Year Olds | 2 (100.0%) | 0 (0.0%) |
| 5 to 9 Year Old | 3 (100.0%) | 0 (0.0%) |
| 10 to 14 Year Olds | 3 (100.0%) | 0 (0.0%) |
| 15 to 17 Year Olds | 6 (100.0%) | 0 (0.0%) |
| 18 to 19 Year Olds | 0 (0.0%) | 0 (0.0%) |
| 20 to 24 Year Olds | 0 (0.0%) | 0 (0.0%) |
| 25 to 34 Year Olds | 0 (0.0%) | 0 (0.0%) |
| 35 Years and over | 0 (0.0%) | 0 (0.0%) |
| Total | 14 (100.0%) | 0 (0.0%) |
Educational Attainment by Field of Study in Tennessee
Arts & humanities (2 | 40.0%), computers & mathematics (1 | 20.0%), social sciences (1 | 20.0%), and science & technology (1 | 20.0%) are the most common fields of study among 5 individuals in Tennessee who have obtained a bachelor's degree or higher.
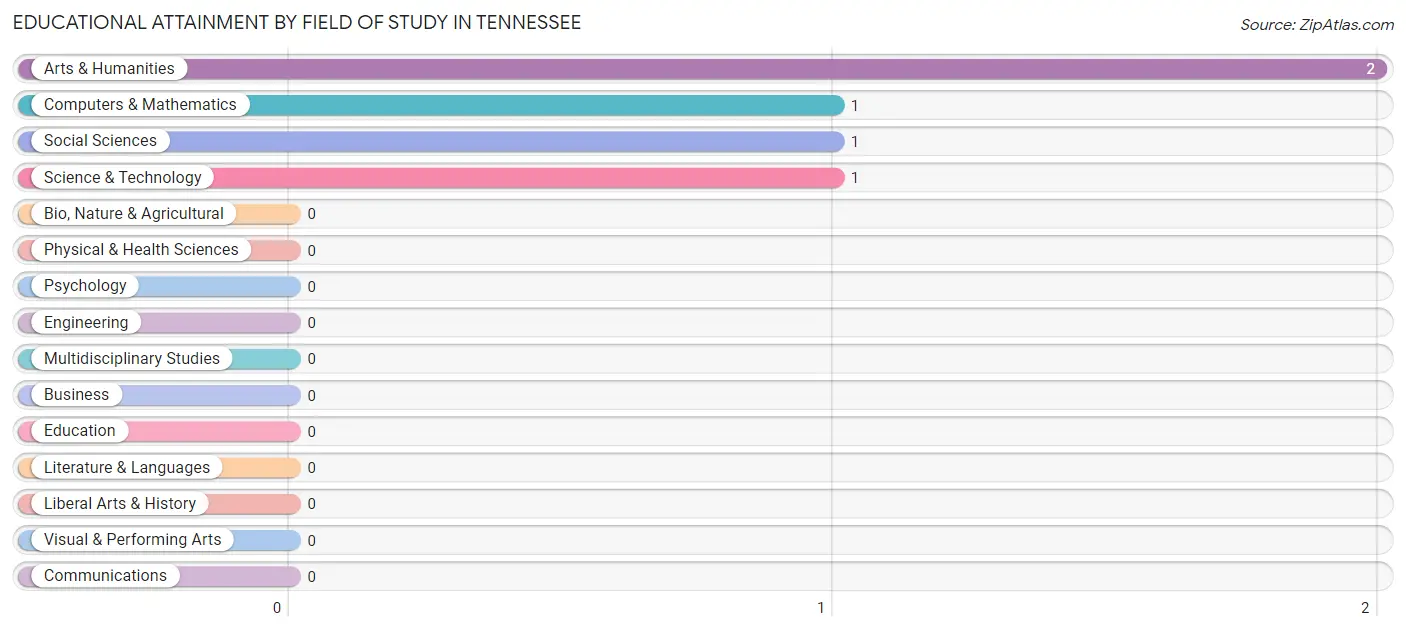
| Field of Study | # Graduates | % Graduates |
| Computers & Mathematics | 1 | 20.0% |
| Bio, Nature & Agricultural | 0 | 0.0% |
| Physical & Health Sciences | 0 | 0.0% |
| Psychology | 0 | 0.0% |
| Social Sciences | 1 | 20.0% |
| Engineering | 0 | 0.0% |
| Multidisciplinary Studies | 0 | 0.0% |
| Science & Technology | 1 | 20.0% |
| Business | 0 | 0.0% |
| Education | 0 | 0.0% |
| Literature & Languages | 0 | 0.0% |
| Liberal Arts & History | 0 | 0.0% |
| Visual & Performing Arts | 0 | 0.0% |
| Communications | 0 | 0.0% |
| Arts & Humanities | 2 | 40.0% |
| Total | 5 | 100.0% |
Transportation & Commute in Tennessee
Vehicle Availability by Sex in Tennessee
The most prevalent vehicle ownership categories in Tennessee are males with 4 vehicles (13, accounting for 40.6%) and females with 4 vehicles (11, making up 32.5%).
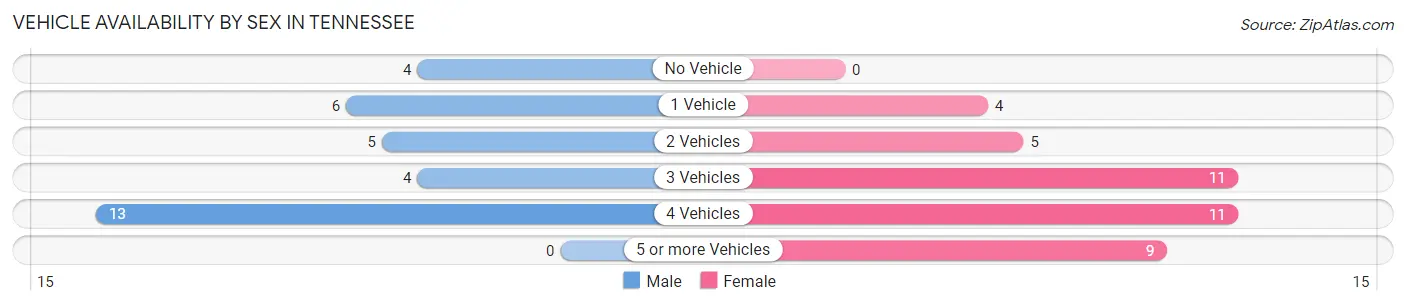
| Vehicles Available | Male | Female |
| No Vehicle | 4 (12.5%) | 0 (0.0%) |
| 1 Vehicle | 6 (18.8%) | 4 (10.0%) |
| 2 Vehicles | 5 (15.6%) | 5 (12.5%) |
| 3 Vehicles | 4 (12.5%) | 11 (27.5%) |
| 4 Vehicles | 13 (40.6%) | 11 (27.5%) |
| 5 or more Vehicles | 0 (0.0%) | 9 (22.5%) |
| Total | 32 (100.0%) | 40 (100.0%) |
Commute Time in Tennessee
The most frequently occuring commute durations in Tennessee are 25 to 29 minutes (19 commuters, 27.1%), 20 to 24 minutes (18 commuters, 25.7%), and 15 to 19 minutes (13 commuters, 18.6%).
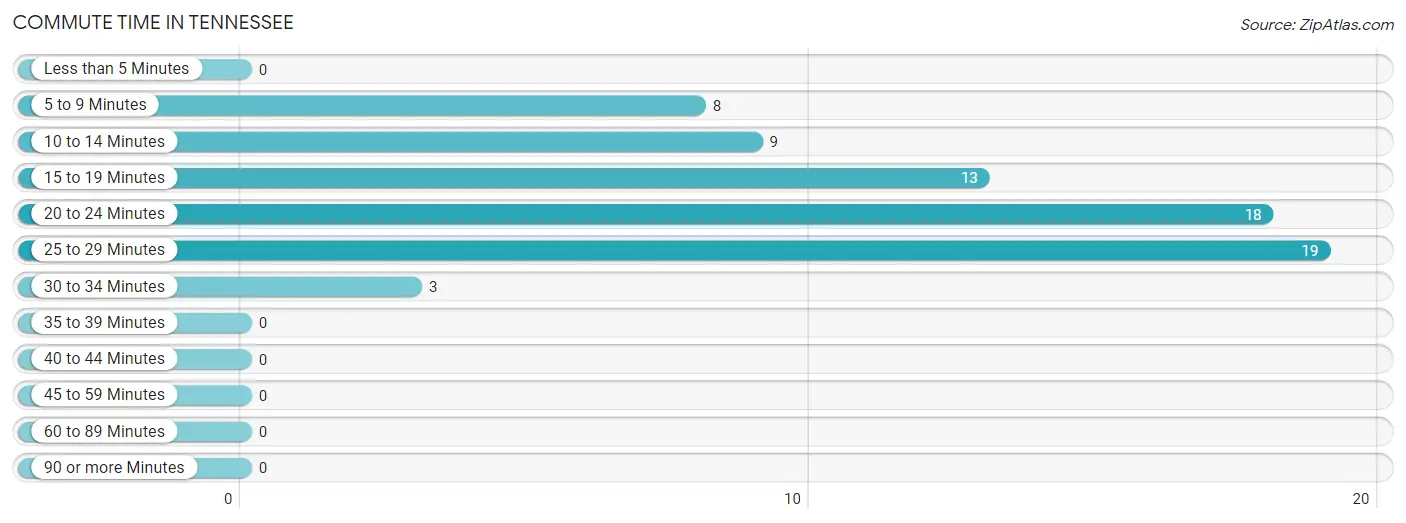
| Commute Time | # Commuters | % Commuters |
| Less than 5 Minutes | 0 | 0.0% |
| 5 to 9 Minutes | 8 | 11.4% |
| 10 to 14 Minutes | 9 | 12.9% |
| 15 to 19 Minutes | 13 | 18.6% |
| 20 to 24 Minutes | 18 | 25.7% |
| 25 to 29 Minutes | 19 | 27.1% |
| 30 to 34 Minutes | 3 | 4.3% |
| 35 to 39 Minutes | 0 | 0.0% |
| 40 to 44 Minutes | 0 | 0.0% |
| 45 to 59 Minutes | 0 | 0.0% |
| 60 to 89 Minutes | 0 | 0.0% |
| 90 or more Minutes | 0 | 0.0% |
Commute Time by Sex in Tennessee
The most common commute times in Tennessee are 25 to 29 minutes (10 commuters, 32.3%) for males and 20 to 24 minutes (14 commuters, 35.9%) for females.
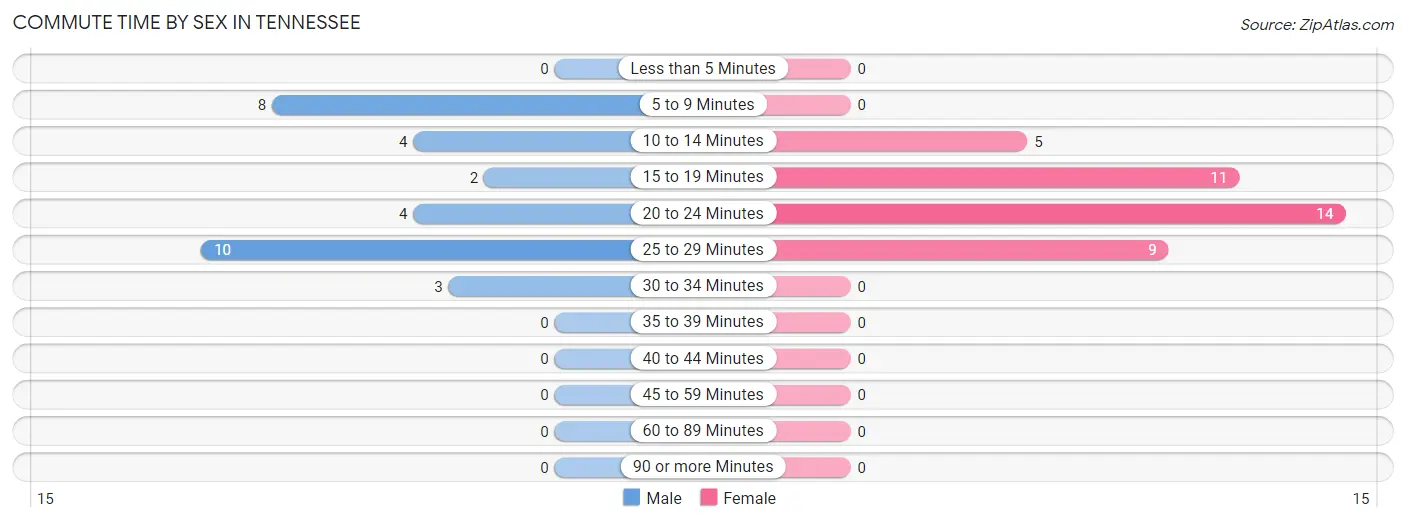
| Commute Time | Male | Female |
| Less than 5 Minutes | 0 (0.0%) | 0 (0.0%) |
| 5 to 9 Minutes | 8 (25.8%) | 0 (0.0%) |
| 10 to 14 Minutes | 4 (12.9%) | 5 (12.8%) |
| 15 to 19 Minutes | 2 (6.5%) | 11 (28.2%) |
| 20 to 24 Minutes | 4 (12.9%) | 14 (35.9%) |
| 25 to 29 Minutes | 10 (32.3%) | 9 (23.1%) |
| 30 to 34 Minutes | 3 (9.7%) | 0 (0.0%) |
| 35 to 39 Minutes | 0 (0.0%) | 0 (0.0%) |
| 40 to 44 Minutes | 0 (0.0%) | 0 (0.0%) |
| 45 to 59 Minutes | 0 (0.0%) | 0 (0.0%) |
| 60 to 89 Minutes | 0 (0.0%) | 0 (0.0%) |
| 90 or more Minutes | 0 (0.0%) | 0 (0.0%) |
Time of Departure to Work by Sex in Tennessee
The most frequent times of departure to work in Tennessee are 8:00 AM to 8:29 AM (9, 29.0%) for males and 4:00 PM to 11:59 PM (9, 23.1%) for females.
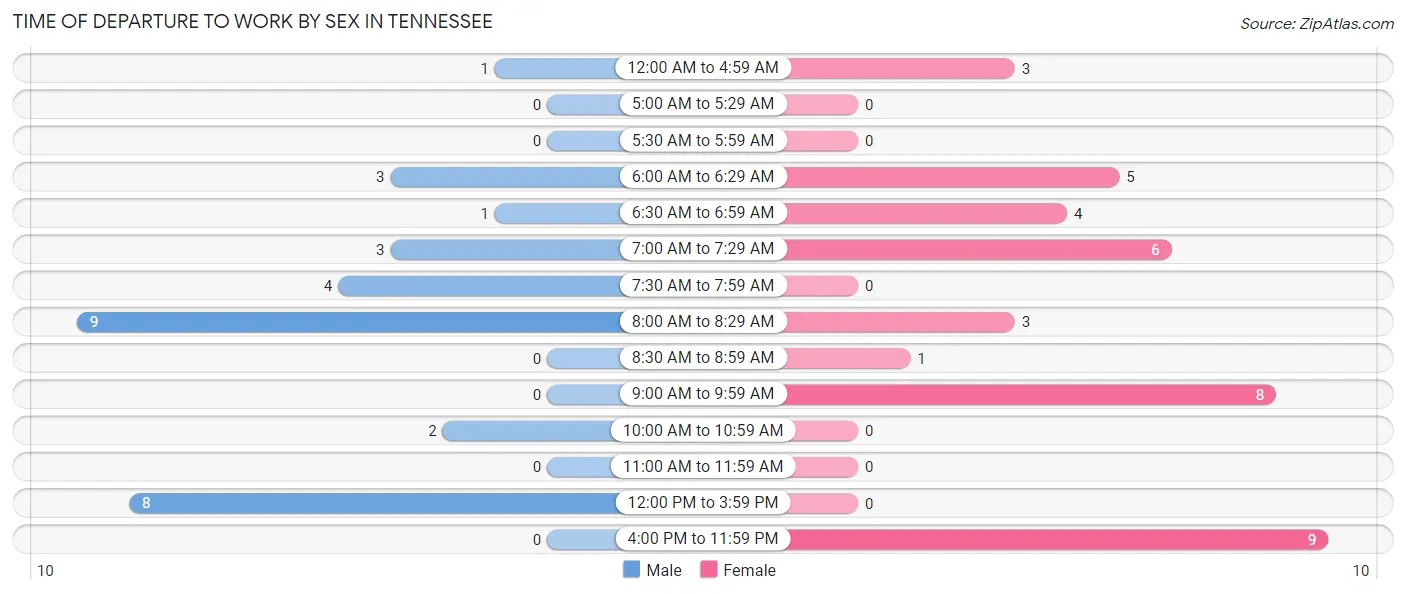
| Time of Departure | Male | Female |
| 12:00 AM to 4:59 AM | 1 (3.2%) | 3 (7.7%) |
| 5:00 AM to 5:29 AM | 0 (0.0%) | 0 (0.0%) |
| 5:30 AM to 5:59 AM | 0 (0.0%) | 0 (0.0%) |
| 6:00 AM to 6:29 AM | 3 (9.7%) | 5 (12.8%) |
| 6:30 AM to 6:59 AM | 1 (3.2%) | 4 (10.3%) |
| 7:00 AM to 7:29 AM | 3 (9.7%) | 6 (15.4%) |
| 7:30 AM to 7:59 AM | 4 (12.9%) | 0 (0.0%) |
| 8:00 AM to 8:29 AM | 9 (29.0%) | 3 (7.7%) |
| 8:30 AM to 8:59 AM | 0 (0.0%) | 1 (2.6%) |
| 9:00 AM to 9:59 AM | 0 (0.0%) | 8 (20.5%) |
| 10:00 AM to 10:59 AM | 2 (6.5%) | 0 (0.0%) |
| 11:00 AM to 11:59 AM | 0 (0.0%) | 0 (0.0%) |
| 12:00 PM to 3:59 PM | 8 (25.8%) | 0 (0.0%) |
| 4:00 PM to 11:59 PM | 0 (0.0%) | 9 (23.1%) |
| Total | 31 (100.0%) | 39 (100.0%) |
Housing Occupancy in Tennessee
Occupancy by Ownership in Tennessee
Of the total 57 dwellings in Tennessee, owner-occupied units account for 42 (73.7%), while renter-occupied units make up 15 (26.3%).
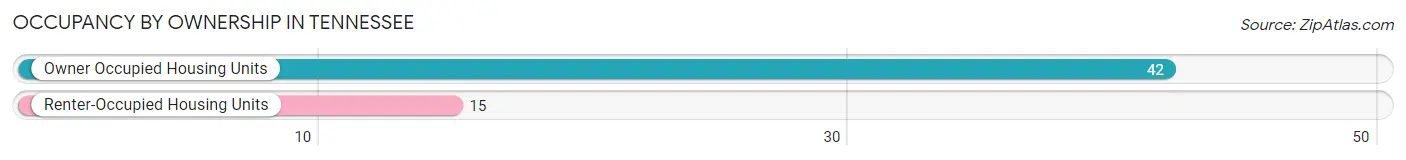
| Occupancy | # Housing Units | % Housing Units |
| Owner Occupied Housing Units | 42 | 73.7% |
| Renter-Occupied Housing Units | 15 | 26.3% |
| Total Occupied Housing Units | 57 | 100.0% |
Occupancy by Household Size in Tennessee
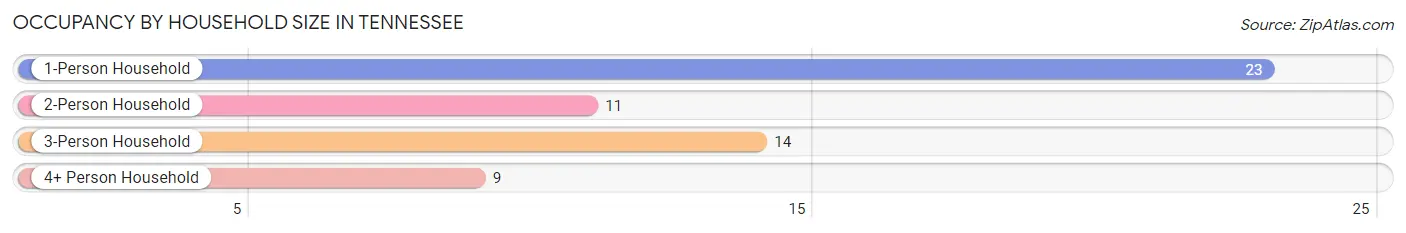
| Household Size | # Housing Units | % Housing Units |
| 1-Person Household | 23 | 40.4% |
| 2-Person Household | 11 | 19.3% |
| 3-Person Household | 14 | 24.6% |
| 4+ Person Household | 9 | 15.8% |
| Total Housing Units | 57 | 100.0% |
Occupancy by Ownership by Household Size in Tennessee
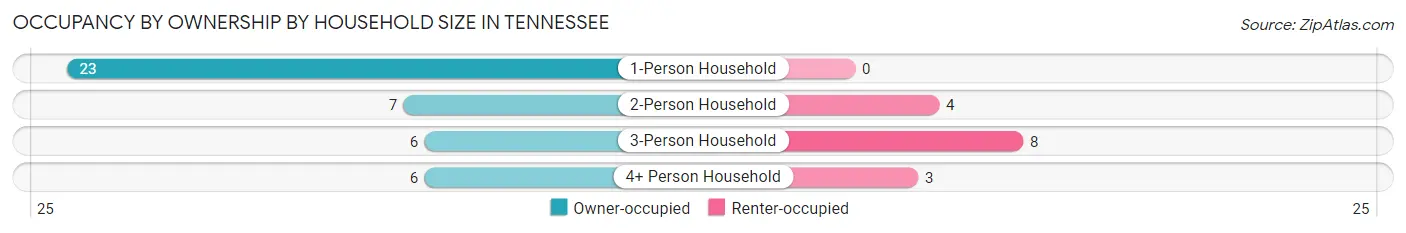
| Household Size | Owner-occupied | Renter-occupied |
| 1-Person Household | 23 (100.0%) | 0 (0.0%) |
| 2-Person Household | 7 (63.6%) | 4 (36.4%) |
| 3-Person Household | 6 (42.9%) | 8 (57.1%) |
| 4+ Person Household | 6 (66.7%) | 3 (33.3%) |
| Total Housing Units | 42 (73.7%) | 15 (26.3%) |
Occupancy by Educational Attainment in Tennessee
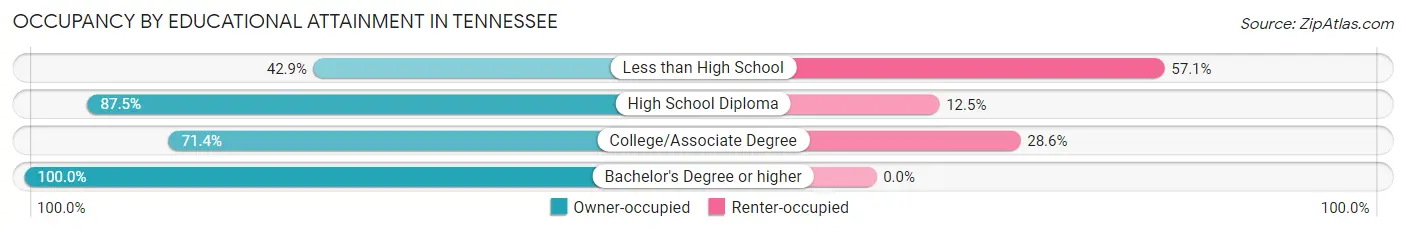
| Household Size | Owner-occupied | Renter-occupied |
| Less than High School | 6 (42.9%) | 8 (57.1%) |
| High School Diploma | 21 (87.5%) | 3 (12.5%) |
| College/Associate Degree | 10 (71.4%) | 4 (28.6%) |
| Bachelor's Degree or higher | 5 (100.0%) | 0 (0.0%) |
Occupancy by Age of Householder in Tennessee
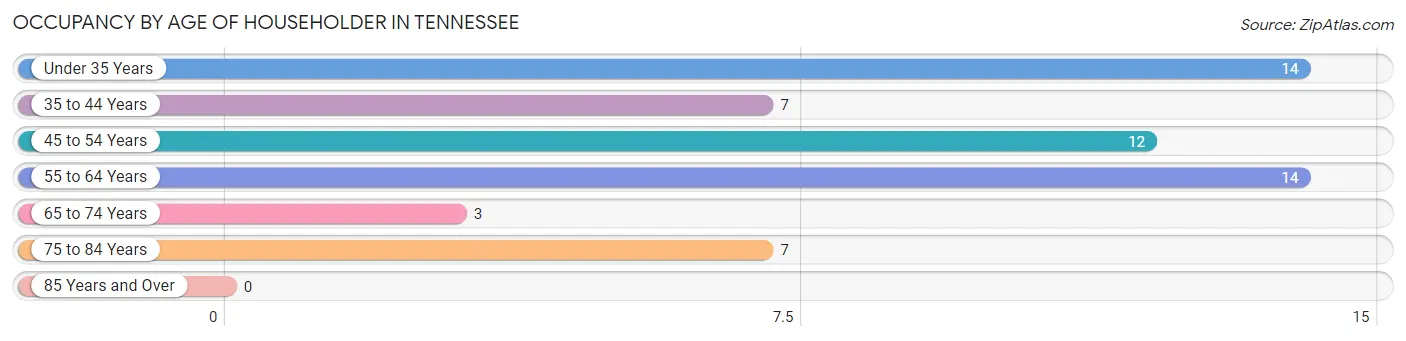
| Age Bracket | # Households | % Households |
| Under 35 Years | 14 | 24.6% |
| 35 to 44 Years | 7 | 12.3% |
| 45 to 54 Years | 12 | 21.0% |
| 55 to 64 Years | 14 | 24.6% |
| 65 to 74 Years | 3 | 5.3% |
| 75 to 84 Years | 7 | 12.3% |
| 85 Years and Over | 0 | 0.0% |
| Total | 57 | 100.0% |
Housing Finances in Tennessee
Median Income by Occupancy in Tennessee
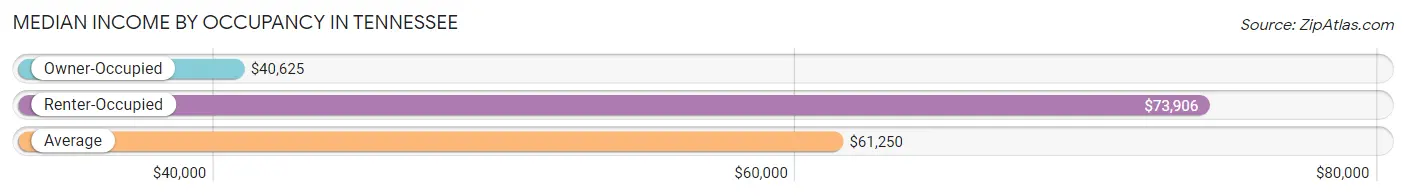
| Occupancy Type | # Households | Median Income |
| Owner-Occupied | 42 (73.7%) | $40,625 |
| Renter-Occupied | 15 (26.3%) | $73,906 |
| Average | 57 (100.0%) | $61,250 |
Occupancy by Householder Income Bracket in Tennessee
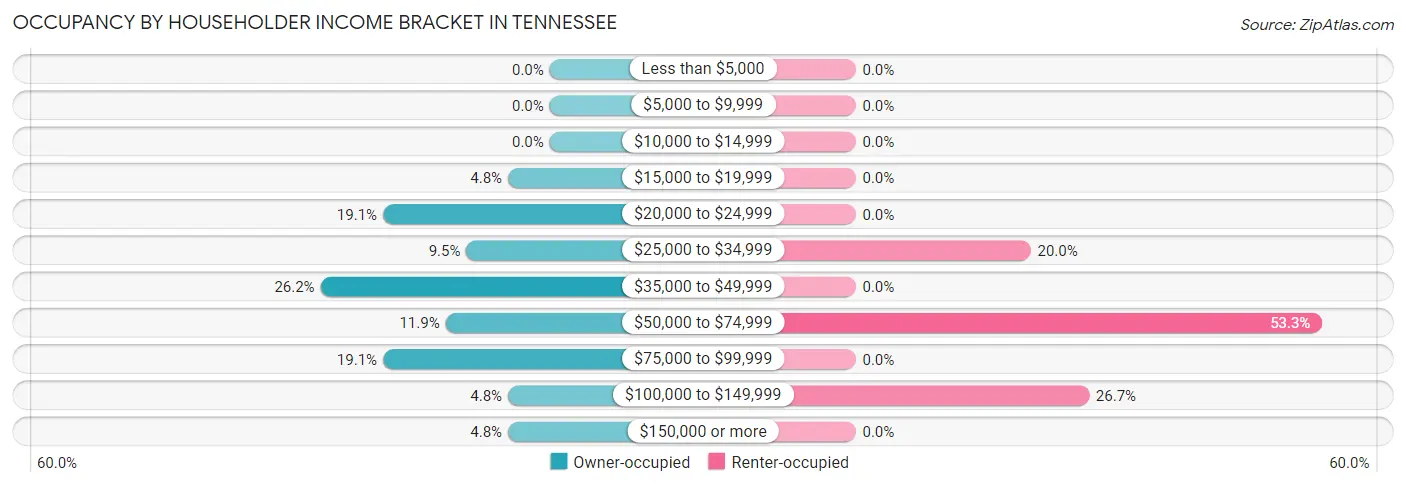
| Income Bracket | Owner-occupied | Renter-occupied |
| Less than $5,000 | 0 (0.0%) | 0 (0.0%) |
| $5,000 to $9,999 | 0 (0.0%) | 0 (0.0%) |
| $10,000 to $14,999 | 0 (0.0%) | 0 (0.0%) |
| $15,000 to $19,999 | 2 (4.8%) | 0 (0.0%) |
| $20,000 to $24,999 | 8 (19.1%) | 0 (0.0%) |
| $25,000 to $34,999 | 4 (9.5%) | 3 (20.0%) |
| $35,000 to $49,999 | 11 (26.2%) | 0 (0.0%) |
| $50,000 to $74,999 | 5 (11.9%) | 8 (53.3%) |
| $75,000 to $99,999 | 8 (19.1%) | 0 (0.0%) |
| $100,000 to $149,999 | 2 (4.8%) | 4 (26.7%) |
| $150,000 or more | 2 (4.8%) | 0 (0.0%) |
| Total | 42 (100.0%) | 15 (100.0%) |
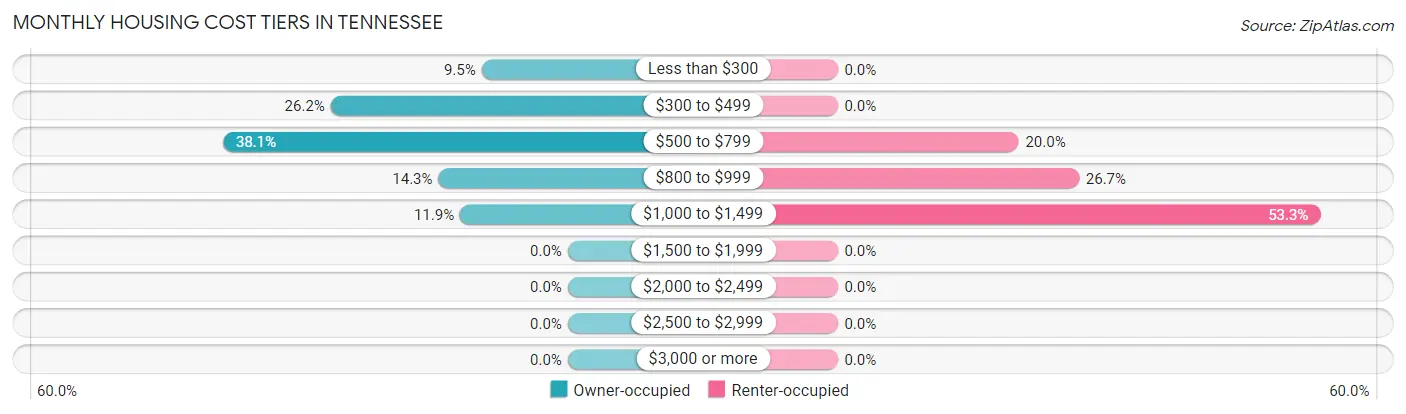
Monthly Housing Cost Tiers in Tennessee
| Monthly Cost | Owner-occupied | Renter-occupied |
| Less than $300 | 4 (9.5%) | 0 (0.0%) |
| $300 to $499 | 11 (26.2%) | 0 (0.0%) |
| $500 to $799 | 16 (38.1%) | 3 (20.0%) |
| $800 to $999 | 6 (14.3%) | 4 (26.7%) |
| $1,000 to $1,499 | 5 (11.9%) | 8 (53.3%) |
| $1,500 to $1,999 | 0 (0.0%) | 0 (0.0%) |
| $2,000 to $2,499 | 0 (0.0%) | 0 (0.0%) |
| $2,500 to $2,999 | 0 (0.0%) | 0 (0.0%) |
| $3,000 or more | 0 (0.0%) | 0 (0.0%) |
| Total | 42 (100.0%) | 15 (100.0%) |
Physical Housing Characteristics in Tennessee
Housing Structures in Tennessee
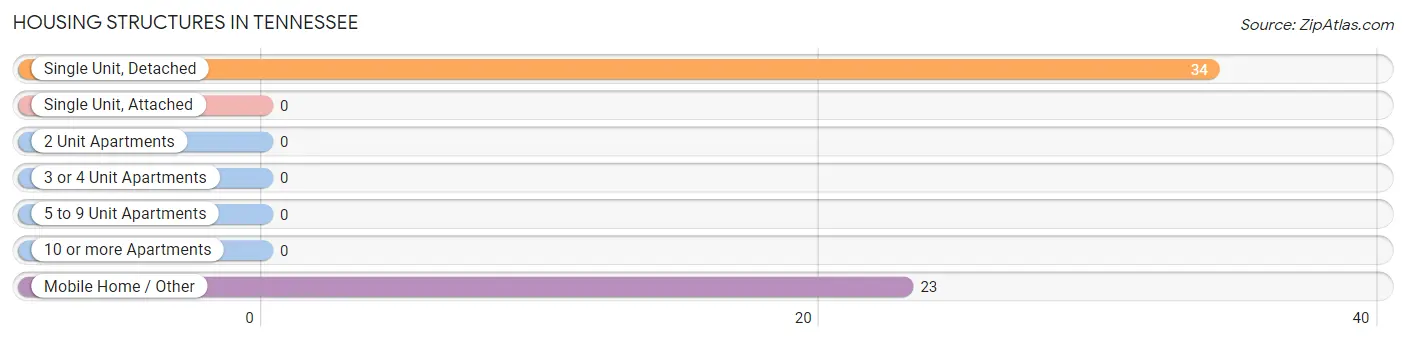
| Structure Type | # Housing Units | % Housing Units |
| Single Unit, Detached | 34 | 59.7% |
| Single Unit, Attached | 0 | 0.0% |
| 2 Unit Apartments | 0 | 0.0% |
| 3 or 4 Unit Apartments | 0 | 0.0% |
| 5 to 9 Unit Apartments | 0 | 0.0% |
| 10 or more Apartments | 0 | 0.0% |
| Mobile Home / Other | 23 | 40.4% |
| Total | 57 | 100.0% |
Housing Structures by Occupancy in Tennessee
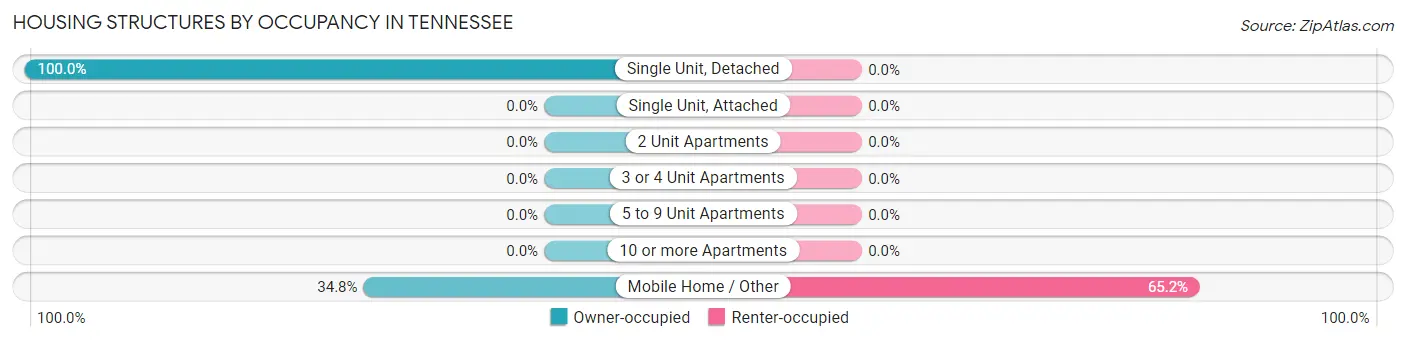
| Structure Type | Owner-occupied | Renter-occupied |
| Single Unit, Detached | 34 (100.0%) | 0 (0.0%) |
| Single Unit, Attached | 0 (0.0%) | 0 (0.0%) |
| 2 Unit Apartments | 0 (0.0%) | 0 (0.0%) |
| 3 or 4 Unit Apartments | 0 (0.0%) | 0 (0.0%) |
| 5 to 9 Unit Apartments | 0 (0.0%) | 0 (0.0%) |
| 10 or more Apartments | 0 (0.0%) | 0 (0.0%) |
| Mobile Home / Other | 8 (34.8%) | 15 (65.2%) |
| Total | 42 (73.7%) | 15 (26.3%) |
Housing Structures by Number of Rooms in Tennessee
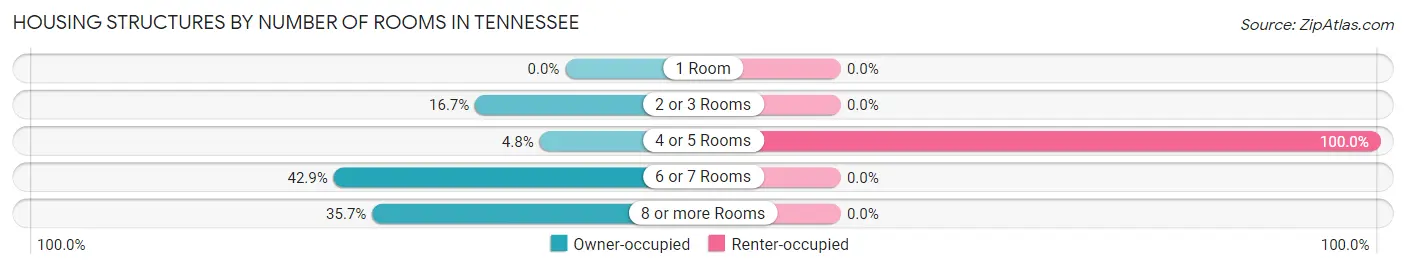
| Number of Rooms | Owner-occupied | Renter-occupied |
| 1 Room | 0 (0.0%) | 0 (0.0%) |
| 2 or 3 Rooms | 7 (16.7%) | 0 (0.0%) |
| 4 or 5 Rooms | 2 (4.8%) | 15 (100.0%) |
| 6 or 7 Rooms | 18 (42.9%) | 0 (0.0%) |
| 8 or more Rooms | 15 (35.7%) | 0 (0.0%) |
| Total | 42 (100.0%) | 15 (100.0%) |
Housing Structure by Heating Type in Tennessee
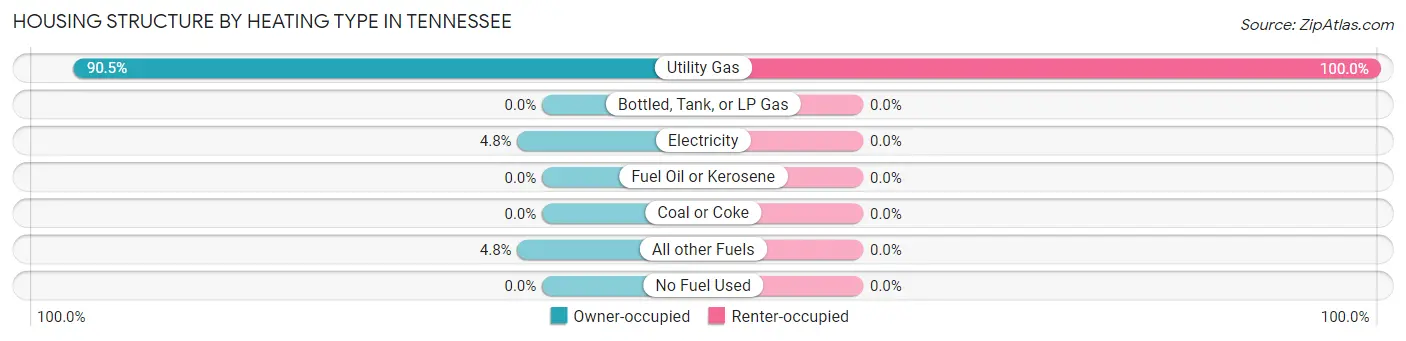
| Heating Type | Owner-occupied | Renter-occupied |
| Utility Gas | 38 (90.5%) | 15 (100.0%) |
| Bottled, Tank, or LP Gas | 0 (0.0%) | 0 (0.0%) |
| Electricity | 2 (4.8%) | 0 (0.0%) |
| Fuel Oil or Kerosene | 0 (0.0%) | 0 (0.0%) |
| Coal or Coke | 0 (0.0%) | 0 (0.0%) |
| All other Fuels | 2 (4.8%) | 0 (0.0%) |
| No Fuel Used | 0 (0.0%) | 0 (0.0%) |
| Total | 42 (100.0%) | 15 (100.0%) |
Household Vehicle Usage in Tennessee
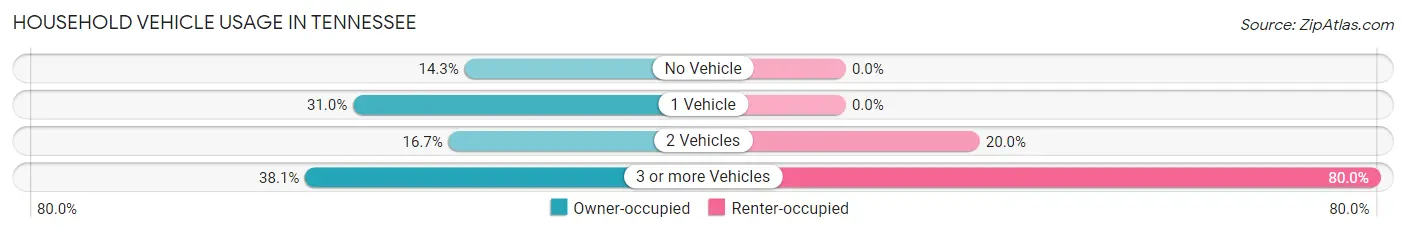
| Vehicles per Household | Owner-occupied | Renter-occupied |
| No Vehicle | 6 (14.3%) | 0 (0.0%) |
| 1 Vehicle | 13 (30.9%) | 0 (0.0%) |
| 2 Vehicles | 7 (16.7%) | 3 (20.0%) |
| 3 or more Vehicles | 16 (38.1%) | 12 (80.0%) |
| Total | 42 (100.0%) | 15 (100.0%) |
Real Estate & Mortgages in Tennessee
Real Estate and Mortgage Overview in Tennessee
| Characteristic | Without Mortgage | With Mortgage |
| Housing Units | 20 | 22 |
| Median Property Value | $75,000 | $70,000 |
| Median Household Income | $31,250 | $2 |
| Monthly Housing Costs | $444 | $0 |
| Real Estate Taxes | $938 | $0 |
Property Value by Mortgage Status in Tennessee
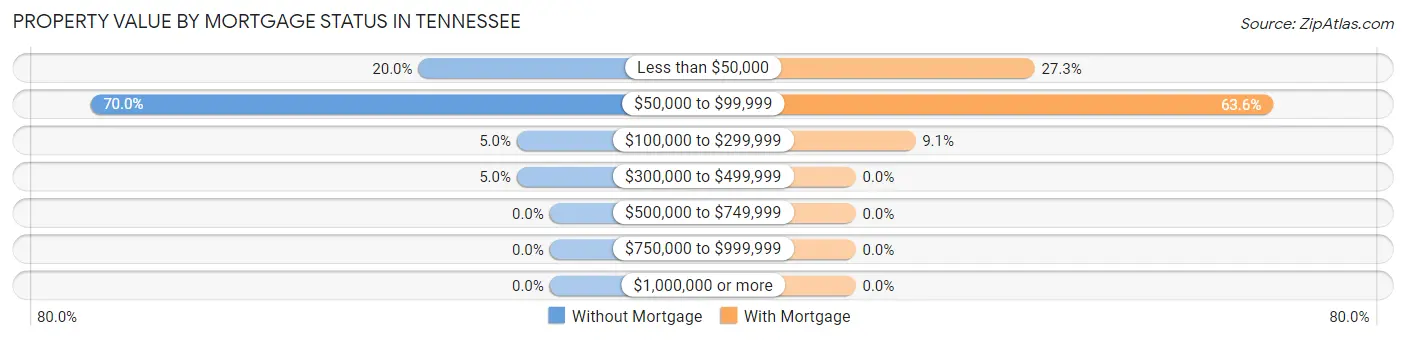
| Property Value | Without Mortgage | With Mortgage |
| Less than $50,000 | 4 (20.0%) | 6 (27.3%) |
| $50,000 to $99,999 | 14 (70.0%) | 14 (63.6%) |
| $100,000 to $299,999 | 1 (5.0%) | 2 (9.1%) |
| $300,000 to $499,999 | 1 (5.0%) | 0 (0.0%) |
| $500,000 to $749,999 | 0 (0.0%) | 0 (0.0%) |
| $750,000 to $999,999 | 0 (0.0%) | 0 (0.0%) |
| $1,000,000 or more | 0 (0.0%) | 0 (0.0%) |
| Total | 20 (100.0%) | 22 (100.0%) |
Household Income by Mortgage Status in Tennessee
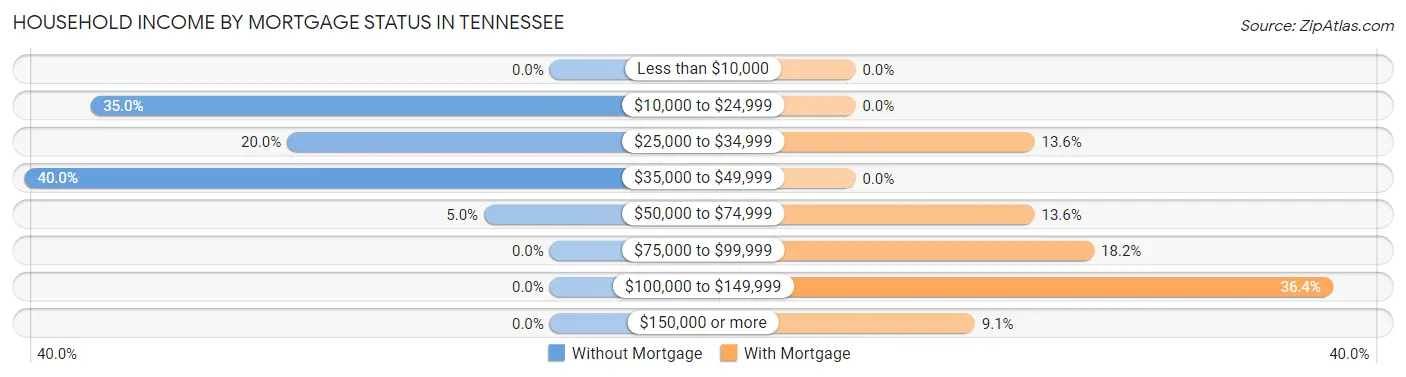
| Household Income | Without Mortgage | With Mortgage |
| Less than $10,000 | 0 (0.0%) | 0 (0.0%) |
| $10,000 to $24,999 | 7 (35.0%) | 0 (0.0%) |
| $25,000 to $34,999 | 4 (20.0%) | 3 (13.6%) |
| $35,000 to $49,999 | 8 (40.0%) | 0 (0.0%) |
| $50,000 to $74,999 | 1 (5.0%) | 3 (13.6%) |
| $75,000 to $99,999 | 0 (0.0%) | 4 (18.2%) |
| $100,000 to $149,999 | 0 (0.0%) | 8 (36.4%) |
| $150,000 or more | 0 (0.0%) | 2 (9.1%) |
| Total | 20 (100.0%) | 22 (100.0%) |
Property Value to Household Income Ratio in Tennessee
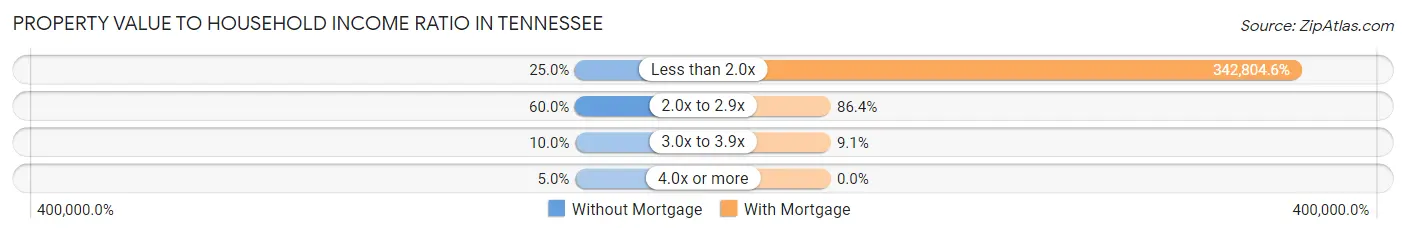
| Value-to-Income Ratio | Without Mortgage | With Mortgage |
| Less than 2.0x | 5 (25.0%) | 75,417 (342,804.6%) |
| 2.0x to 2.9x | 12 (60.0%) | 19 (86.4%) |
| 3.0x to 3.9x | 2 (10.0%) | 2 (9.1%) |
| 4.0x or more | 1 (5.0%) | 0 (0.0%) |
| Total | 20 (100.0%) | 22 (100.0%) |
Real Estate Taxes by Mortgage Status in Tennessee
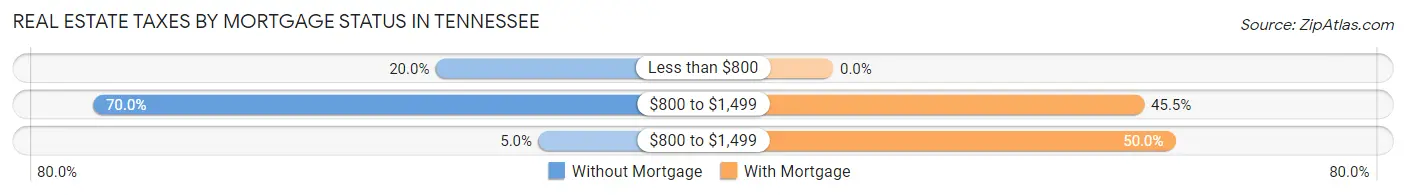
| Property Taxes | Without Mortgage | With Mortgage |
| Less than $800 | 4 (20.0%) | 0 (0.0%) |
| $800 to $1,499 | 14 (70.0%) | 10 (45.5%) |
| $800 to $1,499 | 1 (5.0%) | 11 (50.0%) |
| Total | 20 (100.0%) | 22 (100.0%) |
Health & Disability in Tennessee
Health Insurance Coverage by Age in Tennessee
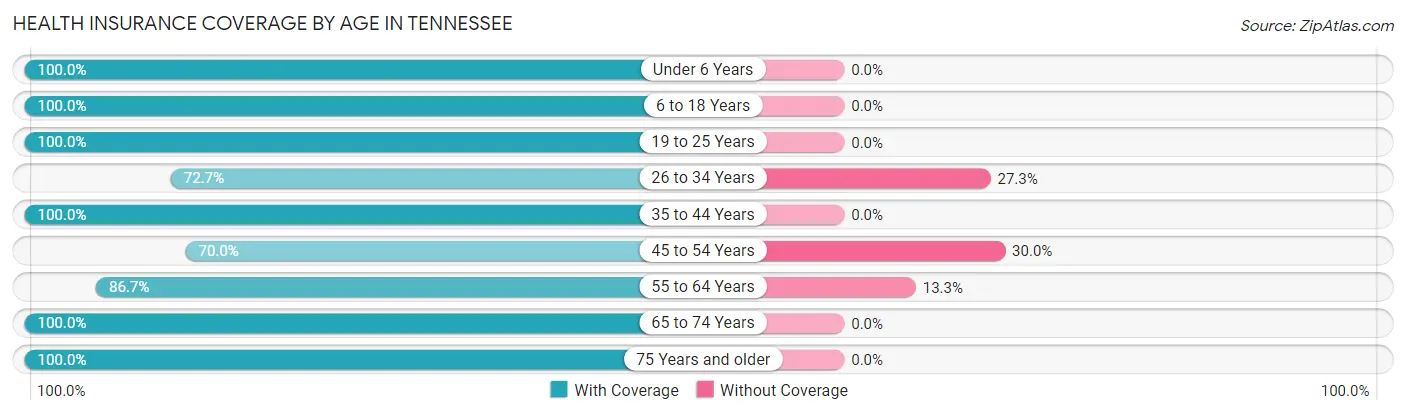
| Age Bracket | With Coverage | Without Coverage |
| Under 6 Years | 14 (100.0%) | 0 (0.0%) |
| 6 to 18 Years | 12 (100.0%) | 0 (0.0%) |
| 19 to 25 Years | 16 (100.0%) | 0 (0.0%) |
| 26 to 34 Years | 8 (72.7%) | 3 (27.3%) |
| 35 to 44 Years | 18 (100.0%) | 0 (0.0%) |
| 45 to 54 Years | 14 (70.0%) | 6 (30.0%) |
| 55 to 64 Years | 13 (86.7%) | 2 (13.3%) |
| 65 to 74 Years | 6 (100.0%) | 0 (0.0%) |
| 75 Years and older | 7 (100.0%) | 0 (0.0%) |
| Total | 108 (90.8%) | 11 (9.2%) |
Health Insurance Coverage by Citizenship Status in Tennessee
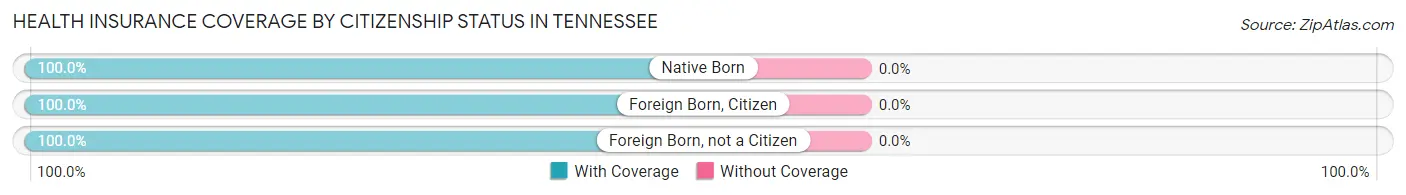
| Citizenship Status | With Coverage | Without Coverage |
| Native Born | 14 (100.0%) | 0 (0.0%) |
| Foreign Born, Citizen | 12 (100.0%) | 0 (0.0%) |
| Foreign Born, not a Citizen | 16 (100.0%) | 0 (0.0%) |
Health Insurance Coverage by Household Income in Tennessee
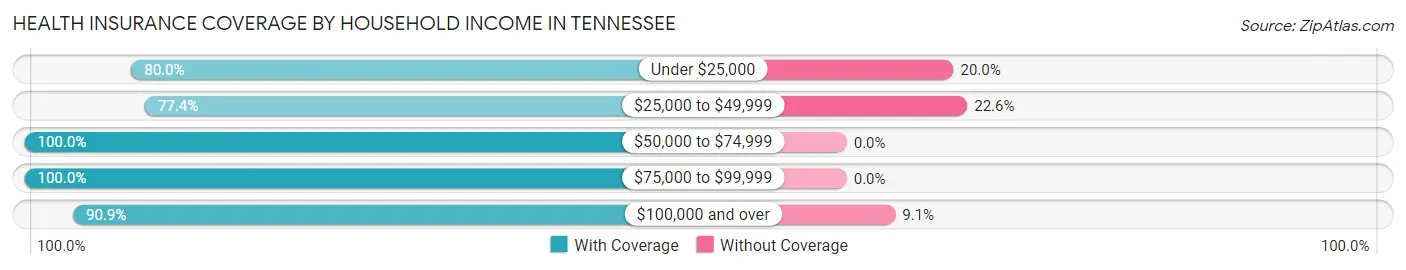
| Household Income | With Coverage | Without Coverage |
| Under $25,000 | 8 (80.0%) | 2 (20.0%) |
| $25,000 to $49,999 | 24 (77.4%) | 7 (22.6%) |
| $50,000 to $74,999 | 41 (100.0%) | 0 (0.0%) |
| $75,000 to $99,999 | 15 (100.0%) | 0 (0.0%) |
| $100,000 and over | 20 (90.9%) | 2 (9.1%) |
Public vs Private Health Insurance Coverage by Age in Tennessee
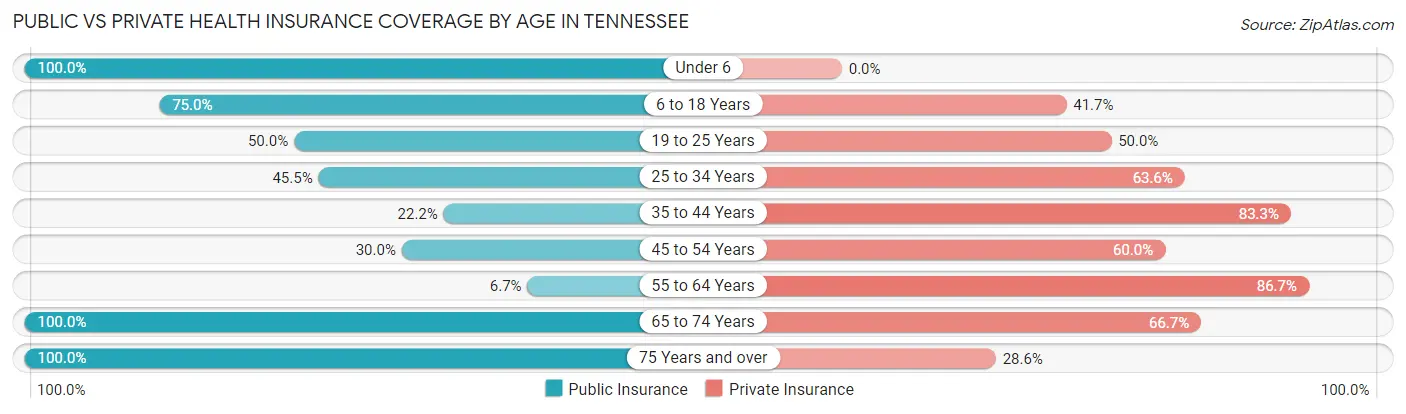
| Age Bracket | Public Insurance | Private Insurance |
| Under 6 | 14 (100.0%) | 0 (0.0%) |
| 6 to 18 Years | 9 (75.0%) | 5 (41.7%) |
| 19 to 25 Years | 8 (50.0%) | 8 (50.0%) |
| 25 to 34 Years | 5 (45.5%) | 7 (63.6%) |
| 35 to 44 Years | 4 (22.2%) | 15 (83.3%) |
| 45 to 54 Years | 6 (30.0%) | 12 (60.0%) |
| 55 to 64 Years | 1 (6.7%) | 13 (86.7%) |
| 65 to 74 Years | 6 (100.0%) | 4 (66.7%) |
| 75 Years and over | 7 (100.0%) | 2 (28.6%) |
| Total | 60 (50.4%) | 66 (55.5%) |
Disability Status by Sex by Age in Tennessee
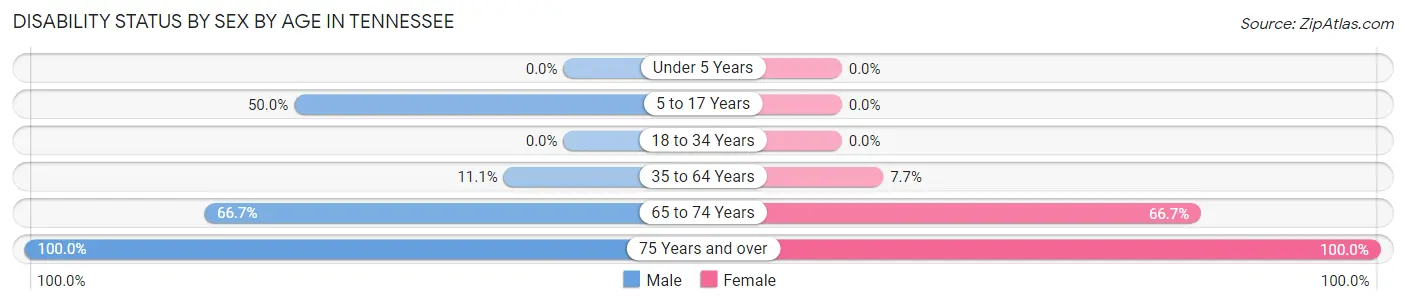
| Age Bracket | Male | Female |
| Under 5 Years | 0 (0.0%) | 0 (0.0%) |
| 5 to 17 Years | 3 (50.0%) | 0 (0.0%) |
| 18 to 34 Years | 0 (0.0%) | 0 (0.0%) |
| 35 to 64 Years | 3 (11.1%) | 2 (7.7%) |
| 65 to 74 Years | 2 (66.7%) | 2 (66.7%) |
| 75 Years and over | 2 (100.0%) | 5 (100.0%) |
Disability Class by Sex by Age in Tennessee
Disability Class: Hearing Difficulty
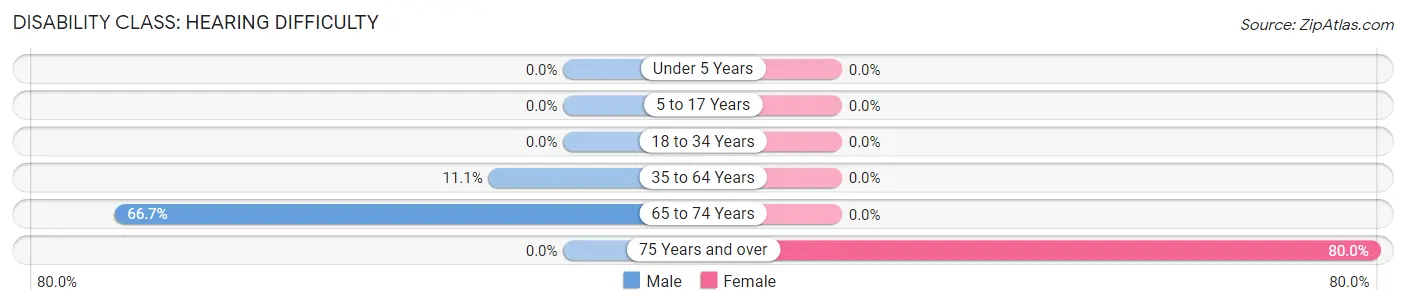
| Age Bracket | Male | Female |
| Under 5 Years | 0 (0.0%) | 0 (0.0%) |
| 5 to 17 Years | 0 (0.0%) | 0 (0.0%) |
| 18 to 34 Years | 0 (0.0%) | 0 (0.0%) |
| 35 to 64 Years | 3 (11.1%) | 0 (0.0%) |
| 65 to 74 Years | 2 (66.7%) | 0 (0.0%) |
| 75 Years and over | 0 (0.0%) | 4 (80.0%) |
Disability Class: Vision Difficulty
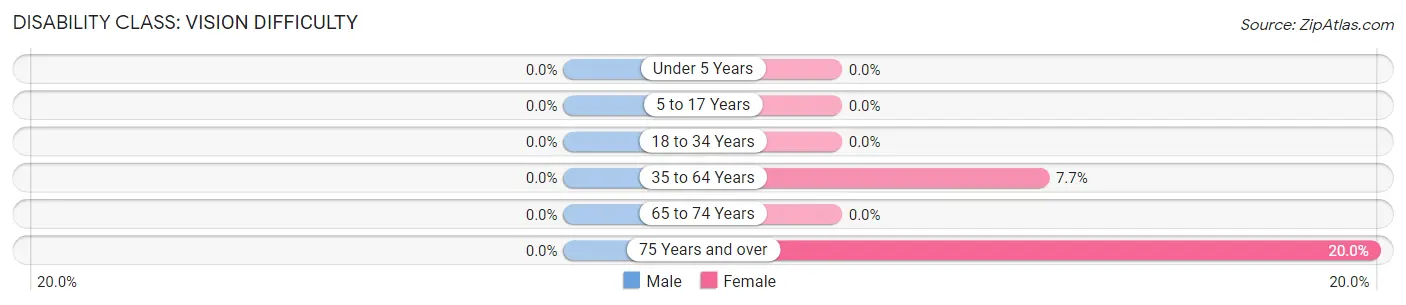
| Age Bracket | Male | Female |
| Under 5 Years | 0 (0.0%) | 0 (0.0%) |
| 5 to 17 Years | 0 (0.0%) | 0 (0.0%) |
| 18 to 34 Years | 0 (0.0%) | 0 (0.0%) |
| 35 to 64 Years | 0 (0.0%) | 2 (7.7%) |
| 65 to 74 Years | 0 (0.0%) | 0 (0.0%) |
| 75 Years and over | 0 (0.0%) | 1 (20.0%) |
Disability Class: Cognitive Difficulty
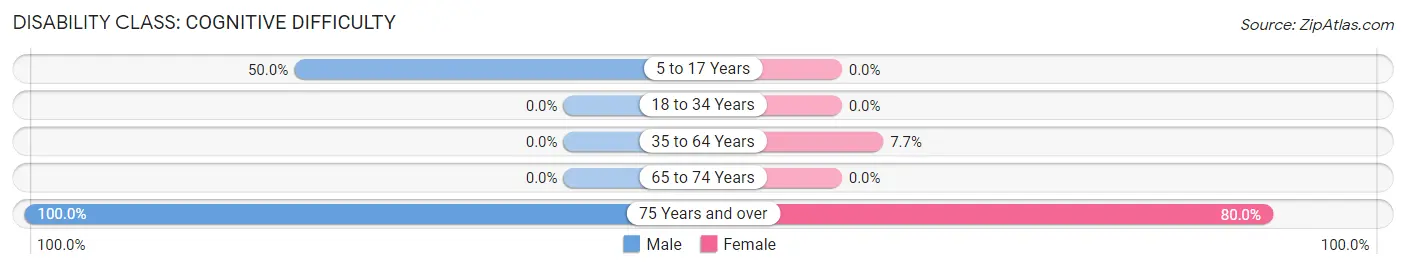
| Age Bracket | Male | Female |
| 5 to 17 Years | 3 (50.0%) | 0 (0.0%) |
| 18 to 34 Years | 0 (0.0%) | 0 (0.0%) |
| 35 to 64 Years | 0 (0.0%) | 2 (7.7%) |
| 65 to 74 Years | 0 (0.0%) | 0 (0.0%) |
| 75 Years and over | 2 (100.0%) | 4 (80.0%) |
Disability Class: Ambulatory Difficulty
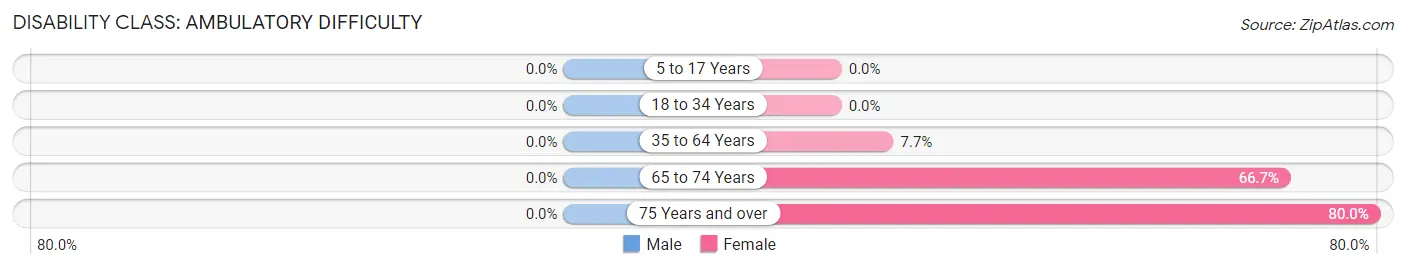
| Age Bracket | Male | Female |
| 5 to 17 Years | 0 (0.0%) | 0 (0.0%) |
| 18 to 34 Years | 0 (0.0%) | 0 (0.0%) |
| 35 to 64 Years | 0 (0.0%) | 2 (7.7%) |
| 65 to 74 Years | 0 (0.0%) | 2 (66.7%) |
| 75 Years and over | 0 (0.0%) | 4 (80.0%) |
Disability Class: Self-Care Difficulty
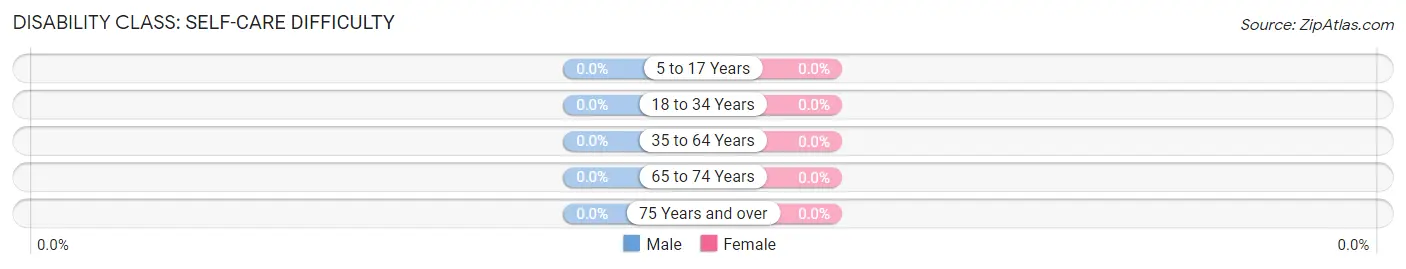
| Age Bracket | Male | Female |
| 5 to 17 Years | 0 (0.0%) | 0 (0.0%) |
| 18 to 34 Years | 0 (0.0%) | 0 (0.0%) |
| 35 to 64 Years | 0 (0.0%) | 0 (0.0%) |
| 65 to 74 Years | 0 (0.0%) | 0 (0.0%) |
| 75 Years and over | 0 (0.0%) | 0 (0.0%) |
Technology Access in Tennessee
Computing Device Access in Tennessee
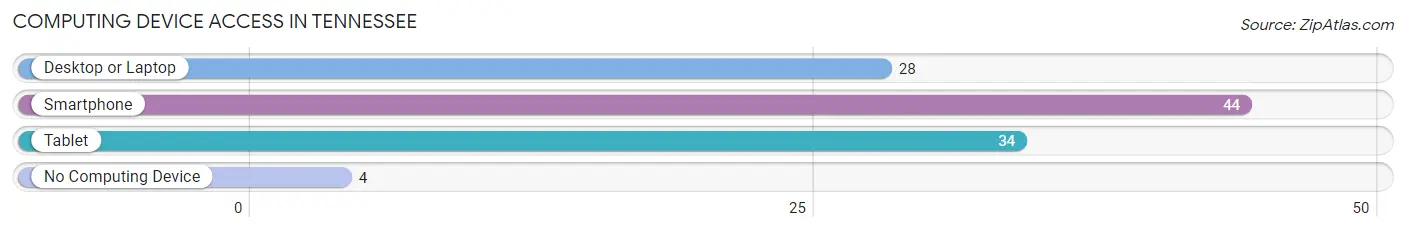
| Device Type | # Households | % Households |
| Desktop or Laptop | 28 | 49.1% |
| Smartphone | 44 | 77.2% |
| Tablet | 34 | 59.7% |
| No Computing Device | 4 | 7.0% |
| Total | 57 | 100.0% |
Internet Access in Tennessee
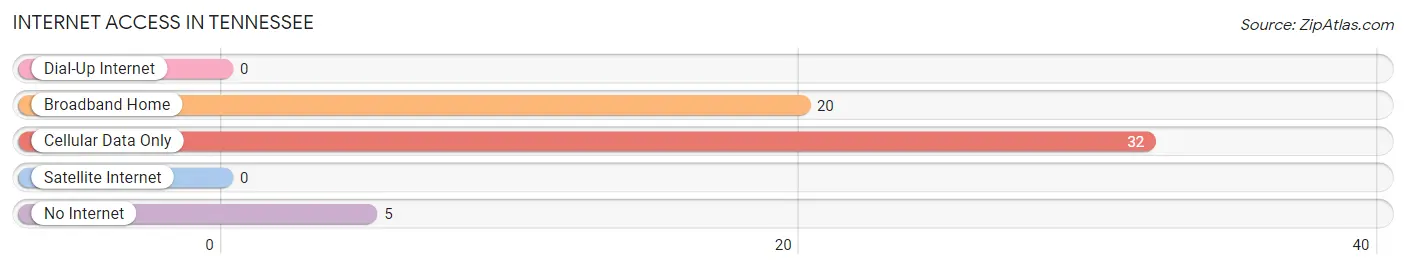
| Internet Type | # Households | % Households |
| Dial-Up Internet | 0 | 0.0% |
| Broadband Home | 20 | 35.1% |
| Cellular Data Only | 32 | 56.1% |
| Satellite Internet | 0 | 0.0% |
| No Internet | 5 | 8.8% |
| Total | 57 | 100.0% |
Tennessee Summary
Tennessee is a state located in the southeastern region of the United States. It is bordered by eight states, including Kentucky, Virginia, North Carolina, Georgia, Alabama, Mississippi, Arkansas, and Missouri. Tennessee is the 36th largest state in the United States, with an area of 42,143 square miles. It is the 16th most populous state, with a population of 6.7 million people as of 2019.
History
Tennessee was first inhabited by Native American tribes, including the Cherokee, Chickasaw, and Shawnee. The first Europeans to explore the area were Spanish explorers in the 16th century. In the late 17th century, British and French traders began to settle in the area. In 1763, the area became part of the British colony of North Carolina. In 1796, Tennessee became the 16th state to join the Union.
During the Civil War, Tennessee was the last state to secede from the Union. After the war, Tennessee was readmitted to the Union in 1866. In the late 19th century, Tennessee experienced a period of industrialization and economic growth. In the 20th century, Tennessee became a major center for the music industry, with Nashville becoming the home of country music.
Geography
Tennessee is located in the southeastern region of the United States. It is bordered by eight states, including Kentucky, Virginia, North Carolina, Georgia, Alabama, Mississippi, Arkansas, and Missouri. Tennessee is the 36th largest state in the United States, with an area of 42,143 square miles.
Tennessee is divided into three distinct geographic regions: the Appalachian Mountains in the east, the Central Basin in the middle, and the Gulf Coastal Plain in the west. The Appalachian Mountains are the oldest mountain range in the United States and are home to the Great Smoky Mountains National Park. The Central Basin is a low-lying area that is home to the state capital, Nashville. The Gulf Coastal Plain is a flat, low-lying area that is home to the Mississippi River.
Economy
Tennessee has a diverse economy that is driven by agriculture, manufacturing, and tourism. Agriculture is the state’s largest industry, with soybeans, cotton, and tobacco being the main crops. Manufacturing is also a major industry, with automotive, chemical, and food processing being the main industries. Tourism is also a major industry, with the Great Smoky Mountains National Park being the most popular destination.
Demographics
As of 2019, Tennessee had a population of 6.7 million people. The state is predominantly white, with 77.7% of the population identifying as white. African Americans make up 16.7% of the population, while Hispanics and Latinos make up 4.3%. The median household income in Tennessee is $50,564, and the poverty rate is 15.2%. The largest cities in Tennessee are Memphis, Nashville, Knoxville, and Chattanooga.
Common Questions
What is Per Capita Income in Tennessee?
Per Capita income in Tennessee is $28,991.
What is the Median Family Income in Tennessee?
Median Family Income in Tennessee is $58,333.
What is the Median Household income in Tennessee?
Median Household Income in Tennessee is $61,250.
What is Income or Wage Gap in Tennessee?
Income or Wage Gap in Tennessee is 11.0%.
Women in Tennessee earn 89.0 cents for every dollar earned by a man.
What is Inequality or Gini Index in Tennessee?
Inequality or Gini Index in Tennessee is 0.33.
What is the Total Population of Tennessee?
Total Population of Tennessee is 119.
What is the Total Male Population of Tennessee?
Total Male Population of Tennessee is 59.
What is the Total Female Population of Tennessee?
Total Female Population of Tennessee is 60.
What is the Ratio of Males per 100 Females in Tennessee?
There are 98.33 Males per 100 Females in Tennessee.
What is the Ratio of Females per 100 Males in Tennessee?
There are 101.69 Females per 100 Males in Tennessee.
What is the Median Population Age in Tennessee?
Median Population Age in Tennessee is 39.2 Years.
What is the Average Family Size in Tennessee
Average Family Size in Tennessee is 2.4 People.
What is the Average Household Size in Tennessee
Average Household Size in Tennessee is 2.1 People.
How Large is the Labor Force in Tennessee?
There are 79 People in the Labor Forcein in Tennessee.
What is the Percentage of People in the Labor Force in Tennessee?
82.3% of People are in the Labor Force in Tennessee.
What is the Unemployment Rate in Tennessee?
Unemployment Rate in Tennessee is 8.9%.