Taylor Springs, IL Map & Demographics
Taylor Springs Map
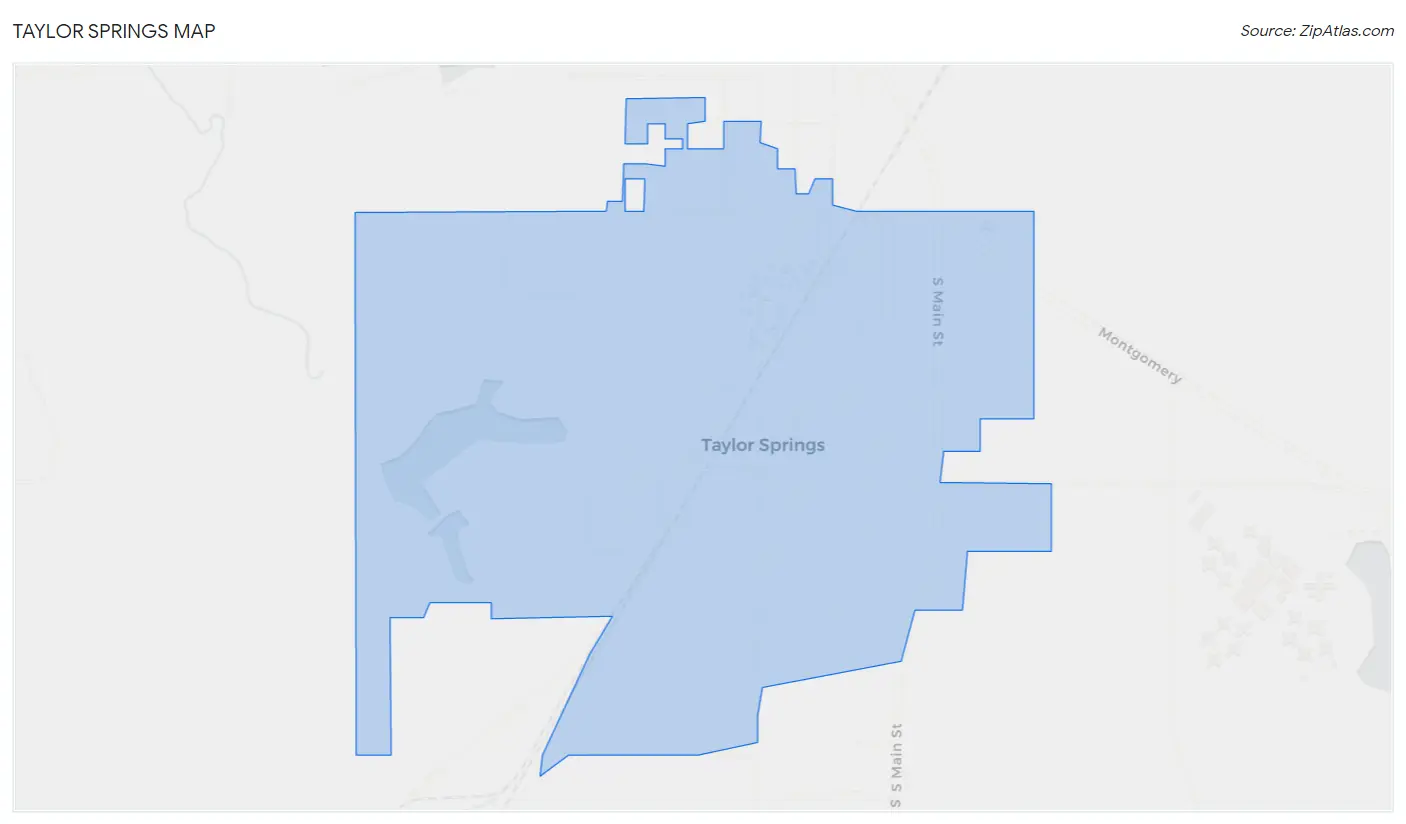
Taylor Springs Overview
$23,470
PER CAPITA INCOME
$43,676
AVG FAMILY INCOME
$43,155
AVG HOUSEHOLD INCOME
19.2%
WAGE / INCOME GAP [ % ]
80.8¢/ $1
WAGE / INCOME GAP [ $ ]
$6,868
FAMILY INCOME DEFICIT
0.39
INEQUALITY / GINI INDEX
663
TOTAL POPULATION
294
MALE POPULATION
369
FEMALE POPULATION
79.67
MALES / 100 FEMALES
125.51
FEMALES / 100 MALES
61.7
MEDIAN AGE
2.3
AVG FAMILY SIZE
2.0
AVG HOUSEHOLD SIZE
182
LABOR FORCE [ PEOPLE ]
31.0%
PERCENT IN LABOR FORCE
3.8%
UNEMPLOYMENT RATE
Taylor Springs Zip Codes
Taylor Springs Area Codes
Income in Taylor Springs
Income Overview in Taylor Springs
Per Capita Income in Taylor Springs is $23,470, while median incomes of families and households are $43,676 and $43,155 respectively.
| Characteristic | Number | Measure |
| Per Capita Income | 663 | $23,470 |
| Median Family Income | 166 | $43,676 |
| Mean Family Income | 166 | $59,252 |
| Median Household Income | 271 | $43,155 |
| Mean Household Income | 271 | $52,990 |
| Income Deficit | 166 | $6,868 |
| Wage / Income Gap (%) | 663 | 19.15% |
| Wage / Income Gap ($) | 663 | 80.85¢ per $1 |
| Gini / Inequality Index | 663 | 0.39 |
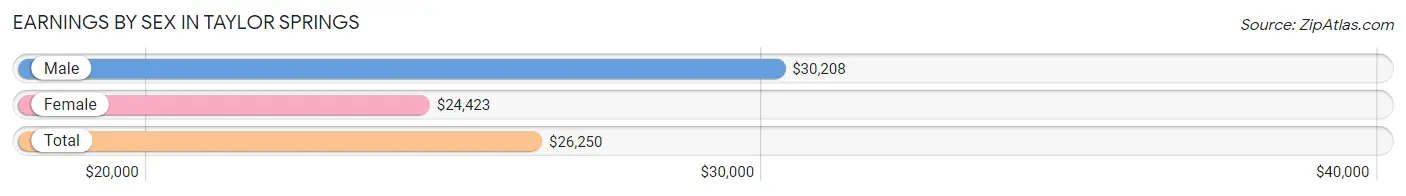
Earnings by Sex in Taylor Springs
Average Earnings in Taylor Springs are $26,250, $30,208 for men and $24,423 for women, a difference of 19.2%.
| Sex | Number | Average Earnings |
| Male | 109 (53.7%) | $30,208 |
| Female | 94 (46.3%) | $24,423 |
| Total | 203 (100.0%) | $26,250 |
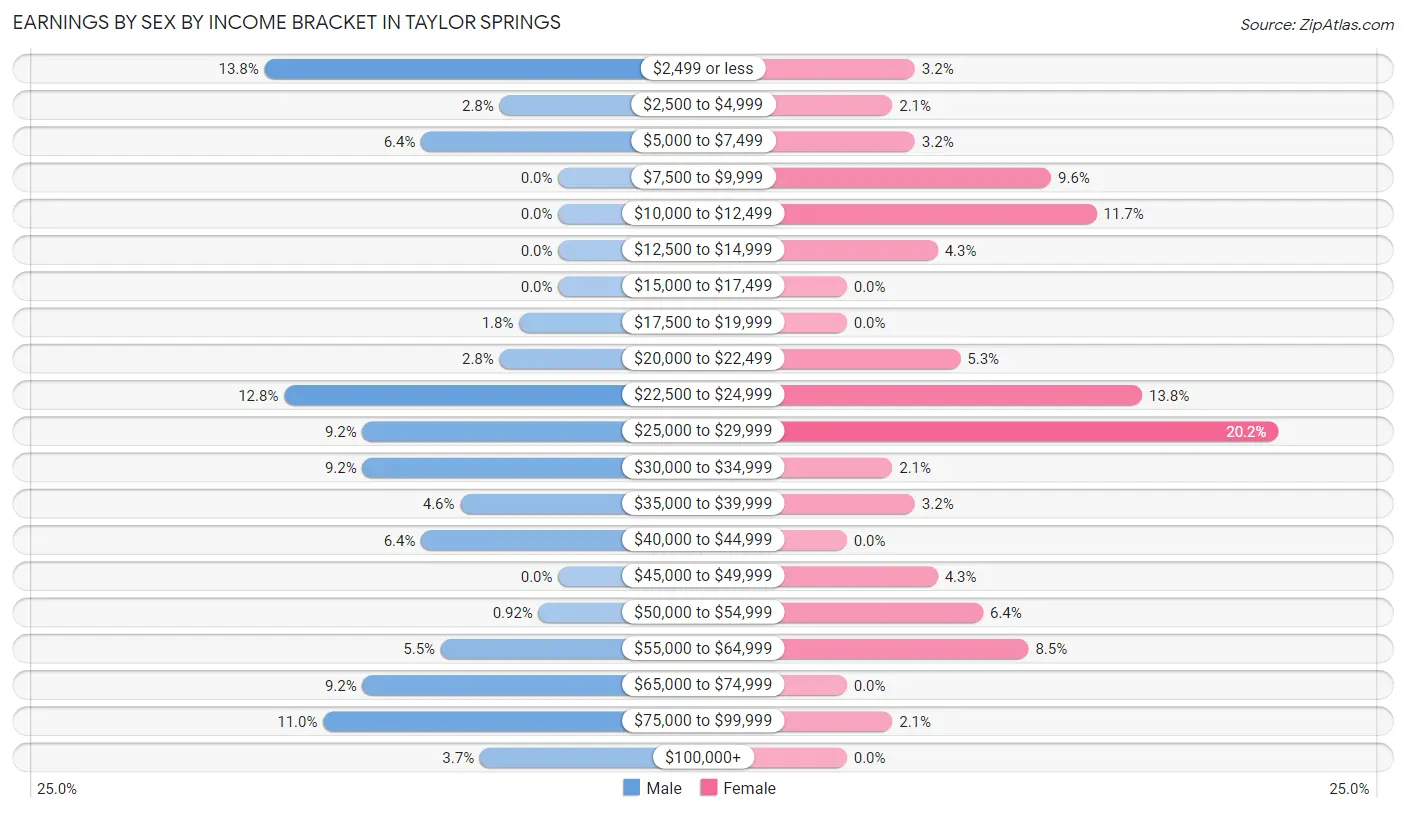
Earnings by Sex by Income Bracket in Taylor Springs
The most common earnings brackets in Taylor Springs are $2,499 or less for men (15 | 13.8%) and $25,000 to $29,999 for women (19 | 20.2%).
| Income | Male | Female |
| $2,499 or less | 15 (13.8%) | 3 (3.2%) |
| $2,500 to $4,999 | 3 (2.8%) | 2 (2.1%) |
| $5,000 to $7,499 | 7 (6.4%) | 3 (3.2%) |
| $7,500 to $9,999 | 0 (0.0%) | 9 (9.6%) |
| $10,000 to $12,499 | 0 (0.0%) | 11 (11.7%) |
| $12,500 to $14,999 | 0 (0.0%) | 4 (4.3%) |
| $15,000 to $17,499 | 0 (0.0%) | 0 (0.0%) |
| $17,500 to $19,999 | 2 (1.8%) | 0 (0.0%) |
| $20,000 to $22,499 | 3 (2.8%) | 5 (5.3%) |
| $22,500 to $24,999 | 14 (12.8%) | 13 (13.8%) |
| $25,000 to $29,999 | 10 (9.2%) | 19 (20.2%) |
| $30,000 to $34,999 | 10 (9.2%) | 2 (2.1%) |
| $35,000 to $39,999 | 5 (4.6%) | 3 (3.2%) |
| $40,000 to $44,999 | 7 (6.4%) | 0 (0.0%) |
| $45,000 to $49,999 | 0 (0.0%) | 4 (4.3%) |
| $50,000 to $54,999 | 1 (0.9%) | 6 (6.4%) |
| $55,000 to $64,999 | 6 (5.5%) | 8 (8.5%) |
| $65,000 to $74,999 | 10 (9.2%) | 0 (0.0%) |
| $75,000 to $99,999 | 12 (11.0%) | 2 (2.1%) |
| $100,000+ | 4 (3.7%) | 0 (0.0%) |
| Total | 109 (100.0%) | 94 (100.0%) |
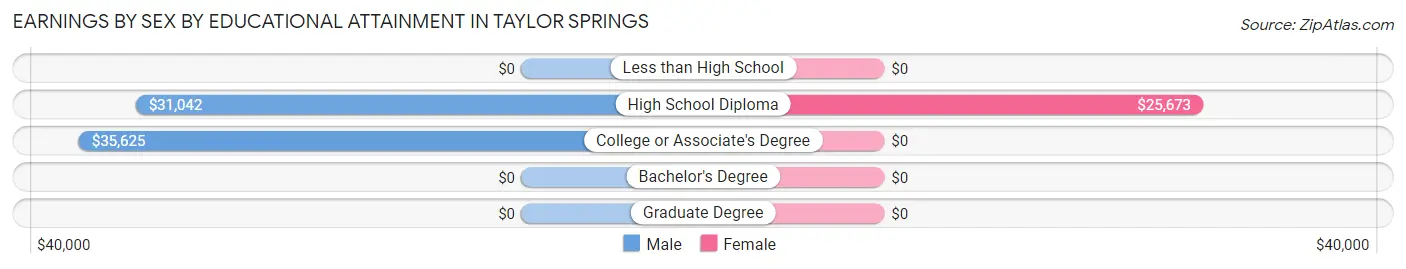
Earnings by Sex by Educational Attainment in Taylor Springs
Average earnings in Taylor Springs are $31,667 for men and $25,192 for women, a difference of 20.4%. Men with an educational attainment of college or associate's degree enjoy the highest average annual earnings of $35,625, while those with high school diploma education earn the least with $31,042. Women with an educational attainment of high school diploma earn the most with the average annual earnings of $25,673, while those with high school diploma education have the smallest earnings of $25,673.
| Educational Attainment | Male Income | Female Income |
| Less than High School | - | - |
| High School Diploma | $31,042 | $25,673 |
| College or Associate's Degree | $35,625 | $0 |
| Bachelor's Degree | - | - |
| Graduate Degree | - | - |
| Total | $31,667 | $25,192 |
Family Income in Taylor Springs
Family Income Brackets in Taylor Springs
According to the Taylor Springs family income data, there are 34 families falling into the $25,000 to $34,999 income range, which is the most common income bracket and makes up 20.5% of all families. Conversely, the $200,000+ income bracket is the least frequent group with only 2 families (1.2%) belonging to this category.
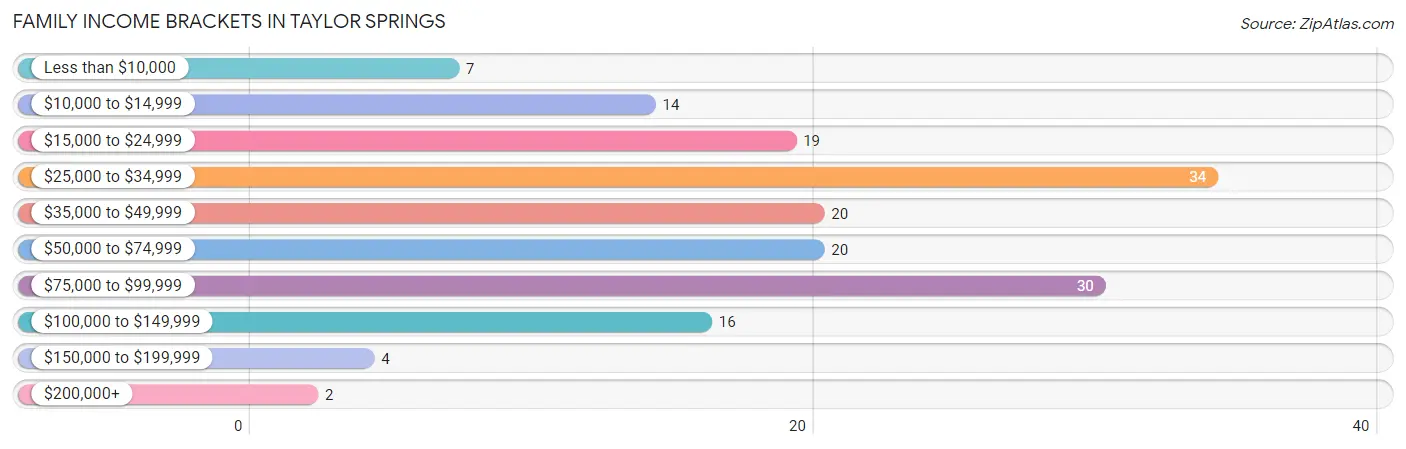
| Income Bracket | # Families | % Families |
| Less than $10,000 | 7 | 4.2% |
| $10,000 to $14,999 | 14 | 8.4% |
| $15,000 to $24,999 | 19 | 11.4% |
| $25,000 to $34,999 | 34 | 20.5% |
| $35,000 to $49,999 | 20 | 12.0% |
| $50,000 to $74,999 | 20 | 12.0% |
| $75,000 to $99,999 | 30 | 18.1% |
| $100,000 to $149,999 | 16 | 9.6% |
| $150,000 to $199,999 | 4 | 2.4% |
| $200,000+ | 2 | 1.2% |
Family Income by Famaliy Size in Taylor Springs
3-person families (46 | 27.7%) account for the highest median family income in Taylor Springs with $43,750 per family, while 2-person families (115 | 69.3%) have the highest median income of $21,625 per family member.
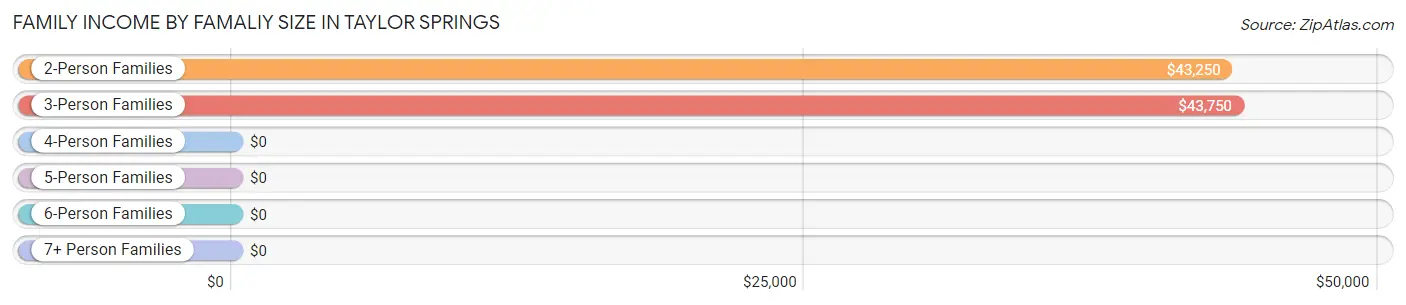
| Income Bracket | # Families | Median Income |
| 2-Person Families | 115 (69.3%) | $43,250 |
| 3-Person Families | 46 (27.7%) | $43,750 |
| 4-Person Families | 3 (1.8%) | $0 |
| 5-Person Families | 2 (1.2%) | $0 |
| 6-Person Families | 0 (0.0%) | $0 |
| 7+ Person Families | 0 (0.0%) | $0 |
| Total | 166 (100.0%) | $43,676 |
Family Income by Number of Earners in Taylor Springs
The median family income in Taylor Springs is $43,676, with families comprising 3+ earners (11) having the highest median family income of $118,250, while families with no earners (66) have the lowest median family income of $28,958, accounting for 6.6% and 39.8% of families, respectively.
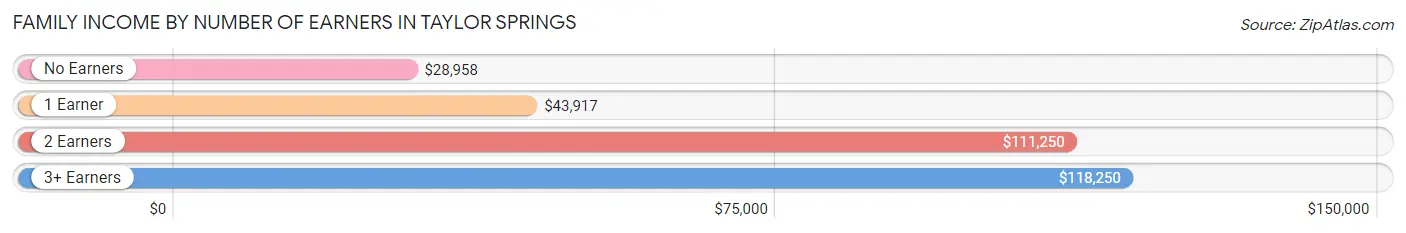
| Number of Earners | # Families | Median Income |
| No Earners | 66 (39.8%) | $28,958 |
| 1 Earner | 61 (36.7%) | $43,917 |
| 2 Earners | 28 (16.9%) | $111,250 |
| 3+ Earners | 11 (6.6%) | $118,250 |
| Total | 166 (100.0%) | $43,676 |
Household Income in Taylor Springs
Household Income Brackets in Taylor Springs
With 75 households falling in the category, the $25,000 to $34,999 income range is the most frequent in Taylor Springs, accounting for 27.7% of all households. In contrast, only 2 households (0.7%) fall into the $200,000+ income bracket, making it the least populous group.
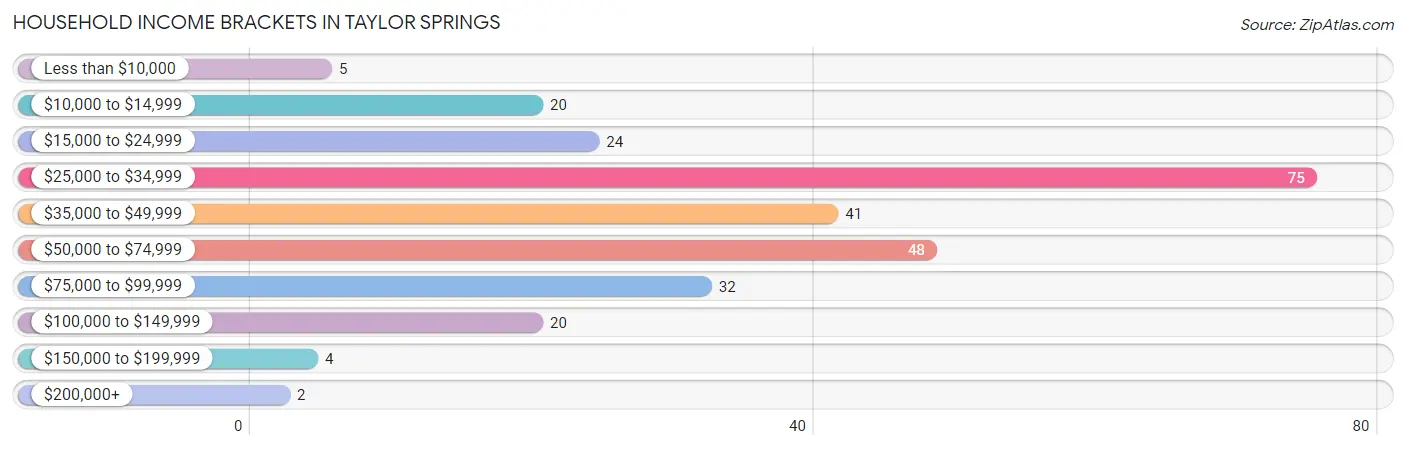
| Income Bracket | # Households | % Households |
| Less than $10,000 | 5 | 1.8% |
| $10,000 to $14,999 | 20 | 7.4% |
| $15,000 to $24,999 | 24 | 8.9% |
| $25,000 to $34,999 | 75 | 27.7% |
| $35,000 to $49,999 | 41 | 15.1% |
| $50,000 to $74,999 | 48 | 17.7% |
| $75,000 to $99,999 | 32 | 11.8% |
| $100,000 to $149,999 | 20 | 7.4% |
| $150,000 to $199,999 | 4 | 1.5% |
| $200,000+ | 2 | 0.7% |
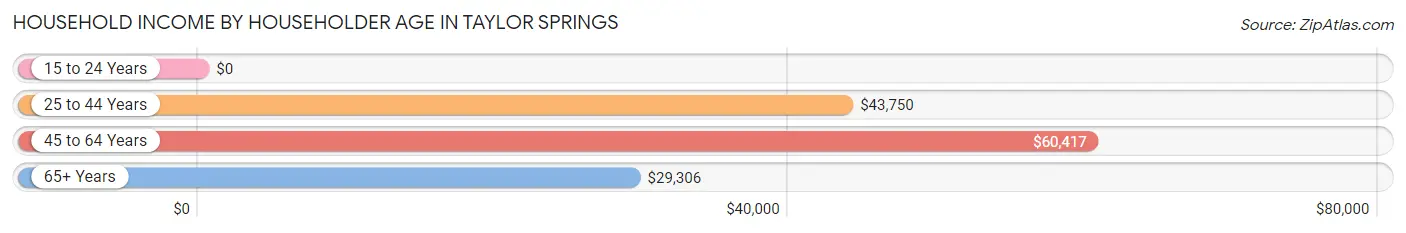
Household Income by Householder Age in Taylor Springs
The median household income in Taylor Springs is $43,155, with the highest median household income of $60,417 found in the 45 to 64 years age bracket for the primary householder. A total of 111 households (41.0%) fall into this category. Meanwhile, the 15 to 24 years age bracket for the primary householder has the lowest median household income of $0, with 5 households (1.8%) in this group.
| Income Bracket | # Households | Median Income |
| 15 to 24 Years | 5 (1.8%) | $0 |
| 25 to 44 Years | 40 (14.8%) | $43,750 |
| 45 to 64 Years | 111 (41.0%) | $60,417 |
| 65+ Years | 115 (42.4%) | $29,306 |
| Total | 271 (100.0%) | $43,155 |
Poverty in Taylor Springs
Income Below Poverty by Sex and Age in Taylor Springs
With 23.8% poverty level for males and 24.2% for females among the residents of Taylor Springs, under 5 year old males and 5 year old females are the most vulnerable to poverty, with 19 males (100.0%) and 2 females (100.0%) in their respective age groups living below the poverty level.
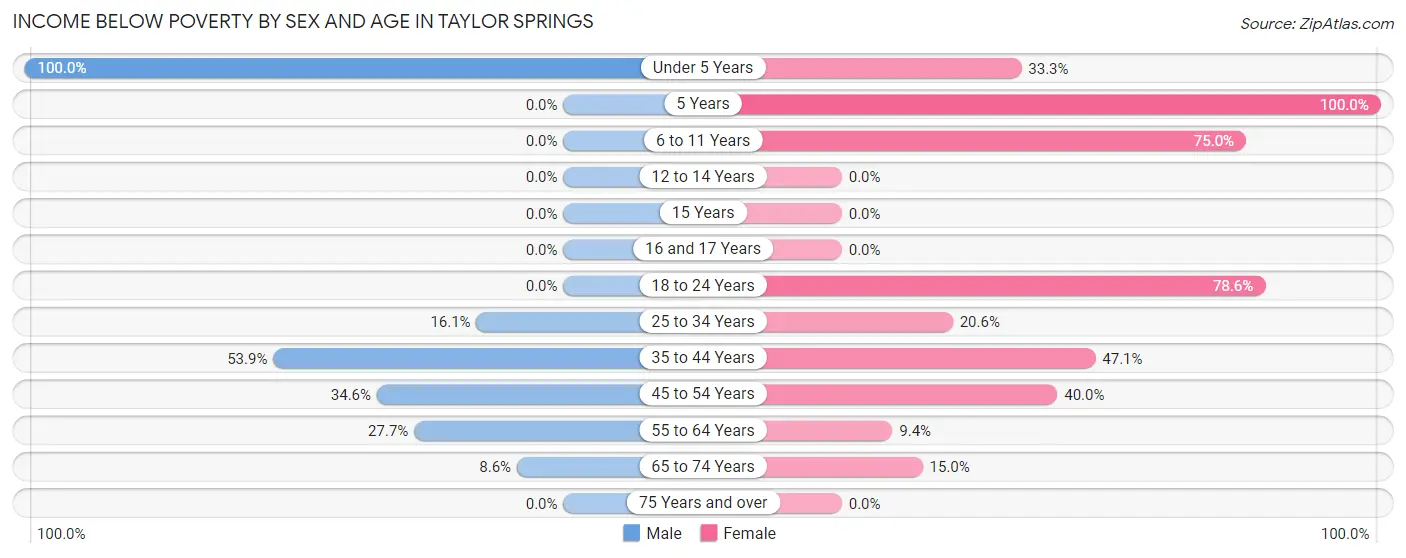
| Age Bracket | Male | Female |
| Under 5 Years | 19 (100.0%) | 6 (33.3%) |
| 5 Years | 0 (0.0%) | 2 (100.0%) |
| 6 to 11 Years | 0 (0.0%) | 12 (75.0%) |
| 12 to 14 Years | 0 (0.0%) | 0 (0.0%) |
| 15 Years | 0 (0.0%) | 0 (0.0%) |
| 16 and 17 Years | 0 (0.0%) | 0 (0.0%) |
| 18 to 24 Years | 0 (0.0%) | 11 (78.6%) |
| 25 to 34 Years | 5 (16.1%) | 7 (20.6%) |
| 35 to 44 Years | 7 (53.8%) | 8 (47.1%) |
| 45 to 54 Years | 9 (34.6%) | 8 (40.0%) |
| 55 to 64 Years | 18 (27.7%) | 6 (9.4%) |
| 65 to 74 Years | 5 (8.6%) | 6 (15.0%) |
| 75 Years and over | 0 (0.0%) | 0 (0.0%) |
| Total | 63 (23.8%) | 66 (24.2%) |
Income Above Poverty by Sex and Age in Taylor Springs
According to the poverty statistics in Taylor Springs, males aged 5 years and females aged 12 to 14 years are the age groups that are most secure financially, with 100.0% of males and 100.0% of females in these age groups living above the poverty line.
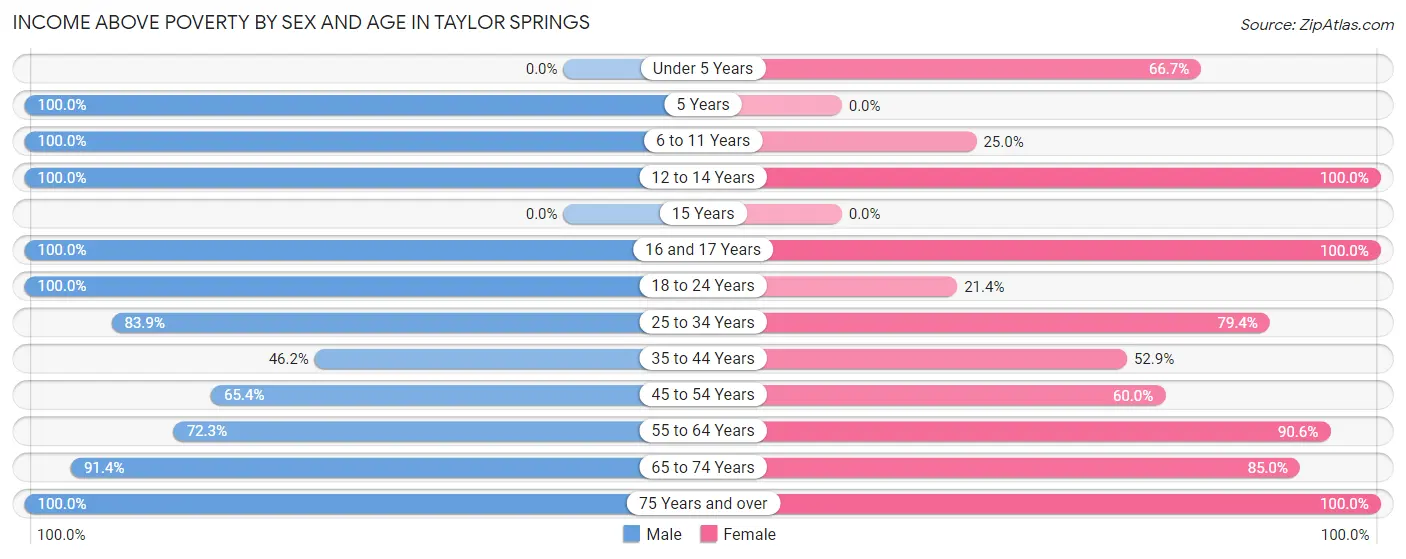
| Age Bracket | Male | Female |
| Under 5 Years | 0 (0.0%) | 12 (66.7%) |
| 5 Years | 2 (100.0%) | 0 (0.0%) |
| 6 to 11 Years | 2 (100.0%) | 4 (25.0%) |
| 12 to 14 Years | 4 (100.0%) | 8 (100.0%) |
| 15 Years | 0 (0.0%) | 0 (0.0%) |
| 16 and 17 Years | 1 (100.0%) | 2 (100.0%) |
| 18 to 24 Years | 6 (100.0%) | 3 (21.4%) |
| 25 to 34 Years | 26 (83.9%) | 27 (79.4%) |
| 35 to 44 Years | 6 (46.2%) | 9 (52.9%) |
| 45 to 54 Years | 17 (65.4%) | 12 (60.0%) |
| 55 to 64 Years | 47 (72.3%) | 58 (90.6%) |
| 65 to 74 Years | 53 (91.4%) | 34 (85.0%) |
| 75 Years and over | 38 (100.0%) | 38 (100.0%) |
| Total | 202 (76.2%) | 207 (75.8%) |
Income Below Poverty Among Married-Couple Families in Taylor Springs
The poverty statistics for married-couple families in Taylor Springs show that 9.9% or 12 of the total 121 families live below the poverty line. Families with no children have the highest poverty rate of 11.5%, comprising of 12 families. On the other hand, families with 1 or 2 children have the lowest poverty rate of 0.0%, which includes 0 families.
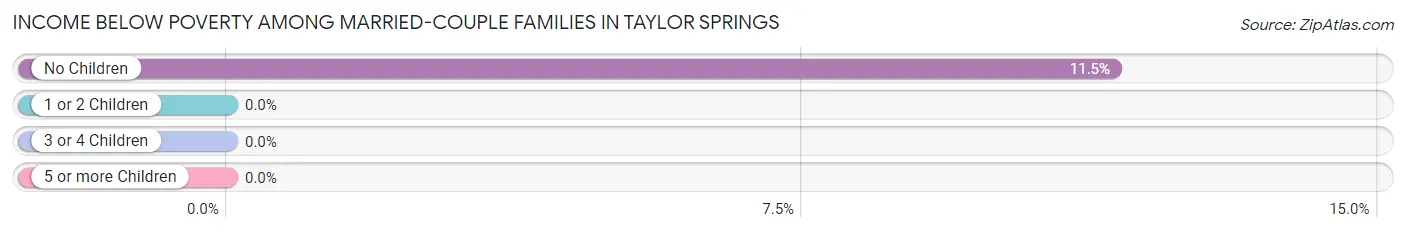
| Children | Above Poverty | Below Poverty |
| No Children | 92 (88.5%) | 12 (11.5%) |
| 1 or 2 Children | 15 (100.0%) | 0 (0.0%) |
| 3 or 4 Children | 2 (100.0%) | 0 (0.0%) |
| 5 or more Children | 0 (0.0%) | 0 (0.0%) |
| Total | 109 (90.1%) | 12 (9.9%) |
Income Below Poverty Among Single-Parent Households in Taylor Springs
According to the poverty data in Taylor Springs, 87.5% or 14 single-father households and 41.4% or 12 single-mother households are living below the poverty line. Among single-father households, those with 1 or 2 children have the highest poverty rate, with 14 households (87.5%) experiencing poverty. Likewise, among single-mother households, those with 1 or 2 children have the highest poverty rate, with 12 households (100.0%) falling below the poverty line.
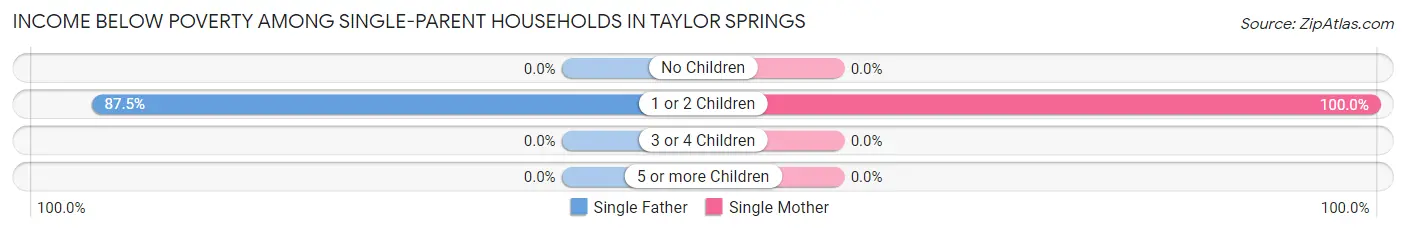
| Children | Single Father | Single Mother |
| No Children | 0 (0.0%) | 0 (0.0%) |
| 1 or 2 Children | 14 (87.5%) | 12 (100.0%) |
| 3 or 4 Children | 0 (0.0%) | 0 (0.0%) |
| 5 or more Children | 0 (0.0%) | 0 (0.0%) |
| Total | 14 (87.5%) | 12 (41.4%) |
Income Below Poverty Among Married-Couple vs Single-Parent Households in Taylor Springs
The poverty data for Taylor Springs shows that 12 of the married-couple family households (9.9%) and 26 of the single-parent households (57.8%) are living below the poverty level. Within the married-couple family households, those with no children have the highest poverty rate, with 12 households (11.5%) falling below the poverty line. Among the single-parent households, those with 1 or 2 children have the highest poverty rate, with 26 household (92.9%) living below poverty.
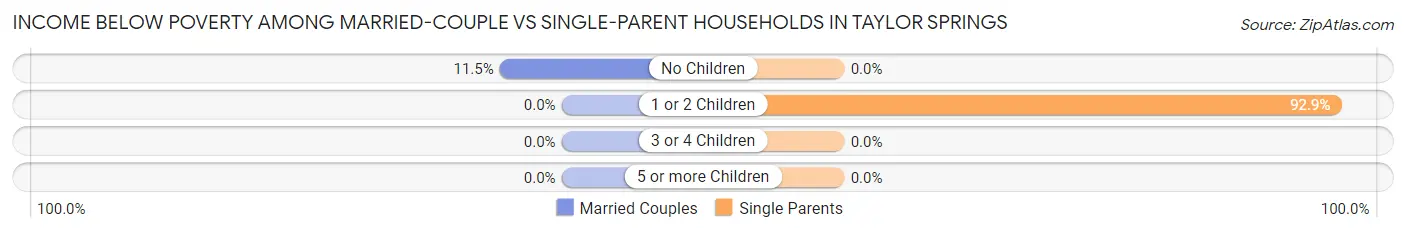
| Children | Married-Couple Families | Single-Parent Households |
| No Children | 12 (11.5%) | 0 (0.0%) |
| 1 or 2 Children | 0 (0.0%) | 26 (92.9%) |
| 3 or 4 Children | 0 (0.0%) | 0 (0.0%) |
| 5 or more Children | 0 (0.0%) | 0 (0.0%) |
| Total | 12 (9.9%) | 26 (57.8%) |
Race in Taylor Springs
The most populous races in Taylor Springs are White / Caucasian (661 | 99.7%), Hispanic or Latino (26 | 3.9%), and Some other Race (2 | 0.3%).
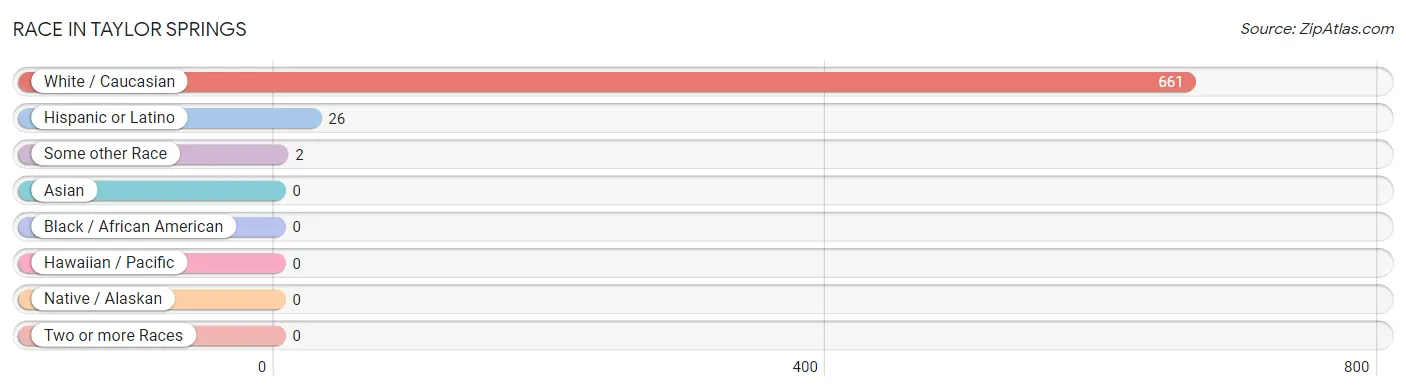
| Race | # Population | % Population |
| Asian | 0 | 0.0% |
| Black / African American | 0 | 0.0% |
| Hawaiian / Pacific | 0 | 0.0% |
| Hispanic or Latino | 26 | 3.9% |
| Native / Alaskan | 0 | 0.0% |
| White / Caucasian | 661 | 99.7% |
| Two or more Races | 0 | 0.0% |
| Some other Race | 2 | 0.3% |
| Total | 663 | 100.0% |
Ancestry in Taylor Springs
The most populous ancestries reported in Taylor Springs are German (134 | 20.2%), Irish (85 | 12.8%), English (60 | 9.0%), American (47 | 7.1%), and Italian (26 | 3.9%), together accounting for 53.1% of all Taylor Springs residents.
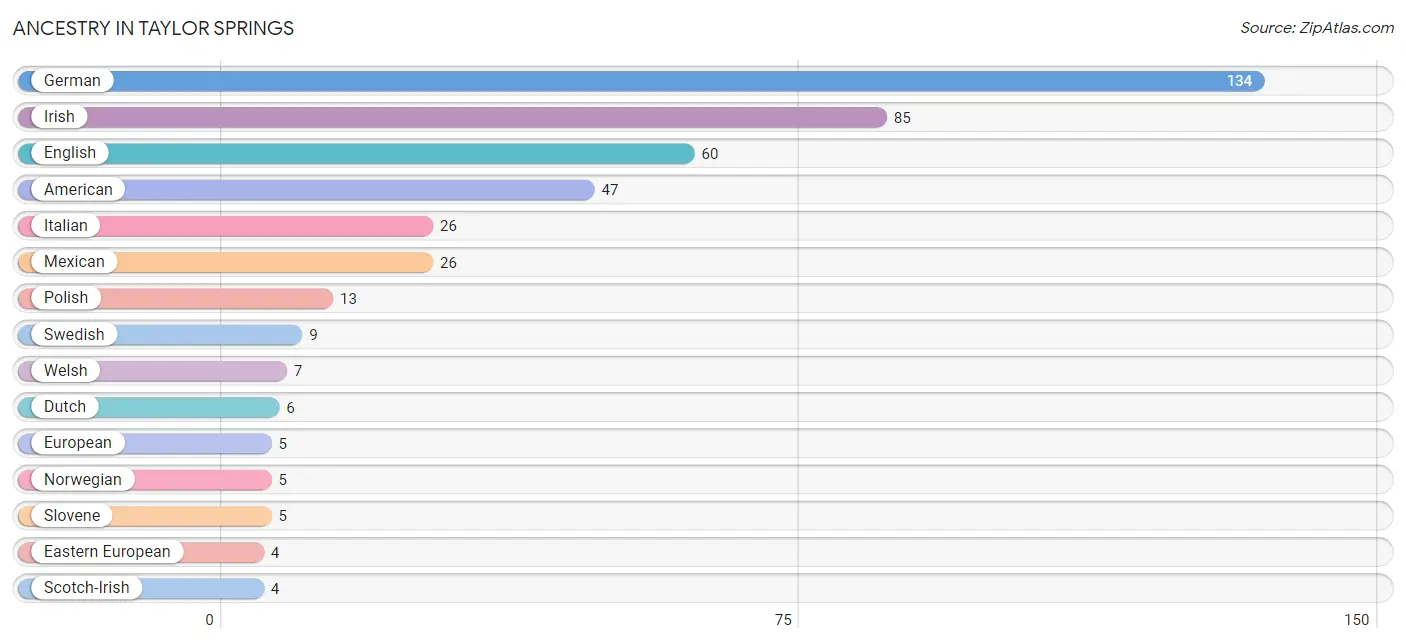
| Ancestry | # Population | % Population |
| American | 47 | 7.1% |
| Czech | 1 | 0.2% |
| Czechoslovakian | 3 | 0.4% |
| Dutch | 6 | 0.9% |
| Eastern European | 4 | 0.6% |
| English | 60 | 9.0% |
| European | 5 | 0.7% |
| French | 2 | 0.3% |
| German | 134 | 20.2% |
| Irish | 85 | 12.8% |
| Italian | 26 | 3.9% |
| Mexican | 26 | 3.9% |
| Norwegian | 5 | 0.7% |
| Polish | 13 | 2.0% |
| Scotch-Irish | 4 | 0.6% |
| Scottish | 2 | 0.3% |
| Slavic | 2 | 0.3% |
| Slovak | 3 | 0.4% |
| Slovene | 5 | 0.7% |
| Swedish | 9 | 1.4% |
| Welsh | 7 | 1.1% | View All 21 Rows |
Immigrants in Taylor Springs
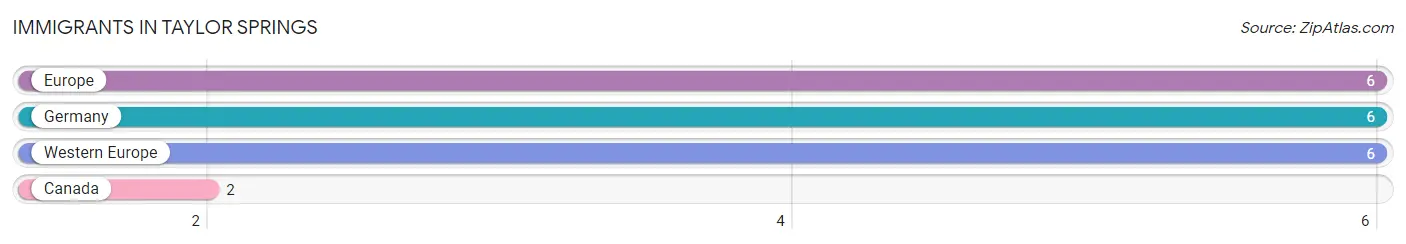
The most numerous immigrant groups reported in Taylor Springs came from Europe (6 | 0.9%), Germany (6 | 0.9%), Western Europe (6 | 0.9%), and Canada (2 | 0.3%), together accounting for 3.0% of all Taylor Springs residents.
| Immigration Origin | # Population | % Population |
| Canada | 2 | 0.3% |
| Europe | 6 | 0.9% |
| Germany | 6 | 0.9% |
| Western Europe | 6 | 0.9% | View All 4 Rows |
Sex and Age in Taylor Springs
Sex and Age in Taylor Springs
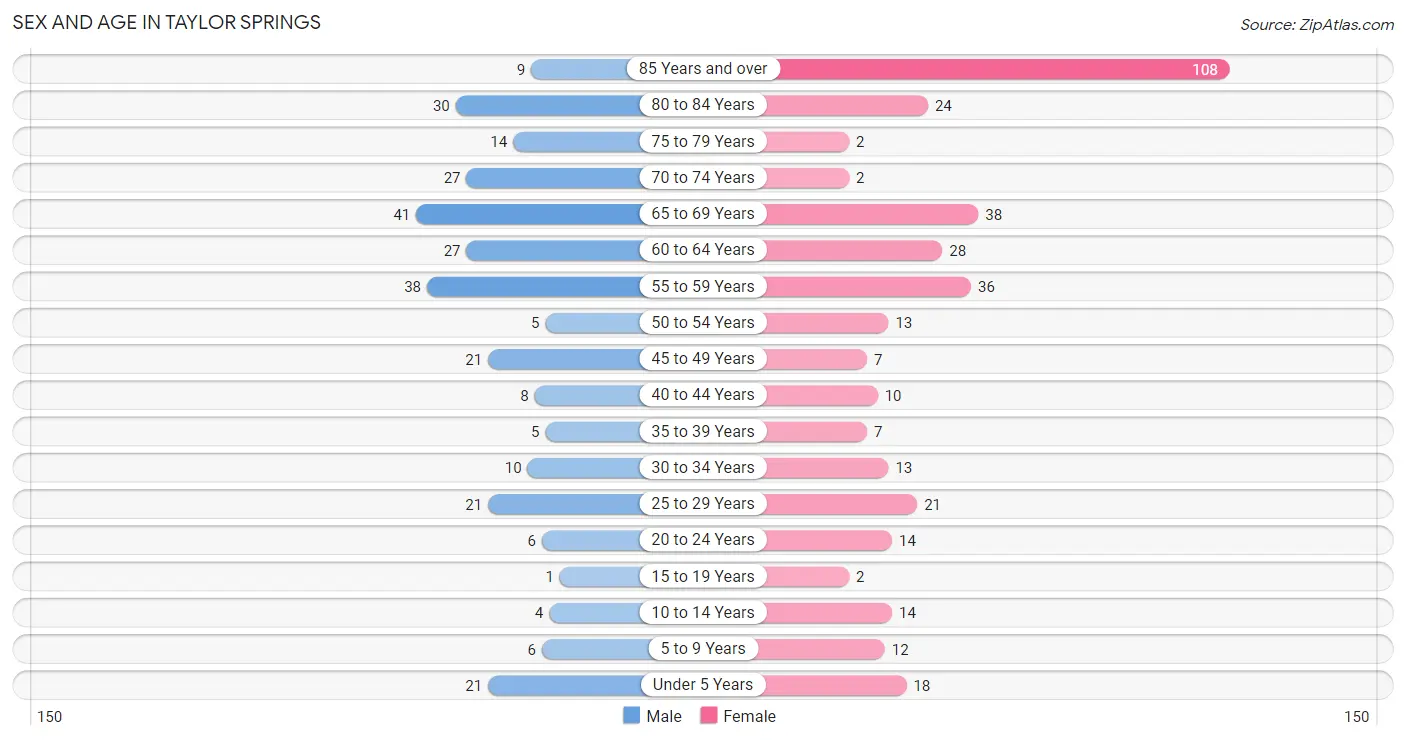
The most populous age groups in Taylor Springs are 65 to 69 Years (41 | 14.0%) for men and 85 Years and over (108 | 29.3%) for women.
| Age Bracket | Male | Female |
| Under 5 Years | 21 (7.1%) | 18 (4.9%) |
| 5 to 9 Years | 6 (2.0%) | 12 (3.3%) |
| 10 to 14 Years | 4 (1.4%) | 14 (3.8%) |
| 15 to 19 Years | 1 (0.3%) | 2 (0.5%) |
| 20 to 24 Years | 6 (2.0%) | 14 (3.8%) |
| 25 to 29 Years | 21 (7.1%) | 21 (5.7%) |
| 30 to 34 Years | 10 (3.4%) | 13 (3.5%) |
| 35 to 39 Years | 5 (1.7%) | 7 (1.9%) |
| 40 to 44 Years | 8 (2.7%) | 10 (2.7%) |
| 45 to 49 Years | 21 (7.1%) | 7 (1.9%) |
| 50 to 54 Years | 5 (1.7%) | 13 (3.5%) |
| 55 to 59 Years | 38 (12.9%) | 36 (9.8%) |
| 60 to 64 Years | 27 (9.2%) | 28 (7.6%) |
| 65 to 69 Years | 41 (14.0%) | 38 (10.3%) |
| 70 to 74 Years | 27 (9.2%) | 2 (0.5%) |
| 75 to 79 Years | 14 (4.8%) | 2 (0.5%) |
| 80 to 84 Years | 30 (10.2%) | 24 (6.5%) |
| 85 Years and over | 9 (3.1%) | 108 (29.3%) |
| Total | 294 (100.0%) | 369 (100.0%) |
Families and Households in Taylor Springs
Median Family Size in Taylor Springs
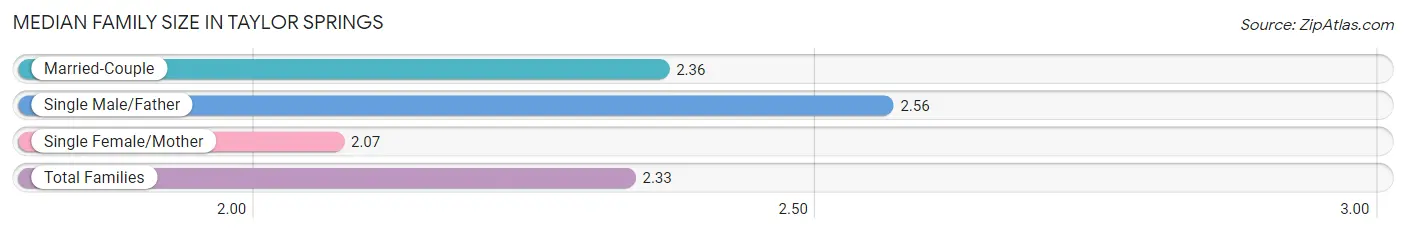
The median family size in Taylor Springs is 2.33 persons per family, with single male/father families (16 | 9.6%) accounting for the largest median family size of 2.56 persons per family. On the other hand, single female/mother families (29 | 17.5%) represent the smallest median family size with 2.07 persons per family.
| Family Type | # Families | Family Size |
| Married-Couple | 121 (72.9%) | 2.36 |
| Single Male/Father | 16 (9.6%) | 2.56 |
| Single Female/Mother | 29 (17.5%) | 2.07 |
| Total Families | 166 (100.0%) | 2.33 |
Median Household Size in Taylor Springs
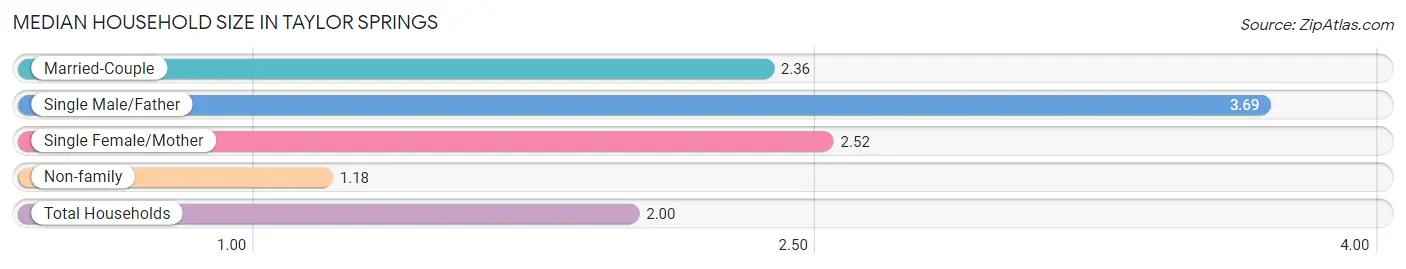
The median household size in Taylor Springs is 2.00 persons per household, with single male/father households (16 | 5.9%) accounting for the largest median household size of 3.69 persons per household. non-family households (105 | 38.8%) represent the smallest median household size with 1.18 persons per household.
| Household Type | # Households | Household Size |
| Married-Couple | 121 (44.7%) | 2.36 |
| Single Male/Father | 16 (5.9%) | 3.69 |
| Single Female/Mother | 29 (10.7%) | 2.52 |
| Non-family | 105 (38.8%) | 1.18 |
| Total Households | 271 (100.0%) | 2.00 |
Household Size by Marriage Status in Taylor Springs
Out of a total of 271 households in Taylor Springs, 166 (61.3%) are family households, while 105 (38.8%) are nonfamily households. The most numerous type of family households are 2-person households, comprising 110, and the most common type of nonfamily households are 1-person households, comprising 94.
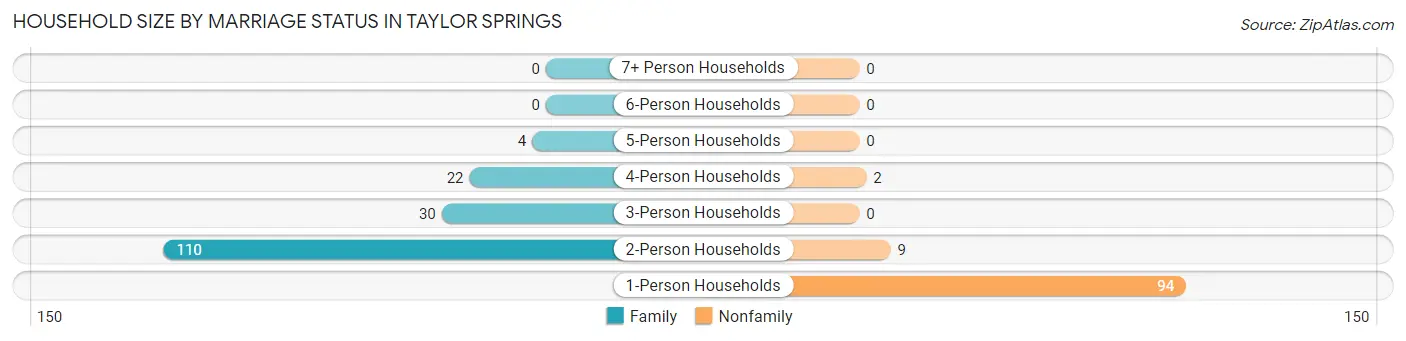
| Household Size | Family Households | Nonfamily Households |
| 1-Person Households | - | 94 (34.7%) |
| 2-Person Households | 110 (40.6%) | 9 (3.3%) |
| 3-Person Households | 30 (11.1%) | 0 (0.0%) |
| 4-Person Households | 22 (8.1%) | 2 (0.7%) |
| 5-Person Households | 4 (1.5%) | 0 (0.0%) |
| 6-Person Households | 0 (0.0%) | 0 (0.0%) |
| 7+ Person Households | 0 (0.0%) | 0 (0.0%) |
| Total | 166 (61.3%) | 105 (38.8%) |
Female Fertility in Taylor Springs
Fertility by Age in Taylor Springs
Average fertility rate in Taylor Springs is 160.0 births per 1,000 women. Women in the age bracket of 20 to 34 years have the highest fertility rate with 208.0 births per 1,000 women. Women in the age bracket of 20 to 34 years acount for 83.3% of all women with births.
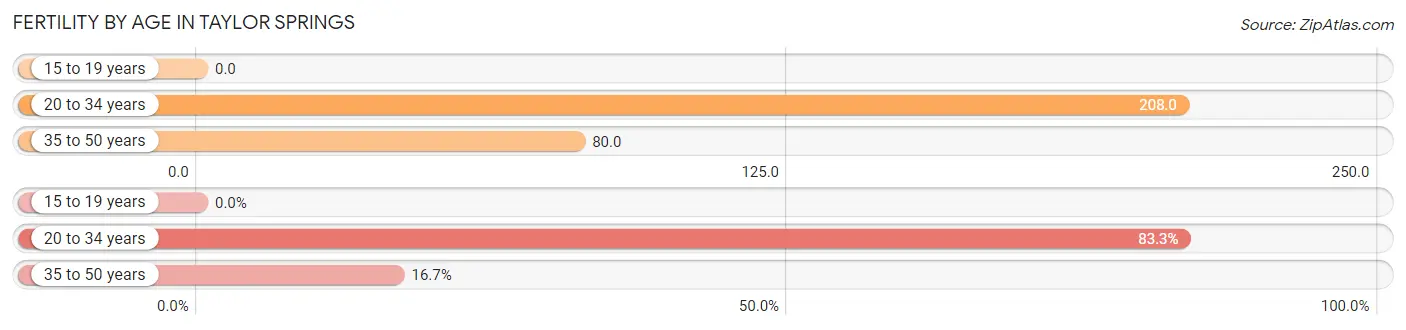
| Age Bracket | Women with Births | Births / 1,000 Women |
| 15 to 19 years | 0 (0.0%) | 0.0 |
| 20 to 34 years | 10 (83.3%) | 208.0 |
| 35 to 50 years | 2 (16.7%) | 80.0 |
| Total | 12 (100.0%) | 160.0 |
Fertility by Age by Marriage Status in Taylor Springs
50.0% of women with births (12) in Taylor Springs are married. The highest percentage of unmarried women with births falls into 20 to 34 years age bracket with 60.0% of them unmarried at the time of birth, while the lowest percentage of unmarried women with births belong to 35 to 50 years age bracket with 0.0% of them unmarried.
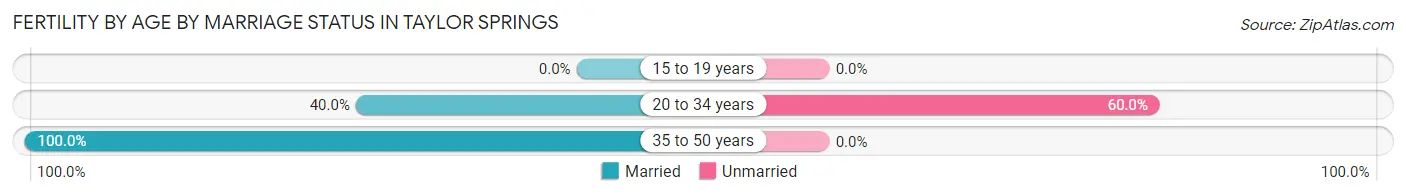
| Age Bracket | Married | Unmarried |
| 15 to 19 years | 0 (0.0%) | 0 (0.0%) |
| 20 to 34 years | 4 (40.0%) | 6 (60.0%) |
| 35 to 50 years | 2 (100.0%) | 0 (0.0%) |
| Total | 6 (50.0%) | 6 (50.0%) |
Fertility by Education in Taylor Springs
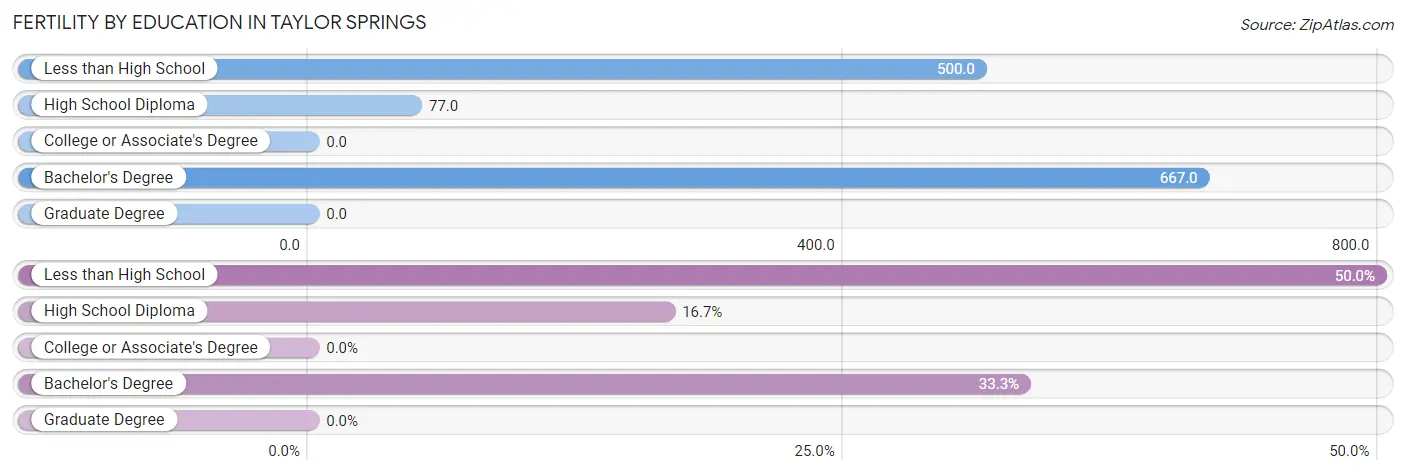
| Educational Attainment | Women with Births | Births / 1,000 Women |
| Less than High School | 6 (50.0%) | 500.0 |
| High School Diploma | 2 (16.7%) | 77.0 |
| College or Associate's Degree | 0 (0.0%) | 0.0 |
| Bachelor's Degree | 4 (33.3%) | 667.0 |
| Graduate Degree | 0 (0.0%) | 0.0 |
| Total | 12 (100.0%) | 160.0 |
Fertility by Education by Marriage Status in Taylor Springs
50.0% of women with births in Taylor Springs are unmarried. Women with the educational attainment of high school diploma are most likely to be married with 100.0% of them married at childbirth, while women with the educational attainment of less than high school are least likely to be married with 100.0% of them unmarried at childbirth.
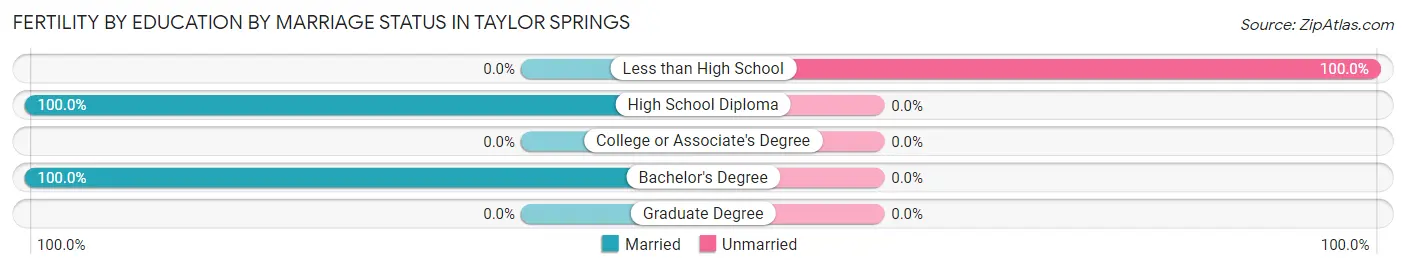
| Educational Attainment | Married | Unmarried |
| Less than High School | 0 (0.0%) | 6 (100.0%) |
| High School Diploma | 2 (100.0%) | 0 (0.0%) |
| College or Associate's Degree | 0 (0.0%) | 0 (0.0%) |
| Bachelor's Degree | 4 (100.0%) | 0 (0.0%) |
| Graduate Degree | 0 (0.0%) | 0 (0.0%) |
| Total | 6 (50.0%) | 6 (50.0%) |
Employment Characteristics in Taylor Springs
Employment by Class of Employer in Taylor Springs
Among the 159 employed individuals in Taylor Springs, private company employees (99 | 62.3%), local government employees (30 | 18.9%), and not-for-profit organizations (9 | 5.7%) make up the most common classes of employment.
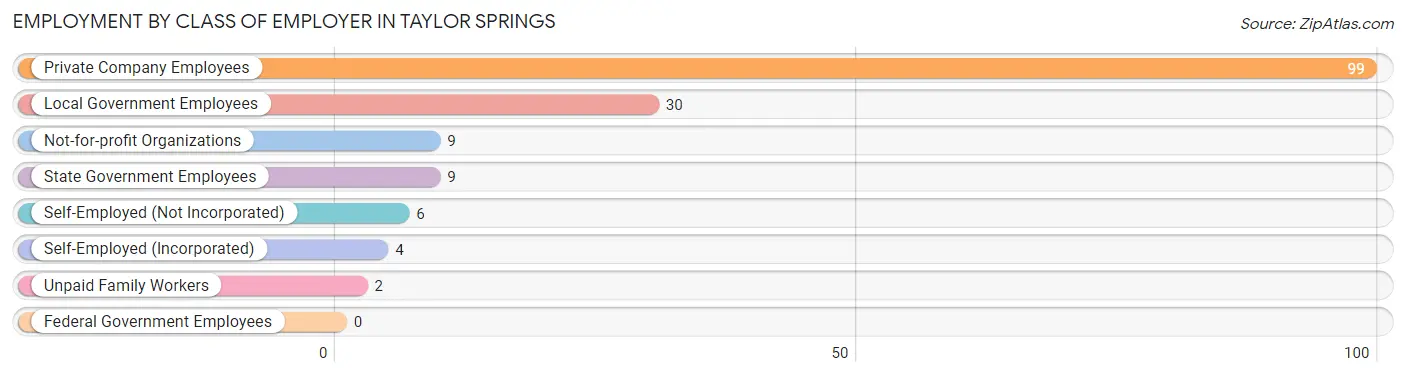
| Employer Class | # Employees | % Employees |
| Private Company Employees | 99 | 62.3% |
| Self-Employed (Incorporated) | 4 | 2.5% |
| Self-Employed (Not Incorporated) | 6 | 3.8% |
| Not-for-profit Organizations | 9 | 5.7% |
| Local Government Employees | 30 | 18.9% |
| State Government Employees | 9 | 5.7% |
| Federal Government Employees | 0 | 0.0% |
| Unpaid Family Workers | 2 | 1.3% |
| Total | 159 | 100.0% |
Employment Status by Age in Taylor Springs
According to the labor force statistics for Taylor Springs, out of the total population over 16 years of age (588), 31.0% or 182 individuals are in the labor force, with 3.8% or 7 of them unemployed. The age group with the highest labor force participation rate is 30 to 34 years, with 100.0% or 23 individuals in the labor force. Within the labor force, the 55 to 59 years age range has the highest percentage of unemployed individuals, with 23.8% or 5 of them being unemployed.
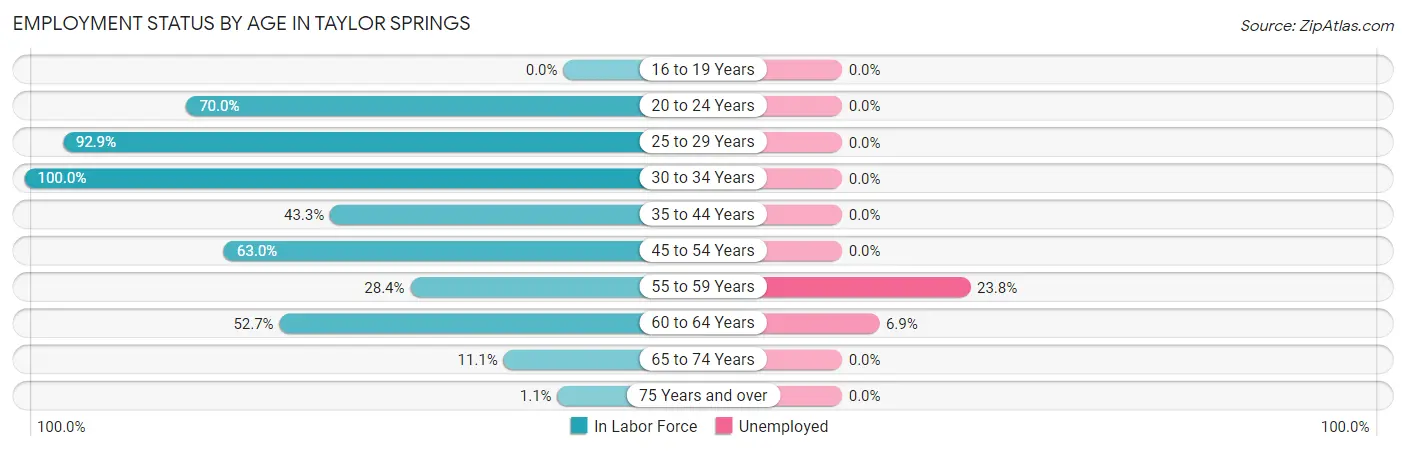
| Age Bracket | In Labor Force | Unemployed |
| 16 to 19 Years | 0 (0.0%) | 0 (0.0%) |
| 20 to 24 Years | 14 (70.0%) | 0 (0.0%) |
| 25 to 29 Years | 39 (92.9%) | 0 (0.0%) |
| 30 to 34 Years | 23 (100.0%) | 0 (0.0%) |
| 35 to 44 Years | 13 (43.3%) | 0 (0.0%) |
| 45 to 54 Years | 29 (63.0%) | 0 (0.0%) |
| 55 to 59 Years | 21 (28.4%) | 5 (23.8%) |
| 60 to 64 Years | 29 (52.7%) | 2 (6.9%) |
| 65 to 74 Years | 12 (11.1%) | 0 (0.0%) |
| 75 Years and over | 2 (1.1%) | 0 (0.0%) |
| Total | 182 (31.0%) | 7 (3.8%) |
Employment Status by Educational Attainment in Taylor Springs
According to labor force statistics for Taylor Springs, 57.0% of individuals (154) out of the total population between 25 and 64 years of age (270) are in the labor force, with 4.5% or 7 of them being unemployed. The group with the highest labor force participation rate are those with the educational attainment of bachelor's degree or higher, with 95.7% or 22 individuals in the labor force. Within the labor force, individuals with high school diploma education have the highest percentage of unemployment, with 8.8% or 7 of them being unemployed.
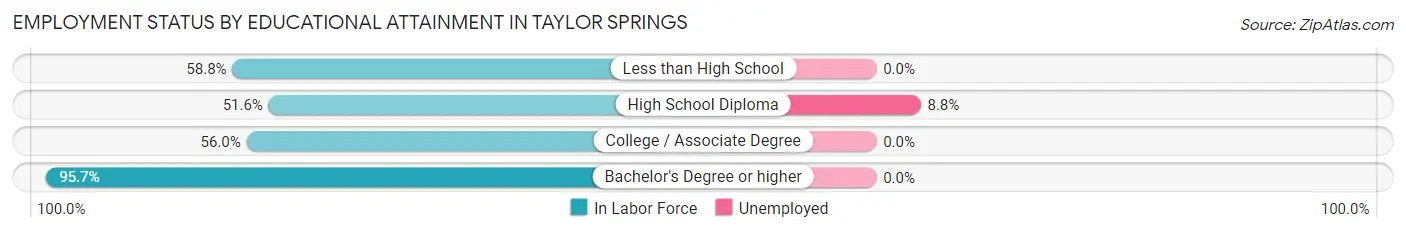
| Educational Attainment | In Labor Force | Unemployed |
| Less than High School | 10 (58.8%) | 0 (0.0%) |
| High School Diploma | 80 (51.6%) | 14 (8.8%) |
| College / Associate Degree | 42 (56.0%) | 0 (0.0%) |
| Bachelor's Degree or higher | 22 (95.7%) | 0 (0.0%) |
| Total | 154 (57.0%) | 12 (4.5%) |
Employment Occupations by Sex in Taylor Springs
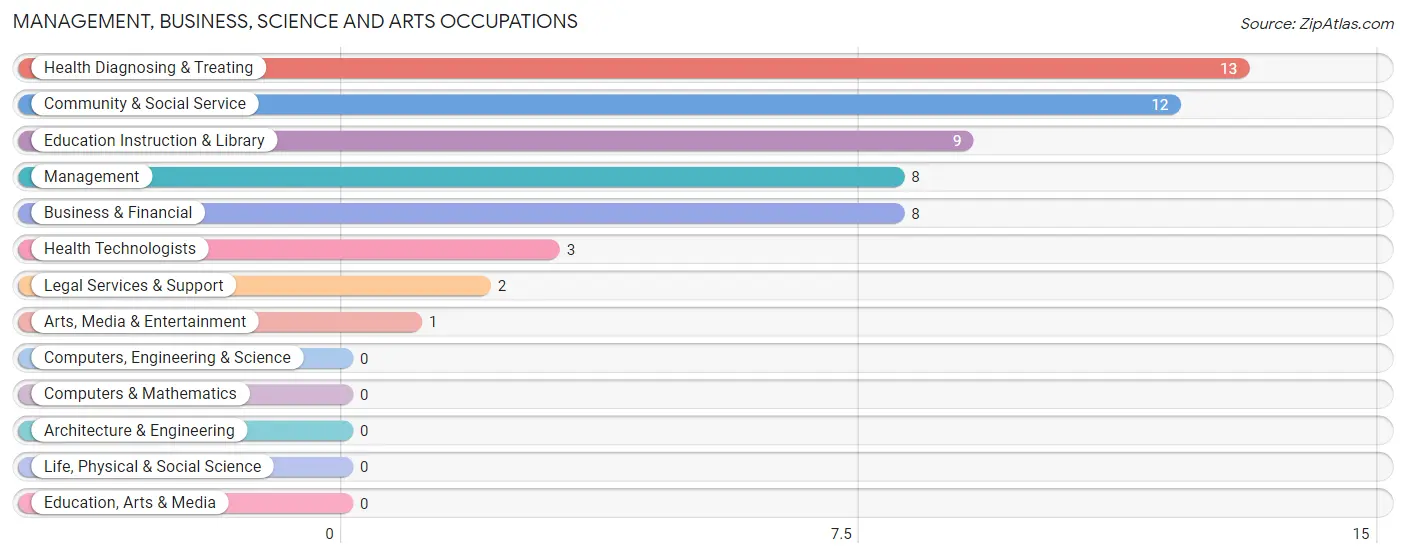
Management, Business, Science and Arts Occupations
The most common Management, Business, Science and Arts occupations in Taylor Springs are Health Diagnosing & Treating (13 | 7.4%), Community & Social Service (12 | 6.9%), Education Instruction & Library (9 | 5.1%), Management (8 | 4.6%), and Business & Financial (8 | 4.6%).
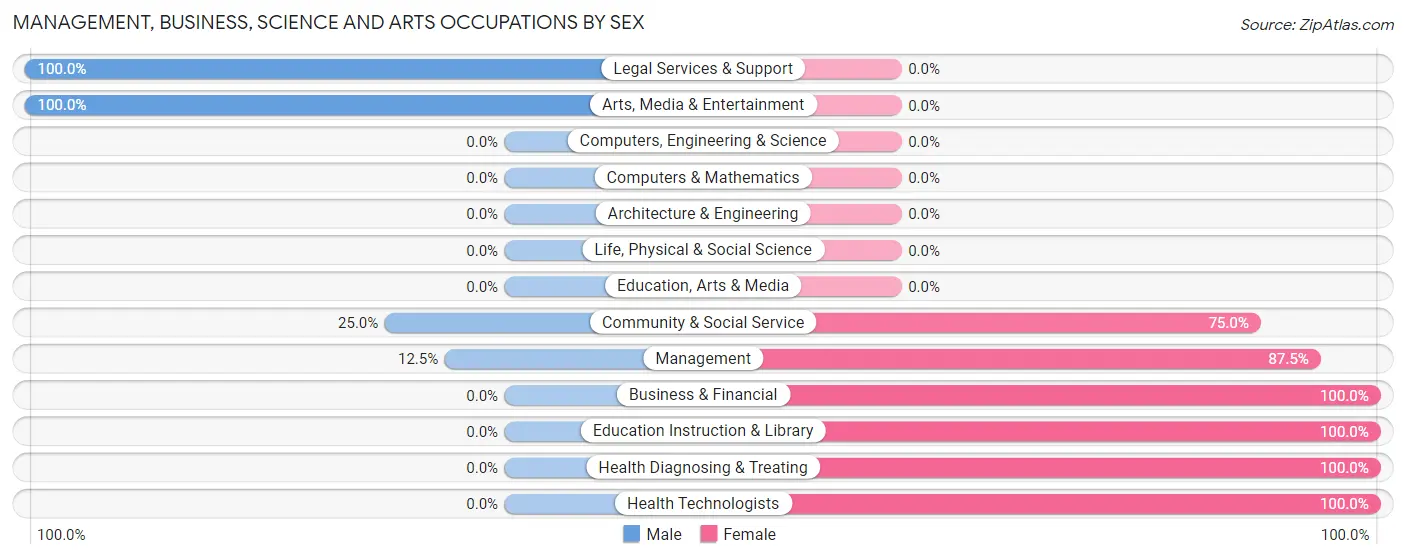
Management, Business, Science and Arts Occupations by Sex
Within the Management, Business, Science and Arts occupations in Taylor Springs, the most male-oriented occupations are Legal Services & Support (100.0%), Arts, Media & Entertainment (100.0%), and Community & Social Service (25.0%), while the most female-oriented occupations are Business & Financial (100.0%), Education Instruction & Library (100.0%), and Health Diagnosing & Treating (100.0%).
| Occupation | Male | Female |
| Management | 1 (12.5%) | 7 (87.5%) |
| Business & Financial | 0 (0.0%) | 8 (100.0%) |
| Computers, Engineering & Science | 0 (0.0%) | 0 (0.0%) |
| Computers & Mathematics | 0 (0.0%) | 0 (0.0%) |
| Architecture & Engineering | 0 (0.0%) | 0 (0.0%) |
| Life, Physical & Social Science | 0 (0.0%) | 0 (0.0%) |
| Community & Social Service | 3 (25.0%) | 9 (75.0%) |
| Education, Arts & Media | 0 (0.0%) | 0 (0.0%) |
| Legal Services & Support | 2 (100.0%) | 0 (0.0%) |
| Education Instruction & Library | 0 (0.0%) | 9 (100.0%) |
| Arts, Media & Entertainment | 1 (100.0%) | 0 (0.0%) |
| Health Diagnosing & Treating | 0 (0.0%) | 13 (100.0%) |
| Health Technologists | 0 (0.0%) | 3 (100.0%) |
| Total (Category) | 4 (9.8%) | 37 (90.2%) |
| Total (Overall) | 89 (50.9%) | 86 (49.1%) |
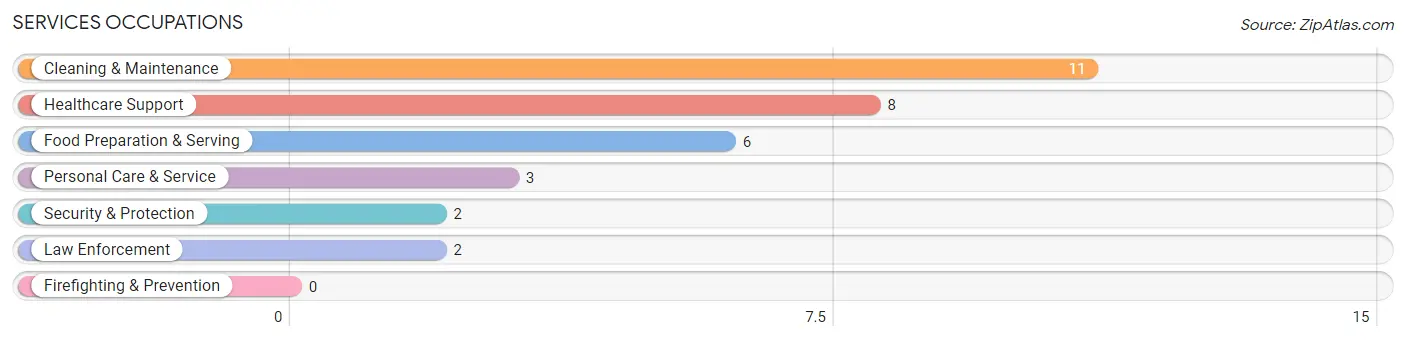
Services Occupations
The most common Services occupations in Taylor Springs are Cleaning & Maintenance (11 | 6.3%), Healthcare Support (8 | 4.6%), Food Preparation & Serving (6 | 3.4%), Personal Care & Service (3 | 1.7%), and Security & Protection (2 | 1.1%).
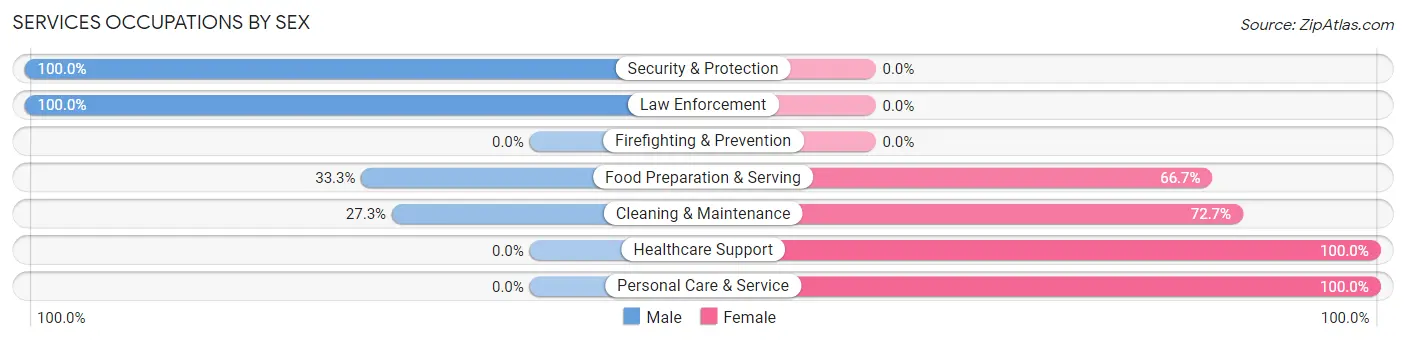
Services Occupations by Sex
Within the Services occupations in Taylor Springs, the most male-oriented occupations are Security & Protection (100.0%), Law Enforcement (100.0%), and Food Preparation & Serving (33.3%), while the most female-oriented occupations are Healthcare Support (100.0%), Personal Care & Service (100.0%), and Cleaning & Maintenance (72.7%).
| Occupation | Male | Female |
| Healthcare Support | 0 (0.0%) | 8 (100.0%) |
| Security & Protection | 2 (100.0%) | 0 (0.0%) |
| Firefighting & Prevention | 0 (0.0%) | 0 (0.0%) |
| Law Enforcement | 2 (100.0%) | 0 (0.0%) |
| Food Preparation & Serving | 2 (33.3%) | 4 (66.7%) |
| Cleaning & Maintenance | 3 (27.3%) | 8 (72.7%) |
| Personal Care & Service | 0 (0.0%) | 3 (100.0%) |
| Total (Category) | 7 (23.3%) | 23 (76.7%) |
| Total (Overall) | 89 (50.9%) | 86 (49.1%) |
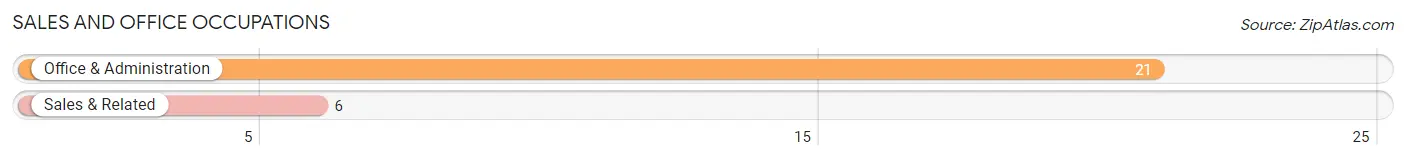
Sales and Office Occupations
The most common Sales and Office occupations in Taylor Springs are Office & Administration (21 | 12.0%), and Sales & Related (6 | 3.4%).
Sales and Office Occupations by Sex
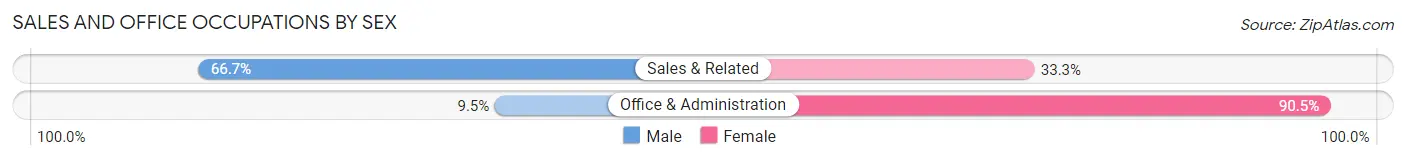
| Occupation | Male | Female |
| Sales & Related | 4 (66.7%) | 2 (33.3%) |
| Office & Administration | 2 (9.5%) | 19 (90.5%) |
| Total (Category) | 6 (22.2%) | 21 (77.8%) |
| Total (Overall) | 89 (50.9%) | 86 (49.1%) |
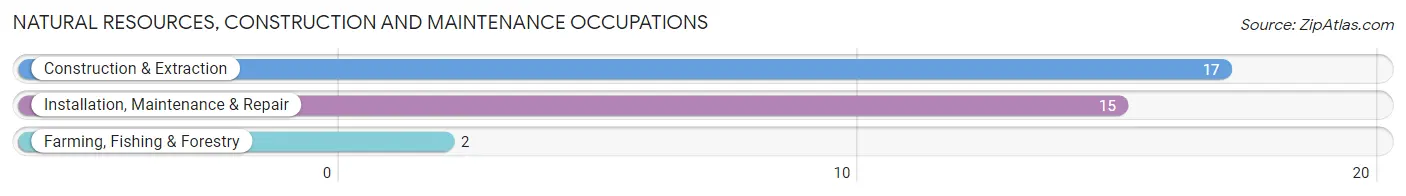
Natural Resources, Construction and Maintenance Occupations
The most common Natural Resources, Construction and Maintenance occupations in Taylor Springs are Construction & Extraction (17 | 9.7%), Installation, Maintenance & Repair (15 | 8.6%), and Farming, Fishing & Forestry (2 | 1.1%).
Natural Resources, Construction and Maintenance Occupations by Sex
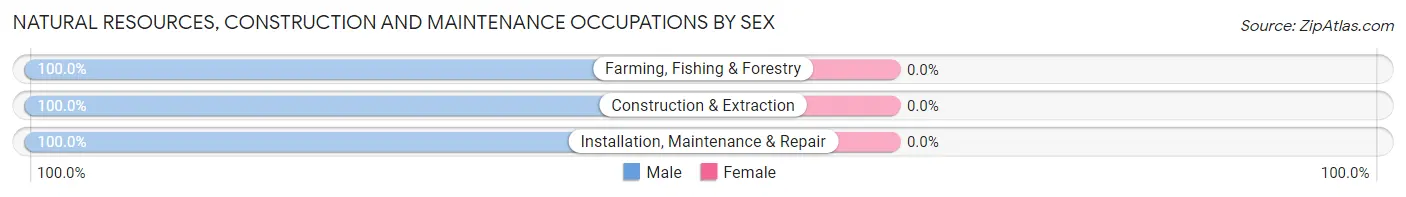
| Occupation | Male | Female |
| Farming, Fishing & Forestry | 2 (100.0%) | 0 (0.0%) |
| Construction & Extraction | 17 (100.0%) | 0 (0.0%) |
| Installation, Maintenance & Repair | 15 (100.0%) | 0 (0.0%) |
| Total (Category) | 34 (100.0%) | 0 (0.0%) |
| Total (Overall) | 89 (50.9%) | 86 (49.1%) |
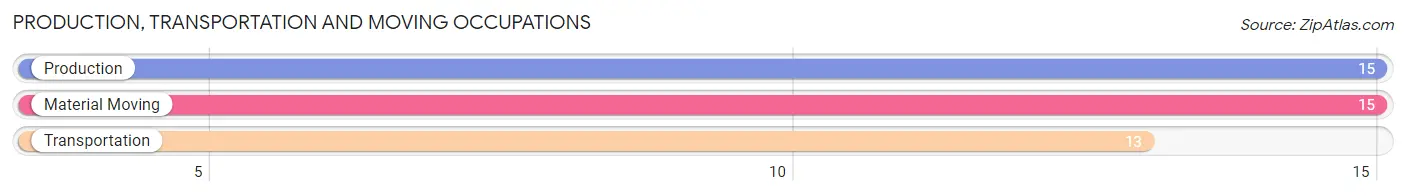
Production, Transportation and Moving Occupations
The most common Production, Transportation and Moving occupations in Taylor Springs are Production (15 | 8.6%), Material Moving (15 | 8.6%), and Transportation (13 | 7.4%).
Production, Transportation and Moving Occupations by Sex
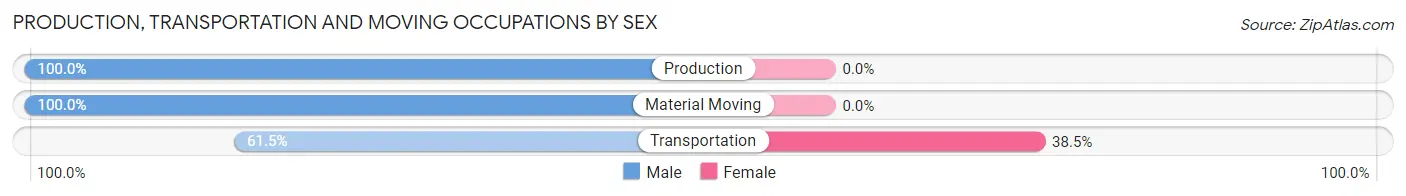
| Occupation | Male | Female |
| Production | 15 (100.0%) | 0 (0.0%) |
| Transportation | 8 (61.5%) | 5 (38.5%) |
| Material Moving | 15 (100.0%) | 0 (0.0%) |
| Total (Category) | 38 (88.4%) | 5 (11.6%) |
| Total (Overall) | 89 (50.9%) | 86 (49.1%) |
Employment Industries by Sex in Taylor Springs
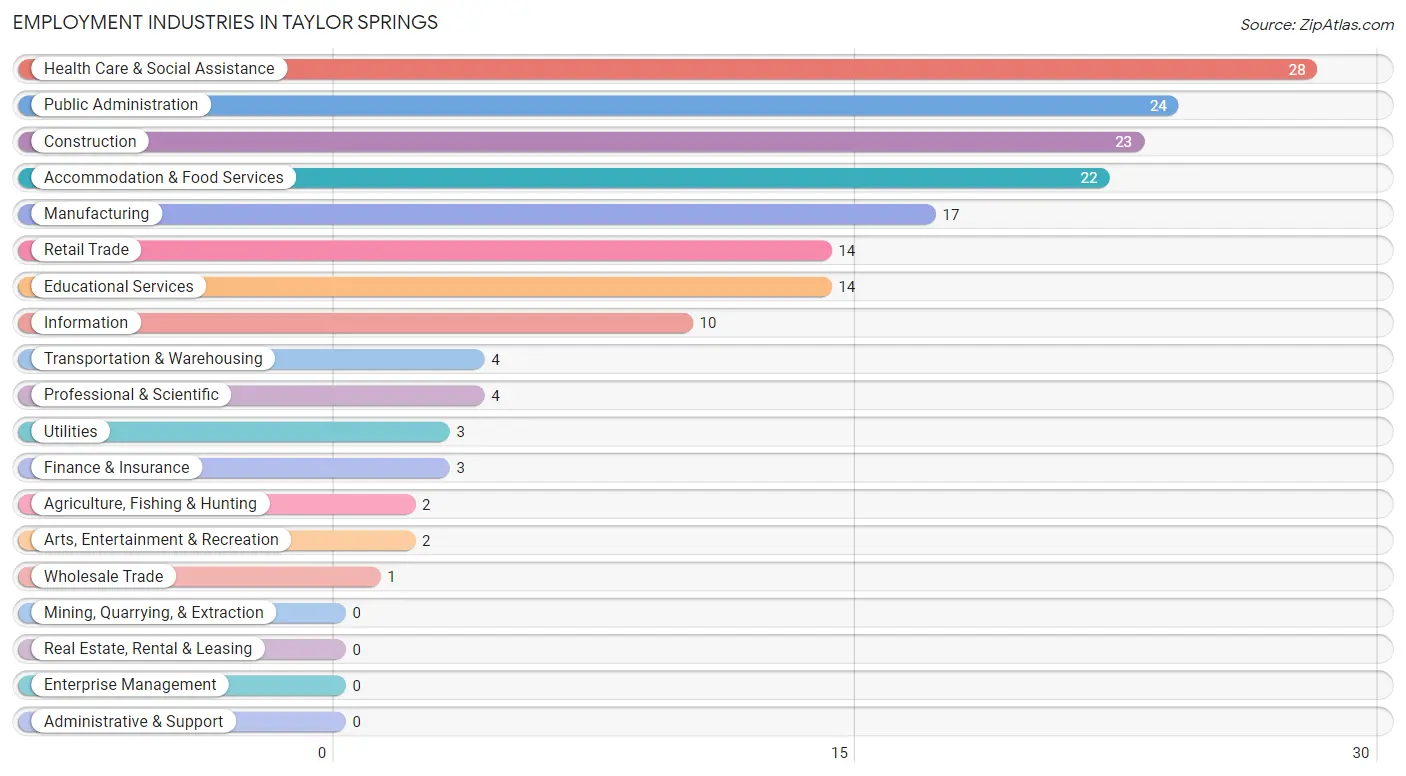
Employment Industries in Taylor Springs
The major employment industries in Taylor Springs include Health Care & Social Assistance (28 | 16.0%), Public Administration (24 | 13.7%), Construction (23 | 13.1%), Accommodation & Food Services (22 | 12.6%), and Manufacturing (17 | 9.7%).
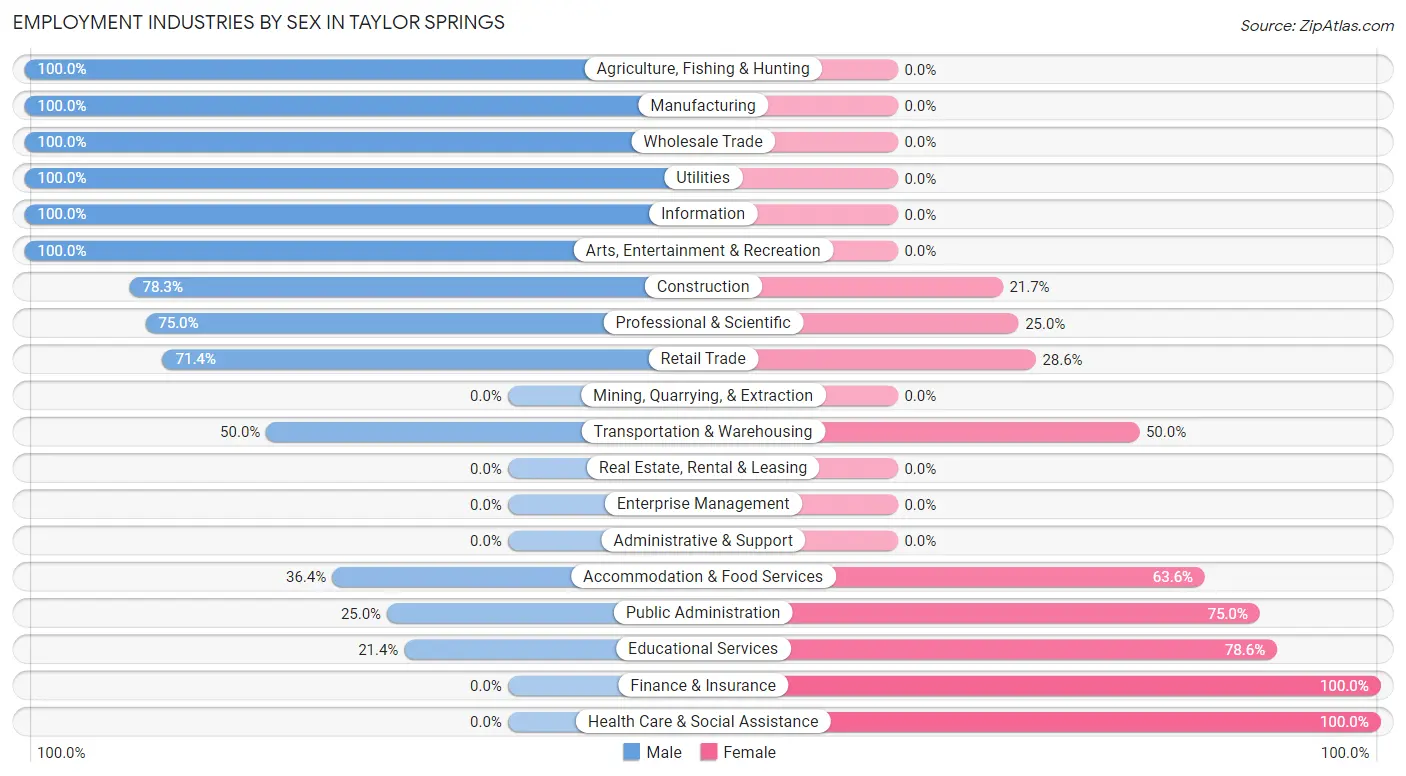
Employment Industries by Sex in Taylor Springs
The Taylor Springs industries that see more men than women are Agriculture, Fishing & Hunting (100.0%), Manufacturing (100.0%), and Wholesale Trade (100.0%), whereas the industries that tend to have a higher number of women are Finance & Insurance (100.0%), Health Care & Social Assistance (100.0%), and Educational Services (78.6%).
| Industry | Male | Female |
| Agriculture, Fishing & Hunting | 2 (100.0%) | 0 (0.0%) |
| Mining, Quarrying, & Extraction | 0 (0.0%) | 0 (0.0%) |
| Construction | 18 (78.3%) | 5 (21.7%) |
| Manufacturing | 17 (100.0%) | 0 (0.0%) |
| Wholesale Trade | 1 (100.0%) | 0 (0.0%) |
| Retail Trade | 10 (71.4%) | 4 (28.6%) |
| Transportation & Warehousing | 2 (50.0%) | 2 (50.0%) |
| Utilities | 3 (100.0%) | 0 (0.0%) |
| Information | 10 (100.0%) | 0 (0.0%) |
| Finance & Insurance | 0 (0.0%) | 3 (100.0%) |
| Real Estate, Rental & Leasing | 0 (0.0%) | 0 (0.0%) |
| Professional & Scientific | 3 (75.0%) | 1 (25.0%) |
| Enterprise Management | 0 (0.0%) | 0 (0.0%) |
| Administrative & Support | 0 (0.0%) | 0 (0.0%) |
| Educational Services | 3 (21.4%) | 11 (78.6%) |
| Health Care & Social Assistance | 0 (0.0%) | 28 (100.0%) |
| Arts, Entertainment & Recreation | 2 (100.0%) | 0 (0.0%) |
| Accommodation & Food Services | 8 (36.4%) | 14 (63.6%) |
| Public Administration | 6 (25.0%) | 18 (75.0%) |
| Total | 89 (50.9%) | 86 (49.1%) |
Education in Taylor Springs
School Enrollment in Taylor Springs
The most common levels of schooling among the 74 students in Taylor Springs are high school (23 | 31.1%), college / undergraduate (16 | 21.6%), and elementary school (12 | 16.2%).
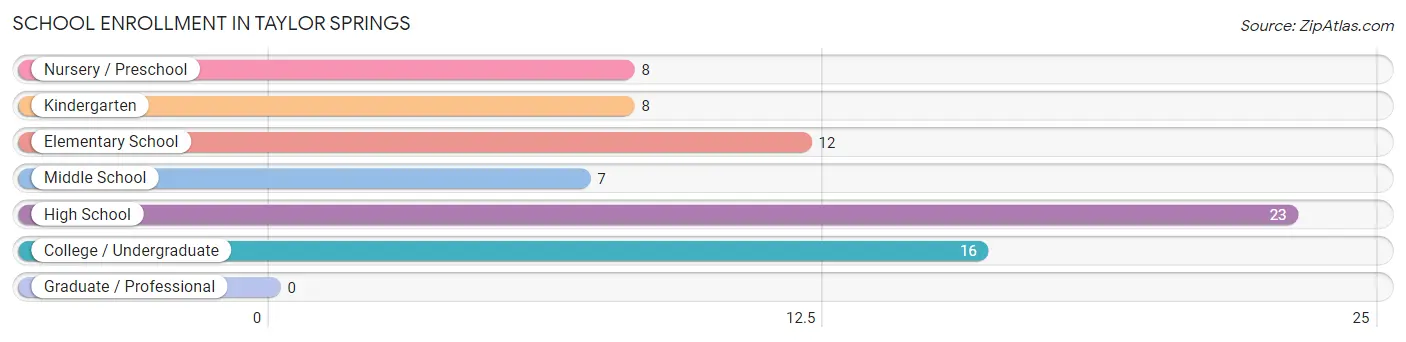
| School Level | # Students | % Students |
| Nursery / Preschool | 8 | 10.8% |
| Kindergarten | 8 | 10.8% |
| Elementary School | 12 | 16.2% |
| Middle School | 7 | 9.5% |
| High School | 23 | 31.1% |
| College / Undergraduate | 16 | 21.6% |
| Graduate / Professional | 0 | 0.0% |
| Total | 74 | 100.0% |
School Enrollment by Age by Funding Source in Taylor Springs
Out of a total of 74 students who are enrolled in schools in Taylor Springs, 2 (2.7%) attend a private institution, while the remaining 72 (97.3%) are enrolled in public schools. The age group of 5 to 9 year old has the highest likelihood of being enrolled in private schools, with 2 (11.1% in the age bracket) enrolled. Conversely, the age group of 3 to 4 year olds has the lowest likelihood of being enrolled in a private school, with 6 (100.0% in the age bracket) attending a public institution.
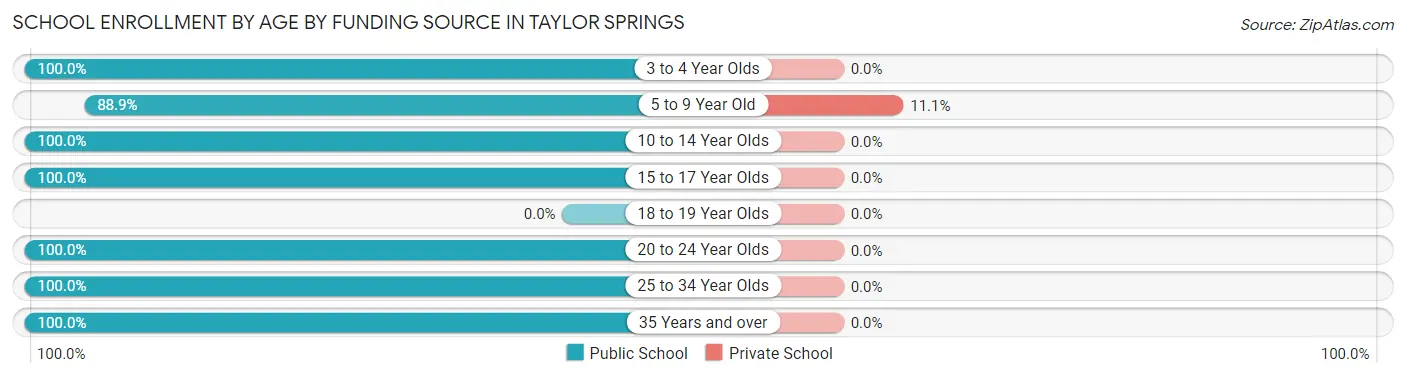
| Age Bracket | Public School | Private School |
| 3 to 4 Year Olds | 6 (100.0%) | 0 (0.0%) |
| 5 to 9 Year Old | 16 (88.9%) | 2 (11.1%) |
| 10 to 14 Year Olds | 18 (100.0%) | 0 (0.0%) |
| 15 to 17 Year Olds | 3 (100.0%) | 0 (0.0%) |
| 18 to 19 Year Olds | 0 (0.0%) | 0 (0.0%) |
| 20 to 24 Year Olds | 1 (100.0%) | 0 (0.0%) |
| 25 to 34 Year Olds | 17 (100.0%) | 0 (0.0%) |
| 35 Years and over | 11 (100.0%) | 0 (0.0%) |
| Total | 72 (97.3%) | 2 (2.7%) |
Educational Attainment by Field of Study in Taylor Springs
Psychology (24 | 46.2%), education (7 | 13.5%), science & technology (6 | 11.5%), engineering (5 | 9.6%), and communications (3 | 5.8%) are the most common fields of study among 52 individuals in Taylor Springs who have obtained a bachelor's degree or higher.
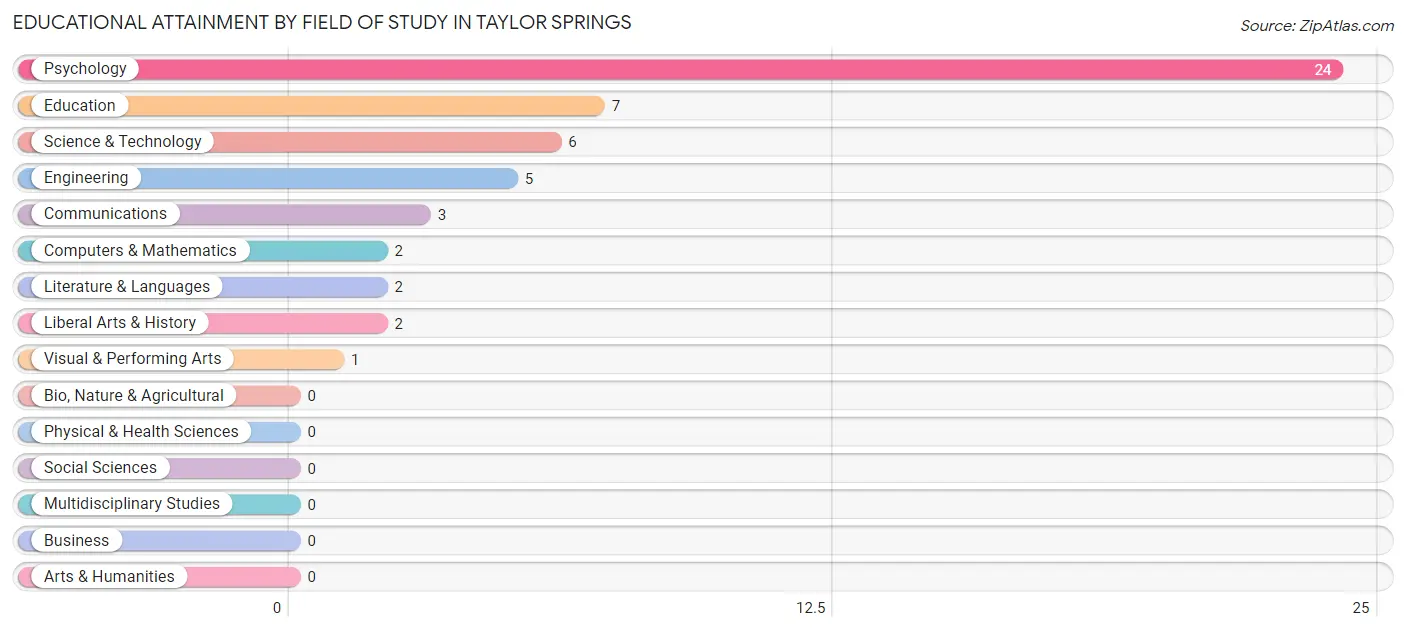
| Field of Study | # Graduates | % Graduates |
| Computers & Mathematics | 2 | 3.8% |
| Bio, Nature & Agricultural | 0 | 0.0% |
| Physical & Health Sciences | 0 | 0.0% |
| Psychology | 24 | 46.2% |
| Social Sciences | 0 | 0.0% |
| Engineering | 5 | 9.6% |
| Multidisciplinary Studies | 0 | 0.0% |
| Science & Technology | 6 | 11.5% |
| Business | 0 | 0.0% |
| Education | 7 | 13.5% |
| Literature & Languages | 2 | 3.8% |
| Liberal Arts & History | 2 | 3.8% |
| Visual & Performing Arts | 1 | 1.9% |
| Communications | 3 | 5.8% |
| Arts & Humanities | 0 | 0.0% |
| Total | 52 | 100.0% |
Transportation & Commute in Taylor Springs
Vehicle Availability by Sex in Taylor Springs
The most prevalent vehicle ownership categories in Taylor Springs are males with 2 vehicles (56, accounting for 67.5%) and females with 2 vehicles (28, making up 73.7%).
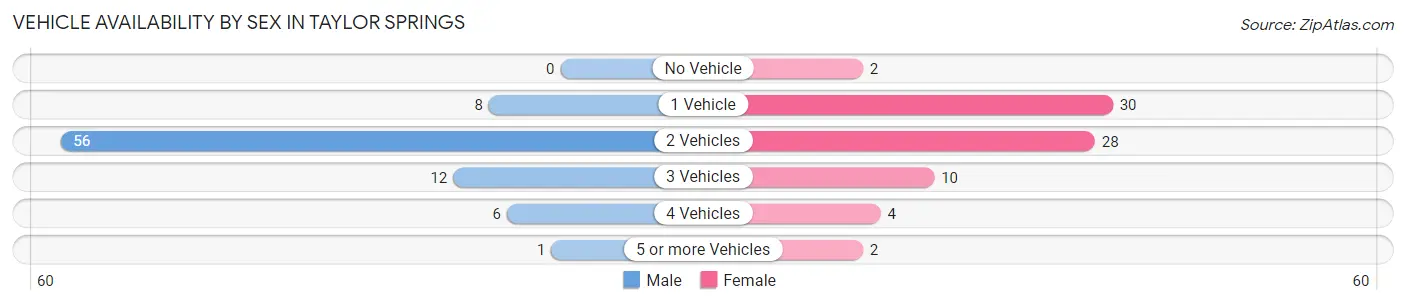
| Vehicles Available | Male | Female |
| No Vehicle | 0 (0.0%) | 2 (2.6%) |
| 1 Vehicle | 8 (9.6%) | 30 (39.5%) |
| 2 Vehicles | 56 (67.5%) | 28 (36.8%) |
| 3 Vehicles | 12 (14.5%) | 10 (13.2%) |
| 4 Vehicles | 6 (7.2%) | 4 (5.3%) |
| 5 or more Vehicles | 1 (1.2%) | 2 (2.6%) |
| Total | 83 (100.0%) | 76 (100.0%) |
Commute Time in Taylor Springs
The most frequently occuring commute durations in Taylor Springs are 5 to 9 minutes (50 commuters, 32.5%), 20 to 24 minutes (33 commuters, 21.4%), and 45 to 59 minutes (19 commuters, 12.3%).
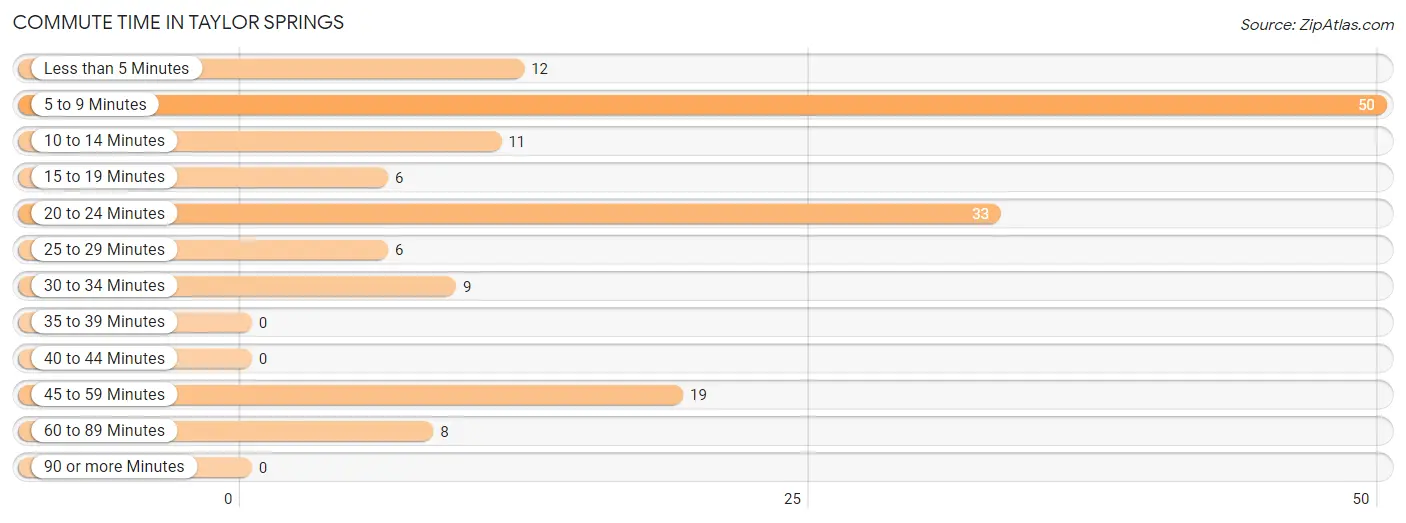
| Commute Time | # Commuters | % Commuters |
| Less than 5 Minutes | 12 | 7.8% |
| 5 to 9 Minutes | 50 | 32.5% |
| 10 to 14 Minutes | 11 | 7.1% |
| 15 to 19 Minutes | 6 | 3.9% |
| 20 to 24 Minutes | 33 | 21.4% |
| 25 to 29 Minutes | 6 | 3.9% |
| 30 to 34 Minutes | 9 | 5.8% |
| 35 to 39 Minutes | 0 | 0.0% |
| 40 to 44 Minutes | 0 | 0.0% |
| 45 to 59 Minutes | 19 | 12.3% |
| 60 to 89 Minutes | 8 | 5.2% |
| 90 or more Minutes | 0 | 0.0% |
Commute Time by Sex in Taylor Springs
The most common commute times in Taylor Springs are 5 to 9 minutes (22 commuters, 26.8%) for males and 5 to 9 minutes (28 commuters, 38.9%) for females.
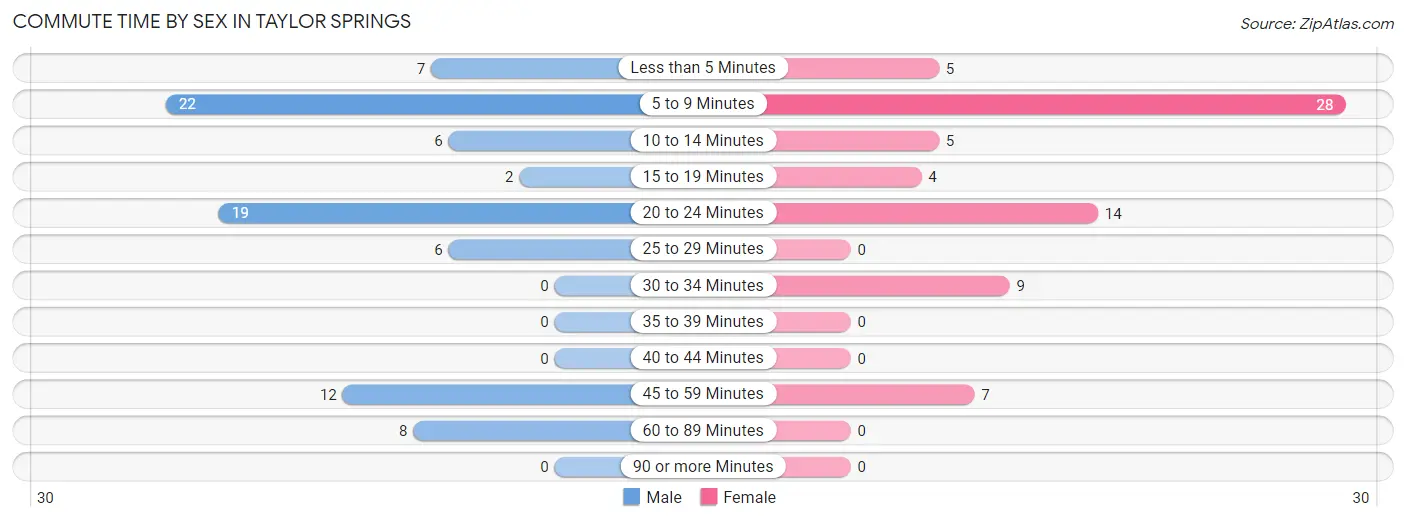
| Commute Time | Male | Female |
| Less than 5 Minutes | 7 (8.5%) | 5 (6.9%) |
| 5 to 9 Minutes | 22 (26.8%) | 28 (38.9%) |
| 10 to 14 Minutes | 6 (7.3%) | 5 (6.9%) |
| 15 to 19 Minutes | 2 (2.4%) | 4 (5.6%) |
| 20 to 24 Minutes | 19 (23.2%) | 14 (19.4%) |
| 25 to 29 Minutes | 6 (7.3%) | 0 (0.0%) |
| 30 to 34 Minutes | 0 (0.0%) | 9 (12.5%) |
| 35 to 39 Minutes | 0 (0.0%) | 0 (0.0%) |
| 40 to 44 Minutes | 0 (0.0%) | 0 (0.0%) |
| 45 to 59 Minutes | 12 (14.6%) | 7 (9.7%) |
| 60 to 89 Minutes | 8 (9.8%) | 0 (0.0%) |
| 90 or more Minutes | 0 (0.0%) | 0 (0.0%) |
Time of Departure to Work by Sex in Taylor Springs
The most frequent times of departure to work in Taylor Springs are 6:30 AM to 6:59 AM (16, 19.5%) for males and 7:30 AM to 7:59 AM (27, 37.5%) for females.
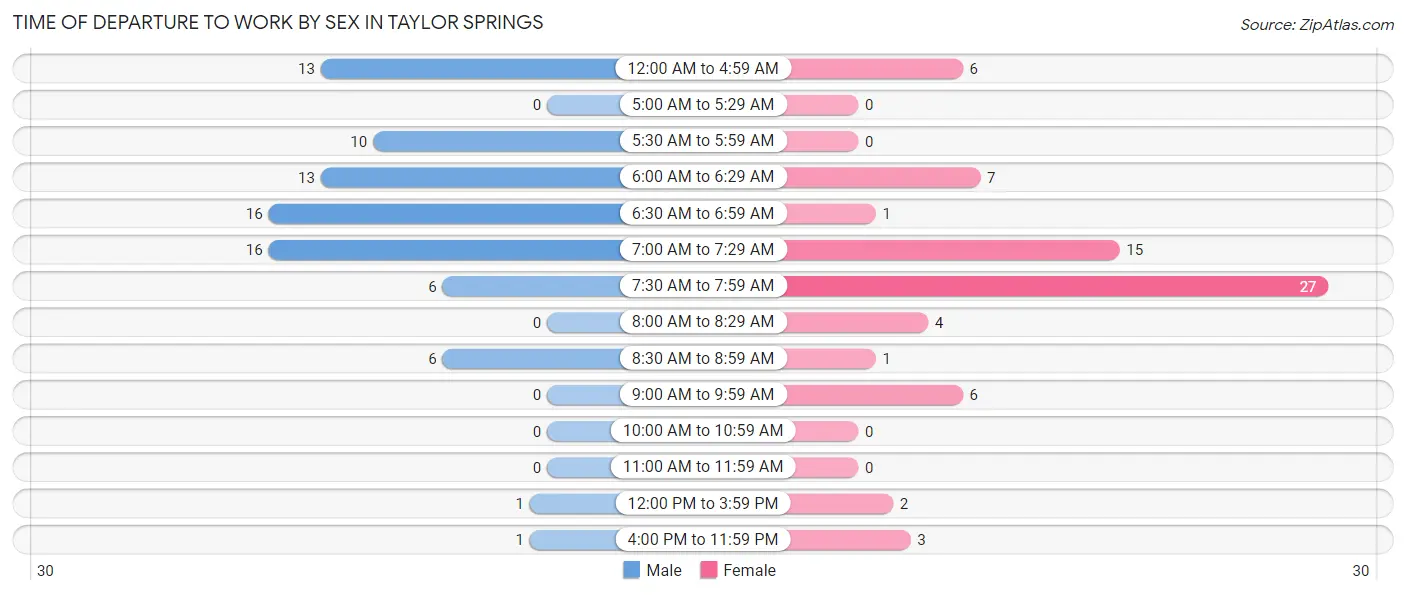
| Time of Departure | Male | Female |
| 12:00 AM to 4:59 AM | 13 (15.9%) | 6 (8.3%) |
| 5:00 AM to 5:29 AM | 0 (0.0%) | 0 (0.0%) |
| 5:30 AM to 5:59 AM | 10 (12.2%) | 0 (0.0%) |
| 6:00 AM to 6:29 AM | 13 (15.9%) | 7 (9.7%) |
| 6:30 AM to 6:59 AM | 16 (19.5%) | 1 (1.4%) |
| 7:00 AM to 7:29 AM | 16 (19.5%) | 15 (20.8%) |
| 7:30 AM to 7:59 AM | 6 (7.3%) | 27 (37.5%) |
| 8:00 AM to 8:29 AM | 0 (0.0%) | 4 (5.6%) |
| 8:30 AM to 8:59 AM | 6 (7.3%) | 1 (1.4%) |
| 9:00 AM to 9:59 AM | 0 (0.0%) | 6 (8.3%) |
| 10:00 AM to 10:59 AM | 0 (0.0%) | 0 (0.0%) |
| 11:00 AM to 11:59 AM | 0 (0.0%) | 0 (0.0%) |
| 12:00 PM to 3:59 PM | 1 (1.2%) | 2 (2.8%) |
| 4:00 PM to 11:59 PM | 1 (1.2%) | 3 (4.2%) |
| Total | 82 (100.0%) | 72 (100.0%) |
Housing Occupancy in Taylor Springs
Occupancy by Ownership in Taylor Springs
Of the total 271 dwellings in Taylor Springs, owner-occupied units account for 219 (80.8%), while renter-occupied units make up 52 (19.2%).
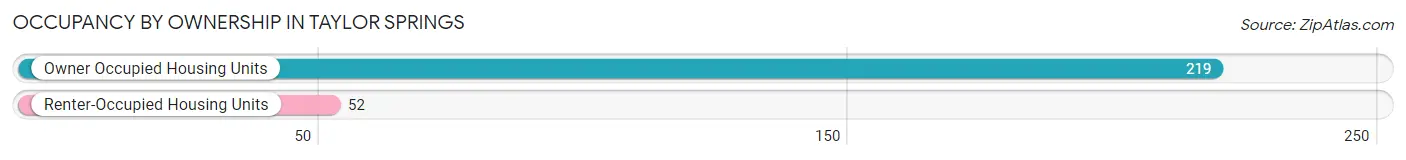
| Occupancy | # Housing Units | % Housing Units |
| Owner Occupied Housing Units | 219 | 80.8% |
| Renter-Occupied Housing Units | 52 | 19.2% |
| Total Occupied Housing Units | 271 | 100.0% |
Occupancy by Household Size in Taylor Springs
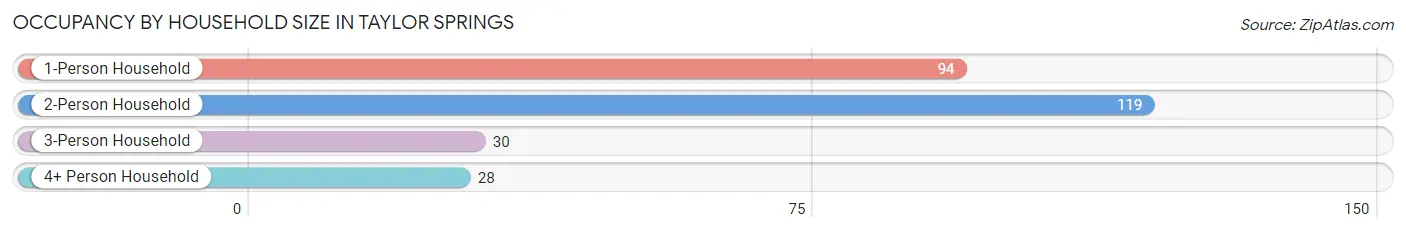
| Household Size | # Housing Units | % Housing Units |
| 1-Person Household | 94 | 34.7% |
| 2-Person Household | 119 | 43.9% |
| 3-Person Household | 30 | 11.1% |
| 4+ Person Household | 28 | 10.3% |
| Total Housing Units | 271 | 100.0% |
Occupancy by Ownership by Household Size in Taylor Springs
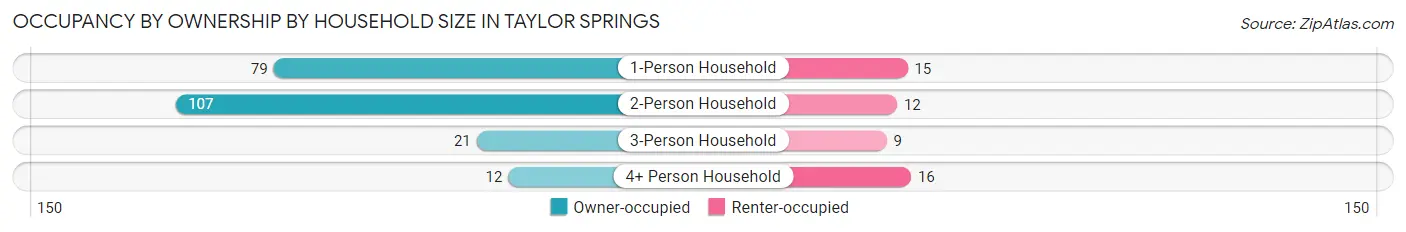
| Household Size | Owner-occupied | Renter-occupied |
| 1-Person Household | 79 (84.0%) | 15 (16.0%) |
| 2-Person Household | 107 (89.9%) | 12 (10.1%) |
| 3-Person Household | 21 (70.0%) | 9 (30.0%) |
| 4+ Person Household | 12 (42.9%) | 16 (57.1%) |
| Total Housing Units | 219 (80.8%) | 52 (19.2%) |
Occupancy by Educational Attainment in Taylor Springs
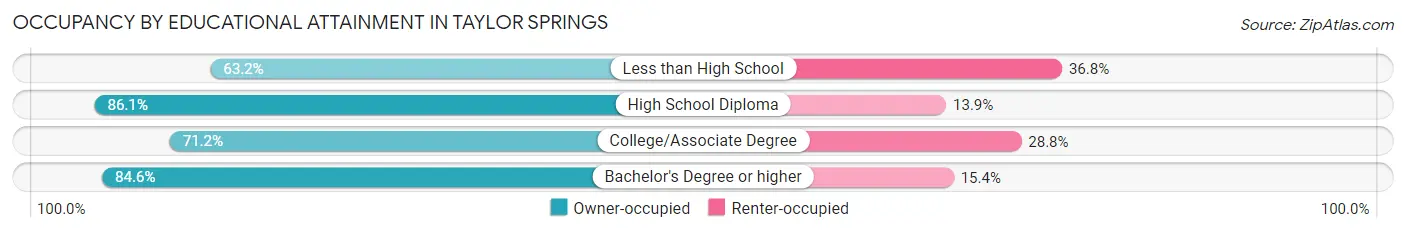
| Household Size | Owner-occupied | Renter-occupied |
| Less than High School | 12 (63.2%) | 7 (36.8%) |
| High School Diploma | 149 (86.1%) | 24 (13.9%) |
| College/Associate Degree | 47 (71.2%) | 19 (28.8%) |
| Bachelor's Degree or higher | 11 (84.6%) | 2 (15.4%) |
Occupancy by Age of Householder in Taylor Springs
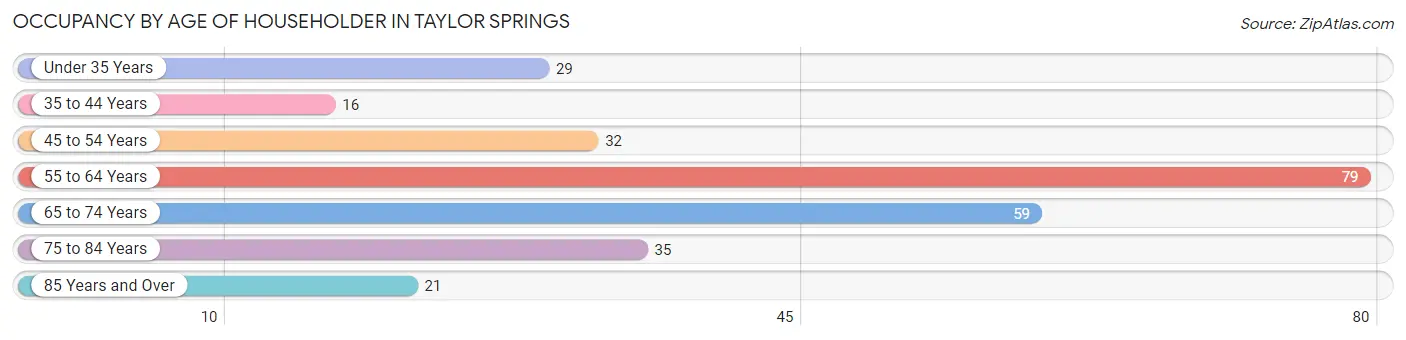
| Age Bracket | # Households | % Households |
| Under 35 Years | 29 | 10.7% |
| 35 to 44 Years | 16 | 5.9% |
| 45 to 54 Years | 32 | 11.8% |
| 55 to 64 Years | 79 | 29.1% |
| 65 to 74 Years | 59 | 21.8% |
| 75 to 84 Years | 35 | 12.9% |
| 85 Years and Over | 21 | 7.7% |
| Total | 271 | 100.0% |
Housing Finances in Taylor Springs
Median Income by Occupancy in Taylor Springs
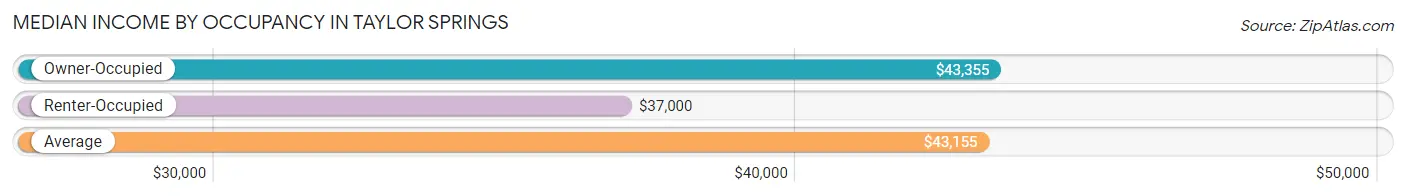
| Occupancy Type | # Households | Median Income |
| Owner-Occupied | 219 (80.8%) | $43,355 |
| Renter-Occupied | 52 (19.2%) | $37,000 |
| Average | 271 (100.0%) | $43,155 |
Occupancy by Householder Income Bracket in Taylor Springs
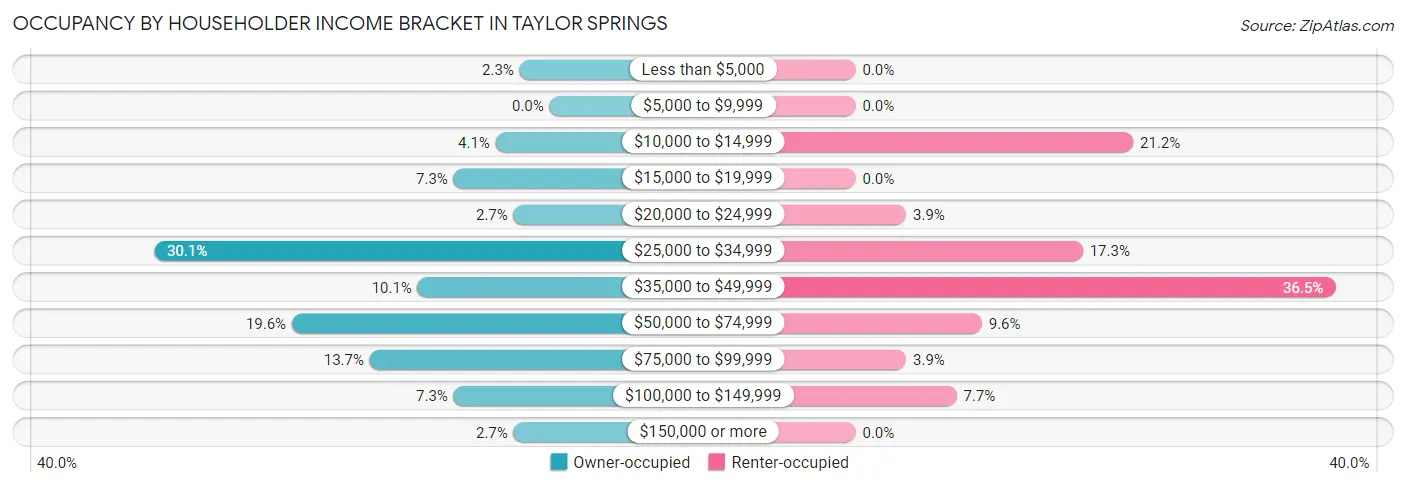
| Income Bracket | Owner-occupied | Renter-occupied |
| Less than $5,000 | 5 (2.3%) | 0 (0.0%) |
| $5,000 to $9,999 | 0 (0.0%) | 0 (0.0%) |
| $10,000 to $14,999 | 9 (4.1%) | 11 (21.1%) |
| $15,000 to $19,999 | 16 (7.3%) | 0 (0.0%) |
| $20,000 to $24,999 | 6 (2.7%) | 2 (3.8%) |
| $25,000 to $34,999 | 66 (30.1%) | 9 (17.3%) |
| $35,000 to $49,999 | 22 (10.1%) | 19 (36.5%) |
| $50,000 to $74,999 | 43 (19.6%) | 5 (9.6%) |
| $75,000 to $99,999 | 30 (13.7%) | 2 (3.8%) |
| $100,000 to $149,999 | 16 (7.3%) | 4 (7.7%) |
| $150,000 or more | 6 (2.7%) | 0 (0.0%) |
| Total | 219 (100.0%) | 52 (100.0%) |
Monthly Housing Cost Tiers in Taylor Springs
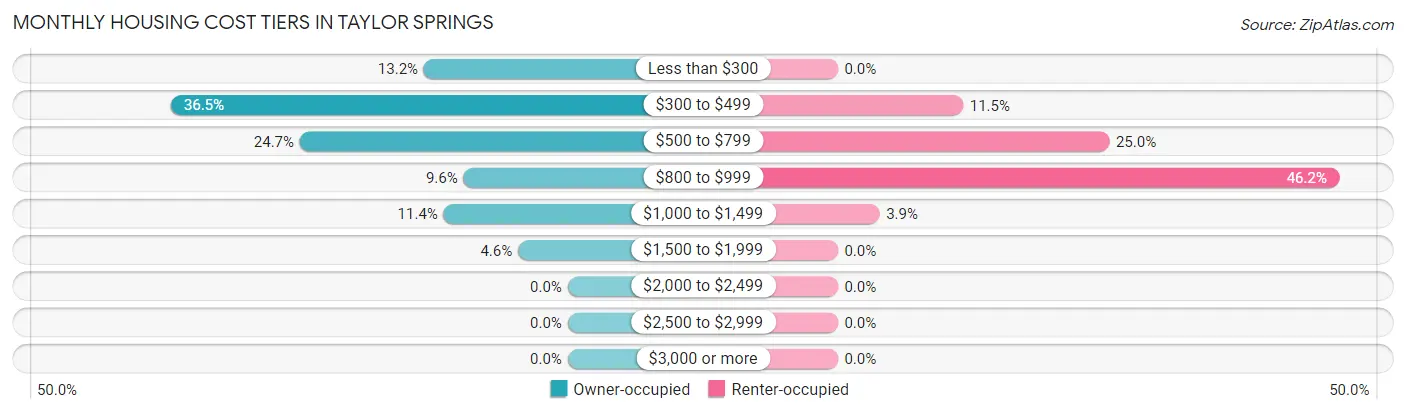
| Monthly Cost | Owner-occupied | Renter-occupied |
| Less than $300 | 29 (13.2%) | 0 (0.0%) |
| $300 to $499 | 80 (36.5%) | 6 (11.5%) |
| $500 to $799 | 54 (24.7%) | 13 (25.0%) |
| $800 to $999 | 21 (9.6%) | 24 (46.2%) |
| $1,000 to $1,499 | 25 (11.4%) | 2 (3.8%) |
| $1,500 to $1,999 | 10 (4.6%) | 0 (0.0%) |
| $2,000 to $2,499 | 0 (0.0%) | 0 (0.0%) |
| $2,500 to $2,999 | 0 (0.0%) | 0 (0.0%) |
| $3,000 or more | 0 (0.0%) | 0 (0.0%) |
| Total | 219 (100.0%) | 52 (100.0%) |
Physical Housing Characteristics in Taylor Springs
Housing Structures in Taylor Springs
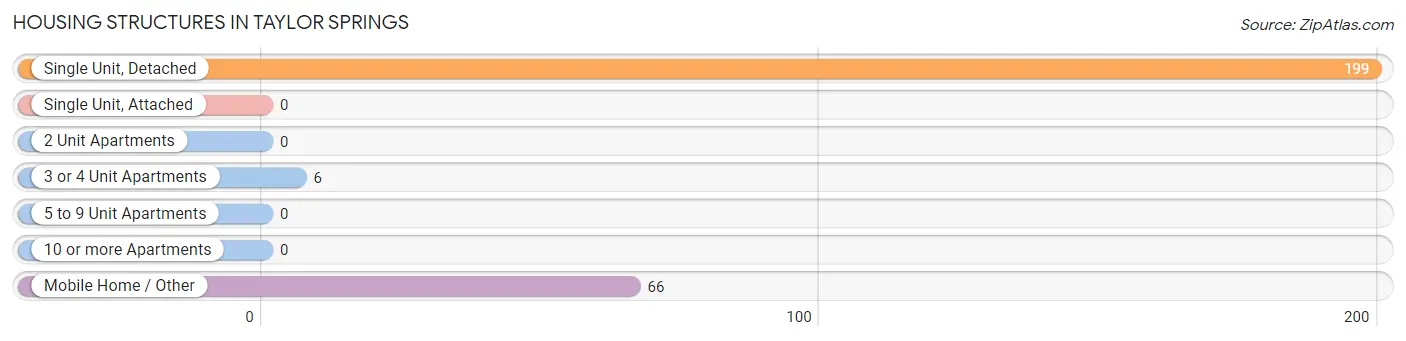
| Structure Type | # Housing Units | % Housing Units |
| Single Unit, Detached | 199 | 73.4% |
| Single Unit, Attached | 0 | 0.0% |
| 2 Unit Apartments | 0 | 0.0% |
| 3 or 4 Unit Apartments | 6 | 2.2% |
| 5 to 9 Unit Apartments | 0 | 0.0% |
| 10 or more Apartments | 0 | 0.0% |
| Mobile Home / Other | 66 | 24.3% |
| Total | 271 | 100.0% |
Housing Structures by Occupancy in Taylor Springs
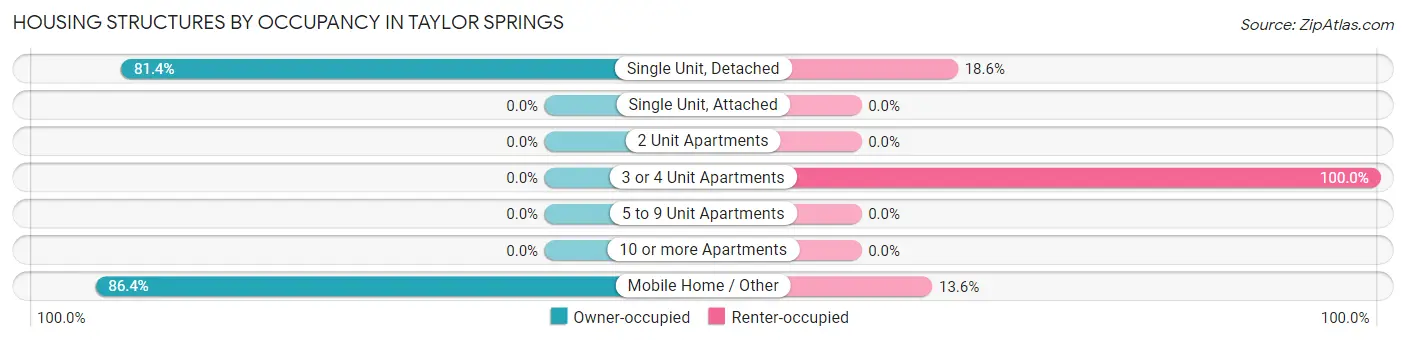
| Structure Type | Owner-occupied | Renter-occupied |
| Single Unit, Detached | 162 (81.4%) | 37 (18.6%) |
| Single Unit, Attached | 0 (0.0%) | 0 (0.0%) |
| 2 Unit Apartments | 0 (0.0%) | 0 (0.0%) |
| 3 or 4 Unit Apartments | 0 (0.0%) | 6 (100.0%) |
| 5 to 9 Unit Apartments | 0 (0.0%) | 0 (0.0%) |
| 10 or more Apartments | 0 (0.0%) | 0 (0.0%) |
| Mobile Home / Other | 57 (86.4%) | 9 (13.6%) |
| Total | 219 (80.8%) | 52 (19.2%) |
Housing Structures by Number of Rooms in Taylor Springs
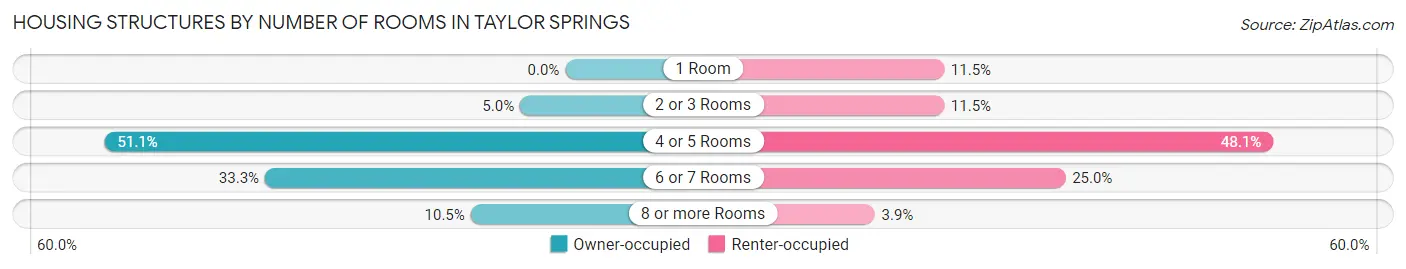
| Number of Rooms | Owner-occupied | Renter-occupied |
| 1 Room | 0 (0.0%) | 6 (11.5%) |
| 2 or 3 Rooms | 11 (5.0%) | 6 (11.5%) |
| 4 or 5 Rooms | 112 (51.1%) | 25 (48.1%) |
| 6 or 7 Rooms | 73 (33.3%) | 13 (25.0%) |
| 8 or more Rooms | 23 (10.5%) | 2 (3.8%) |
| Total | 219 (100.0%) | 52 (100.0%) |
Housing Structure by Heating Type in Taylor Springs
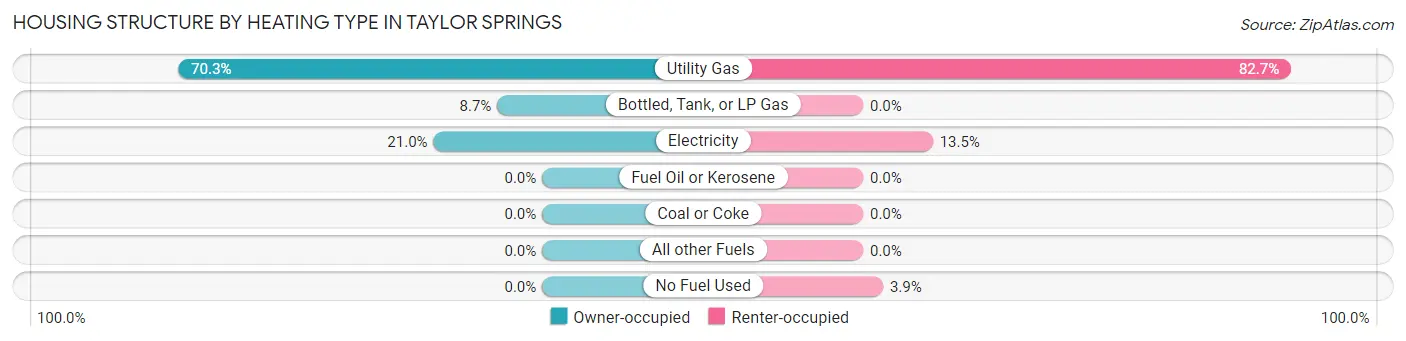
| Heating Type | Owner-occupied | Renter-occupied |
| Utility Gas | 154 (70.3%) | 43 (82.7%) |
| Bottled, Tank, or LP Gas | 19 (8.7%) | 0 (0.0%) |
| Electricity | 46 (21.0%) | 7 (13.5%) |
| Fuel Oil or Kerosene | 0 (0.0%) | 0 (0.0%) |
| Coal or Coke | 0 (0.0%) | 0 (0.0%) |
| All other Fuels | 0 (0.0%) | 0 (0.0%) |
| No Fuel Used | 0 (0.0%) | 2 (3.8%) |
| Total | 219 (100.0%) | 52 (100.0%) |
Household Vehicle Usage in Taylor Springs
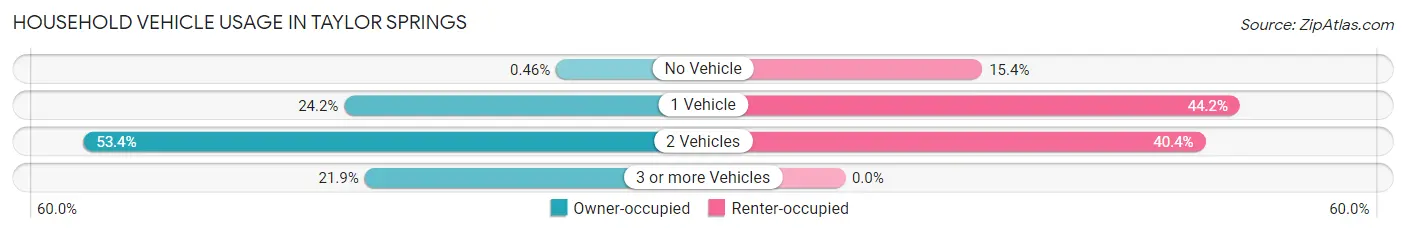
| Vehicles per Household | Owner-occupied | Renter-occupied |
| No Vehicle | 1 (0.5%) | 8 (15.4%) |
| 1 Vehicle | 53 (24.2%) | 23 (44.2%) |
| 2 Vehicles | 117 (53.4%) | 21 (40.4%) |
| 3 or more Vehicles | 48 (21.9%) | 0 (0.0%) |
| Total | 219 (100.0%) | 52 (100.0%) |
Real Estate & Mortgages in Taylor Springs
Real Estate and Mortgage Overview in Taylor Springs
| Characteristic | Without Mortgage | With Mortgage |
| Housing Units | 116 | 103 |
| Median Property Value | $65,200 | $62,800 |
| Median Household Income | $30,000 | $5 |
| Monthly Housing Costs | $382 | $0 |
| Real Estate Taxes | $1,183 | $5 |
Property Value by Mortgage Status in Taylor Springs
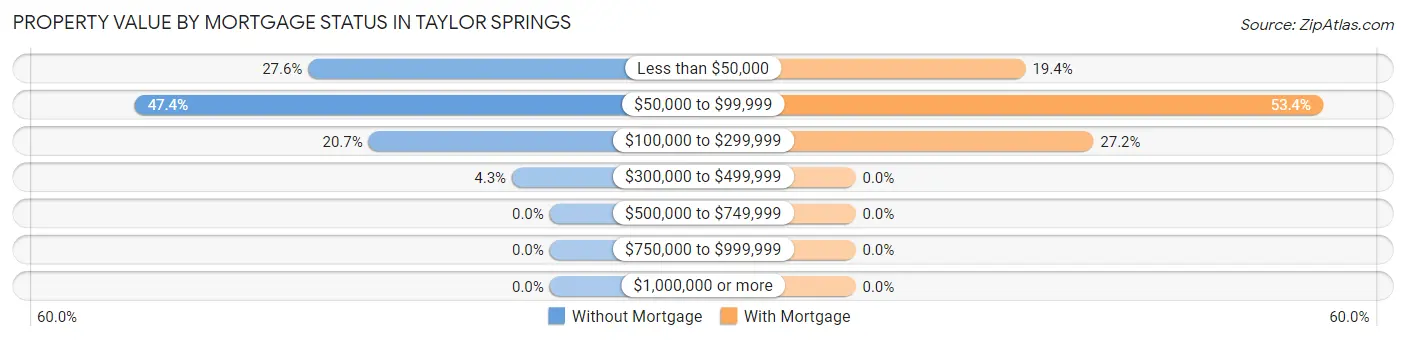
| Property Value | Without Mortgage | With Mortgage |
| Less than $50,000 | 32 (27.6%) | 20 (19.4%) |
| $50,000 to $99,999 | 55 (47.4%) | 55 (53.4%) |
| $100,000 to $299,999 | 24 (20.7%) | 28 (27.2%) |
| $300,000 to $499,999 | 5 (4.3%) | 0 (0.0%) |
| $500,000 to $749,999 | 0 (0.0%) | 0 (0.0%) |
| $750,000 to $999,999 | 0 (0.0%) | 0 (0.0%) |
| $1,000,000 or more | 0 (0.0%) | 0 (0.0%) |
| Total | 116 (100.0%) | 103 (100.0%) |
Household Income by Mortgage Status in Taylor Springs
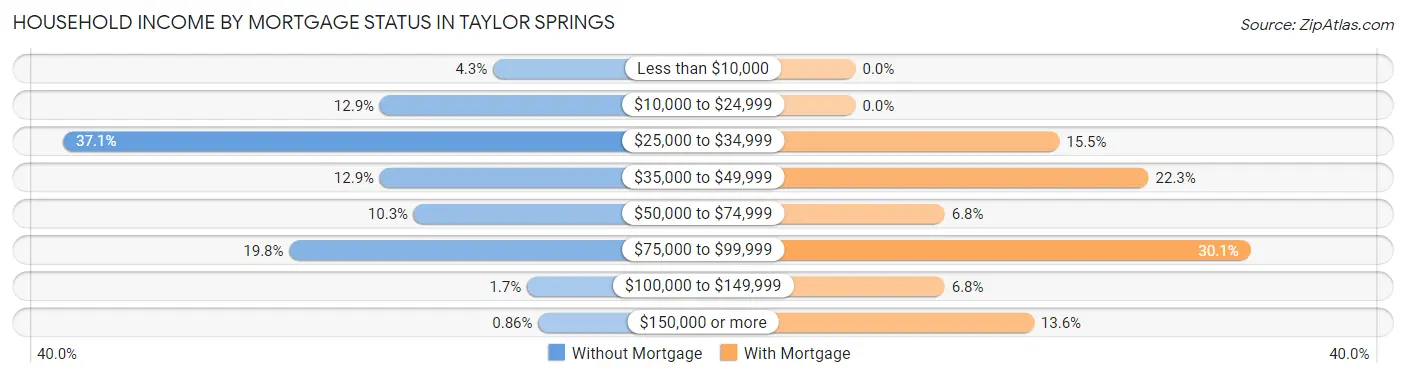
| Household Income | Without Mortgage | With Mortgage |
| Less than $10,000 | 5 (4.3%) | 0 (0.0%) |
| $10,000 to $24,999 | 15 (12.9%) | 0 (0.0%) |
| $25,000 to $34,999 | 43 (37.1%) | 16 (15.5%) |
| $35,000 to $49,999 | 15 (12.9%) | 23 (22.3%) |
| $50,000 to $74,999 | 12 (10.3%) | 7 (6.8%) |
| $75,000 to $99,999 | 23 (19.8%) | 31 (30.1%) |
| $100,000 to $149,999 | 2 (1.7%) | 7 (6.8%) |
| $150,000 or more | 1 (0.9%) | 14 (13.6%) |
| Total | 116 (100.0%) | 103 (100.0%) |
Property Value to Household Income Ratio in Taylor Springs
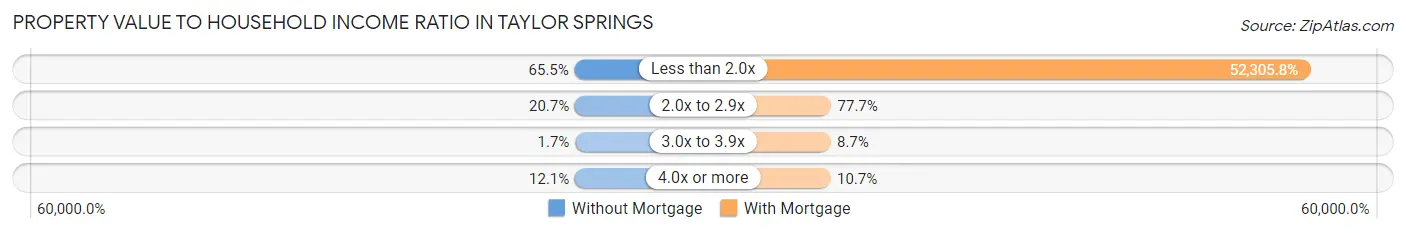
| Value-to-Income Ratio | Without Mortgage | With Mortgage |
| Less than 2.0x | 76 (65.5%) | 53,875 (52,305.8%) |
| 2.0x to 2.9x | 24 (20.7%) | 80 (77.7%) |
| 3.0x to 3.9x | 2 (1.7%) | 9 (8.7%) |
| 4.0x or more | 14 (12.1%) | 11 (10.7%) |
| Total | 116 (100.0%) | 103 (100.0%) |
Real Estate Taxes by Mortgage Status in Taylor Springs
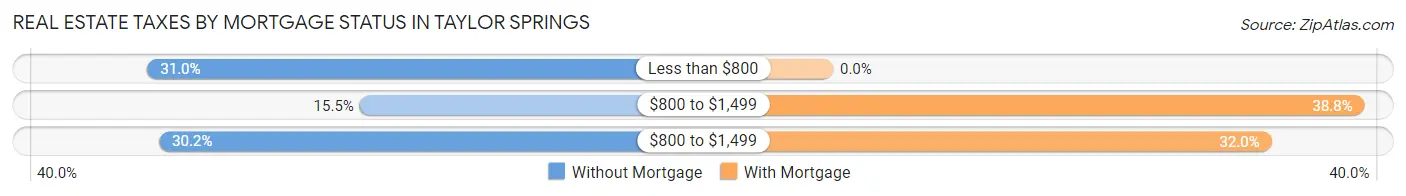
| Property Taxes | Without Mortgage | With Mortgage |
| Less than $800 | 36 (31.0%) | 0 (0.0%) |
| $800 to $1,499 | 18 (15.5%) | 40 (38.8%) |
| $800 to $1,499 | 35 (30.2%) | 33 (32.0%) |
| Total | 116 (100.0%) | 103 (100.0%) |
Health & Disability in Taylor Springs
Health Insurance Coverage by Age in Taylor Springs
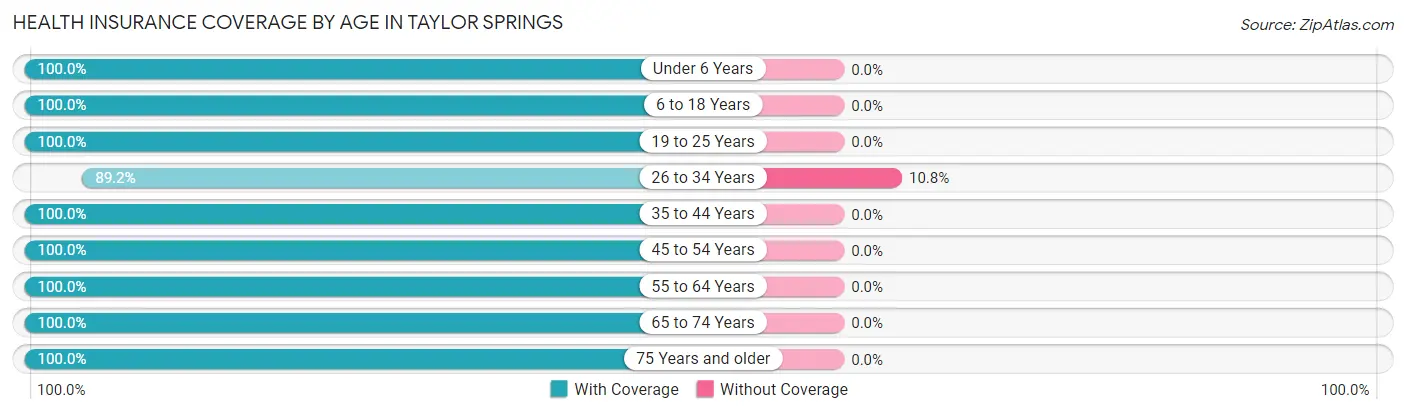
| Age Bracket | With Coverage | Without Coverage |
| Under 6 Years | 45 (100.0%) | 0 (0.0%) |
| 6 to 18 Years | 33 (100.0%) | 0 (0.0%) |
| 19 to 25 Years | 20 (100.0%) | 0 (0.0%) |
| 26 to 34 Years | 58 (89.2%) | 7 (10.8%) |
| 35 to 44 Years | 30 (100.0%) | 0 (0.0%) |
| 45 to 54 Years | 46 (100.0%) | 0 (0.0%) |
| 55 to 64 Years | 129 (100.0%) | 0 (0.0%) |
| 65 to 74 Years | 98 (100.0%) | 0 (0.0%) |
| 75 Years and older | 76 (100.0%) | 0 (0.0%) |
| Total | 535 (98.7%) | 7 (1.3%) |
Health Insurance Coverage by Citizenship Status in Taylor Springs
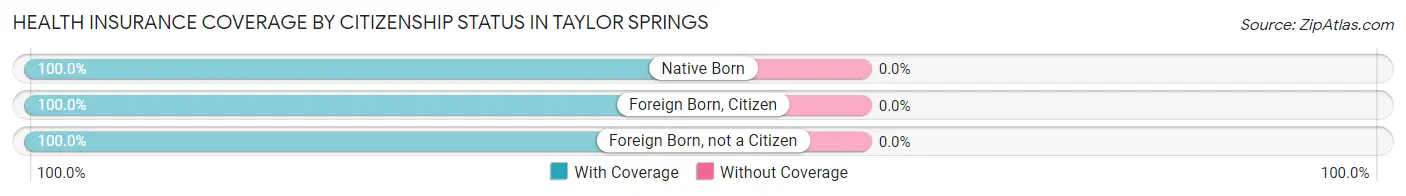
| Citizenship Status | With Coverage | Without Coverage |
| Native Born | 45 (100.0%) | 0 (0.0%) |
| Foreign Born, Citizen | 33 (100.0%) | 0 (0.0%) |
| Foreign Born, not a Citizen | 20 (100.0%) | 0 (0.0%) |
Health Insurance Coverage by Household Income in Taylor Springs
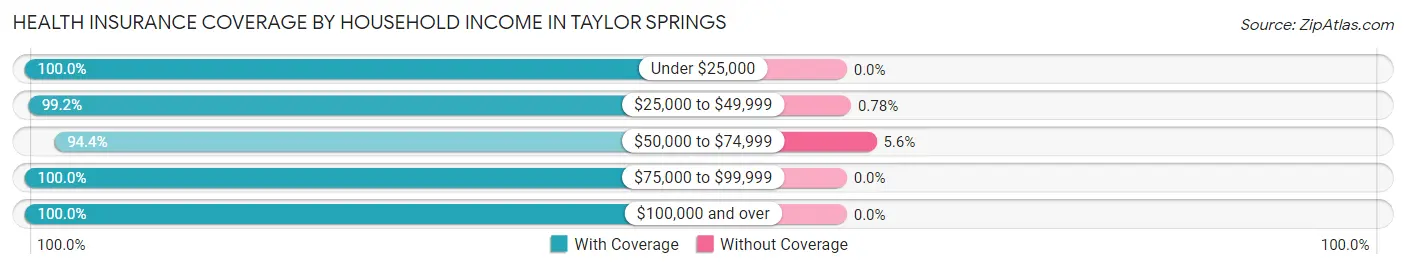
| Household Income | With Coverage | Without Coverage |
| Under $25,000 | 61 (100.0%) | 0 (0.0%) |
| $25,000 to $49,999 | 253 (99.2%) | 2 (0.8%) |
| $50,000 to $74,999 | 85 (94.4%) | 5 (5.6%) |
| $75,000 to $99,999 | 60 (100.0%) | 0 (0.0%) |
| $100,000 and over | 76 (100.0%) | 0 (0.0%) |
Public vs Private Health Insurance Coverage by Age in Taylor Springs
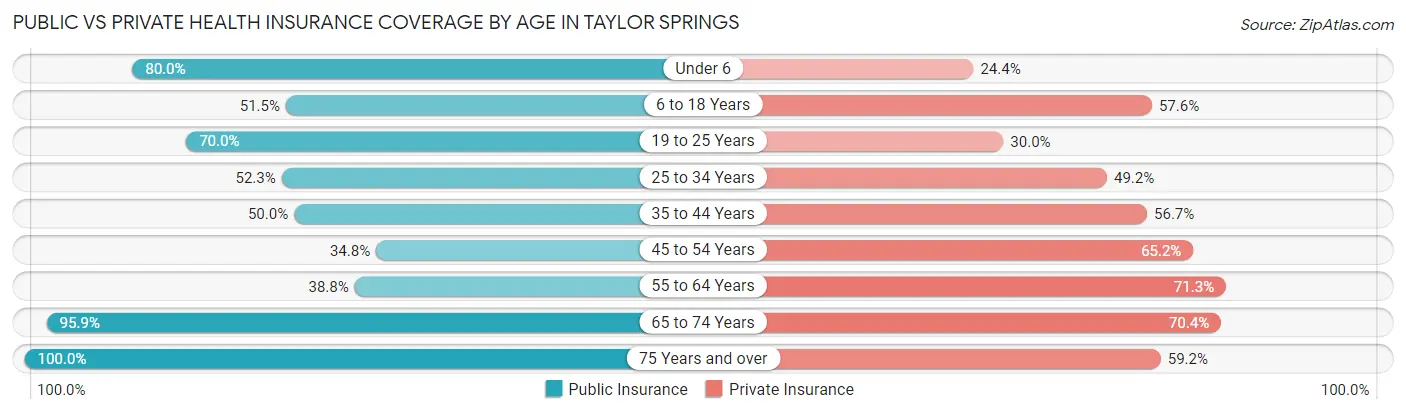
| Age Bracket | Public Insurance | Private Insurance |
| Under 6 | 36 (80.0%) | 11 (24.4%) |
| 6 to 18 Years | 17 (51.5%) | 19 (57.6%) |
| 19 to 25 Years | 14 (70.0%) | 6 (30.0%) |
| 25 to 34 Years | 34 (52.3%) | 32 (49.2%) |
| 35 to 44 Years | 15 (50.0%) | 17 (56.7%) |
| 45 to 54 Years | 16 (34.8%) | 30 (65.2%) |
| 55 to 64 Years | 50 (38.8%) | 92 (71.3%) |
| 65 to 74 Years | 94 (95.9%) | 69 (70.4%) |
| 75 Years and over | 76 (100.0%) | 45 (59.2%) |
| Total | 352 (64.9%) | 321 (59.2%) |
Disability Status by Sex by Age in Taylor Springs
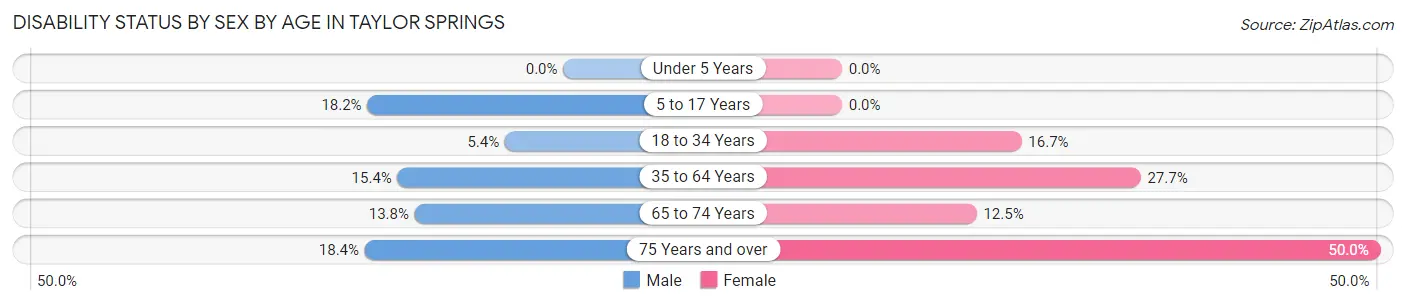
| Age Bracket | Male | Female |
| Under 5 Years | 0 (0.0%) | 0 (0.0%) |
| 5 to 17 Years | 2 (18.2%) | 0 (0.0%) |
| 18 to 34 Years | 2 (5.4%) | 8 (16.7%) |
| 35 to 64 Years | 16 (15.4%) | 28 (27.7%) |
| 65 to 74 Years | 8 (13.8%) | 5 (12.5%) |
| 75 Years and over | 7 (18.4%) | 19 (50.0%) |
Disability Class by Sex by Age in Taylor Springs
Disability Class: Hearing Difficulty
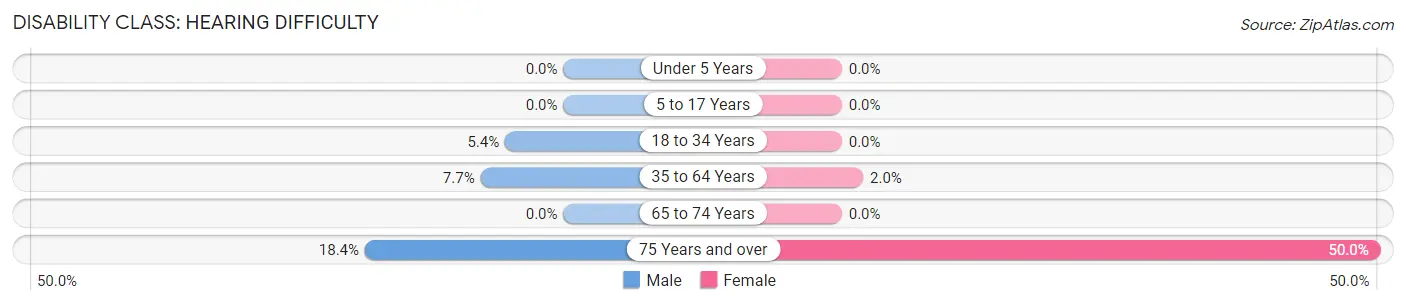
| Age Bracket | Male | Female |
| Under 5 Years | 0 (0.0%) | 0 (0.0%) |
| 5 to 17 Years | 0 (0.0%) | 0 (0.0%) |
| 18 to 34 Years | 2 (5.4%) | 0 (0.0%) |
| 35 to 64 Years | 8 (7.7%) | 2 (2.0%) |
| 65 to 74 Years | 0 (0.0%) | 0 (0.0%) |
| 75 Years and over | 7 (18.4%) | 19 (50.0%) |
Disability Class: Vision Difficulty
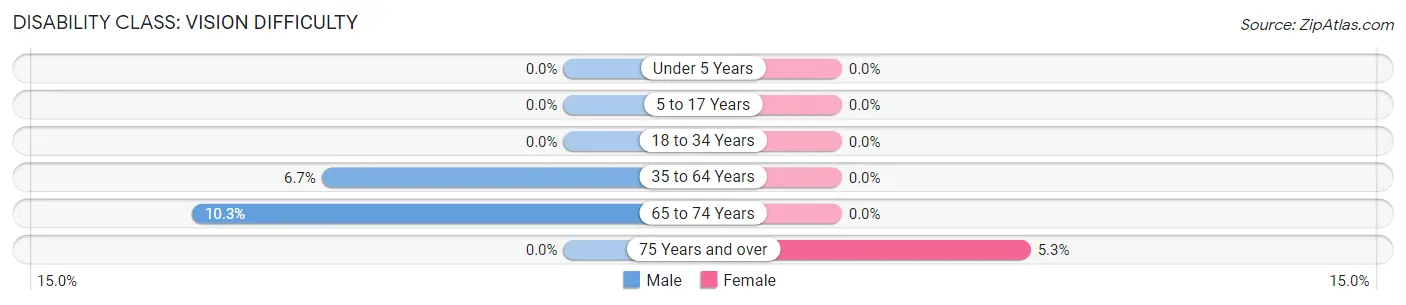
| Age Bracket | Male | Female |
| Under 5 Years | 0 (0.0%) | 0 (0.0%) |
| 5 to 17 Years | 0 (0.0%) | 0 (0.0%) |
| 18 to 34 Years | 0 (0.0%) | 0 (0.0%) |
| 35 to 64 Years | 7 (6.7%) | 0 (0.0%) |
| 65 to 74 Years | 6 (10.3%) | 0 (0.0%) |
| 75 Years and over | 0 (0.0%) | 2 (5.3%) |
Disability Class: Cognitive Difficulty
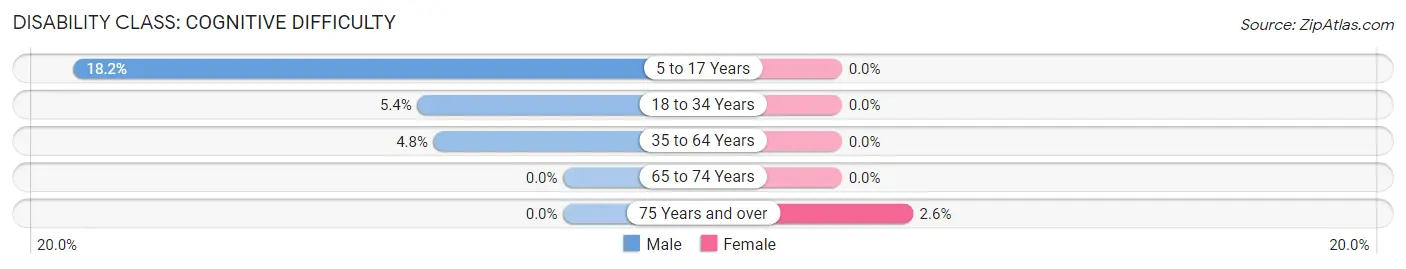
| Age Bracket | Male | Female |
| 5 to 17 Years | 2 (18.2%) | 0 (0.0%) |
| 18 to 34 Years | 2 (5.4%) | 0 (0.0%) |
| 35 to 64 Years | 5 (4.8%) | 0 (0.0%) |
| 65 to 74 Years | 0 (0.0%) | 0 (0.0%) |
| 75 Years and over | 0 (0.0%) | 1 (2.6%) |
Disability Class: Ambulatory Difficulty
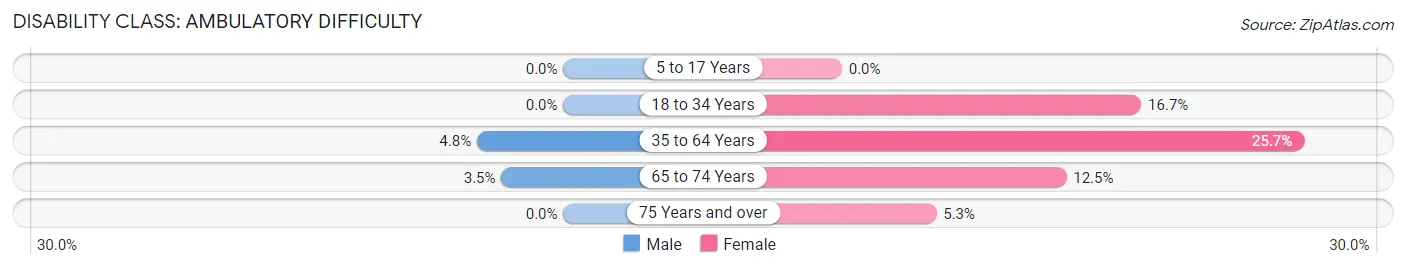
| Age Bracket | Male | Female |
| 5 to 17 Years | 0 (0.0%) | 0 (0.0%) |
| 18 to 34 Years | 0 (0.0%) | 8 (16.7%) |
| 35 to 64 Years | 5 (4.8%) | 26 (25.7%) |
| 65 to 74 Years | 2 (3.5%) | 5 (12.5%) |
| 75 Years and over | 0 (0.0%) | 2 (5.3%) |
Disability Class: Self-Care Difficulty
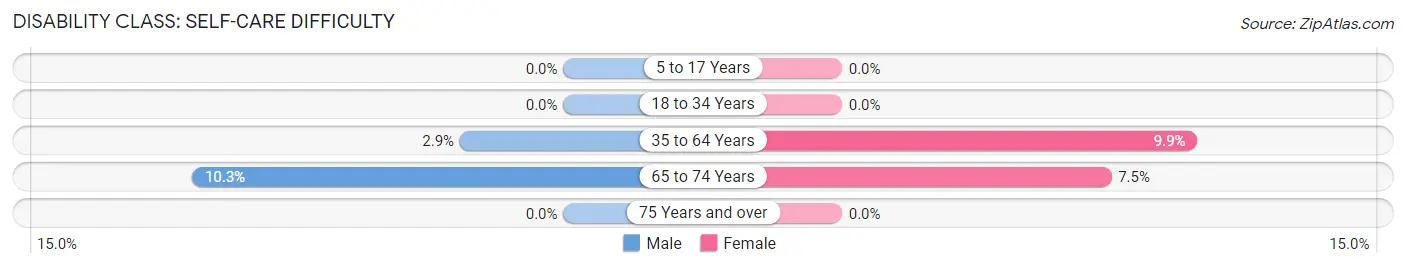
| Age Bracket | Male | Female |
| 5 to 17 Years | 0 (0.0%) | 0 (0.0%) |
| 18 to 34 Years | 0 (0.0%) | 0 (0.0%) |
| 35 to 64 Years | 3 (2.9%) | 10 (9.9%) |
| 65 to 74 Years | 6 (10.3%) | 3 (7.5%) |
| 75 Years and over | 0 (0.0%) | 0 (0.0%) |
Technology Access in Taylor Springs
Computing Device Access in Taylor Springs
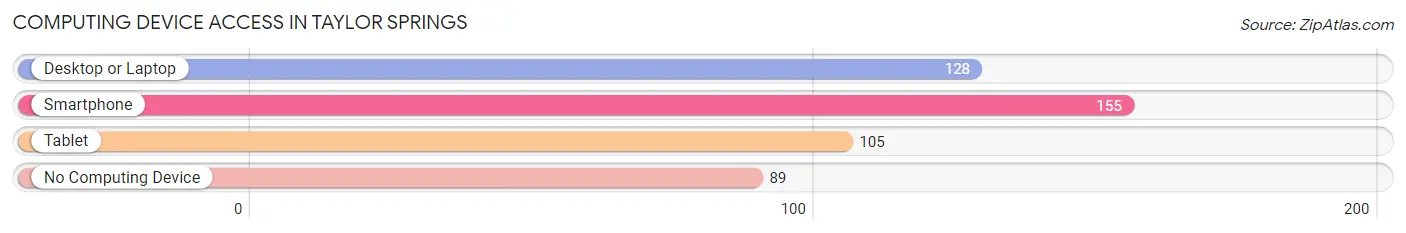
| Device Type | # Households | % Households |
| Desktop or Laptop | 128 | 47.2% |
| Smartphone | 155 | 57.2% |
| Tablet | 105 | 38.8% |
| No Computing Device | 89 | 32.8% |
| Total | 271 | 100.0% |
Internet Access in Taylor Springs
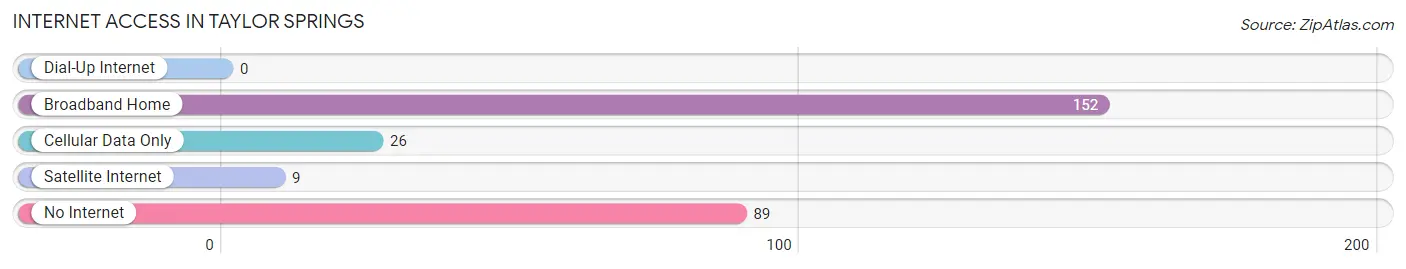
| Internet Type | # Households | % Households |
| Dial-Up Internet | 0 | 0.0% |
| Broadband Home | 152 | 56.1% |
| Cellular Data Only | 26 | 9.6% |
| Satellite Internet | 9 | 3.3% |
| No Internet | 89 | 32.8% |
| Total | 271 | 100.0% |
Taylor Springs Summary
History
Taylor Springs is a small village located in Montgomery County, Illinois. It is situated in the hills of the Shawnee National Forest, about 25 miles east of St. Louis. The village was founded in 1854 by William Taylor, a settler from Kentucky. Taylor named the village after himself and it quickly grew into a thriving community.
The village was originally a farming community, with many of the settlers growing corn, wheat, and other crops. The village also had a sawmill, a blacksmith, and a general store. In the late 1800s, the village began to expand and the population grew to over 500 people.
In the early 1900s, the village began to decline as many of the residents moved away to larger cities. By the 1950s, the population had dropped to just over 200 people. However, the village has seen a resurgence in recent years, with the population now estimated to be around 400 people.
Geography
Taylor Springs is located in the hills of the Shawnee National Forest in Montgomery County, Illinois. The village is situated at an elevation of 690 feet above sea level. The village is surrounded by rolling hills and is located near the Kaskaskia River.
The climate in Taylor Springs is humid continental, with hot summers and cold winters. The average temperature in the summer is around 80 degrees Fahrenheit, while the average temperature in the winter is around 30 degrees Fahrenheit.
Economy
The economy of Taylor Springs is largely based on agriculture. The village is home to several farms, which produce corn, wheat, soybeans, and other crops. The village also has a few small businesses, including a general store, a gas station, and a restaurant.
The village is also home to a few tourist attractions, including the Taylor Springs Historical Museum and the Taylor Springs Nature Center. The village is also home to a few wineries, which produce a variety of wines.
Demographics
As of the 2010 census, the population of Taylor Springs was estimated to be around 400 people. The racial makeup of the village was 97.5% White, 0.5% African American, 0.5% Native American, 0.5% Asian, and 1.0% from other races.
The median household income in Taylor Springs was estimated to be $45,000 in 2010. The median age of the village was estimated to be around 40 years old. The village is home to a few churches, including the Taylor Springs Baptist Church and the Taylor Springs Methodist Church.
Common Questions
What is Per Capita Income in Taylor Springs?
Per Capita income in Taylor Springs is $23,470.
What is the Median Family Income in Taylor Springs?
Median Family Income in Taylor Springs is $43,676.
What is the Median Household income in Taylor Springs?
Median Household Income in Taylor Springs is $43,155.
What is Income or Wage Gap in Taylor Springs?
Income or Wage Gap in Taylor Springs is 19.2%.
Women in Taylor Springs earn 80.8 cents for every dollar earned by a man.
What is Family Income Deficit in Taylor Springs?
Family Income Deficit in Taylor Springs is $6,868.
Families that are below poverty line in Taylor Springs earn $6,868 less on average than the poverty threshold level.
What is Inequality or Gini Index in Taylor Springs?
Inequality or Gini Index in Taylor Springs is 0.39.
What is the Total Population of Taylor Springs?
Total Population of Taylor Springs is 663.
What is the Total Male Population of Taylor Springs?
Total Male Population of Taylor Springs is 294.
What is the Total Female Population of Taylor Springs?
Total Female Population of Taylor Springs is 369.
What is the Ratio of Males per 100 Females in Taylor Springs?
There are 79.67 Males per 100 Females in Taylor Springs.
What is the Ratio of Females per 100 Males in Taylor Springs?
There are 125.51 Females per 100 Males in Taylor Springs.
What is the Median Population Age in Taylor Springs?
Median Population Age in Taylor Springs is 61.7 Years.
What is the Average Family Size in Taylor Springs
Average Family Size in Taylor Springs is 2.3 People.
What is the Average Household Size in Taylor Springs
Average Household Size in Taylor Springs is 2.0 People.
How Large is the Labor Force in Taylor Springs?
There are 182 People in the Labor Forcein in Taylor Springs.
What is the Percentage of People in the Labor Force in Taylor Springs?
31.0% of People are in the Labor Force in Taylor Springs.
What is the Unemployment Rate in Taylor Springs?
Unemployment Rate in Taylor Springs is 3.8%.