Sullivan, IL Map & Demographics
Sullivan Map
Sullivan Overview
$30,946
PER CAPITA INCOME
$74,554
AVG FAMILY INCOME
$63,917
AVG HOUSEHOLD INCOME
47.8%
WAGE / INCOME GAP [ % ]
52.2¢/ $1
WAGE / INCOME GAP [ $ ]
0.38
INEQUALITY / GINI INDEX
4,408
TOTAL POPULATION
2,081
MALE POPULATION
2,327
FEMALE POPULATION
89.43
MALES / 100 FEMALES
111.82
FEMALES / 100 MALES
39.0
MEDIAN AGE
2.8
AVG FAMILY SIZE
2.3
AVG HOUSEHOLD SIZE
2,098
LABOR FORCE [ PEOPLE ]
60.4%
PERCENT IN LABOR FORCE
5.6%
UNEMPLOYMENT RATE
Sullivan Zip Codes
Sullivan Area Codes
Income in Sullivan
Income Overview in Sullivan
Per Capita Income in Sullivan is $30,946, while median incomes of families and households are $74,554 and $63,917 respectively.
| Characteristic | Number | Measure |
| Per Capita Income | 4,408 | $30,946 |
| Median Family Income | 1,233 | $74,554 |
| Mean Family Income | 1,233 | $85,117 |
| Median Household Income | 1,803 | $63,917 |
| Mean Household Income | 1,803 | $73,834 |
| Income Deficit | 1,233 | $0 |
| Wage / Income Gap (%) | 4,408 | 47.82% |
| Wage / Income Gap ($) | 4,408 | 52.18¢ per $1 |
| Gini / Inequality Index | 4,408 | 0.38 |
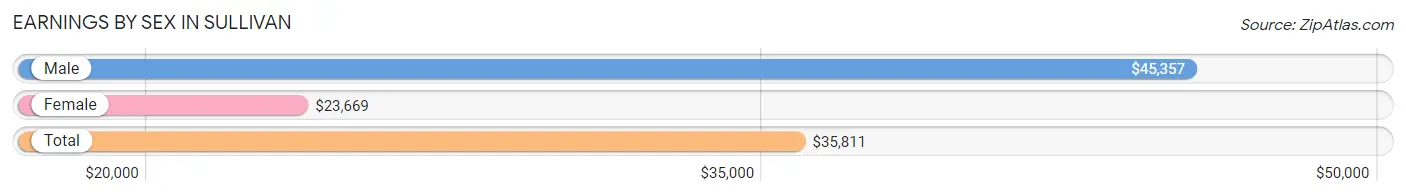
Earnings by Sex in Sullivan
Average Earnings in Sullivan are $35,811, $45,357 for men and $23,669 for women, a difference of 47.8%.
| Sex | Number | Average Earnings |
| Male | 1,090 (48.5%) | $45,357 |
| Female | 1,155 (51.4%) | $23,669 |
| Total | 2,245 (100.0%) | $35,811 |
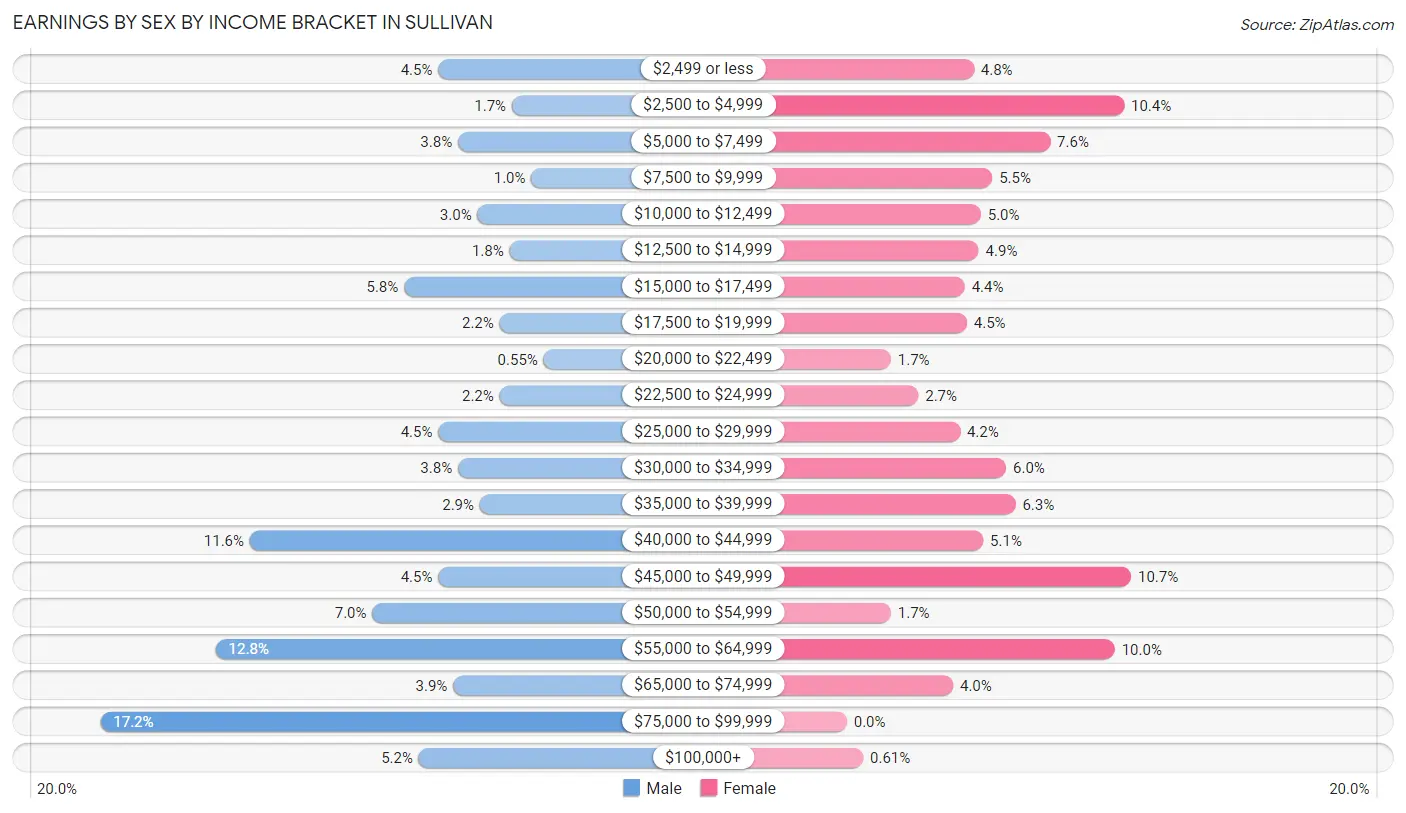
Earnings by Sex by Income Bracket in Sullivan
The most common earnings brackets in Sullivan are $75,000 to $99,999 for men (187 | 17.2%) and $45,000 to $49,999 for women (123 | 10.6%).
| Income | Male | Female |
| $2,499 or less | 49 (4.5%) | 55 (4.8%) |
| $2,500 to $4,999 | 19 (1.7%) | 120 (10.4%) |
| $5,000 to $7,499 | 41 (3.8%) | 88 (7.6%) |
| $7,500 to $9,999 | 11 (1.0%) | 63 (5.4%) |
| $10,000 to $12,499 | 33 (3.0%) | 58 (5.0%) |
| $12,500 to $14,999 | 20 (1.8%) | 57 (4.9%) |
| $15,000 to $17,499 | 63 (5.8%) | 51 (4.4%) |
| $17,500 to $19,999 | 24 (2.2%) | 52 (4.5%) |
| $20,000 to $22,499 | 6 (0.5%) | 19 (1.7%) |
| $22,500 to $24,999 | 24 (2.2%) | 31 (2.7%) |
| $25,000 to $29,999 | 49 (4.5%) | 49 (4.2%) |
| $30,000 to $34,999 | 41 (3.8%) | 69 (6.0%) |
| $35,000 to $39,999 | 32 (2.9%) | 73 (6.3%) |
| $40,000 to $44,999 | 126 (11.6%) | 59 (5.1%) |
| $45,000 to $49,999 | 49 (4.5%) | 123 (10.6%) |
| $50,000 to $54,999 | 76 (7.0%) | 19 (1.7%) |
| $55,000 to $64,999 | 140 (12.8%) | 116 (10.0%) |
| $65,000 to $74,999 | 43 (3.9%) | 46 (4.0%) |
| $75,000 to $99,999 | 187 (17.2%) | 0 (0.0%) |
| $100,000+ | 57 (5.2%) | 7 (0.6%) |
| Total | 1,090 (100.0%) | 1,155 (100.0%) |
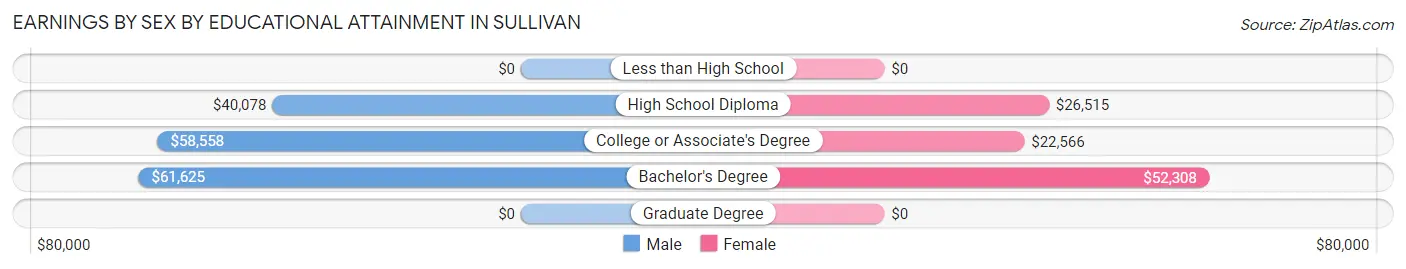
Earnings by Sex by Educational Attainment in Sullivan
Average earnings in Sullivan are $50,786 for men and $33,021 for women, a difference of 35.0%. Men with an educational attainment of bachelor's degree enjoy the highest average annual earnings of $61,625, while those with high school diploma education earn the least with $40,078. Women with an educational attainment of bachelor's degree earn the most with the average annual earnings of $52,308, while those with college or associate's degree education have the smallest earnings of $22,566.
| Educational Attainment | Male Income | Female Income |
| Less than High School | - | - |
| High School Diploma | $40,078 | $26,515 |
| College or Associate's Degree | $58,558 | $22,566 |
| Bachelor's Degree | $61,625 | $52,308 |
| Graduate Degree | - | - |
| Total | $50,786 | $33,021 |
Family Income in Sullivan
Family Income Brackets in Sullivan
According to the Sullivan family income data, there are 358 families falling into the $50,000 to $74,999 income range, which is the most common income bracket and makes up 29.0% of all families. Conversely, the $15,000 to $24,999 income bracket is the least frequent group with only 18 families (1.5%) belonging to this category.
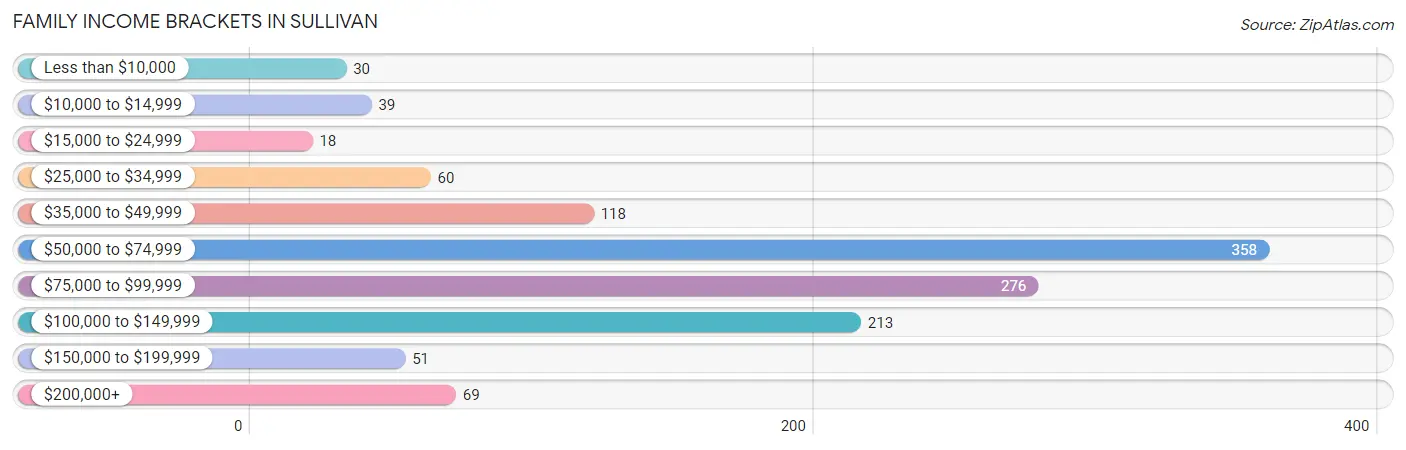
| Income Bracket | # Families | % Families |
| Less than $10,000 | 30 | 2.4% |
| $10,000 to $14,999 | 39 | 3.2% |
| $15,000 to $24,999 | 18 | 1.5% |
| $25,000 to $34,999 | 60 | 4.9% |
| $35,000 to $49,999 | 118 | 9.6% |
| $50,000 to $74,999 | 358 | 29.0% |
| $75,000 to $99,999 | 276 | 22.4% |
| $100,000 to $149,999 | 213 | 17.3% |
| $150,000 to $199,999 | 51 | 4.1% |
| $200,000+ | 69 | 5.6% |
Family Income by Famaliy Size in Sullivan
4-person families (221 | 17.9%) account for the highest median family income in Sullivan with $80,625 per family, while 2-person families (708 | 57.4%) have the highest median income of $37,446 per family member.
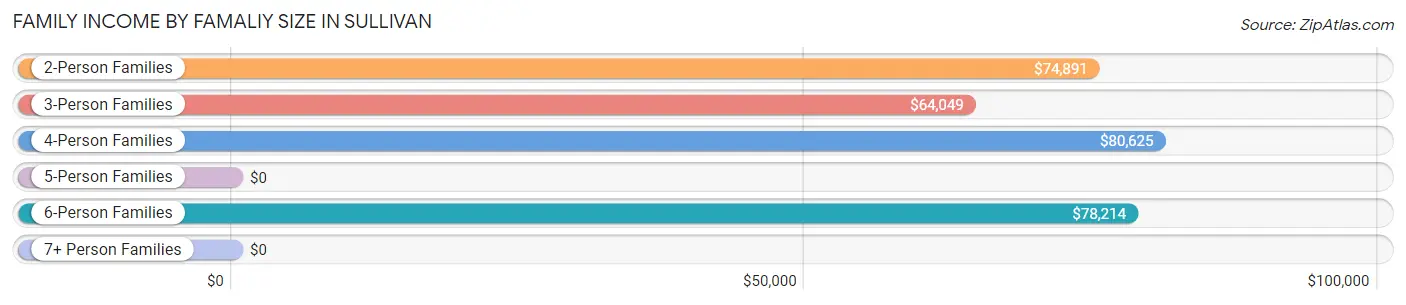
| Income Bracket | # Families | Median Income |
| 2-Person Families | 708 (57.4%) | $74,891 |
| 3-Person Families | 192 (15.6%) | $64,049 |
| 4-Person Families | 221 (17.9%) | $80,625 |
| 5-Person Families | 46 (3.7%) | $0 |
| 6-Person Families | 56 (4.5%) | $78,214 |
| 7+ Person Families | 10 (0.8%) | $0 |
| Total | 1,233 (100.0%) | $74,554 |
Family Income by Number of Earners in Sullivan
The median family income in Sullivan is $74,554, with families comprising 3+ earners (125) having the highest median family income of $107,452, while families with no earners (166) have the lowest median family income of $57,619, accounting for 10.1% and 13.5% of families, respectively.
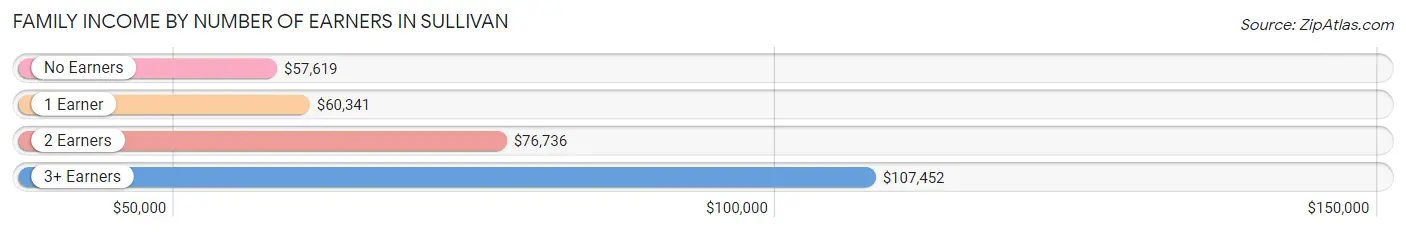
| Number of Earners | # Families | Median Income |
| No Earners | 166 (13.5%) | $57,619 |
| 1 Earner | 483 (39.2%) | $60,341 |
| 2 Earners | 459 (37.2%) | $76,736 |
| 3+ Earners | 125 (10.1%) | $107,452 |
| Total | 1,233 (100.0%) | $74,554 |
Household Income in Sullivan
Household Income Brackets in Sullivan
With 397 households falling in the category, the $75,000 to $99,999 income range is the most frequent in Sullivan, accounting for 22.0% of all households. In contrast, only 41 households (2.3%) fall into the less than $10,000 income bracket, making it the least populous group.
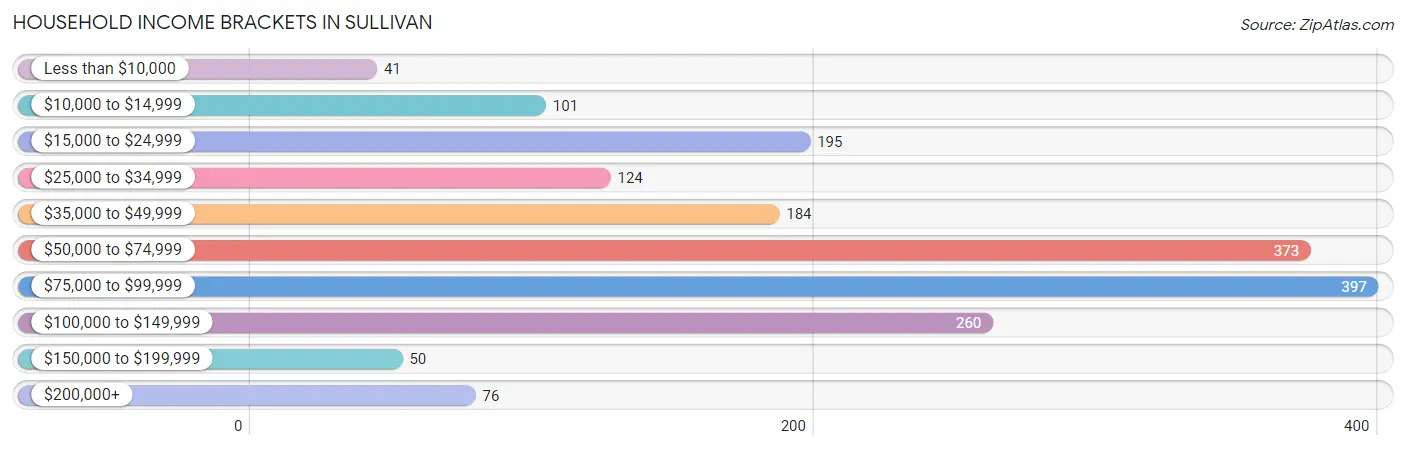
| Income Bracket | # Households | % Households |
| Less than $10,000 | 41 | 2.3% |
| $10,000 to $14,999 | 101 | 5.6% |
| $15,000 to $24,999 | 195 | 10.8% |
| $25,000 to $34,999 | 124 | 6.9% |
| $35,000 to $49,999 | 184 | 10.2% |
| $50,000 to $74,999 | 373 | 20.7% |
| $75,000 to $99,999 | 397 | 22.0% |
| $100,000 to $149,999 | 260 | 14.4% |
| $150,000 to $199,999 | 50 | 2.8% |
| $200,000+ | 76 | 4.2% |
Household Income by Householder Age in Sullivan
The median household income in Sullivan is $63,917, with the highest median household income of $76,250 found in the 45 to 64 years age bracket for the primary householder. A total of 566 households (31.4%) fall into this category. Meanwhile, the 15 to 24 years age bracket for the primary householder has the lowest median household income of $0, with 39 households (2.2%) in this group.
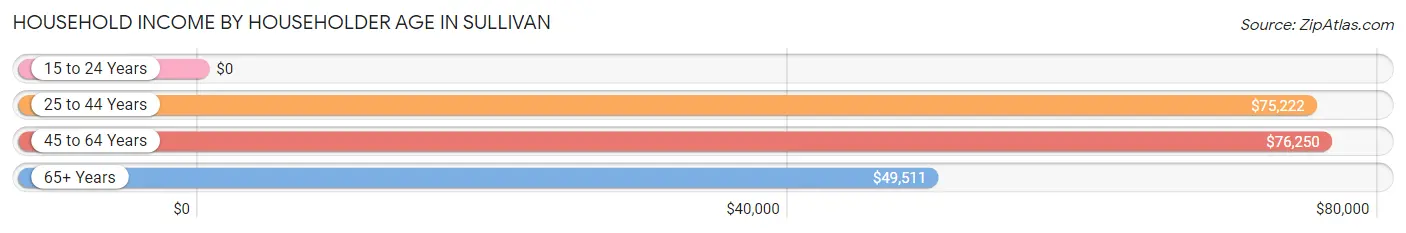
| Income Bracket | # Households | Median Income |
| 15 to 24 Years | 39 (2.2%) | $0 |
| 25 to 44 Years | 677 (37.6%) | $75,222 |
| 45 to 64 Years | 566 (31.4%) | $76,250 |
| 65+ Years | 521 (28.9%) | $49,511 |
| Total | 1,803 (100.0%) | $63,917 |
Poverty in Sullivan
Income Below Poverty by Sex and Age in Sullivan
With 9.2% poverty level for males and 12.3% for females among the residents of Sullivan, 6 to 11 year old males and 18 to 24 year old females are the most vulnerable to poverty, with 70 males (44.3%) and 41 females (37.3%) in their respective age groups living below the poverty level.
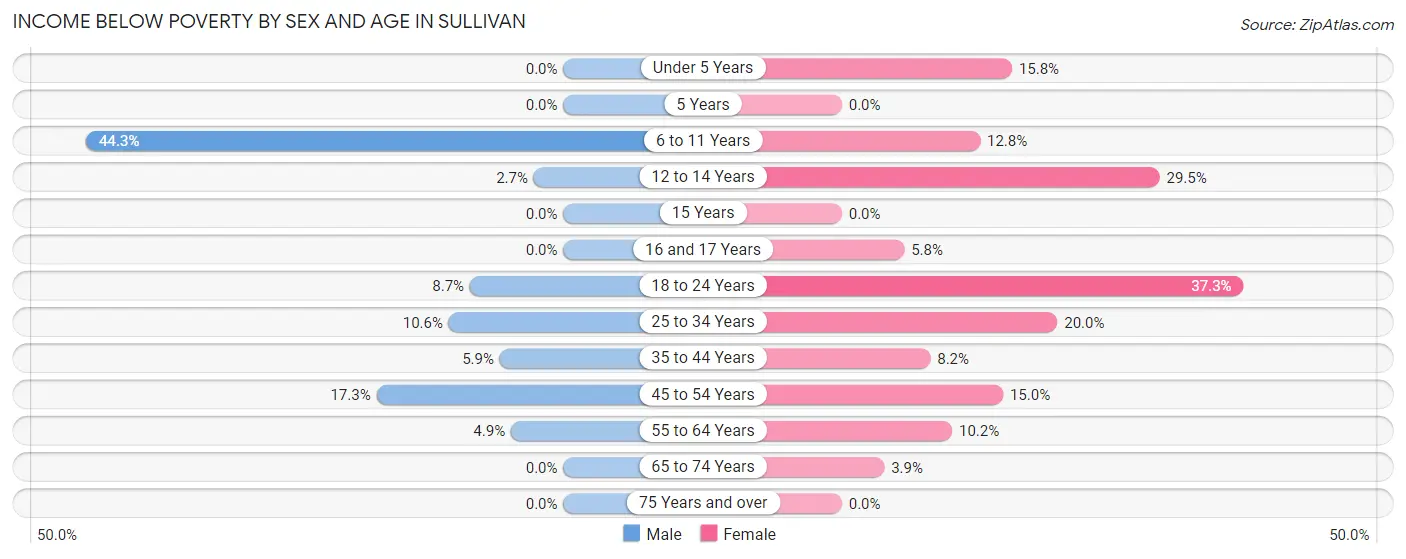
| Age Bracket | Male | Female |
| Under 5 Years | 0 (0.0%) | 15 (15.8%) |
| 5 Years | 0 (0.0%) | 0 (0.0%) |
| 6 to 11 Years | 70 (44.3%) | 29 (12.8%) |
| 12 to 14 Years | 6 (2.7%) | 23 (29.5%) |
| 15 Years | 0 (0.0%) | 0 (0.0%) |
| 16 and 17 Years | 0 (0.0%) | 7 (5.8%) |
| 18 to 24 Years | 13 (8.7%) | 41 (37.3%) |
| 25 to 34 Years | 32 (10.6%) | 62 (20.0%) |
| 35 to 44 Years | 19 (5.9%) | 23 (8.2%) |
| 45 to 54 Years | 30 (17.3%) | 41 (15.0%) |
| 55 to 64 Years | 12 (4.9%) | 27 (10.2%) |
| 65 to 74 Years | 0 (0.0%) | 11 (3.9%) |
| 75 Years and over | 0 (0.0%) | 0 (0.0%) |
| Total | 182 (9.2%) | 279 (12.3%) |
Income Above Poverty by Sex and Age in Sullivan
According to the poverty statistics in Sullivan, males aged under 5 years and females aged 5 years are the age groups that are most secure financially, with 100.0% of males and 100.0% of females in these age groups living above the poverty line.
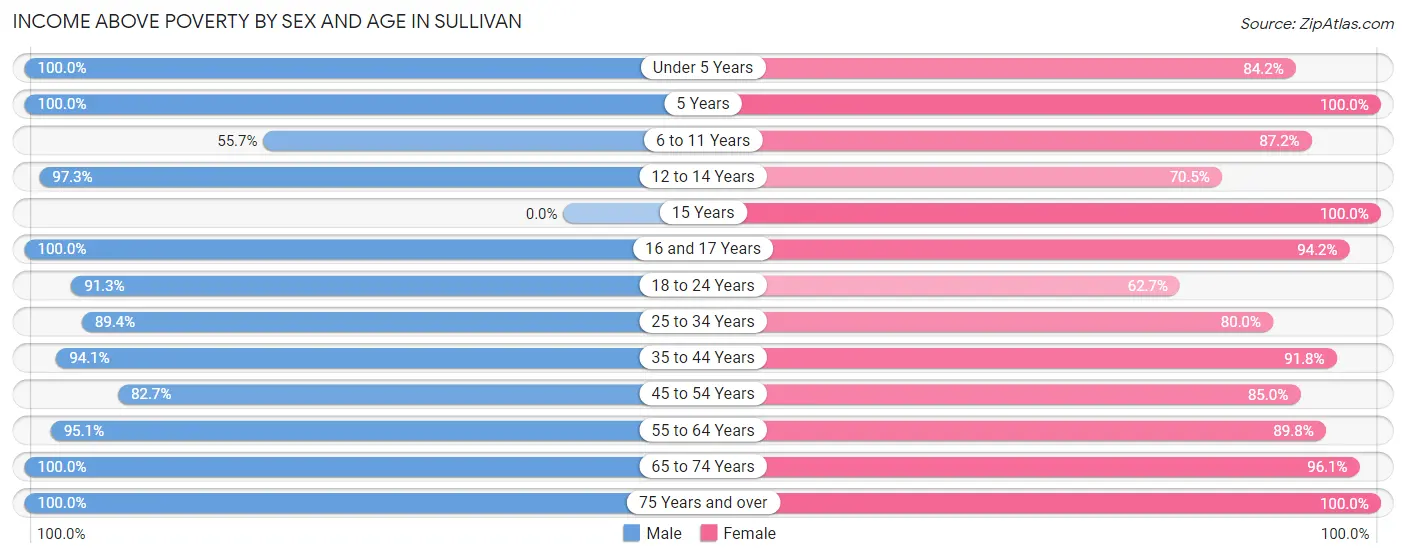
| Age Bracket | Male | Female |
| Under 5 Years | 112 (100.0%) | 80 (84.2%) |
| 5 Years | 10 (100.0%) | 14 (100.0%) |
| 6 to 11 Years | 88 (55.7%) | 197 (87.2%) |
| 12 to 14 Years | 213 (97.3%) | 55 (70.5%) |
| 15 Years | 0 (0.0%) | 7 (100.0%) |
| 16 and 17 Years | 42 (100.0%) | 114 (94.2%) |
| 18 to 24 Years | 137 (91.3%) | 69 (62.7%) |
| 25 to 34 Years | 269 (89.4%) | 248 (80.0%) |
| 35 to 44 Years | 303 (94.1%) | 257 (91.8%) |
| 45 to 54 Years | 143 (82.7%) | 233 (85.0%) |
| 55 to 64 Years | 235 (95.1%) | 237 (89.8%) |
| 65 to 74 Years | 169 (100.0%) | 268 (96.1%) |
| 75 Years and over | 79 (100.0%) | 208 (100.0%) |
| Total | 1,800 (90.8%) | 1,987 (87.7%) |
Income Below Poverty Among Married-Couple Families in Sullivan
The poverty statistics for married-couple families in Sullivan show that 3.1% or 25 of the total 816 families live below the poverty line. Families with no children have the highest poverty rate of 4.5%, comprising of 25 families. On the other hand, families with 1 or 2 children have the lowest poverty rate of 0.0%, which includes 0 families.
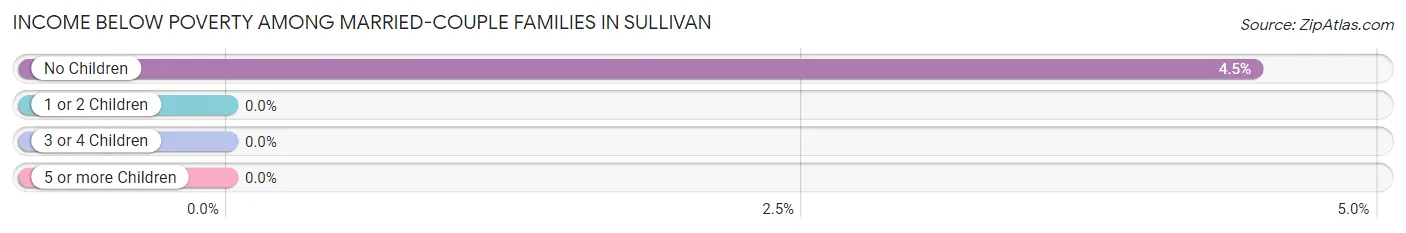
| Children | Above Poverty | Below Poverty |
| No Children | 536 (95.5%) | 25 (4.5%) |
| 1 or 2 Children | 189 (100.0%) | 0 (0.0%) |
| 3 or 4 Children | 66 (100.0%) | 0 (0.0%) |
| 5 or more Children | 0 (0.0%) | 0 (0.0%) |
| Total | 791 (96.9%) | 25 (3.1%) |
Income Below Poverty Among Single-Parent Households in Sullivan
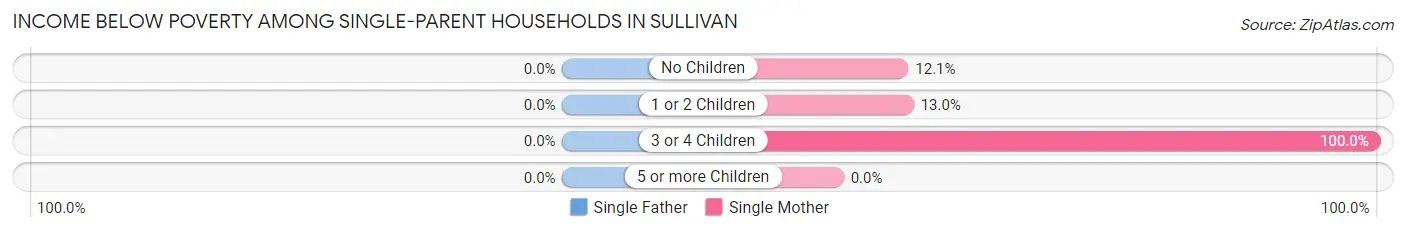
| Children | Single Father | Single Mother |
| No Children | 0 (0.0%) | 10 (12.0%) |
| 1 or 2 Children | 0 (0.0%) | 27 (13.0%) |
| 3 or 4 Children | 0 (0.0%) | 38 (100.0%) |
| 5 or more Children | 0 (0.0%) | 0 (0.0%) |
| Total | 0 (0.0%) | 75 (22.9%) |
Income Below Poverty Among Married-Couple vs Single-Parent Households in Sullivan
The poverty data for Sullivan shows that 25 of the married-couple family households (3.1%) and 75 of the single-parent households (18.0%) are living below the poverty level. Within the married-couple family households, those with no children have the highest poverty rate, with 25 households (4.5%) falling below the poverty line. Among the single-parent households, those with 3 or 4 children have the highest poverty rate, with 38 household (77.5%) living below poverty.
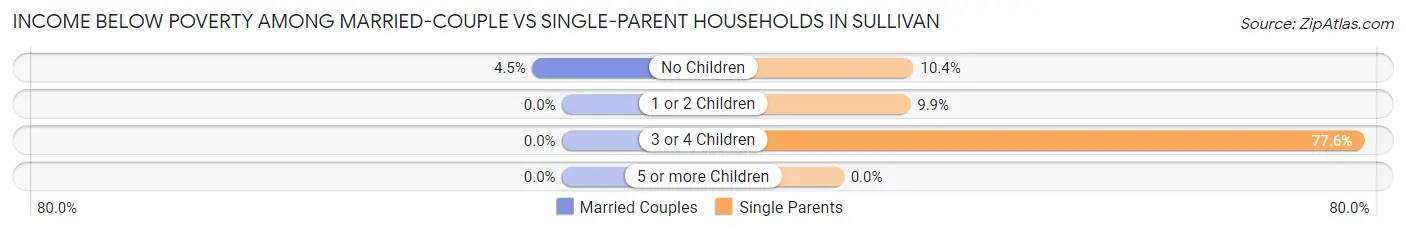
| Children | Married-Couple Families | Single-Parent Households |
| No Children | 25 (4.5%) | 10 (10.4%) |
| 1 or 2 Children | 0 (0.0%) | 27 (9.9%) |
| 3 or 4 Children | 0 (0.0%) | 38 (77.5%) |
| 5 or more Children | 0 (0.0%) | 0 (0.0%) |
| Total | 25 (3.1%) | 75 (18.0%) |
Race in Sullivan
The most populous races in Sullivan are White / Caucasian (4,194 | 95.2%), Two or more Races (104 | 2.4%), and Black / African American (93 | 2.1%).
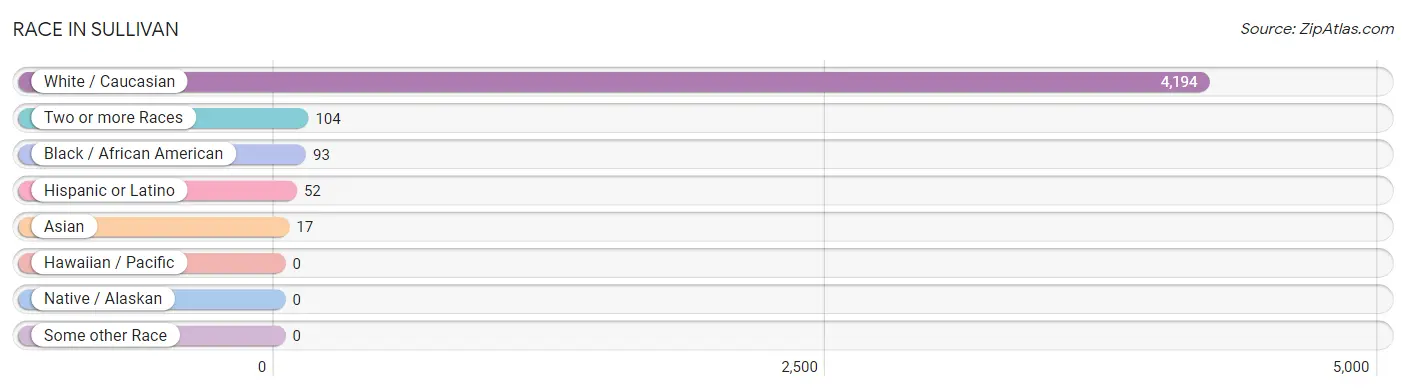
| Race | # Population | % Population |
| Asian | 17 | 0.4% |
| Black / African American | 93 | 2.1% |
| Hawaiian / Pacific | 0 | 0.0% |
| Hispanic or Latino | 52 | 1.2% |
| Native / Alaskan | 0 | 0.0% |
| White / Caucasian | 4,194 | 95.2% |
| Two or more Races | 104 | 2.4% |
| Some other Race | 0 | 0.0% |
| Total | 4,408 | 100.0% |
Ancestry in Sullivan
The most populous ancestries reported in Sullivan are German (805 | 18.3%), English (537 | 12.2%), American (412 | 9.3%), Irish (347 | 7.9%), and Italian (106 | 2.4%), together accounting for 50.1% of all Sullivan residents.
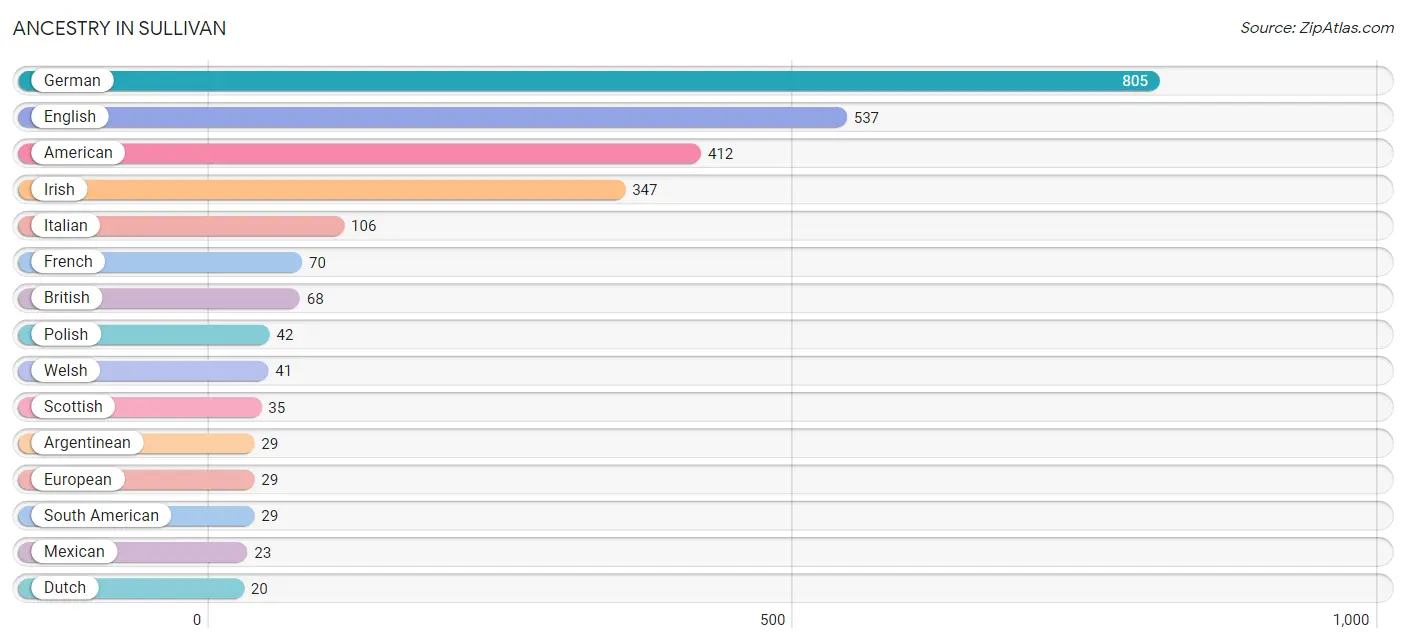
| Ancestry | # Population | % Population |
| American | 412 | 9.3% |
| Apache | 6 | 0.1% |
| Argentinean | 29 | 0.7% |
| British | 68 | 1.5% |
| Cherokee | 6 | 0.1% |
| Czech | 18 | 0.4% |
| Danish | 7 | 0.2% |
| Dutch | 20 | 0.4% |
| English | 537 | 12.2% |
| European | 29 | 0.7% |
| French | 70 | 1.6% |
| German | 805 | 18.3% |
| Indian (Asian) | 17 | 0.4% |
| Irish | 347 | 7.9% |
| Italian | 106 | 2.4% |
| Lithuanian | 14 | 0.3% |
| Mexican | 23 | 0.5% |
| Norwegian | 13 | 0.3% |
| Polish | 42 | 0.9% |
| Scotch-Irish | 16 | 0.4% |
| Scottish | 35 | 0.8% |
| Slavic | 12 | 0.3% |
| South American | 29 | 0.7% |
| Swedish | 14 | 0.3% |
| Swiss | 6 | 0.1% |
| Welsh | 41 | 0.9% | View All 26 Rows |
Immigrants in Sullivan
The most numerous immigrant groups reported in Sullivan came from Asia (17 | 0.4%), China (17 | 0.4%), Eastern Asia (17 | 0.4%), Europe (13 | 0.3%), and Italy (13 | 0.3%), together accounting for 1.7% of all Sullivan residents.
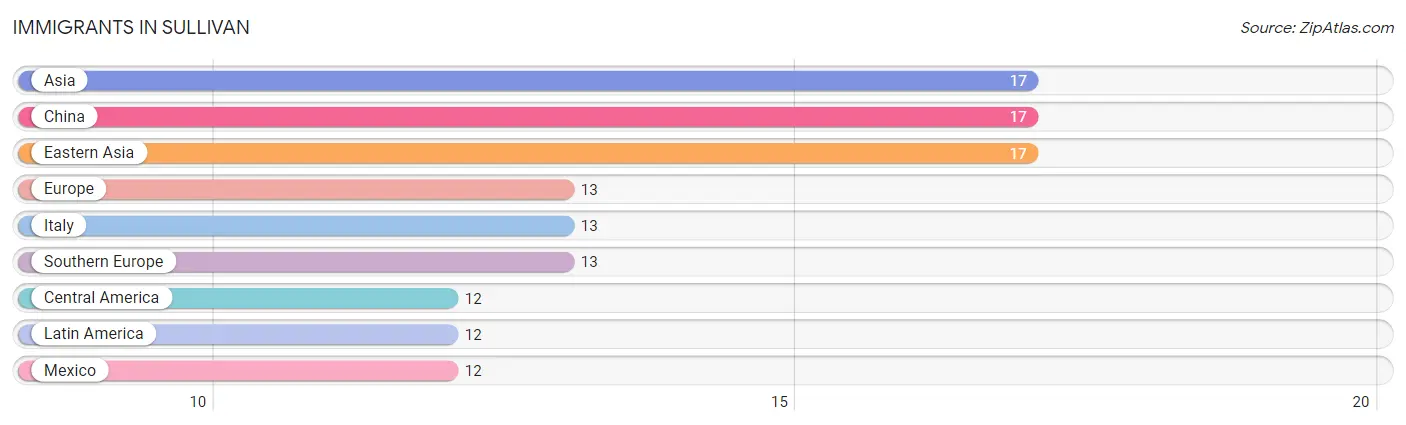
| Immigration Origin | # Population | % Population |
| Asia | 17 | 0.4% |
| Central America | 12 | 0.3% |
| China | 17 | 0.4% |
| Eastern Asia | 17 | 0.4% |
| Europe | 13 | 0.3% |
| Italy | 13 | 0.3% |
| Latin America | 12 | 0.3% |
| Mexico | 12 | 0.3% |
| Southern Europe | 13 | 0.3% | View All 9 Rows |
Sex and Age in Sullivan
Sex and Age in Sullivan
The most populous age groups in Sullivan are 10 to 14 Years (252 | 12.1%) for men and 35 to 39 Years (191 | 8.2%) for women.
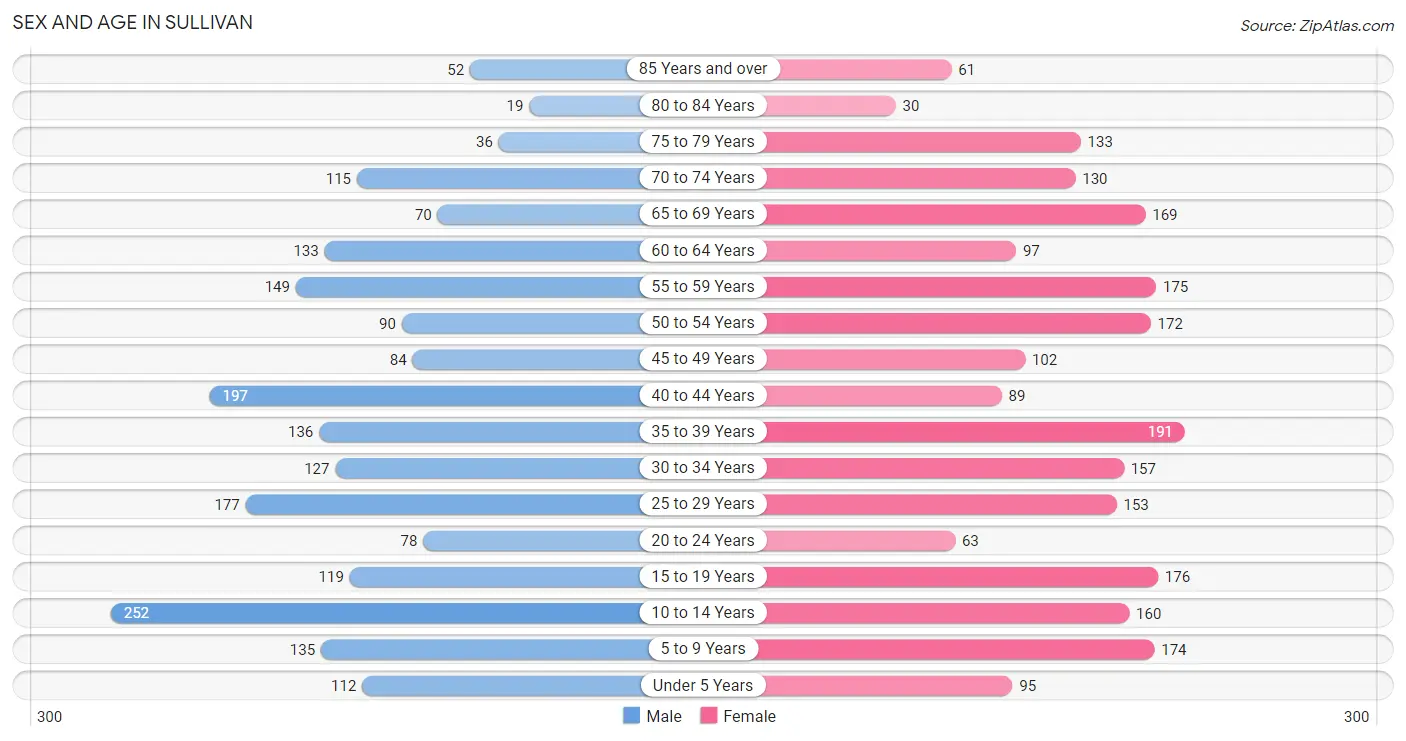
| Age Bracket | Male | Female |
| Under 5 Years | 112 (5.4%) | 95 (4.1%) |
| 5 to 9 Years | 135 (6.5%) | 174 (7.5%) |
| 10 to 14 Years | 252 (12.1%) | 160 (6.9%) |
| 15 to 19 Years | 119 (5.7%) | 176 (7.6%) |
| 20 to 24 Years | 78 (3.7%) | 63 (2.7%) |
| 25 to 29 Years | 177 (8.5%) | 153 (6.6%) |
| 30 to 34 Years | 127 (6.1%) | 157 (6.8%) |
| 35 to 39 Years | 136 (6.5%) | 191 (8.2%) |
| 40 to 44 Years | 197 (9.5%) | 89 (3.8%) |
| 45 to 49 Years | 84 (4.0%) | 102 (4.4%) |
| 50 to 54 Years | 90 (4.3%) | 172 (7.4%) |
| 55 to 59 Years | 149 (7.2%) | 175 (7.5%) |
| 60 to 64 Years | 133 (6.4%) | 97 (4.2%) |
| 65 to 69 Years | 70 (3.4%) | 169 (7.3%) |
| 70 to 74 Years | 115 (5.5%) | 130 (5.6%) |
| 75 to 79 Years | 36 (1.7%) | 133 (5.7%) |
| 80 to 84 Years | 19 (0.9%) | 30 (1.3%) |
| 85 Years and over | 52 (2.5%) | 61 (2.6%) |
| Total | 2,081 (100.0%) | 2,327 (100.0%) |
Families and Households in Sullivan
Median Family Size in Sullivan
The median family size in Sullivan is 2.77 persons per family, with single female/mother families (328 | 26.6%) accounting for the largest median family size of 2.94 persons per family. On the other hand, single male/father families (89 | 7.2%) represent the smallest median family size with 2.09 persons per family.
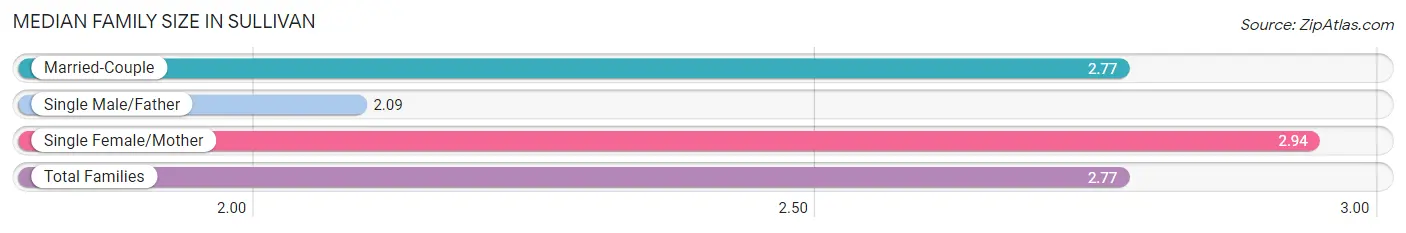
| Family Type | # Families | Family Size |
| Married-Couple | 816 (66.2%) | 2.77 |
| Single Male/Father | 89 (7.2%) | 2.09 |
| Single Female/Mother | 328 (26.6%) | 2.94 |
| Total Families | 1,233 (100.0%) | 2.77 |
Median Household Size in Sullivan
The median household size in Sullivan is 2.33 persons per household, with single female/mother households (328 | 18.2%) accounting for the largest median household size of 3.09 persons per household. non-family households (570 | 31.6%) represent the smallest median household size with 1.23 persons per household.
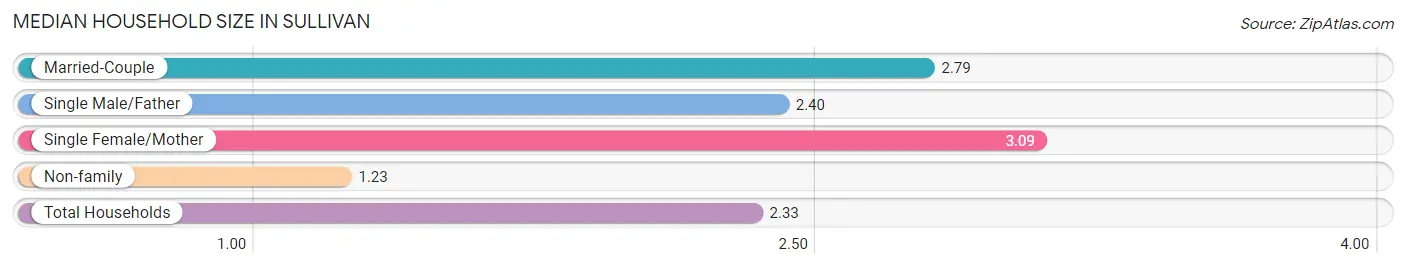
| Household Type | # Households | Household Size |
| Married-Couple | 816 (45.3%) | 2.79 |
| Single Male/Father | 89 (4.9%) | 2.40 |
| Single Female/Mother | 328 (18.2%) | 3.09 |
| Non-family | 570 (31.6%) | 1.23 |
| Total Households | 1,803 (100.0%) | 2.33 |
Household Size by Marriage Status in Sullivan
Out of a total of 1,803 households in Sullivan, 1,233 (68.4%) are family households, while 570 (31.6%) are nonfamily households. The most numerous type of family households are 2-person households, comprising 674, and the most common type of nonfamily households are 1-person households, comprising 467.
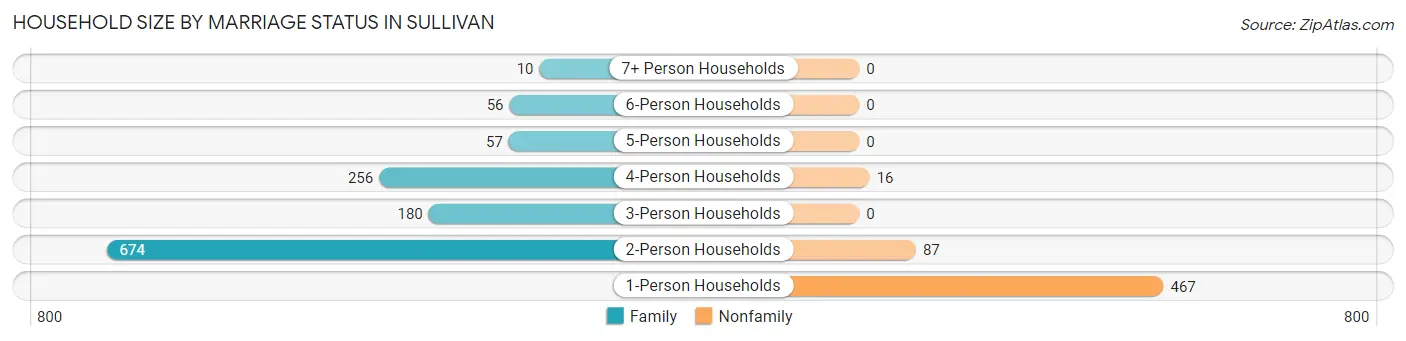
| Household Size | Family Households | Nonfamily Households |
| 1-Person Households | - | 467 (25.9%) |
| 2-Person Households | 674 (37.4%) | 87 (4.8%) |
| 3-Person Households | 180 (10.0%) | 0 (0.0%) |
| 4-Person Households | 256 (14.2%) | 16 (0.9%) |
| 5-Person Households | 57 (3.2%) | 0 (0.0%) |
| 6-Person Households | 56 (3.1%) | 0 (0.0%) |
| 7+ Person Households | 10 (0.5%) | 0 (0.0%) |
| Total | 1,233 (68.4%) | 570 (31.6%) |
Female Fertility in Sullivan
Fertility by Age in Sullivan
Average fertility rate in Sullivan is 26.0 births per 1,000 women. Women in the age bracket of 20 to 34 years have the highest fertility rate with 67.0 births per 1,000 women. Women in the age bracket of 20 to 34 years acount for 100.0% of all women with births.
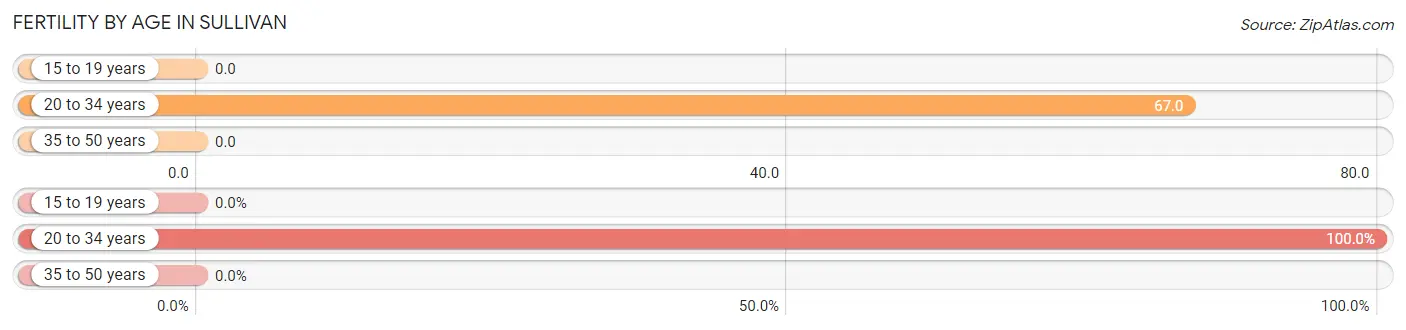
| Age Bracket | Women with Births | Births / 1,000 Women |
| 15 to 19 years | 0 (0.0%) | 0.0 |
| 20 to 34 years | 25 (100.0%) | 67.0 |
| 35 to 50 years | 0 (0.0%) | 0.0 |
| Total | 25 (100.0%) | 26.0 |
Fertility by Age by Marriage Status in Sullivan
64.0% of women with births (25) in Sullivan are married. The highest percentage of unmarried women with births falls into 20 to 34 years age bracket with 36.0% of them unmarried at the time of birth, while the lowest percentage of unmarried women with births belong to 20 to 34 years age bracket with 36.0% of them unmarried.
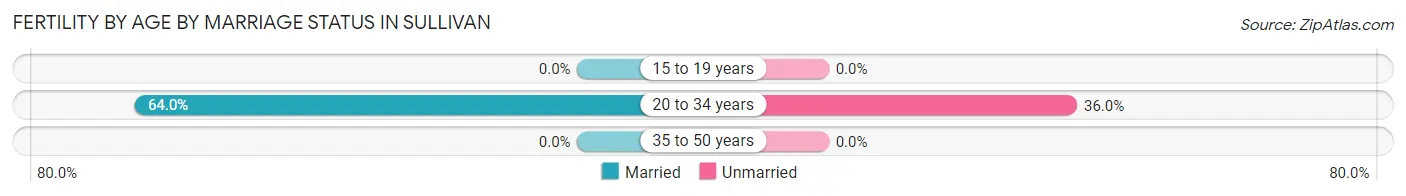
| Age Bracket | Married | Unmarried |
| 15 to 19 years | 0 (0.0%) | 0 (0.0%) |
| 20 to 34 years | 16 (64.0%) | 9 (36.0%) |
| 35 to 50 years | 0 (0.0%) | 0 (0.0%) |
| Total | 16 (64.0%) | 9 (36.0%) |
Fertility by Education in Sullivan
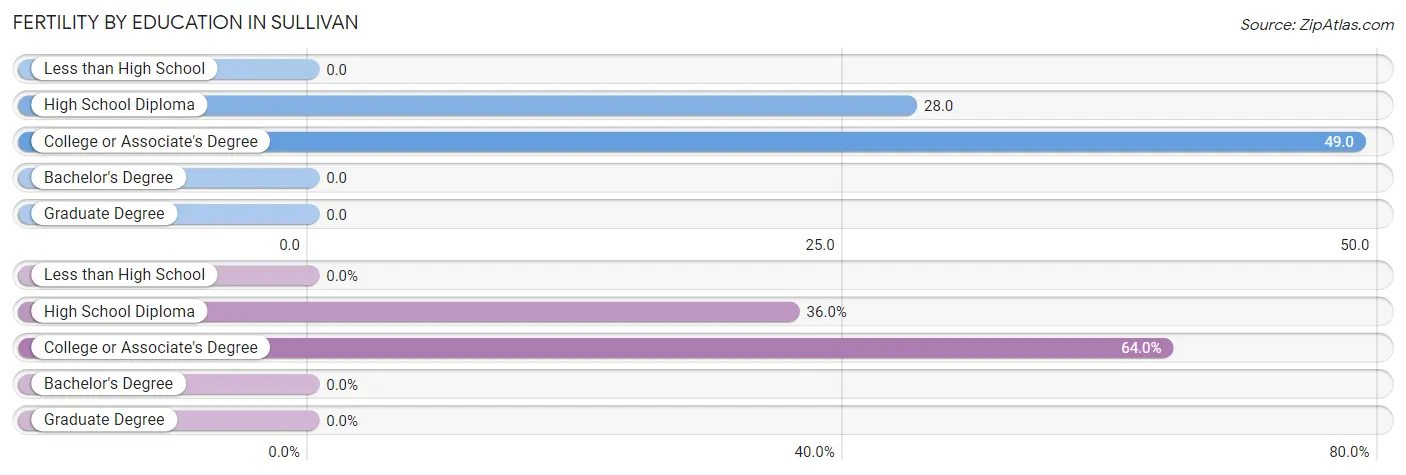
| Educational Attainment | Women with Births | Births / 1,000 Women |
| Less than High School | 0 (0.0%) | 0.0 |
| High School Diploma | 9 (36.0%) | 28.0 |
| College or Associate's Degree | 16 (64.0%) | 49.0 |
| Bachelor's Degree | 0 (0.0%) | 0.0 |
| Graduate Degree | 0 (0.0%) | 0.0 |
| Total | 25 (100.0%) | 26.0 |
Fertility by Education by Marriage Status in Sullivan
36.0% of women with births in Sullivan are unmarried. Women with the educational attainment of college or associate's degree are most likely to be married with 100.0% of them married at childbirth, while women with the educational attainment of high school diploma are least likely to be married with 100.0% of them unmarried at childbirth.
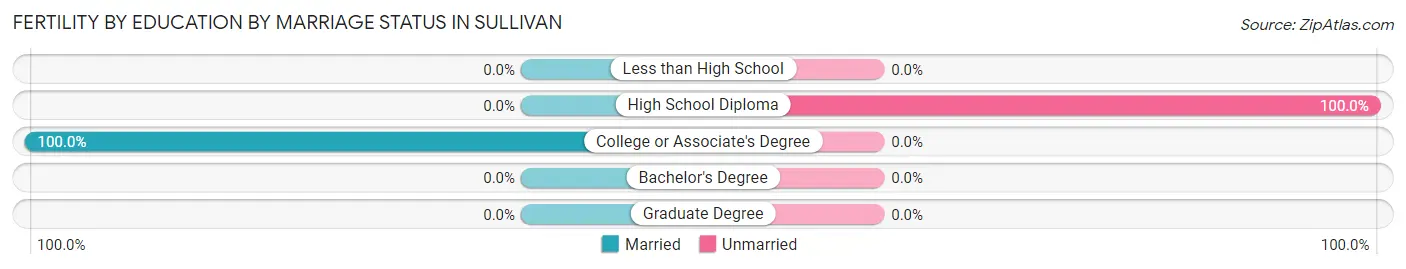
| Educational Attainment | Married | Unmarried |
| Less than High School | 0 (0.0%) | 0 (0.0%) |
| High School Diploma | 0 (0.0%) | 9 (100.0%) |
| College or Associate's Degree | 16 (100.0%) | 0 (0.0%) |
| Bachelor's Degree | 0 (0.0%) | 0 (0.0%) |
| Graduate Degree | 0 (0.0%) | 0 (0.0%) |
| Total | 16 (64.0%) | 9 (36.0%) |
Employment Characteristics in Sullivan
Employment by Class of Employer in Sullivan
Among the 1,966 employed individuals in Sullivan, private company employees (1,337 | 68.0%), not-for-profit organizations (248 | 12.6%), and local government employees (158 | 8.0%) make up the most common classes of employment.
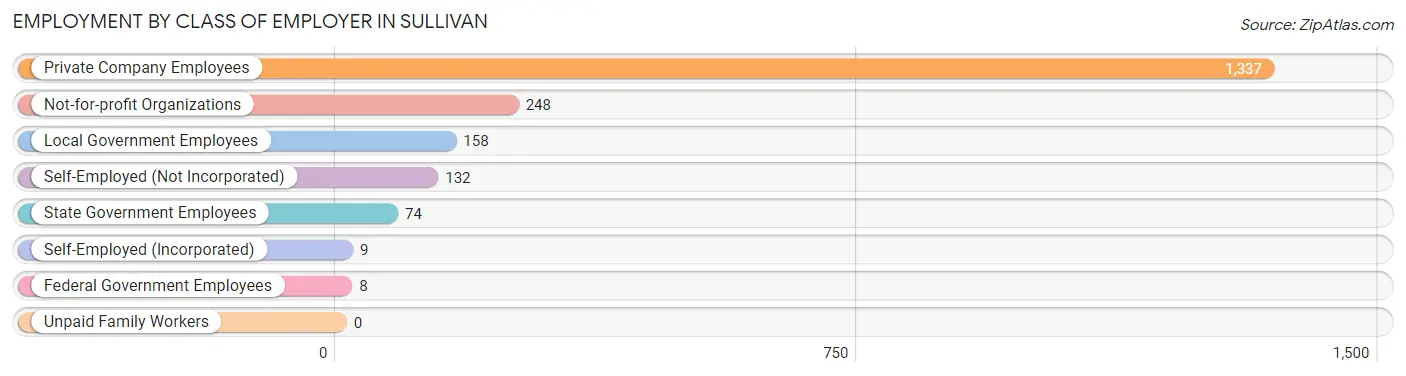
| Employer Class | # Employees | % Employees |
| Private Company Employees | 1,337 | 68.0% |
| Self-Employed (Incorporated) | 9 | 0.5% |
| Self-Employed (Not Incorporated) | 132 | 6.7% |
| Not-for-profit Organizations | 248 | 12.6% |
| Local Government Employees | 158 | 8.0% |
| State Government Employees | 74 | 3.8% |
| Federal Government Employees | 8 | 0.4% |
| Unpaid Family Workers | 0 | 0.0% |
| Total | 1,966 | 100.0% |
Employment Status by Age in Sullivan
According to the labor force statistics for Sullivan, out of the total population over 16 years of age (3,473), 60.4% or 2,098 individuals are in the labor force, with 5.6% or 117 of them unemployed. The age group with the highest labor force participation rate is 30 to 34 years, with 96.8% or 275 individuals in the labor force. Within the labor force, the 20 to 24 years age range has the highest percentage of unemployed individuals, with 17.8% or 21 of them being unemployed.
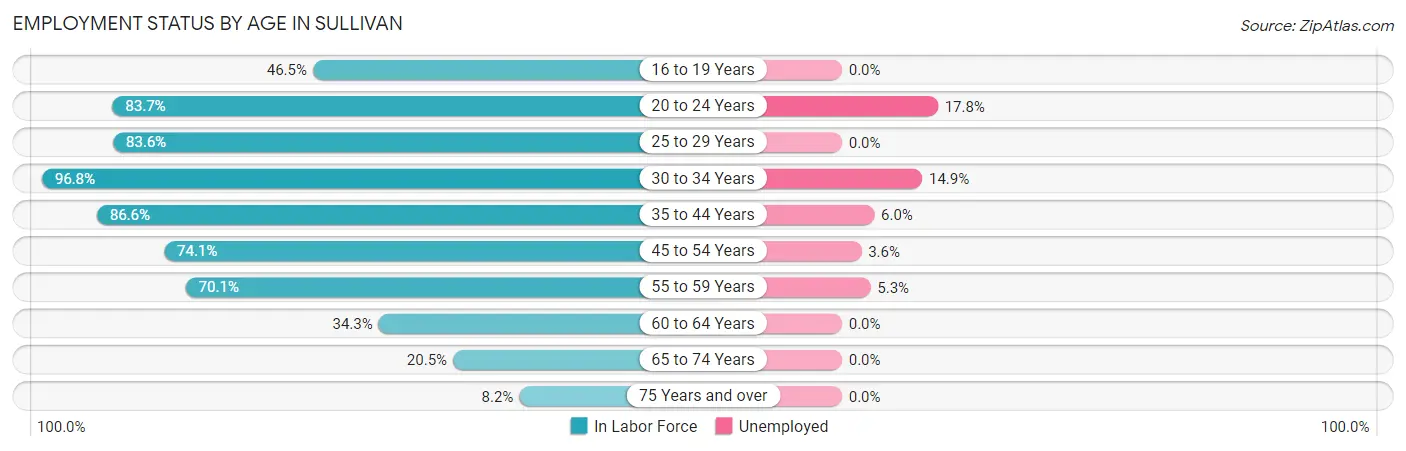
| Age Bracket | In Labor Force | Unemployed |
| 16 to 19 Years | 134 (46.5%) | 0 (0.0%) |
| 20 to 24 Years | 118 (83.7%) | 21 (17.8%) |
| 25 to 29 Years | 276 (83.6%) | 0 (0.0%) |
| 30 to 34 Years | 275 (96.8%) | 41 (14.9%) |
| 35 to 44 Years | 531 (86.6%) | 32 (6.0%) |
| 45 to 54 Years | 332 (74.1%) | 12 (3.6%) |
| 55 to 59 Years | 227 (70.1%) | 12 (5.3%) |
| 60 to 64 Years | 79 (34.3%) | 0 (0.0%) |
| 65 to 74 Years | 99 (20.5%) | 0 (0.0%) |
| 75 Years and over | 27 (8.2%) | 0 (0.0%) |
| Total | 2,098 (60.4%) | 117 (5.6%) |
Employment Status by Educational Attainment in Sullivan
According to labor force statistics for Sullivan, 77.2% of individuals (1,721) out of the total population between 25 and 64 years of age (2,229) are in the labor force, with 5.6% or 96 of them being unemployed. The group with the highest labor force participation rate are those with the educational attainment of bachelor's degree or higher, with 86.2% or 405 individuals in the labor force. Within the labor force, individuals with less than high school education have the highest percentage of unemployment, with 26.7% or 12 of them being unemployed.
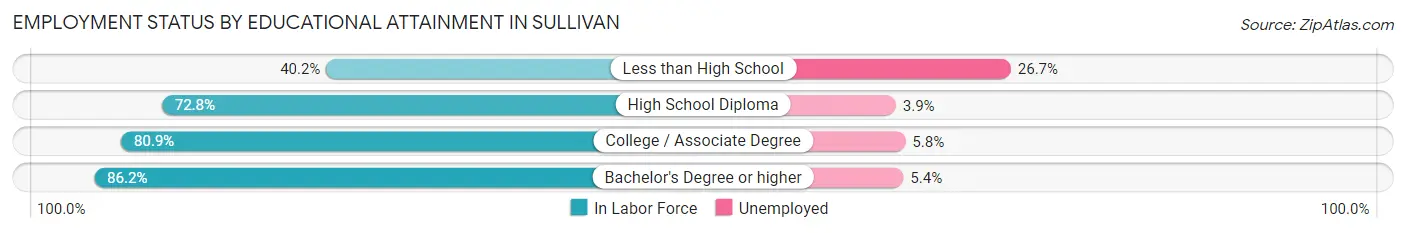
| Educational Attainment | In Labor Force | Unemployed |
| Less than High School | 45 (40.2%) | 30 (26.7%) |
| High School Diploma | 565 (72.8%) | 30 (3.9%) |
| College / Associate Degree | 705 (80.9%) | 51 (5.8%) |
| Bachelor's Degree or higher | 405 (86.2%) | 25 (5.4%) |
| Total | 1,721 (77.2%) | 125 (5.6%) |
Employment Occupations by Sex in Sullivan
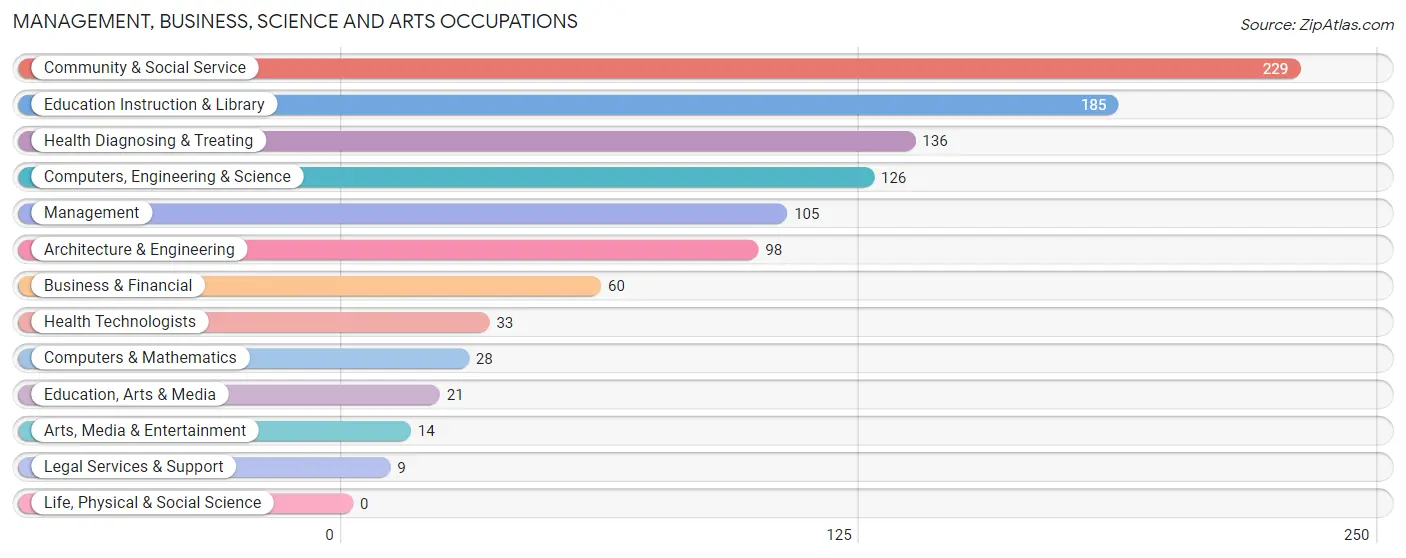
Management, Business, Science and Arts Occupations
The most common Management, Business, Science and Arts occupations in Sullivan are Community & Social Service (229 | 11.6%), Education Instruction & Library (185 | 9.3%), Health Diagnosing & Treating (136 | 6.9%), Computers, Engineering & Science (126 | 6.4%), and Management (105 | 5.3%).
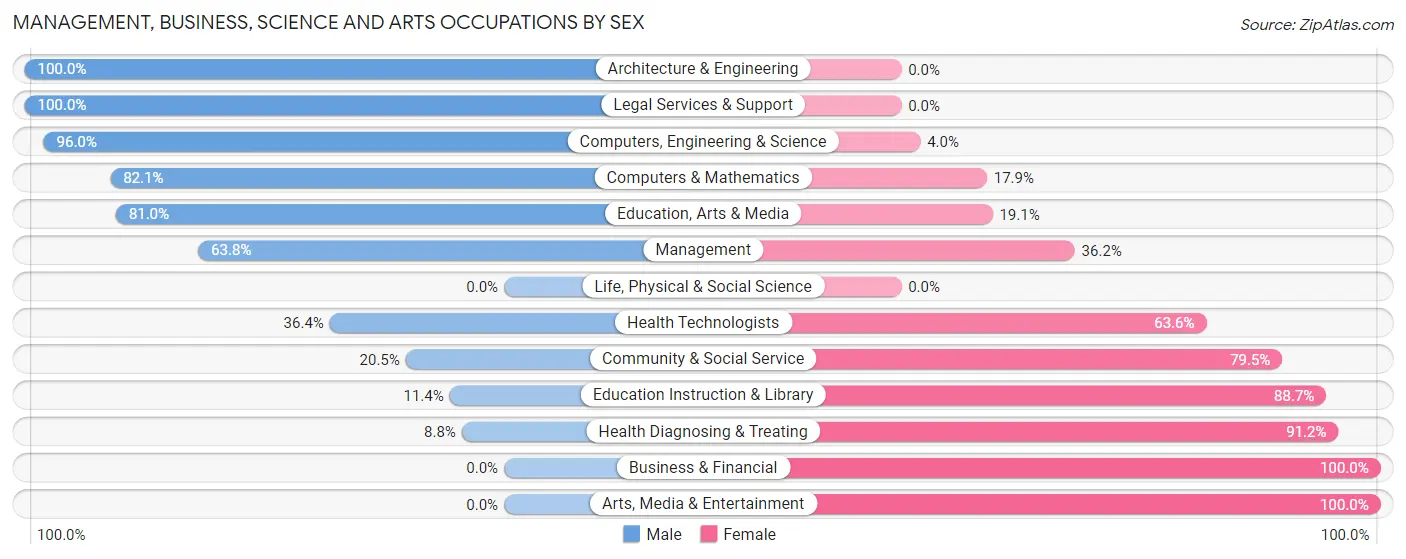
Management, Business, Science and Arts Occupations by Sex
Within the Management, Business, Science and Arts occupations in Sullivan, the most male-oriented occupations are Architecture & Engineering (100.0%), Legal Services & Support (100.0%), and Computers, Engineering & Science (96.0%), while the most female-oriented occupations are Business & Financial (100.0%), Arts, Media & Entertainment (100.0%), and Health Diagnosing & Treating (91.2%).
| Occupation | Male | Female |
| Management | 67 (63.8%) | 38 (36.2%) |
| Business & Financial | 0 (0.0%) | 60 (100.0%) |
| Computers, Engineering & Science | 121 (96.0%) | 5 (4.0%) |
| Computers & Mathematics | 23 (82.1%) | 5 (17.9%) |
| Architecture & Engineering | 98 (100.0%) | 0 (0.0%) |
| Life, Physical & Social Science | 0 (0.0%) | 0 (0.0%) |
| Community & Social Service | 47 (20.5%) | 182 (79.5%) |
| Education, Arts & Media | 17 (80.9%) | 4 (19.1%) |
| Legal Services & Support | 9 (100.0%) | 0 (0.0%) |
| Education Instruction & Library | 21 (11.4%) | 164 (88.6%) |
| Arts, Media & Entertainment | 0 (0.0%) | 14 (100.0%) |
| Health Diagnosing & Treating | 12 (8.8%) | 124 (91.2%) |
| Health Technologists | 12 (36.4%) | 21 (63.6%) |
| Total (Category) | 247 (37.7%) | 409 (62.4%) |
| Total (Overall) | 988 (49.9%) | 992 (50.1%) |
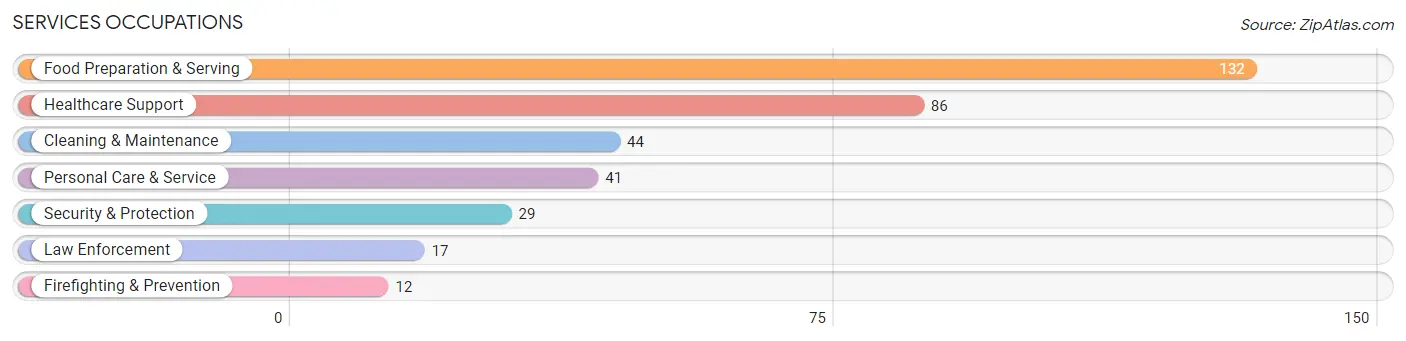
Services Occupations
The most common Services occupations in Sullivan are Food Preparation & Serving (132 | 6.7%), Healthcare Support (86 | 4.3%), Cleaning & Maintenance (44 | 2.2%), Personal Care & Service (41 | 2.1%), and Security & Protection (29 | 1.5%).
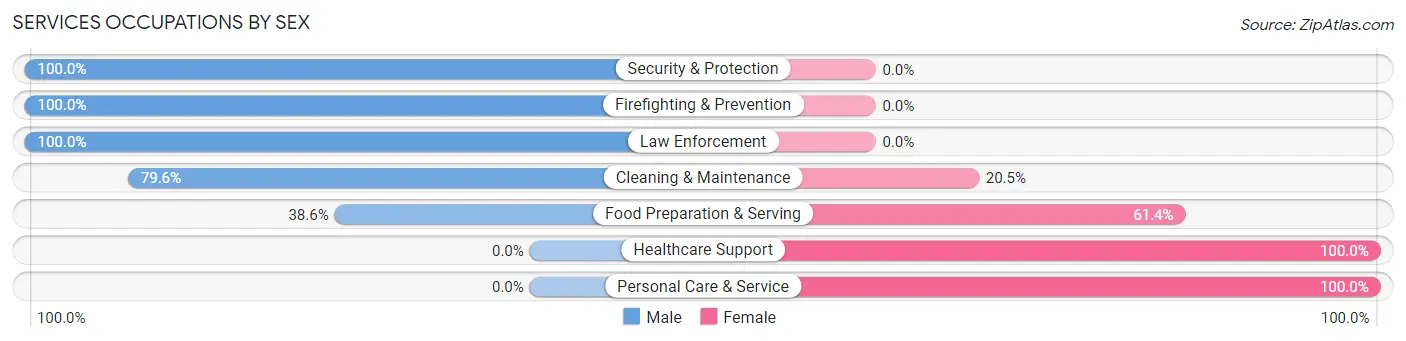
Services Occupations by Sex
Within the Services occupations in Sullivan, the most male-oriented occupations are Security & Protection (100.0%), Firefighting & Prevention (100.0%), and Law Enforcement (100.0%), while the most female-oriented occupations are Healthcare Support (100.0%), Personal Care & Service (100.0%), and Food Preparation & Serving (61.4%).
| Occupation | Male | Female |
| Healthcare Support | 0 (0.0%) | 86 (100.0%) |
| Security & Protection | 29 (100.0%) | 0 (0.0%) |
| Firefighting & Prevention | 12 (100.0%) | 0 (0.0%) |
| Law Enforcement | 17 (100.0%) | 0 (0.0%) |
| Food Preparation & Serving | 51 (38.6%) | 81 (61.4%) |
| Cleaning & Maintenance | 35 (79.5%) | 9 (20.4%) |
| Personal Care & Service | 0 (0.0%) | 41 (100.0%) |
| Total (Category) | 115 (34.6%) | 217 (65.4%) |
| Total (Overall) | 988 (49.9%) | 992 (50.1%) |
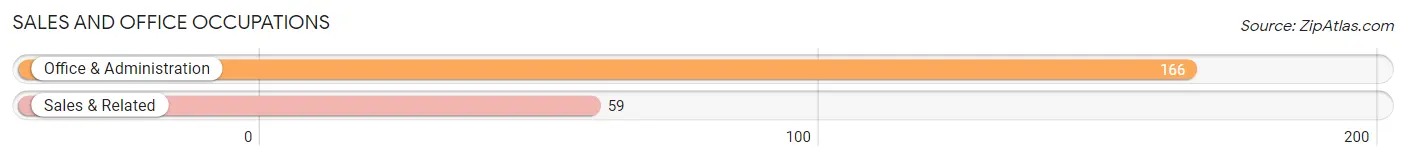
Sales and Office Occupations
The most common Sales and Office occupations in Sullivan are Office & Administration (166 | 8.4%), and Sales & Related (59 | 3.0%).
Sales and Office Occupations by Sex
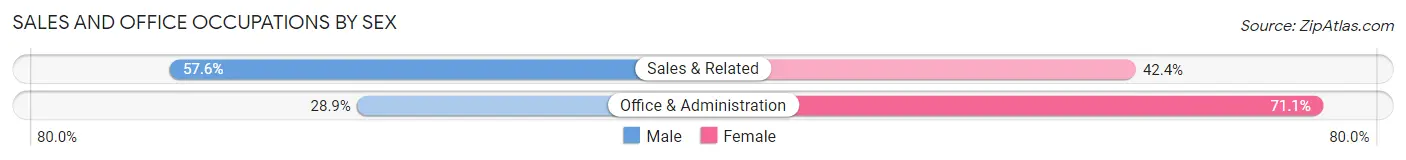
| Occupation | Male | Female |
| Sales & Related | 34 (57.6%) | 25 (42.4%) |
| Office & Administration | 48 (28.9%) | 118 (71.1%) |
| Total (Category) | 82 (36.4%) | 143 (63.6%) |
| Total (Overall) | 988 (49.9%) | 992 (50.1%) |
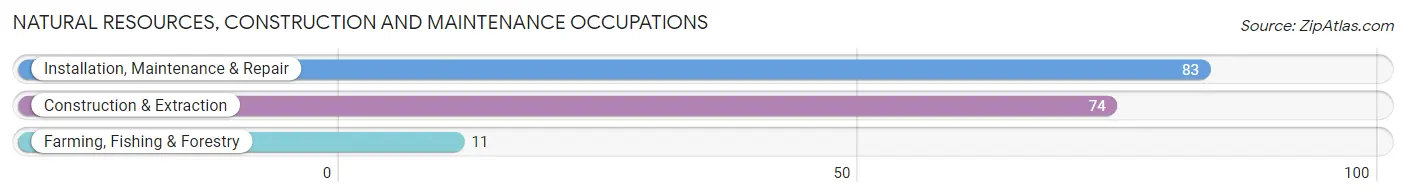
Natural Resources, Construction and Maintenance Occupations
The most common Natural Resources, Construction and Maintenance occupations in Sullivan are Installation, Maintenance & Repair (83 | 4.2%), Construction & Extraction (74 | 3.7%), and Farming, Fishing & Forestry (11 | 0.6%).
Natural Resources, Construction and Maintenance Occupations by Sex
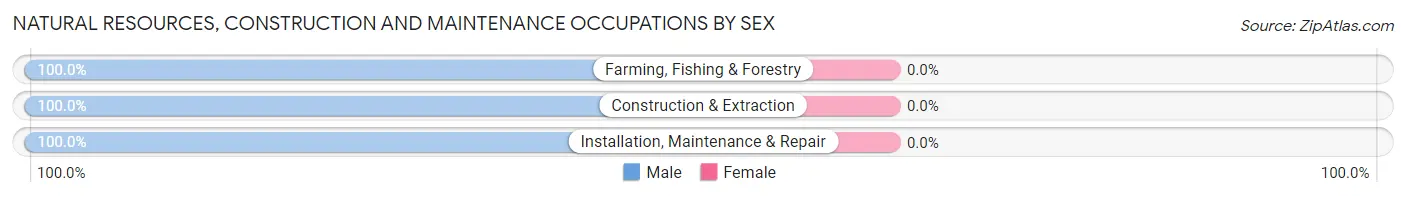
| Occupation | Male | Female |
| Farming, Fishing & Forestry | 11 (100.0%) | 0 (0.0%) |
| Construction & Extraction | 74 (100.0%) | 0 (0.0%) |
| Installation, Maintenance & Repair | 83 (100.0%) | 0 (0.0%) |
| Total (Category) | 168 (100.0%) | 0 (0.0%) |
| Total (Overall) | 988 (49.9%) | 992 (50.1%) |
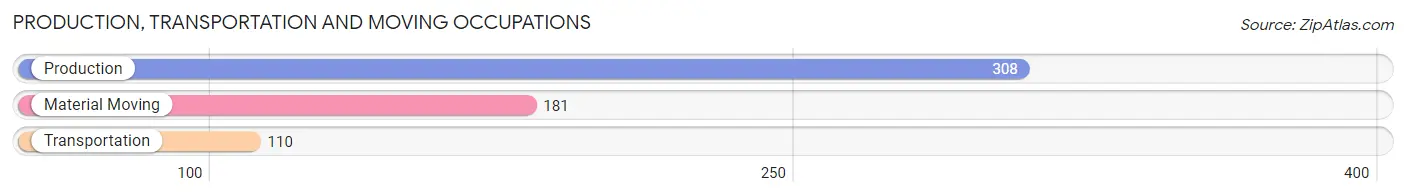
Production, Transportation and Moving Occupations
The most common Production, Transportation and Moving occupations in Sullivan are Production (308 | 15.6%), Material Moving (181 | 9.1%), and Transportation (110 | 5.6%).
Production, Transportation and Moving Occupations by Sex
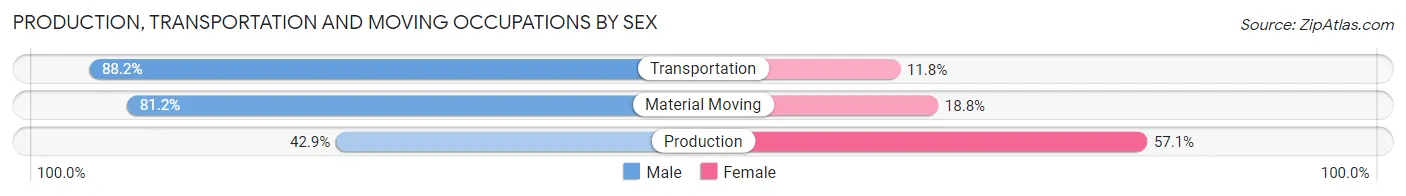
| Occupation | Male | Female |
| Production | 132 (42.9%) | 176 (57.1%) |
| Transportation | 97 (88.2%) | 13 (11.8%) |
| Material Moving | 147 (81.2%) | 34 (18.8%) |
| Total (Category) | 376 (62.8%) | 223 (37.2%) |
| Total (Overall) | 988 (49.9%) | 992 (50.1%) |
Employment Industries by Sex in Sullivan
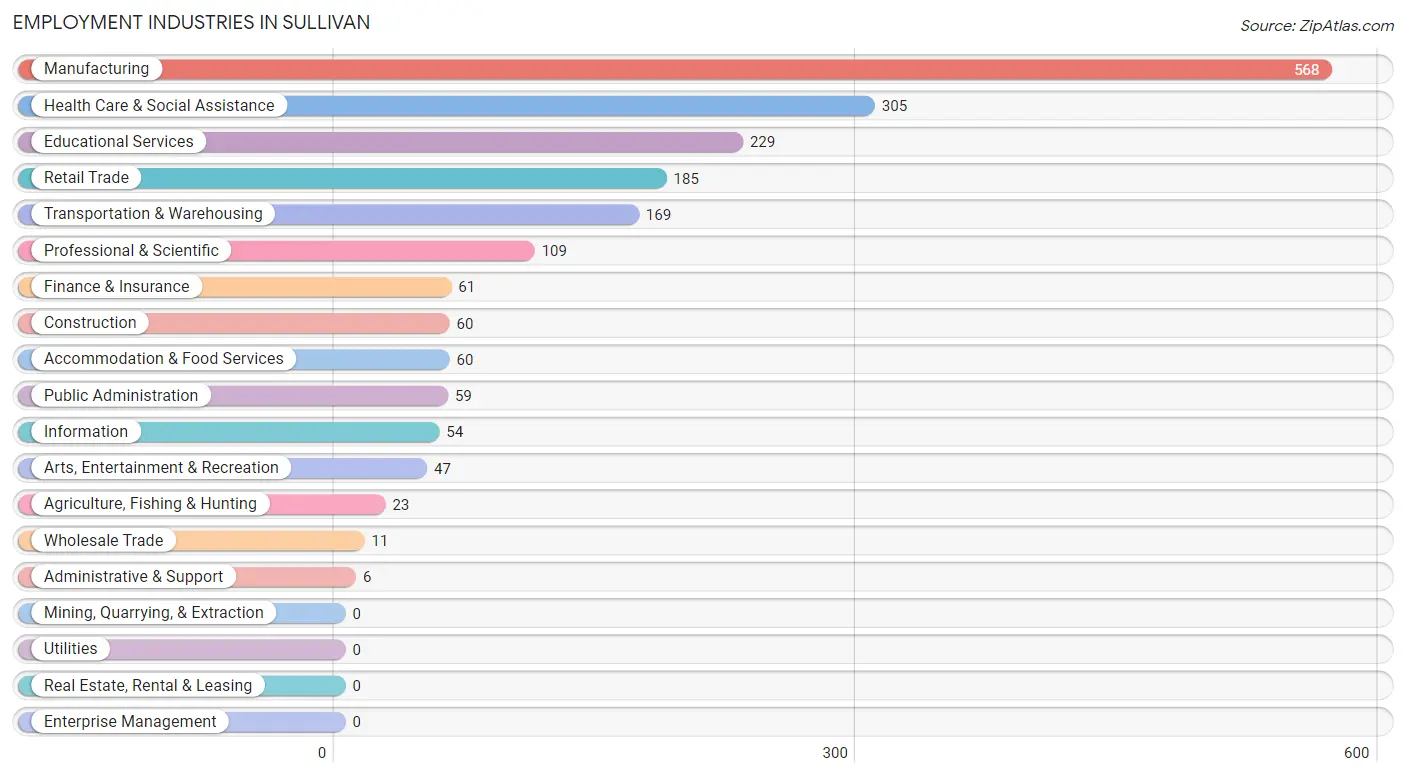
Employment Industries in Sullivan
The major employment industries in Sullivan include Manufacturing (568 | 28.7%), Health Care & Social Assistance (305 | 15.4%), Educational Services (229 | 11.6%), Retail Trade (185 | 9.3%), and Transportation & Warehousing (169 | 8.5%).
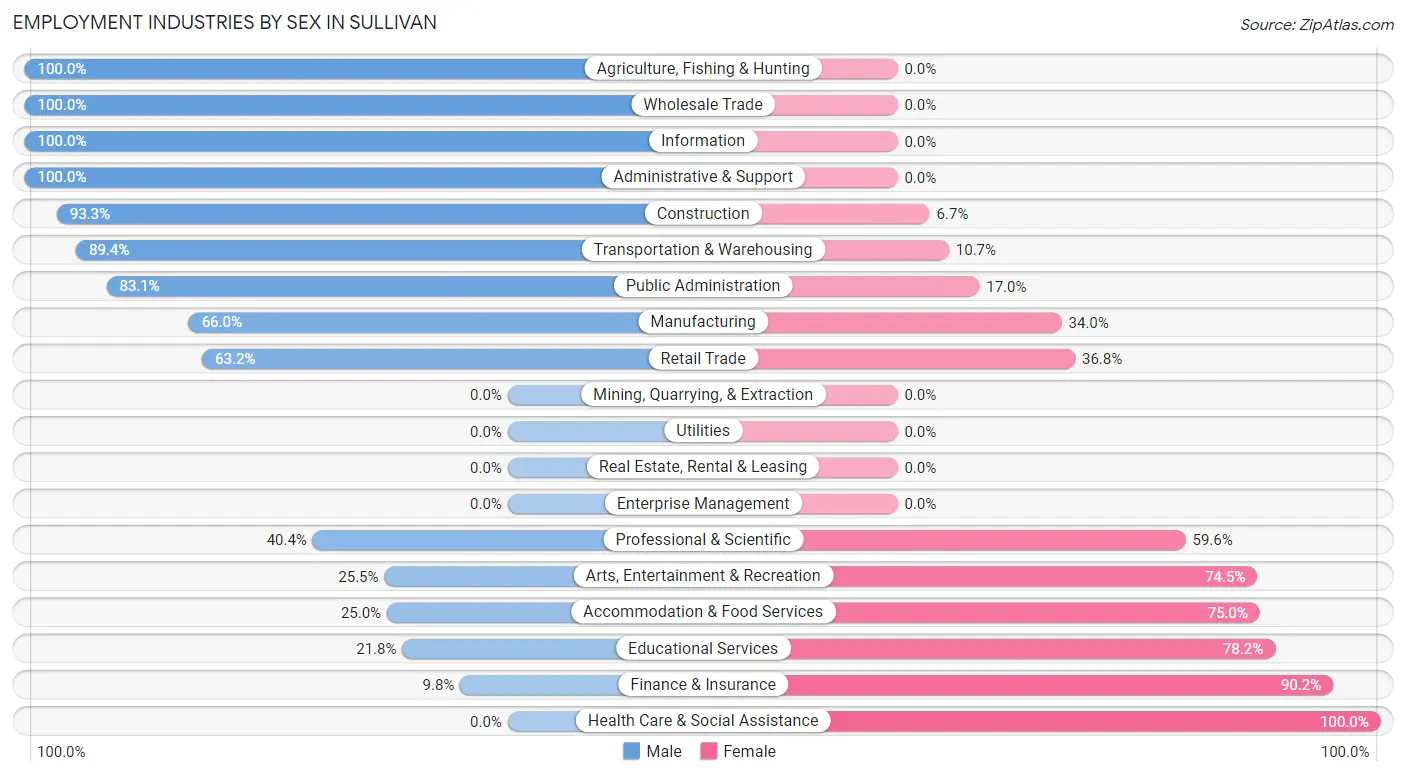
Employment Industries by Sex in Sullivan
The Sullivan industries that see more men than women are Agriculture, Fishing & Hunting (100.0%), Wholesale Trade (100.0%), and Information (100.0%), whereas the industries that tend to have a higher number of women are Health Care & Social Assistance (100.0%), Finance & Insurance (90.2%), and Educational Services (78.2%).
| Industry | Male | Female |
| Agriculture, Fishing & Hunting | 23 (100.0%) | 0 (0.0%) |
| Mining, Quarrying, & Extraction | 0 (0.0%) | 0 (0.0%) |
| Construction | 56 (93.3%) | 4 (6.7%) |
| Manufacturing | 375 (66.0%) | 193 (34.0%) |
| Wholesale Trade | 11 (100.0%) | 0 (0.0%) |
| Retail Trade | 117 (63.2%) | 68 (36.8%) |
| Transportation & Warehousing | 151 (89.3%) | 18 (10.6%) |
| Utilities | 0 (0.0%) | 0 (0.0%) |
| Information | 54 (100.0%) | 0 (0.0%) |
| Finance & Insurance | 6 (9.8%) | 55 (90.2%) |
| Real Estate, Rental & Leasing | 0 (0.0%) | 0 (0.0%) |
| Professional & Scientific | 44 (40.4%) | 65 (59.6%) |
| Enterprise Management | 0 (0.0%) | 0 (0.0%) |
| Administrative & Support | 6 (100.0%) | 0 (0.0%) |
| Educational Services | 50 (21.8%) | 179 (78.2%) |
| Health Care & Social Assistance | 0 (0.0%) | 305 (100.0%) |
| Arts, Entertainment & Recreation | 12 (25.5%) | 35 (74.5%) |
| Accommodation & Food Services | 15 (25.0%) | 45 (75.0%) |
| Public Administration | 49 (83.1%) | 10 (17.0%) |
| Total | 988 (49.9%) | 992 (50.1%) |
Education in Sullivan
School Enrollment in Sullivan
The most common levels of schooling among the 1,115 students in Sullivan are middle school (360 | 32.3%), elementary school (267 | 23.9%), and high school (242 | 21.7%).
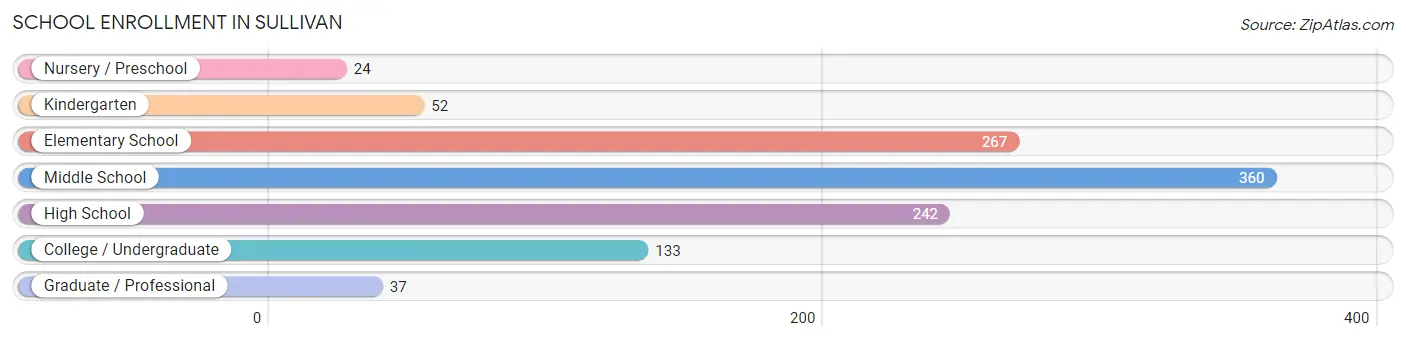
| School Level | # Students | % Students |
| Nursery / Preschool | 24 | 2.1% |
| Kindergarten | 52 | 4.7% |
| Elementary School | 267 | 23.9% |
| Middle School | 360 | 32.3% |
| High School | 242 | 21.7% |
| College / Undergraduate | 133 | 11.9% |
| Graduate / Professional | 37 | 3.3% |
| Total | 1,115 | 100.0% |
School Enrollment by Age by Funding Source in Sullivan
Out of a total of 1,115 students who are enrolled in schools in Sullivan, 112 (10.0%) attend a private institution, while the remaining 1,004 (90.0%) are enrolled in public schools. The age group of 15 to 17 year olds has the highest likelihood of being enrolled in private schools, with 81 (47.6% in the age bracket) enrolled. Conversely, the age group of 3 to 4 year olds has the lowest likelihood of being enrolled in a private school, with 14 (100.0% in the age bracket) attending a public institution.
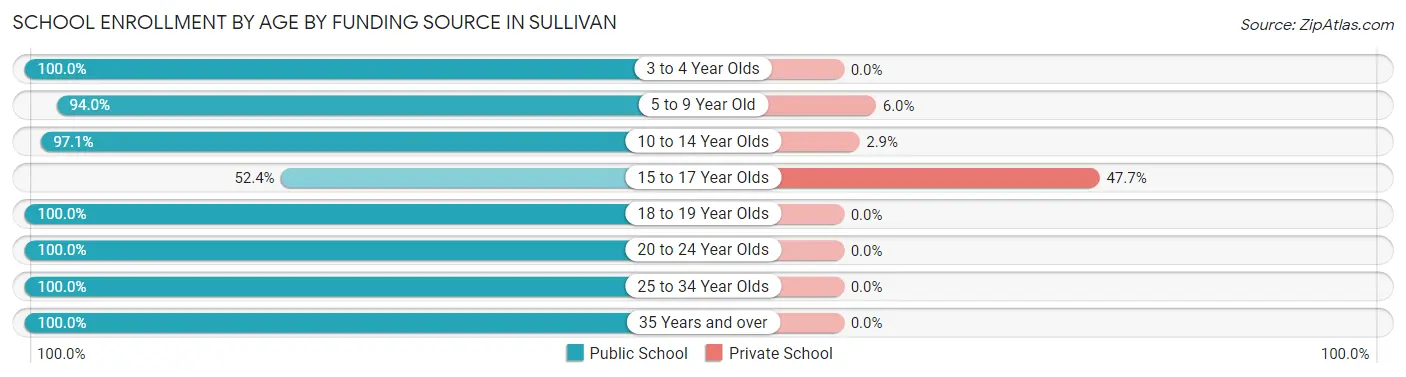
| Age Bracket | Public School | Private School |
| 3 to 4 Year Olds | 14 (100.0%) | 0 (0.0%) |
| 5 to 9 Year Old | 283 (94.0%) | 18 (6.0%) |
| 10 to 14 Year Olds | 400 (97.1%) | 12 (2.9%) |
| 15 to 17 Year Olds | 89 (52.3%) | 81 (47.6%) |
| 18 to 19 Year Olds | 62 (100.0%) | 0 (0.0%) |
| 20 to 24 Year Olds | 27 (100.0%) | 0 (0.0%) |
| 25 to 34 Year Olds | 75 (100.0%) | 0 (0.0%) |
| 35 Years and over | 54 (100.0%) | 0 (0.0%) |
| Total | 1,004 (90.0%) | 112 (10.0%) |
Educational Attainment by Field of Study in Sullivan
Education (174 | 25.8%), business (110 | 16.3%), arts & humanities (87 | 12.9%), science & technology (73 | 10.8%), and social sciences (40 | 5.9%) are the most common fields of study among 675 individuals in Sullivan who have obtained a bachelor's degree or higher.
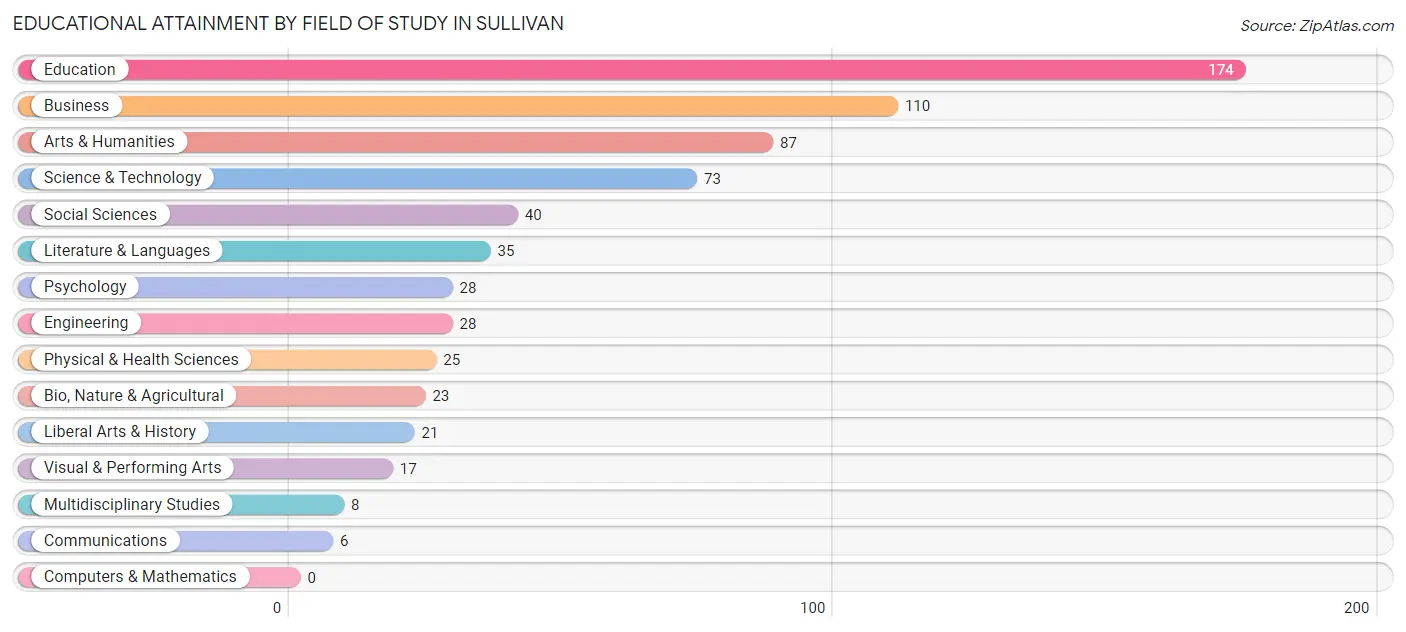
| Field of Study | # Graduates | % Graduates |
| Computers & Mathematics | 0 | 0.0% |
| Bio, Nature & Agricultural | 23 | 3.4% |
| Physical & Health Sciences | 25 | 3.7% |
| Psychology | 28 | 4.2% |
| Social Sciences | 40 | 5.9% |
| Engineering | 28 | 4.2% |
| Multidisciplinary Studies | 8 | 1.2% |
| Science & Technology | 73 | 10.8% |
| Business | 110 | 16.3% |
| Education | 174 | 25.8% |
| Literature & Languages | 35 | 5.2% |
| Liberal Arts & History | 21 | 3.1% |
| Visual & Performing Arts | 17 | 2.5% |
| Communications | 6 | 0.9% |
| Arts & Humanities | 87 | 12.9% |
| Total | 675 | 100.0% |
Transportation & Commute in Sullivan
Vehicle Availability by Sex in Sullivan
The most prevalent vehicle ownership categories in Sullivan are males with 2 vehicles (477, accounting for 50.2%) and females with 2 vehicles (529, making up 48.1%).
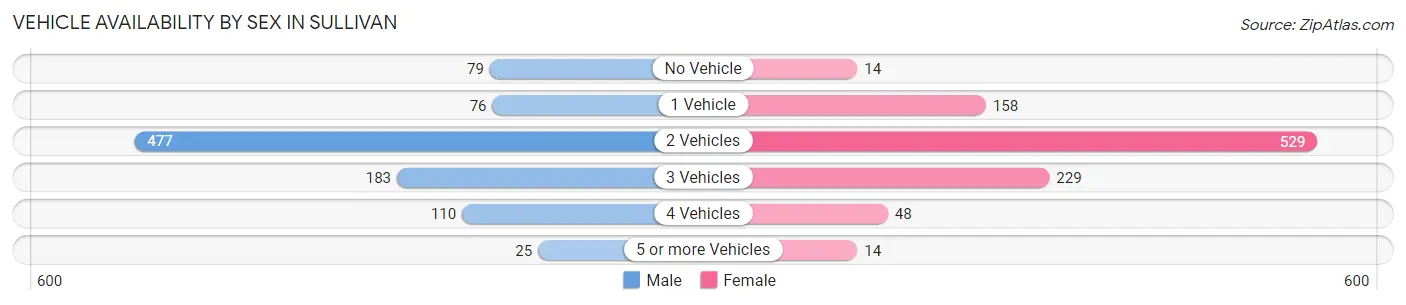
| Vehicles Available | Male | Female |
| No Vehicle | 79 (8.3%) | 14 (1.4%) |
| 1 Vehicle | 76 (8.0%) | 158 (15.9%) |
| 2 Vehicles | 477 (50.2%) | 529 (53.3%) |
| 3 Vehicles | 183 (19.3%) | 229 (23.1%) |
| 4 Vehicles | 110 (11.6%) | 48 (4.8%) |
| 5 or more Vehicles | 25 (2.6%) | 14 (1.4%) |
| Total | 950 (100.0%) | 992 (100.0%) |
Commute Time in Sullivan
The most frequently occuring commute durations in Sullivan are 5 to 9 minutes (635 commuters, 33.7%), less than 5 minutes (267 commuters, 14.1%), and 30 to 34 minutes (209 commuters, 11.1%).
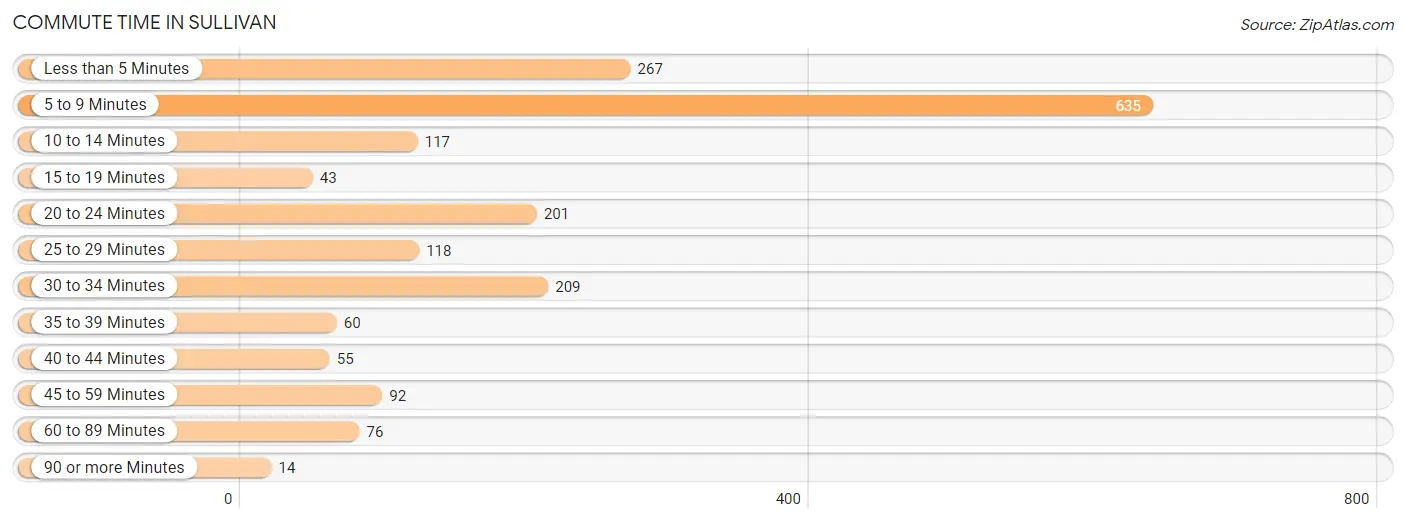
| Commute Time | # Commuters | % Commuters |
| Less than 5 Minutes | 267 | 14.1% |
| 5 to 9 Minutes | 635 | 33.7% |
| 10 to 14 Minutes | 117 | 6.2% |
| 15 to 19 Minutes | 43 | 2.3% |
| 20 to 24 Minutes | 201 | 10.6% |
| 25 to 29 Minutes | 118 | 6.2% |
| 30 to 34 Minutes | 209 | 11.1% |
| 35 to 39 Minutes | 60 | 3.2% |
| 40 to 44 Minutes | 55 | 2.9% |
| 45 to 59 Minutes | 92 | 4.9% |
| 60 to 89 Minutes | 76 | 4.0% |
| 90 or more Minutes | 14 | 0.7% |
Commute Time by Sex in Sullivan
The most common commute times in Sullivan are 5 to 9 minutes (256 commuters, 27.3%) for males and 5 to 9 minutes (379 commuters, 40.0%) for females.
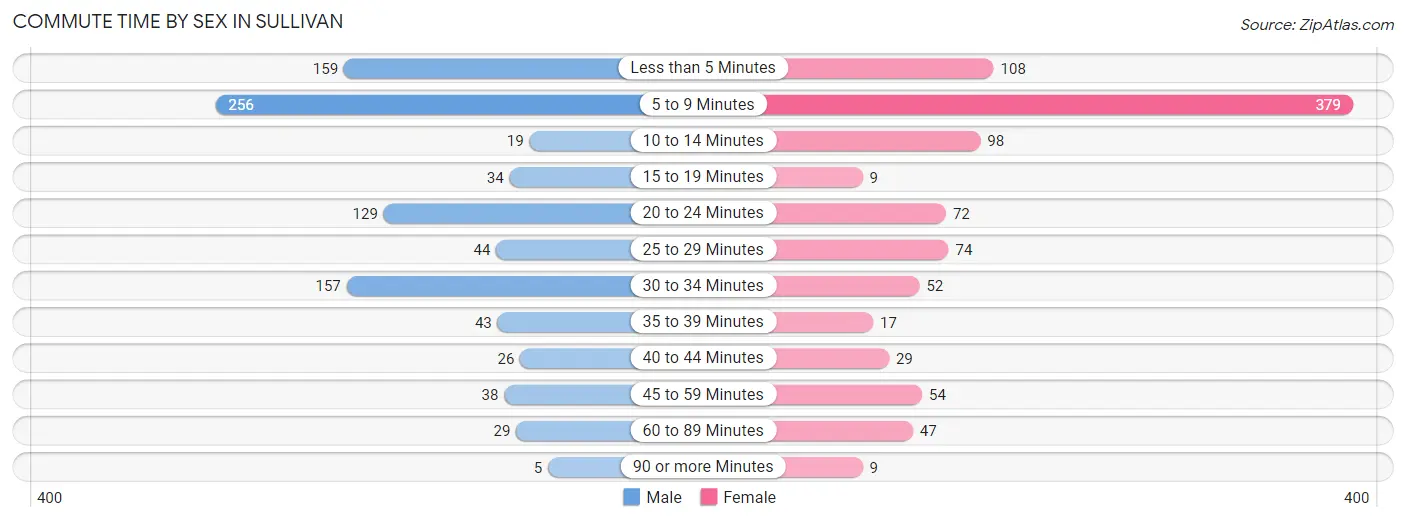
| Commute Time | Male | Female |
| Less than 5 Minutes | 159 (16.9%) | 108 (11.4%) |
| 5 to 9 Minutes | 256 (27.3%) | 379 (40.0%) |
| 10 to 14 Minutes | 19 (2.0%) | 98 (10.3%) |
| 15 to 19 Minutes | 34 (3.6%) | 9 (0.9%) |
| 20 to 24 Minutes | 129 (13.7%) | 72 (7.6%) |
| 25 to 29 Minutes | 44 (4.7%) | 74 (7.8%) |
| 30 to 34 Minutes | 157 (16.7%) | 52 (5.5%) |
| 35 to 39 Minutes | 43 (4.6%) | 17 (1.8%) |
| 40 to 44 Minutes | 26 (2.8%) | 29 (3.1%) |
| 45 to 59 Minutes | 38 (4.1%) | 54 (5.7%) |
| 60 to 89 Minutes | 29 (3.1%) | 47 (5.0%) |
| 90 or more Minutes | 5 (0.5%) | 9 (0.9%) |
Time of Departure to Work by Sex in Sullivan
The most frequent times of departure to work in Sullivan are 12:00 PM to 3:59 PM (138, 14.7%) for males and 7:30 AM to 7:59 AM (195, 20.6%) for females.
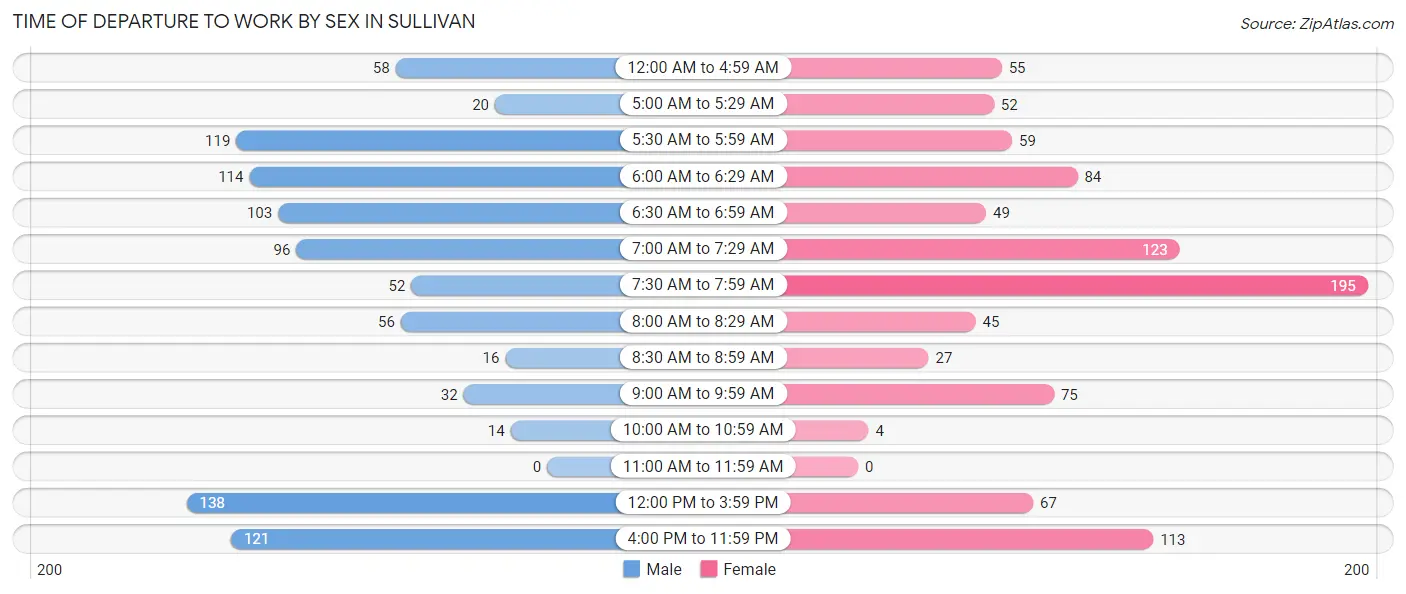
| Time of Departure | Male | Female |
| 12:00 AM to 4:59 AM | 58 (6.2%) | 55 (5.8%) |
| 5:00 AM to 5:29 AM | 20 (2.1%) | 52 (5.5%) |
| 5:30 AM to 5:59 AM | 119 (12.7%) | 59 (6.2%) |
| 6:00 AM to 6:29 AM | 114 (12.1%) | 84 (8.9%) |
| 6:30 AM to 6:59 AM | 103 (11.0%) | 49 (5.2%) |
| 7:00 AM to 7:29 AM | 96 (10.2%) | 123 (13.0%) |
| 7:30 AM to 7:59 AM | 52 (5.5%) | 195 (20.6%) |
| 8:00 AM to 8:29 AM | 56 (6.0%) | 45 (4.8%) |
| 8:30 AM to 8:59 AM | 16 (1.7%) | 27 (2.9%) |
| 9:00 AM to 9:59 AM | 32 (3.4%) | 75 (7.9%) |
| 10:00 AM to 10:59 AM | 14 (1.5%) | 4 (0.4%) |
| 11:00 AM to 11:59 AM | 0 (0.0%) | 0 (0.0%) |
| 12:00 PM to 3:59 PM | 138 (14.7%) | 67 (7.1%) |
| 4:00 PM to 11:59 PM | 121 (12.9%) | 113 (11.9%) |
| Total | 939 (100.0%) | 948 (100.0%) |
Housing Occupancy in Sullivan
Occupancy by Ownership in Sullivan
Of the total 1,803 dwellings in Sullivan, owner-occupied units account for 1,317 (73.0%), while renter-occupied units make up 486 (27.0%).
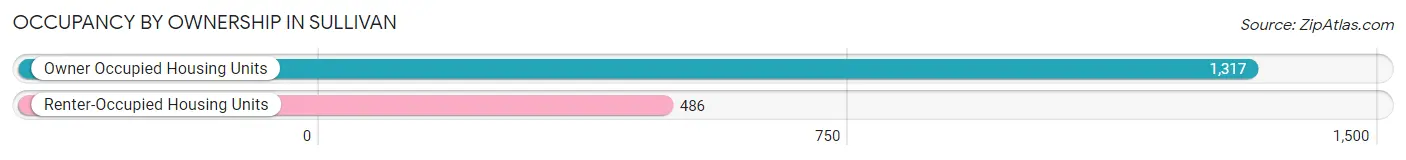
| Occupancy | # Housing Units | % Housing Units |
| Owner Occupied Housing Units | 1,317 | 73.0% |
| Renter-Occupied Housing Units | 486 | 27.0% |
| Total Occupied Housing Units | 1,803 | 100.0% |
Occupancy by Household Size in Sullivan
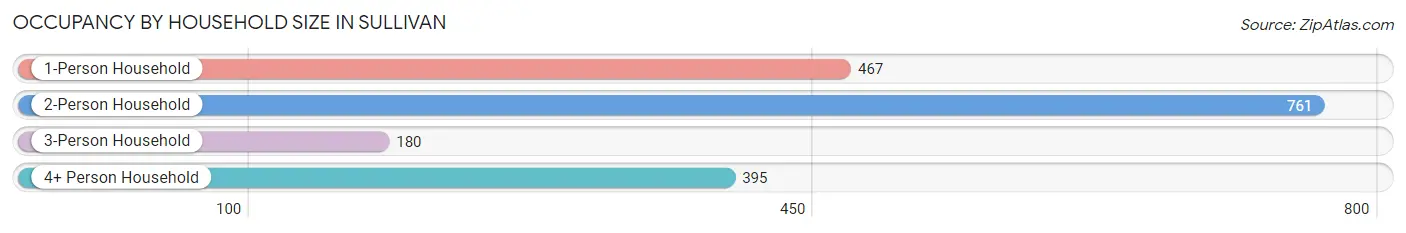
| Household Size | # Housing Units | % Housing Units |
| 1-Person Household | 467 | 25.9% |
| 2-Person Household | 761 | 42.2% |
| 3-Person Household | 180 | 10.0% |
| 4+ Person Household | 395 | 21.9% |
| Total Housing Units | 1,803 | 100.0% |
Occupancy by Ownership by Household Size in Sullivan
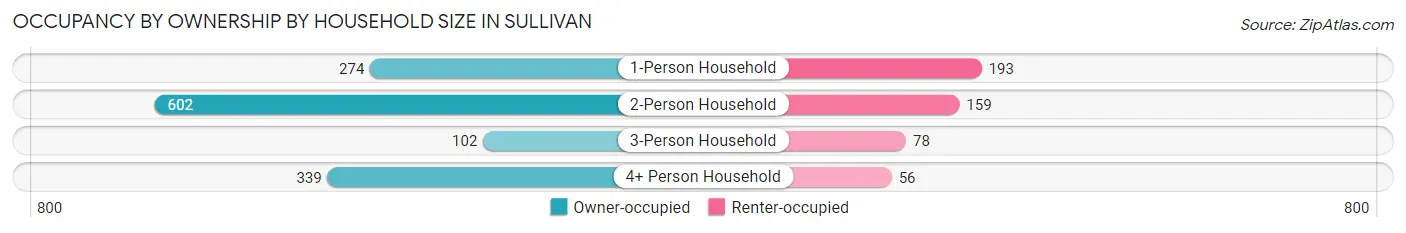
| Household Size | Owner-occupied | Renter-occupied |
| 1-Person Household | 274 (58.7%) | 193 (41.3%) |
| 2-Person Household | 602 (79.1%) | 159 (20.9%) |
| 3-Person Household | 102 (56.7%) | 78 (43.3%) |
| 4+ Person Household | 339 (85.8%) | 56 (14.2%) |
| Total Housing Units | 1,317 (73.0%) | 486 (27.0%) |
Occupancy by Educational Attainment in Sullivan
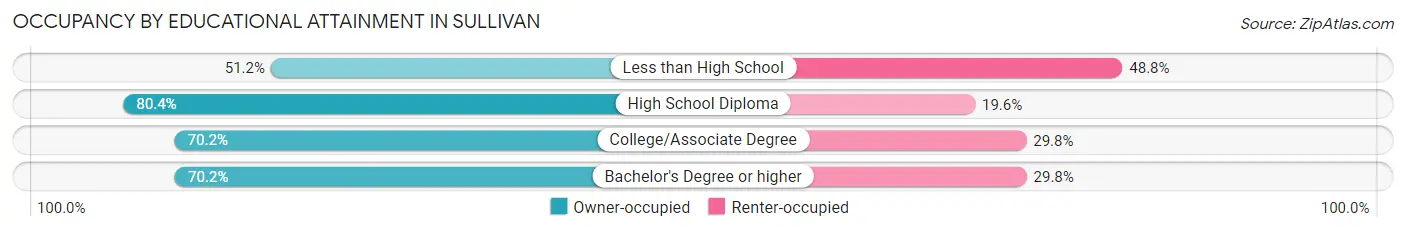
| Household Size | Owner-occupied | Renter-occupied |
| Less than High School | 43 (51.2%) | 41 (48.8%) |
| High School Diploma | 529 (80.4%) | 129 (19.6%) |
| College/Associate Degree | 491 (70.2%) | 208 (29.8%) |
| Bachelor's Degree or higher | 254 (70.2%) | 108 (29.8%) |
Occupancy by Age of Householder in Sullivan
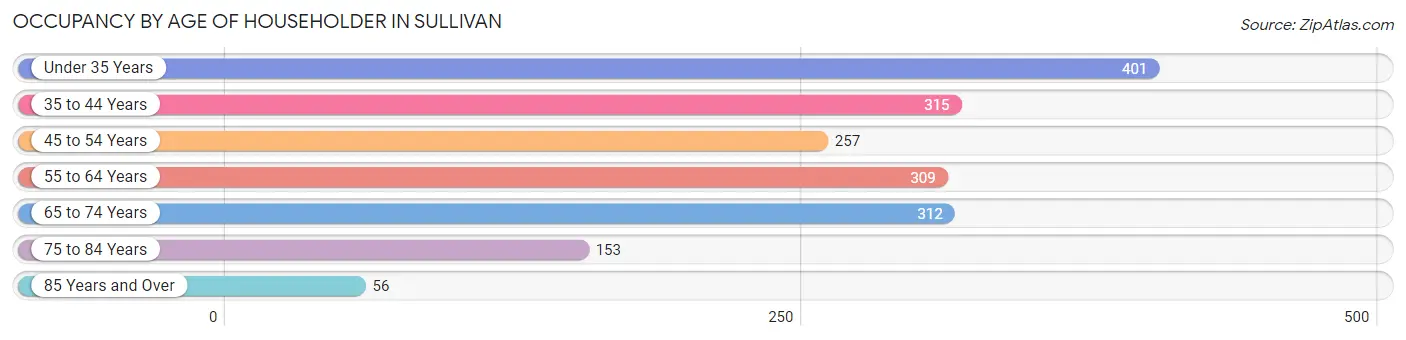
| Age Bracket | # Households | % Households |
| Under 35 Years | 401 | 22.2% |
| 35 to 44 Years | 315 | 17.5% |
| 45 to 54 Years | 257 | 14.2% |
| 55 to 64 Years | 309 | 17.1% |
| 65 to 74 Years | 312 | 17.3% |
| 75 to 84 Years | 153 | 8.5% |
| 85 Years and Over | 56 | 3.1% |
| Total | 1,803 | 100.0% |
Housing Finances in Sullivan
Median Income by Occupancy in Sullivan
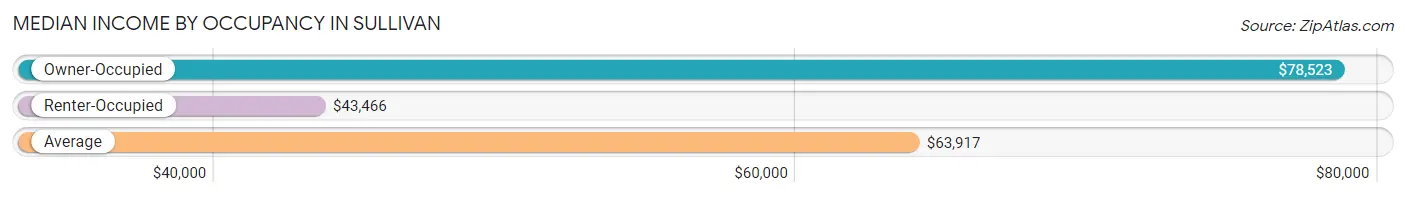
| Occupancy Type | # Households | Median Income |
| Owner-Occupied | 1,317 (73.0%) | $78,523 |
| Renter-Occupied | 486 (27.0%) | $43,466 |
| Average | 1,803 (100.0%) | $63,917 |
Occupancy by Householder Income Bracket in Sullivan
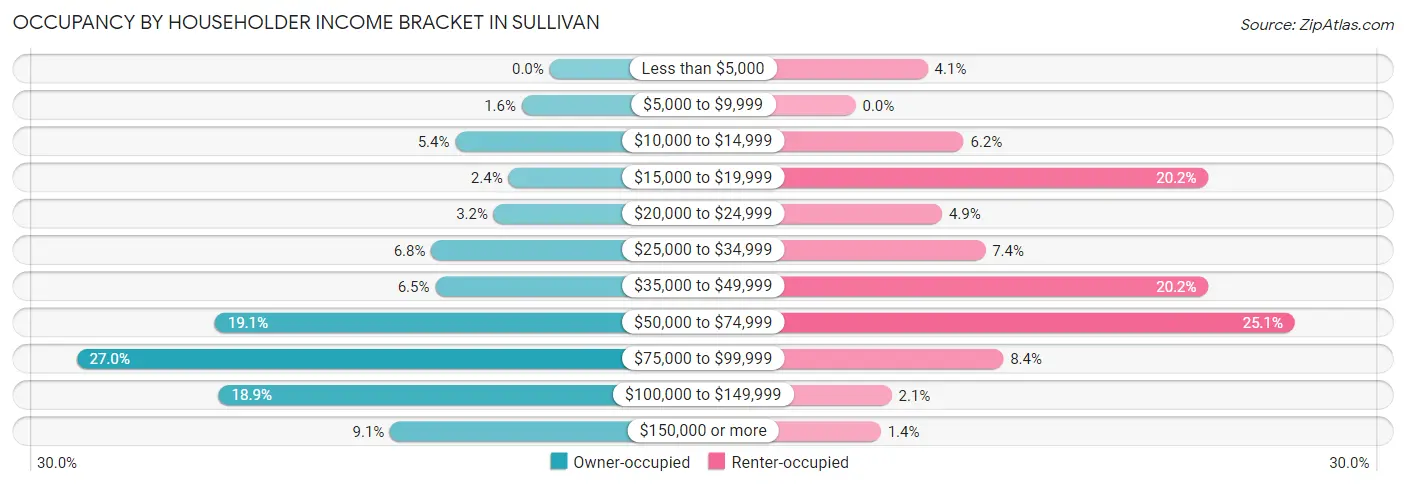
| Income Bracket | Owner-occupied | Renter-occupied |
| Less than $5,000 | 0 (0.0%) | 20 (4.1%) |
| $5,000 to $9,999 | 21 (1.6%) | 0 (0.0%) |
| $10,000 to $14,999 | 71 (5.4%) | 30 (6.2%) |
| $15,000 to $19,999 | 31 (2.4%) | 98 (20.2%) |
| $20,000 to $24,999 | 42 (3.2%) | 24 (4.9%) |
| $25,000 to $34,999 | 89 (6.8%) | 36 (7.4%) |
| $35,000 to $49,999 | 86 (6.5%) | 98 (20.2%) |
| $50,000 to $74,999 | 252 (19.1%) | 122 (25.1%) |
| $75,000 to $99,999 | 356 (27.0%) | 41 (8.4%) |
| $100,000 to $149,999 | 249 (18.9%) | 10 (2.1%) |
| $150,000 or more | 120 (9.1%) | 7 (1.4%) |
| Total | 1,317 (100.0%) | 486 (100.0%) |
Monthly Housing Cost Tiers in Sullivan
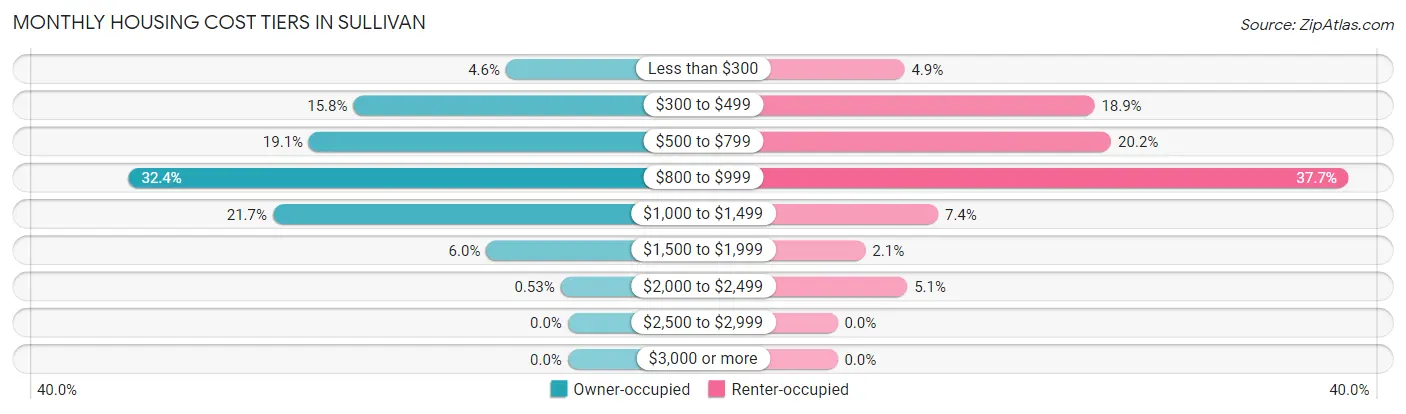
| Monthly Cost | Owner-occupied | Renter-occupied |
| Less than $300 | 60 (4.6%) | 24 (4.9%) |
| $300 to $499 | 208 (15.8%) | 92 (18.9%) |
| $500 to $799 | 251 (19.1%) | 98 (20.2%) |
| $800 to $999 | 426 (32.4%) | 183 (37.7%) |
| $1,000 to $1,499 | 286 (21.7%) | 36 (7.4%) |
| $1,500 to $1,999 | 79 (6.0%) | 10 (2.1%) |
| $2,000 to $2,499 | 7 (0.5%) | 25 (5.1%) |
| $2,500 to $2,999 | 0 (0.0%) | 0 (0.0%) |
| $3,000 or more | 0 (0.0%) | 0 (0.0%) |
| Total | 1,317 (100.0%) | 486 (100.0%) |
Physical Housing Characteristics in Sullivan
Housing Structures in Sullivan
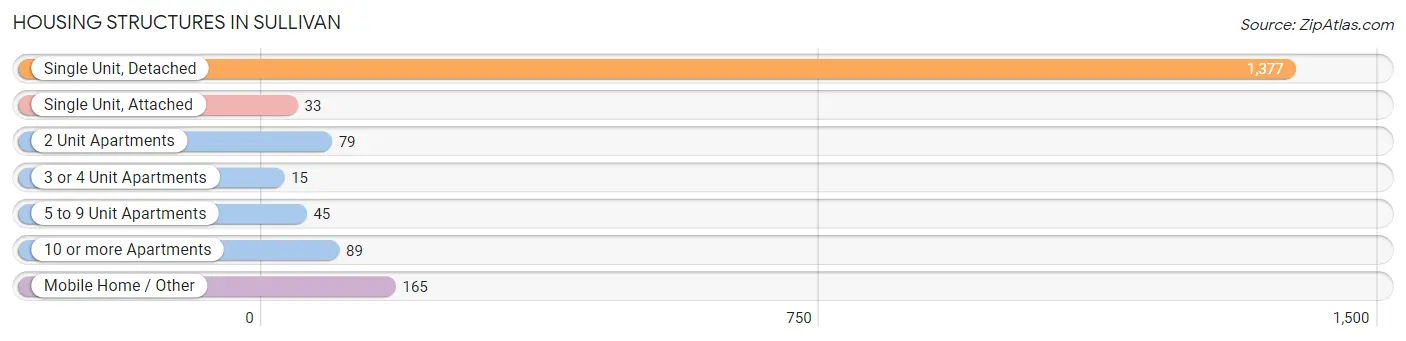
| Structure Type | # Housing Units | % Housing Units |
| Single Unit, Detached | 1,377 | 76.4% |
| Single Unit, Attached | 33 | 1.8% |
| 2 Unit Apartments | 79 | 4.4% |
| 3 or 4 Unit Apartments | 15 | 0.8% |
| 5 to 9 Unit Apartments | 45 | 2.5% |
| 10 or more Apartments | 89 | 4.9% |
| Mobile Home / Other | 165 | 9.1% |
| Total | 1,803 | 100.0% |
Housing Structures by Occupancy in Sullivan
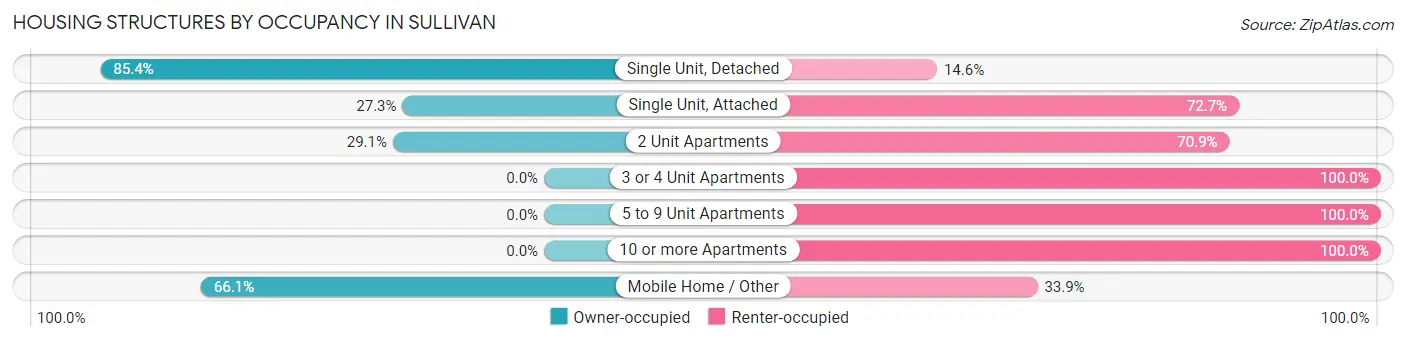
| Structure Type | Owner-occupied | Renter-occupied |
| Single Unit, Detached | 1,176 (85.4%) | 201 (14.6%) |
| Single Unit, Attached | 9 (27.3%) | 24 (72.7%) |
| 2 Unit Apartments | 23 (29.1%) | 56 (70.9%) |
| 3 or 4 Unit Apartments | 0 (0.0%) | 15 (100.0%) |
| 5 to 9 Unit Apartments | 0 (0.0%) | 45 (100.0%) |
| 10 or more Apartments | 0 (0.0%) | 89 (100.0%) |
| Mobile Home / Other | 109 (66.1%) | 56 (33.9%) |
| Total | 1,317 (73.0%) | 486 (27.0%) |
Housing Structures by Number of Rooms in Sullivan
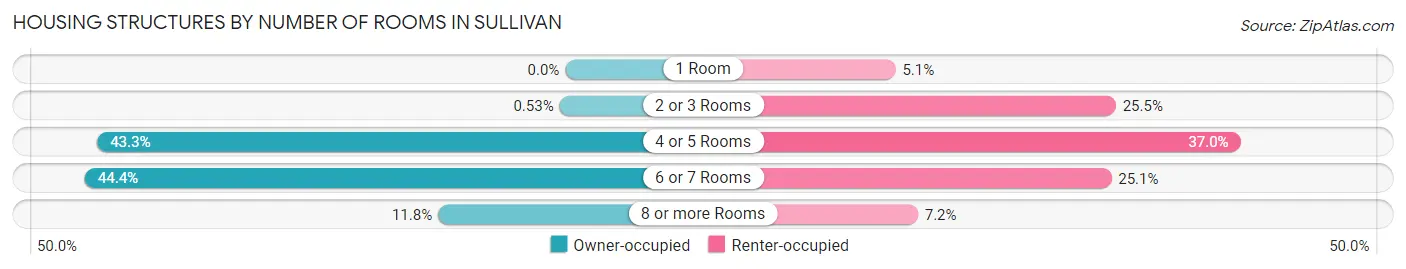
| Number of Rooms | Owner-occupied | Renter-occupied |
| 1 Room | 0 (0.0%) | 25 (5.1%) |
| 2 or 3 Rooms | 7 (0.5%) | 124 (25.5%) |
| 4 or 5 Rooms | 570 (43.3%) | 180 (37.0%) |
| 6 or 7 Rooms | 585 (44.4%) | 122 (25.1%) |
| 8 or more Rooms | 155 (11.8%) | 35 (7.2%) |
| Total | 1,317 (100.0%) | 486 (100.0%) |
Housing Structure by Heating Type in Sullivan
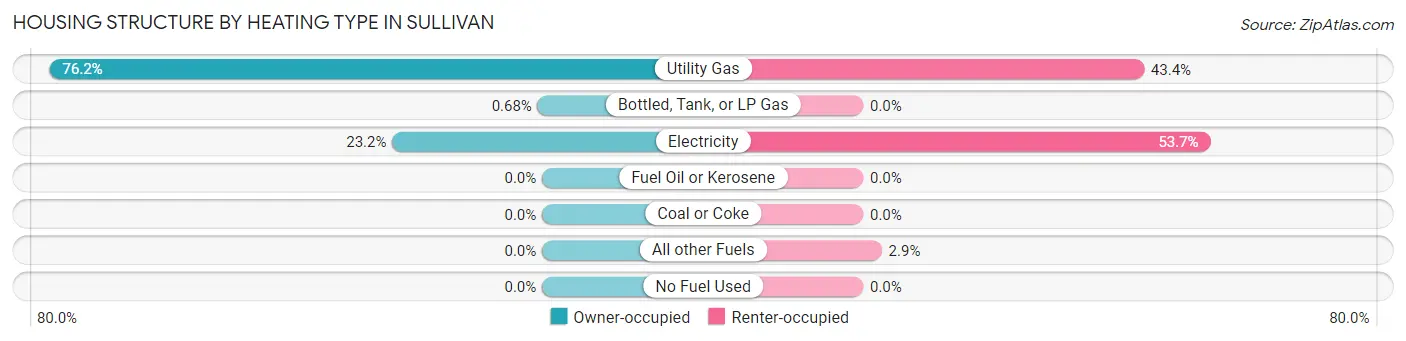
| Heating Type | Owner-occupied | Renter-occupied |
| Utility Gas | 1,003 (76.2%) | 211 (43.4%) |
| Bottled, Tank, or LP Gas | 9 (0.7%) | 0 (0.0%) |
| Electricity | 305 (23.2%) | 261 (53.7%) |
| Fuel Oil or Kerosene | 0 (0.0%) | 0 (0.0%) |
| Coal or Coke | 0 (0.0%) | 0 (0.0%) |
| All other Fuels | 0 (0.0%) | 14 (2.9%) |
| No Fuel Used | 0 (0.0%) | 0 (0.0%) |
| Total | 1,317 (100.0%) | 486 (100.0%) |
Household Vehicle Usage in Sullivan
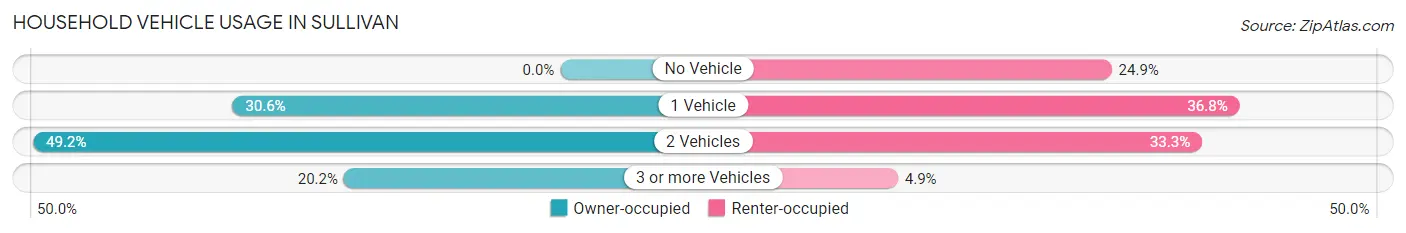
| Vehicles per Household | Owner-occupied | Renter-occupied |
| No Vehicle | 0 (0.0%) | 121 (24.9%) |
| 1 Vehicle | 403 (30.6%) | 179 (36.8%) |
| 2 Vehicles | 648 (49.2%) | 162 (33.3%) |
| 3 or more Vehicles | 266 (20.2%) | 24 (4.9%) |
| Total | 1,317 (100.0%) | 486 (100.0%) |
Real Estate & Mortgages in Sullivan
Real Estate and Mortgage Overview in Sullivan
| Characteristic | Without Mortgage | With Mortgage |
| Housing Units | 579 | 738 |
| Median Property Value | $97,500 | $98,900 |
| Median Household Income | $63,080 | $64 |
| Monthly Housing Costs | $548 | $0 |
| Real Estate Taxes | $2,054 | $71 |
Property Value by Mortgage Status in Sullivan
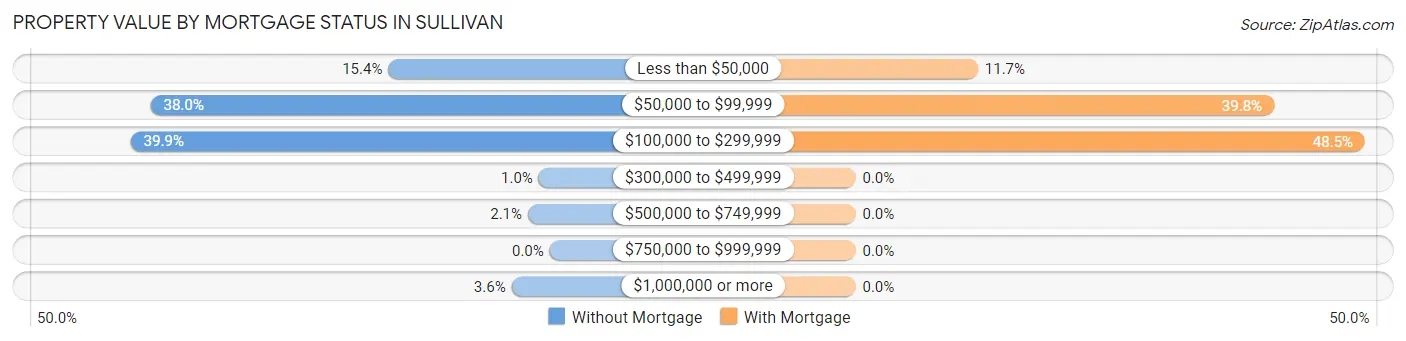
| Property Value | Without Mortgage | With Mortgage |
| Less than $50,000 | 89 (15.4%) | 86 (11.7%) |
| $50,000 to $99,999 | 220 (38.0%) | 294 (39.8%) |
| $100,000 to $299,999 | 231 (39.9%) | 358 (48.5%) |
| $300,000 to $499,999 | 6 (1.0%) | 0 (0.0%) |
| $500,000 to $749,999 | 12 (2.1%) | 0 (0.0%) |
| $750,000 to $999,999 | 0 (0.0%) | 0 (0.0%) |
| $1,000,000 or more | 21 (3.6%) | 0 (0.0%) |
| Total | 579 (100.0%) | 738 (100.0%) |
Household Income by Mortgage Status in Sullivan
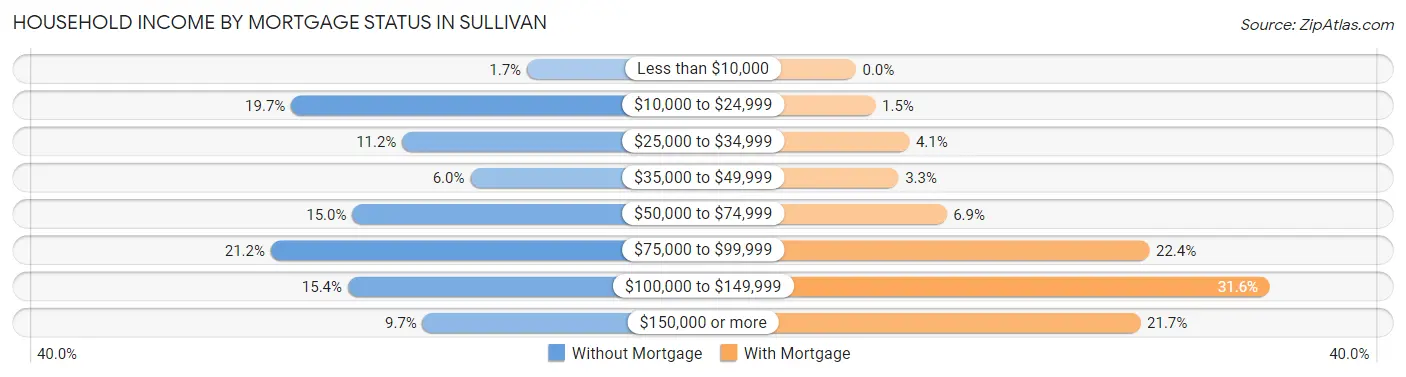
| Household Income | Without Mortgage | With Mortgage |
| Less than $10,000 | 10 (1.7%) | 0 (0.0%) |
| $10,000 to $24,999 | 114 (19.7%) | 11 (1.5%) |
| $25,000 to $34,999 | 65 (11.2%) | 30 (4.1%) |
| $35,000 to $49,999 | 35 (6.0%) | 24 (3.3%) |
| $50,000 to $74,999 | 87 (15.0%) | 51 (6.9%) |
| $75,000 to $99,999 | 123 (21.2%) | 165 (22.4%) |
| $100,000 to $149,999 | 89 (15.4%) | 233 (31.6%) |
| $150,000 or more | 56 (9.7%) | 160 (21.7%) |
| Total | 579 (100.0%) | 738 (100.0%) |
Property Value to Household Income Ratio in Sullivan
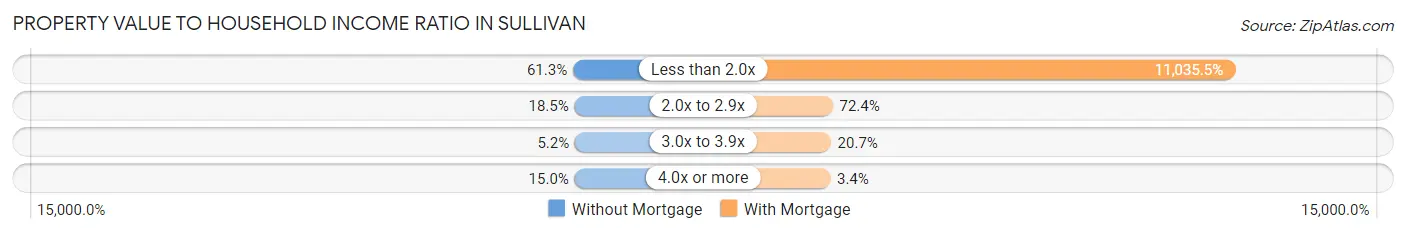
| Value-to-Income Ratio | Without Mortgage | With Mortgage |
| Less than 2.0x | 355 (61.3%) | 81,442 (11,035.5%) |
| 2.0x to 2.9x | 107 (18.5%) | 534 (72.4%) |
| 3.0x to 3.9x | 30 (5.2%) | 153 (20.7%) |
| 4.0x or more | 87 (15.0%) | 25 (3.4%) |
| Total | 579 (100.0%) | 738 (100.0%) |
Real Estate Taxes by Mortgage Status in Sullivan
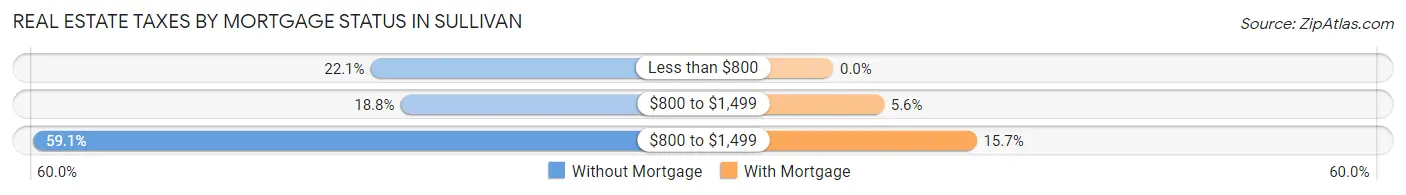
| Property Taxes | Without Mortgage | With Mortgage |
| Less than $800 | 128 (22.1%) | 0 (0.0%) |
| $800 to $1,499 | 109 (18.8%) | 41 (5.6%) |
| $800 to $1,499 | 342 (59.1%) | 116 (15.7%) |
| Total | 579 (100.0%) | 738 (100.0%) |
Health & Disability in Sullivan
Health Insurance Coverage by Age in Sullivan
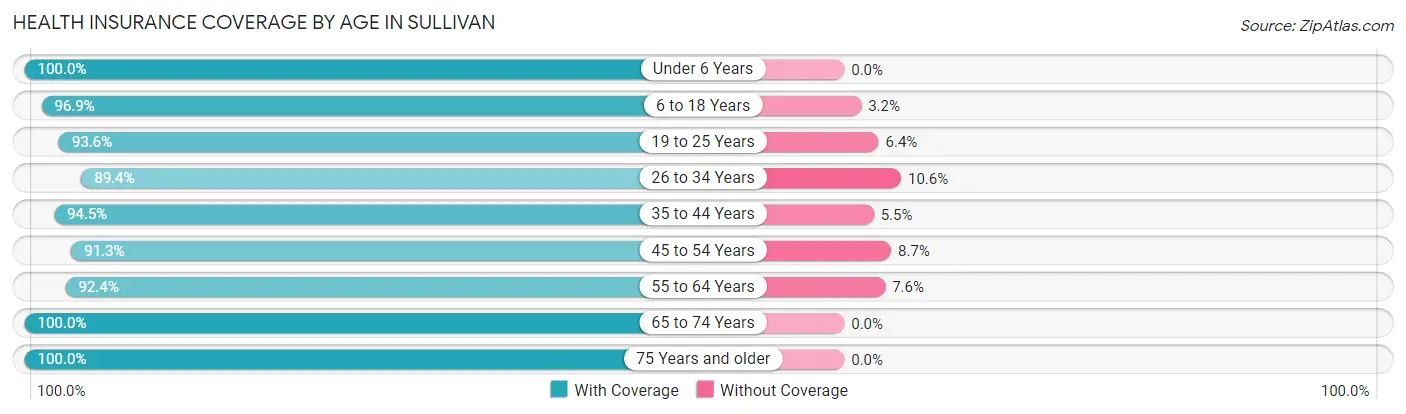
| Age Bracket | With Coverage | Without Coverage |
| Under 6 Years | 231 (100.0%) | 0 (0.0%) |
| 6 to 18 Years | 922 (96.9%) | 30 (3.2%) |
| 19 to 25 Years | 205 (93.6%) | 14 (6.4%) |
| 26 to 34 Years | 507 (89.4%) | 60 (10.6%) |
| 35 to 44 Years | 569 (94.5%) | 33 (5.5%) |
| 45 to 54 Years | 408 (91.3%) | 39 (8.7%) |
| 55 to 64 Years | 472 (92.4%) | 39 (7.6%) |
| 65 to 74 Years | 448 (100.0%) | 0 (0.0%) |
| 75 Years and older | 287 (100.0%) | 0 (0.0%) |
| Total | 4,049 (95.0%) | 215 (5.0%) |
Health Insurance Coverage by Citizenship Status in Sullivan
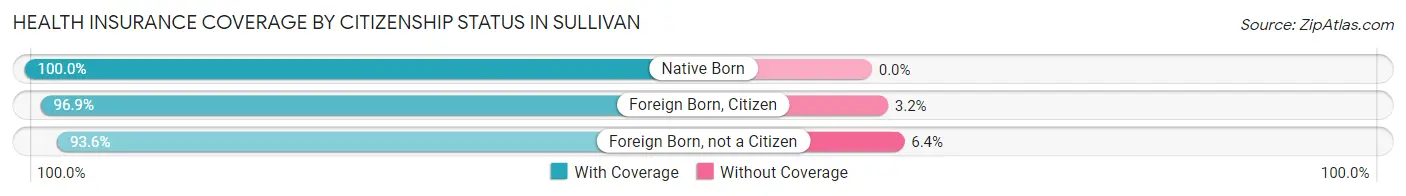
| Citizenship Status | With Coverage | Without Coverage |
| Native Born | 231 (100.0%) | 0 (0.0%) |
| Foreign Born, Citizen | 922 (96.9%) | 30 (3.2%) |
| Foreign Born, not a Citizen | 205 (93.6%) | 14 (6.4%) |
Health Insurance Coverage by Household Income in Sullivan
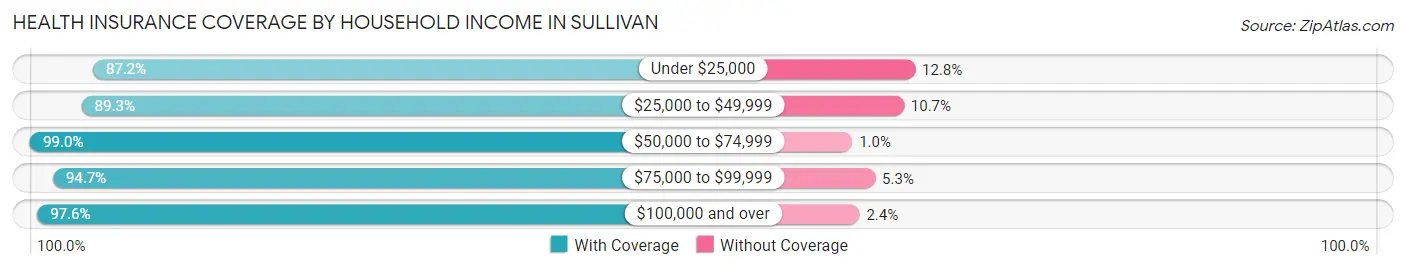
| Household Income | With Coverage | Without Coverage |
| Under $25,000 | 429 (87.2%) | 63 (12.8%) |
| $25,000 to $49,999 | 476 (89.3%) | 57 (10.7%) |
| $50,000 to $74,999 | 984 (99.0%) | 10 (1.0%) |
| $75,000 to $99,999 | 1,070 (94.7%) | 60 (5.3%) |
| $100,000 and over | 1,032 (97.6%) | 25 (2.4%) |
Public vs Private Health Insurance Coverage by Age in Sullivan
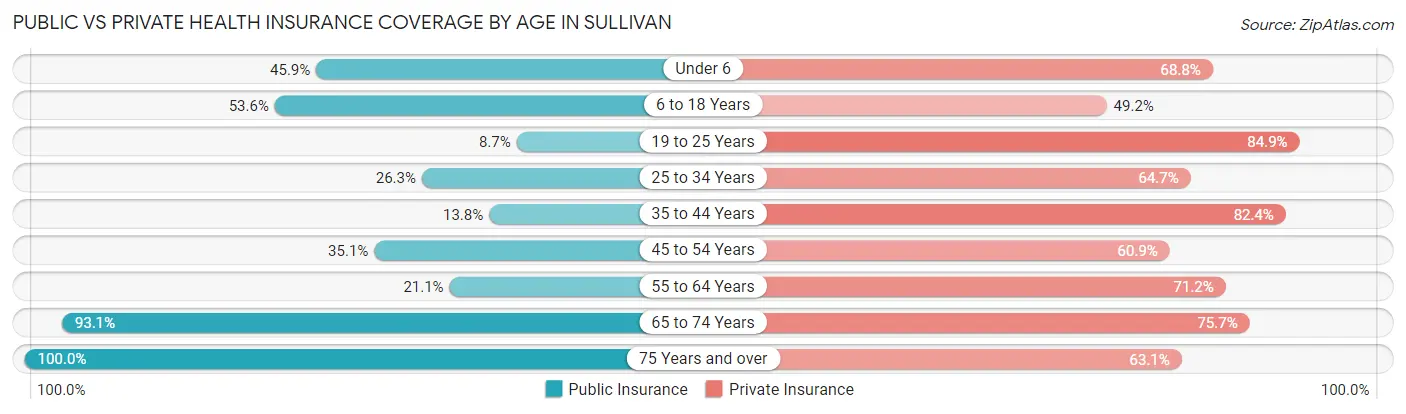
| Age Bracket | Public Insurance | Private Insurance |
| Under 6 | 106 (45.9%) | 159 (68.8%) |
| 6 to 18 Years | 510 (53.6%) | 468 (49.2%) |
| 19 to 25 Years | 19 (8.7%) | 186 (84.9%) |
| 25 to 34 Years | 149 (26.3%) | 367 (64.7%) |
| 35 to 44 Years | 83 (13.8%) | 496 (82.4%) |
| 45 to 54 Years | 157 (35.1%) | 272 (60.9%) |
| 55 to 64 Years | 108 (21.1%) | 364 (71.2%) |
| 65 to 74 Years | 417 (93.1%) | 339 (75.7%) |
| 75 Years and over | 287 (100.0%) | 181 (63.1%) |
| Total | 1,836 (43.1%) | 2,832 (66.4%) |
Disability Status by Sex by Age in Sullivan
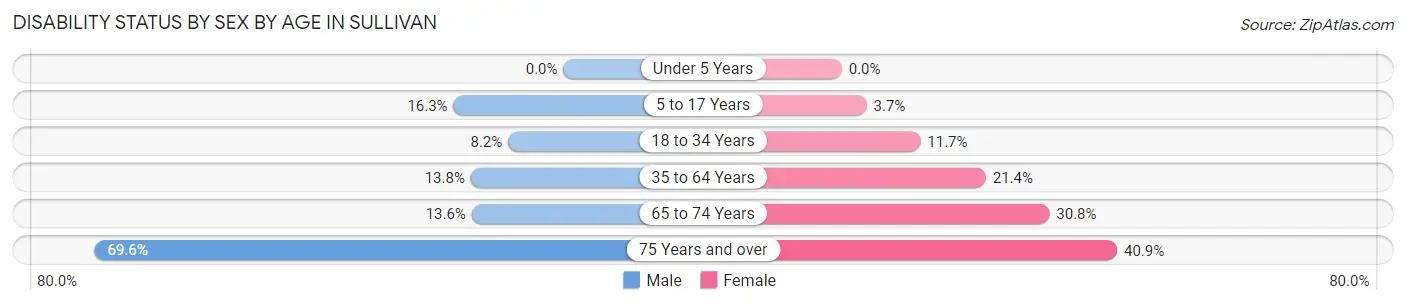
| Age Bracket | Male | Female |
| Under 5 Years | 0 (0.0%) | 0 (0.0%) |
| 5 to 17 Years | 70 (16.3%) | 17 (3.7%) |
| 18 to 34 Years | 37 (8.2%) | 49 (11.7%) |
| 35 to 64 Years | 102 (13.8%) | 175 (21.4%) |
| 65 to 74 Years | 23 (13.6%) | 86 (30.8%) |
| 75 Years and over | 55 (69.6%) | 85 (40.9%) |
Disability Class by Sex by Age in Sullivan
Disability Class: Hearing Difficulty
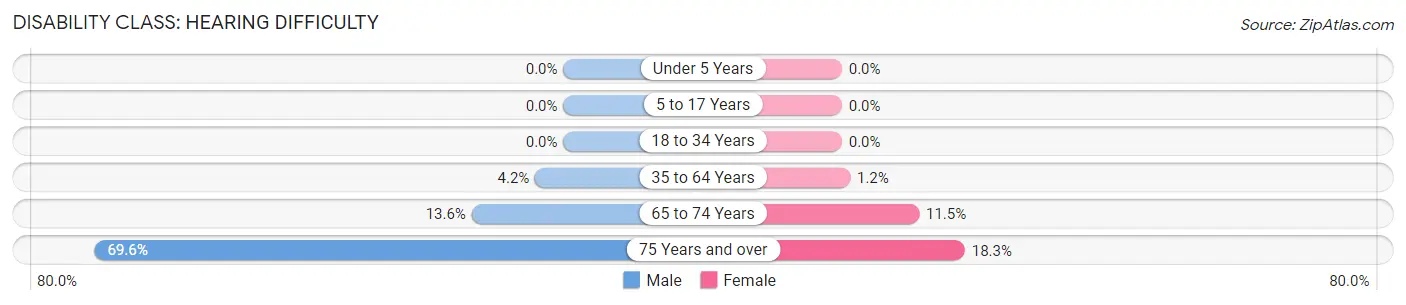
| Age Bracket | Male | Female |
| Under 5 Years | 0 (0.0%) | 0 (0.0%) |
| 5 to 17 Years | 0 (0.0%) | 0 (0.0%) |
| 18 to 34 Years | 0 (0.0%) | 0 (0.0%) |
| 35 to 64 Years | 31 (4.2%) | 10 (1.2%) |
| 65 to 74 Years | 23 (13.6%) | 32 (11.5%) |
| 75 Years and over | 55 (69.6%) | 38 (18.3%) |
Disability Class: Vision Difficulty
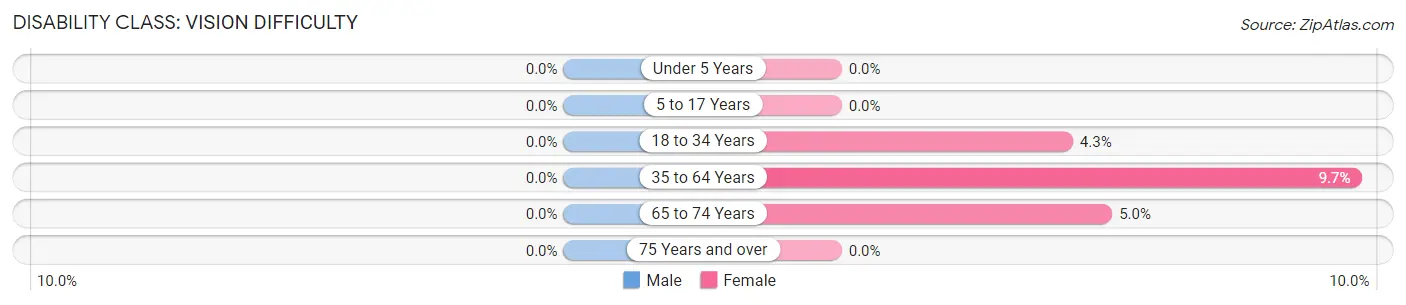
| Age Bracket | Male | Female |
| Under 5 Years | 0 (0.0%) | 0 (0.0%) |
| 5 to 17 Years | 0 (0.0%) | 0 (0.0%) |
| 18 to 34 Years | 0 (0.0%) | 18 (4.3%) |
| 35 to 64 Years | 0 (0.0%) | 79 (9.7%) |
| 65 to 74 Years | 0 (0.0%) | 14 (5.0%) |
| 75 Years and over | 0 (0.0%) | 0 (0.0%) |
Disability Class: Cognitive Difficulty
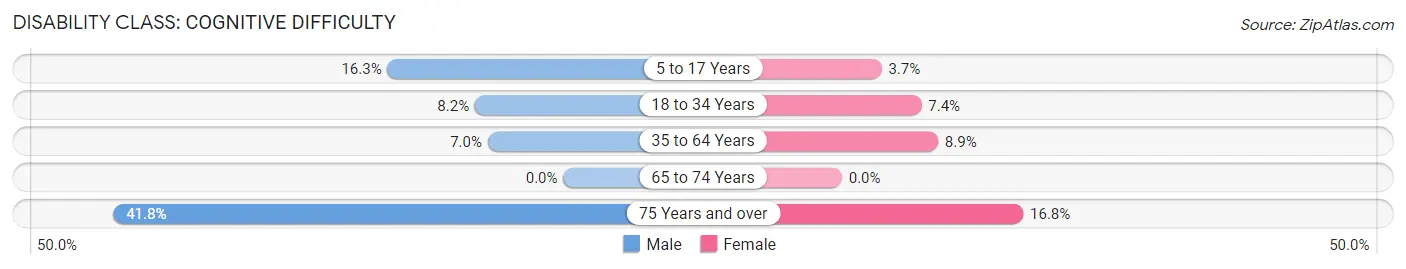
| Age Bracket | Male | Female |
| 5 to 17 Years | 70 (16.3%) | 17 (3.7%) |
| 18 to 34 Years | 37 (8.2%) | 31 (7.4%) |
| 35 to 64 Years | 52 (7.0%) | 73 (8.9%) |
| 65 to 74 Years | 0 (0.0%) | 0 (0.0%) |
| 75 Years and over | 33 (41.8%) | 35 (16.8%) |
Disability Class: Ambulatory Difficulty
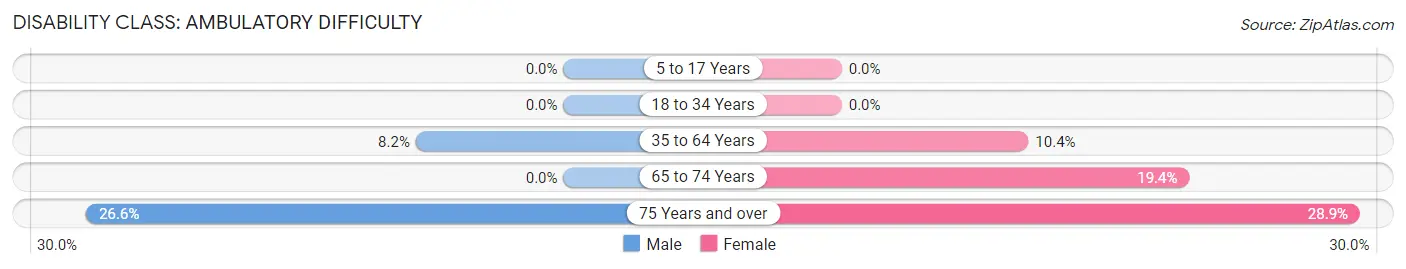
| Age Bracket | Male | Female |
| 5 to 17 Years | 0 (0.0%) | 0 (0.0%) |
| 18 to 34 Years | 0 (0.0%) | 0 (0.0%) |
| 35 to 64 Years | 61 (8.2%) | 85 (10.4%) |
| 65 to 74 Years | 0 (0.0%) | 54 (19.4%) |
| 75 Years and over | 21 (26.6%) | 60 (28.8%) |
Disability Class: Self-Care Difficulty
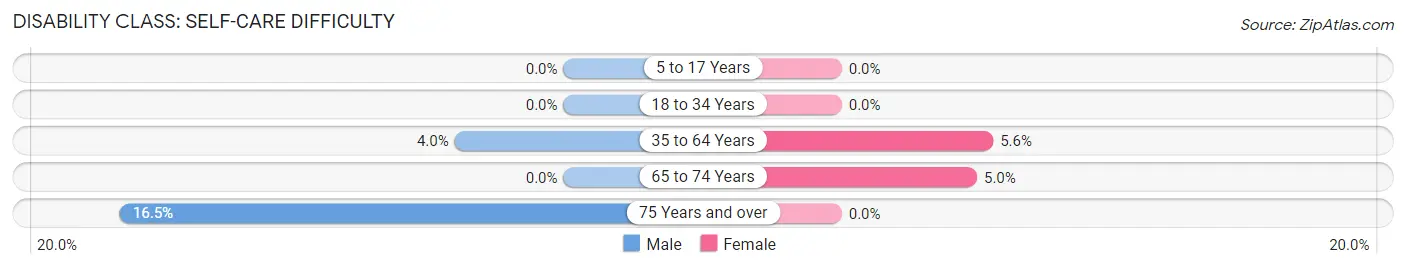
| Age Bracket | Male | Female |
| 5 to 17 Years | 0 (0.0%) | 0 (0.0%) |
| 18 to 34 Years | 0 (0.0%) | 0 (0.0%) |
| 35 to 64 Years | 30 (4.0%) | 46 (5.6%) |
| 65 to 74 Years | 0 (0.0%) | 14 (5.0%) |
| 75 Years and over | 13 (16.5%) | 0 (0.0%) |
Technology Access in Sullivan
Computing Device Access in Sullivan
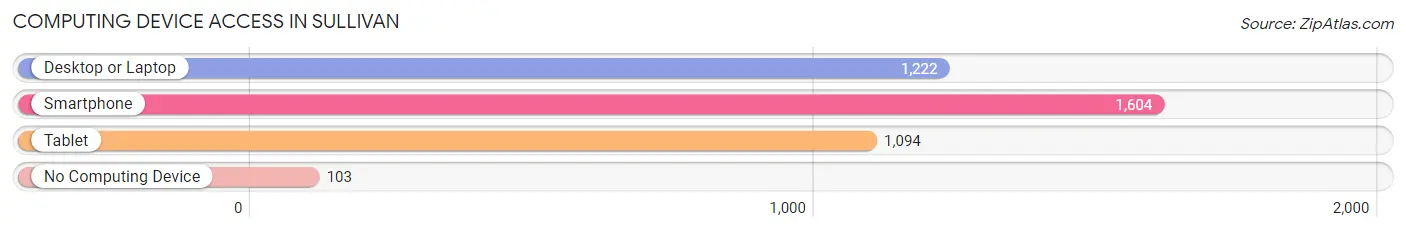
| Device Type | # Households | % Households |
| Desktop or Laptop | 1,222 | 67.8% |
| Smartphone | 1,604 | 89.0% |
| Tablet | 1,094 | 60.7% |
| No Computing Device | 103 | 5.7% |
| Total | 1,803 | 100.0% |
Internet Access in Sullivan
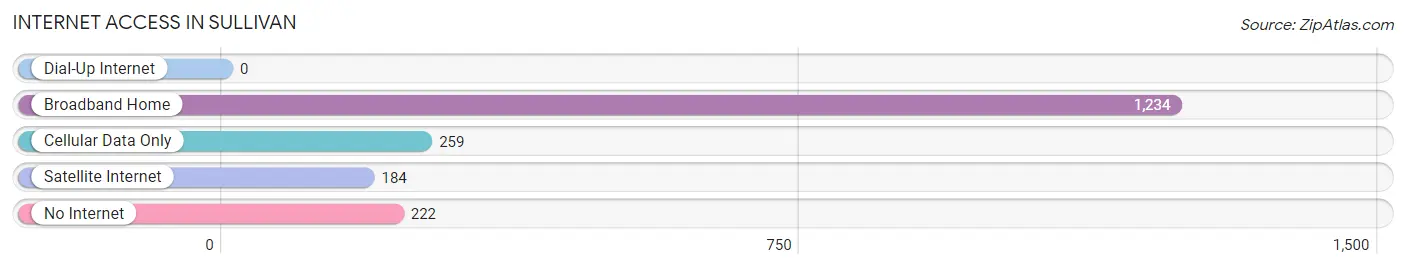
| Internet Type | # Households | % Households |
| Dial-Up Internet | 0 | 0.0% |
| Broadband Home | 1,234 | 68.4% |
| Cellular Data Only | 259 | 14.4% |
| Satellite Internet | 184 | 10.2% |
| No Internet | 222 | 12.3% |
| Total | 1,803 | 100.0% |
Sullivan Summary
Sullivan, Illinois is a small city located in Moultrie County, Illinois. It is situated in the east-central part of the state, about 90 miles south of Chicago. The city has a population of approximately 4,000 people and is the county seat of Moultrie County.
History
The area that is now Sullivan was first settled in 1829 by a group of settlers from Kentucky. The settlement was originally known as “Moultrie” after the county it was located in. In 1837, the name was changed to Sullivan in honor of James Sullivan, a prominent local politician.
The city was officially incorporated in 1858 and quickly grew to become an important center of commerce and industry. The city was home to several factories, including a flour mill, a sawmill, and a brickyard. The city also had a thriving agricultural industry, with many farmers growing corn, wheat, and other crops.
In the late 19th century, Sullivan was a major stop on the Illinois Central Railroad. This allowed the city to become a major shipping hub for the region. The city also had a large number of hotels and restaurants, making it a popular destination for travelers.
Geography
Sullivan is located in east-central Illinois, about 90 miles south of Chicago. The city is situated in the heart of Moultrie County, which is part of the Central Illinois region. The city is located on the banks of the Embarras River, which flows through the city and is a major source of water for the area.
The city has a total area of 2.3 square miles, all of which is land. The city is located in a flat, open area with few hills or mountains. The climate in Sullivan is generally mild, with hot summers and cold winters.
Economy
Sullivan’s economy is largely based on agriculture and manufacturing. The city is home to several factories, including a flour mill, a sawmill, and a brickyard. The city also has a thriving agricultural industry, with many farmers growing corn, wheat, and other crops.
The city is also home to several small businesses, including restaurants, retail stores, and service providers. The city is also home to a number of government offices, including the Moultrie County Courthouse.
Demographics
As of the 2010 census, Sullivan had a population of 4,039 people. The racial makeup of the city was 97.2% White, 0.7% African American, 0.2% Native American, 0.3% Asian, 0.1% Pacific Islander, 0.7% from other races, and 0.9% from two or more races. Hispanic or Latino of any race were 1.7% of the population.
The median household income in Sullivan was $37,917, and the median family income was $45,938. The per capita income for the city was $19,945. About 11.2% of families and 14.2% of the population were below the poverty line, including 19.2% of those under age 18 and 8.2% of those age 65 or over.
Common Questions
What is Per Capita Income in Sullivan?
Per Capita income in Sullivan is $30,946.
What is the Median Family Income in Sullivan?
Median Family Income in Sullivan is $74,554.
What is the Median Household income in Sullivan?
Median Household Income in Sullivan is $63,917.
What is Income or Wage Gap in Sullivan?
Income or Wage Gap in Sullivan is 47.8%.
Women in Sullivan earn 52.2 cents for every dollar earned by a man.
What is Inequality or Gini Index in Sullivan?
Inequality or Gini Index in Sullivan is 0.38.
What is the Total Population of Sullivan?
Total Population of Sullivan is 4,408.
What is the Total Male Population of Sullivan?
Total Male Population of Sullivan is 2,081.
What is the Total Female Population of Sullivan?
Total Female Population of Sullivan is 2,327.
What is the Ratio of Males per 100 Females in Sullivan?
There are 89.43 Males per 100 Females in Sullivan.
What is the Ratio of Females per 100 Males in Sullivan?
There are 111.82 Females per 100 Males in Sullivan.
What is the Median Population Age in Sullivan?
Median Population Age in Sullivan is 39.0 Years.
What is the Average Family Size in Sullivan
Average Family Size in Sullivan is 2.8 People.
What is the Average Household Size in Sullivan
Average Household Size in Sullivan is 2.3 People.
How Large is the Labor Force in Sullivan?
There are 2,098 People in the Labor Forcein in Sullivan.
What is the Percentage of People in the Labor Force in Sullivan?
60.4% of People are in the Labor Force in Sullivan.
What is the Unemployment Rate in Sullivan?
Unemployment Rate in Sullivan is 5.6%.