Streator, IL Map & Demographics
Streator Map
Streator Overview
$31,706
PER CAPITA INCOME
$64,627
AVG FAMILY INCOME
$46,615
AVG HOUSEHOLD INCOME
49.2%
WAGE / INCOME GAP [ % ]
50.8¢/ $1
WAGE / INCOME GAP [ $ ]
0.47
INEQUALITY / GINI INDEX
12,279
TOTAL POPULATION
6,115
MALE POPULATION
6,164
FEMALE POPULATION
99.21
MALES / 100 FEMALES
100.80
FEMALES / 100 MALES
39.5
MEDIAN AGE
2.9
AVG FAMILY SIZE
2.1
AVG HOUSEHOLD SIZE
6,117
LABOR FORCE [ PEOPLE ]
61.1%
PERCENT IN LABOR FORCE
9.1%
UNEMPLOYMENT RATE
Streator Zip Codes
Streator Area Codes
Income in Streator
Income Overview in Streator
Per Capita Income in Streator is $31,706, while median incomes of families and households are $64,627 and $46,615 respectively.
| Characteristic | Number | Measure |
| Per Capita Income | 12,279 | $31,706 |
| Median Family Income | 3,011 | $64,627 |
| Mean Family Income | 3,011 | $78,896 |
| Median Household Income | 5,845 | $46,615 |
| Mean Household Income | 5,845 | $63,223 |
| Income Deficit | 3,011 | $0 |
| Wage / Income Gap (%) | 12,279 | 49.22% |
| Wage / Income Gap ($) | 12,279 | 50.78¢ per $1 |
| Gini / Inequality Index | 12,279 | 0.47 |
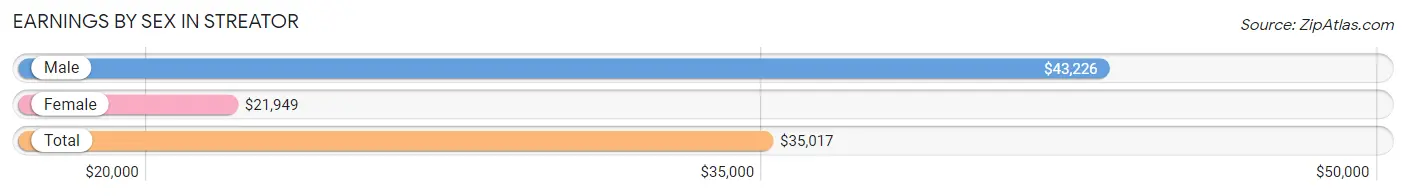
Earnings by Sex in Streator
Average Earnings in Streator are $35,017, $43,226 for men and $21,949 for women, a difference of 49.2%.
| Sex | Number | Average Earnings |
| Male | 3,336 (53.9%) | $43,226 |
| Female | 2,847 (46.1%) | $21,949 |
| Total | 6,183 (100.0%) | $35,017 |
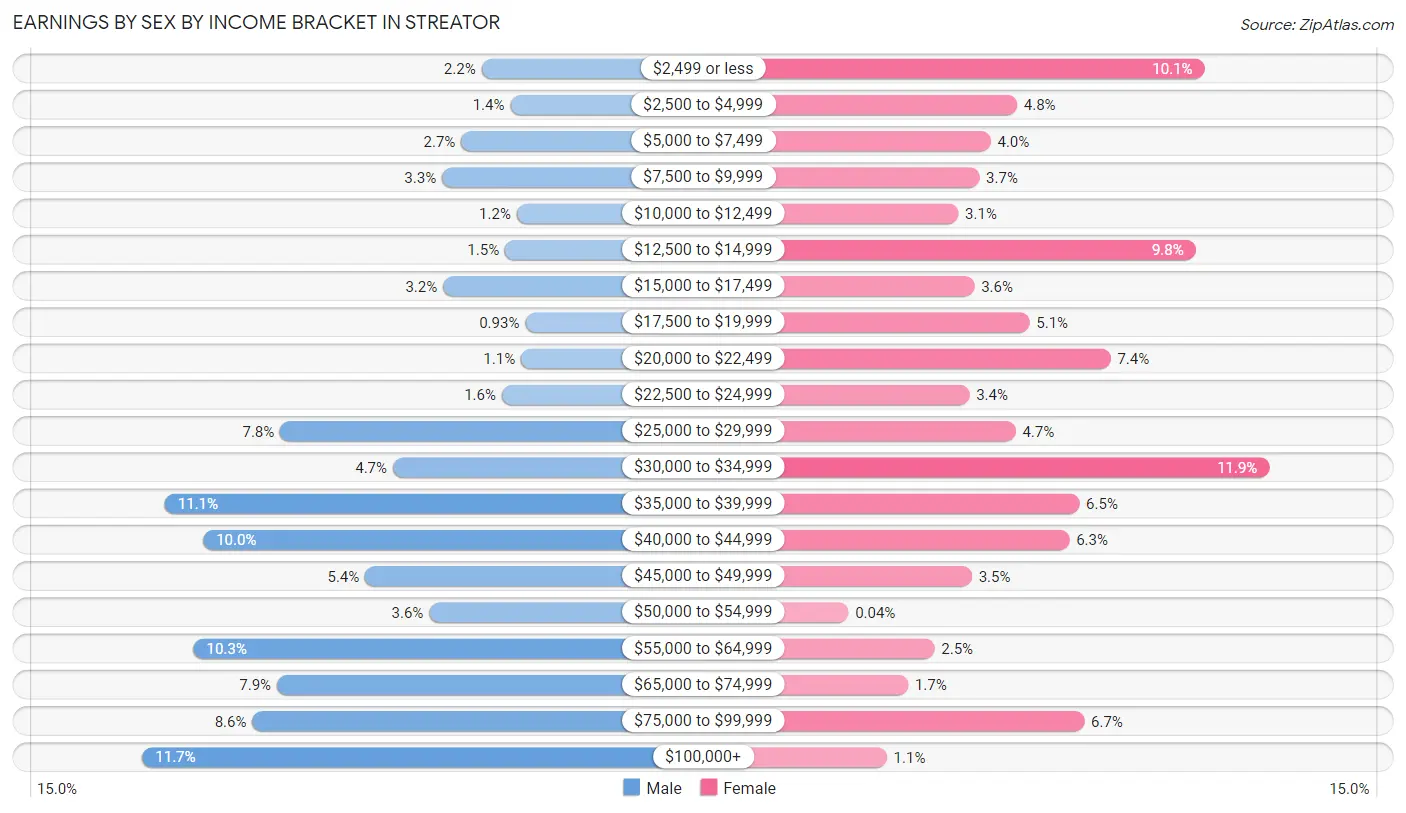
Earnings by Sex by Income Bracket in Streator
The most common earnings brackets in Streator are $100,000+ for men (390 | 11.7%) and $30,000 to $34,999 for women (338 | 11.9%).
| Income | Male | Female |
| $2,499 or less | 72 (2.2%) | 286 (10.1%) |
| $2,500 to $4,999 | 45 (1.3%) | 136 (4.8%) |
| $5,000 to $7,499 | 91 (2.7%) | 115 (4.0%) |
| $7,500 to $9,999 | 109 (3.3%) | 106 (3.7%) |
| $10,000 to $12,499 | 39 (1.2%) | 89 (3.1%) |
| $12,500 to $14,999 | 50 (1.5%) | 279 (9.8%) |
| $15,000 to $17,499 | 108 (3.2%) | 102 (3.6%) |
| $17,500 to $19,999 | 31 (0.9%) | 146 (5.1%) |
| $20,000 to $22,499 | 35 (1.1%) | 211 (7.4%) |
| $22,500 to $24,999 | 53 (1.6%) | 98 (3.4%) |
| $25,000 to $29,999 | 261 (7.8%) | 135 (4.7%) |
| $30,000 to $34,999 | 155 (4.6%) | 338 (11.9%) |
| $35,000 to $39,999 | 369 (11.1%) | 186 (6.5%) |
| $40,000 to $44,999 | 333 (10.0%) | 178 (6.2%) |
| $45,000 to $49,999 | 181 (5.4%) | 100 (3.5%) |
| $50,000 to $54,999 | 121 (3.6%) | 1 (0.0%) |
| $55,000 to $64,999 | 342 (10.2%) | 70 (2.5%) |
| $65,000 to $74,999 | 264 (7.9%) | 49 (1.7%) |
| $75,000 to $99,999 | 287 (8.6%) | 190 (6.7%) |
| $100,000+ | 390 (11.7%) | 32 (1.1%) |
| Total | 3,336 (100.0%) | 2,847 (100.0%) |
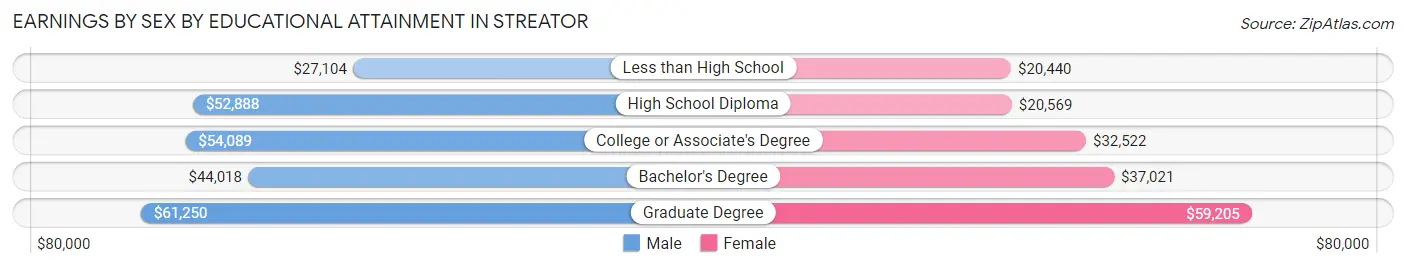
Earnings by Sex by Educational Attainment in Streator
Average earnings in Streator are $47,750 for men and $26,652 for women, a difference of 44.2%. Men with an educational attainment of graduate degree enjoy the highest average annual earnings of $61,250, while those with less than high school education earn the least with $27,104. Women with an educational attainment of graduate degree earn the most with the average annual earnings of $59,205, while those with less than high school education have the smallest earnings of $20,440.
| Educational Attainment | Male Income | Female Income |
| Less than High School | $27,104 | $20,440 |
| High School Diploma | $52,888 | $20,569 |
| College or Associate's Degree | $54,089 | $32,522 |
| Bachelor's Degree | $44,018 | $37,021 |
| Graduate Degree | $61,250 | $59,205 |
| Total | $47,750 | $26,652 |
Family Income in Streator
Family Income Brackets in Streator
According to the Streator family income data, there are 596 families falling into the $75,000 to $99,999 income range, which is the most common income bracket and makes up 19.8% of all families. Conversely, the $10,000 to $14,999 income bracket is the least frequent group with only 117 families (3.9%) belonging to this category.
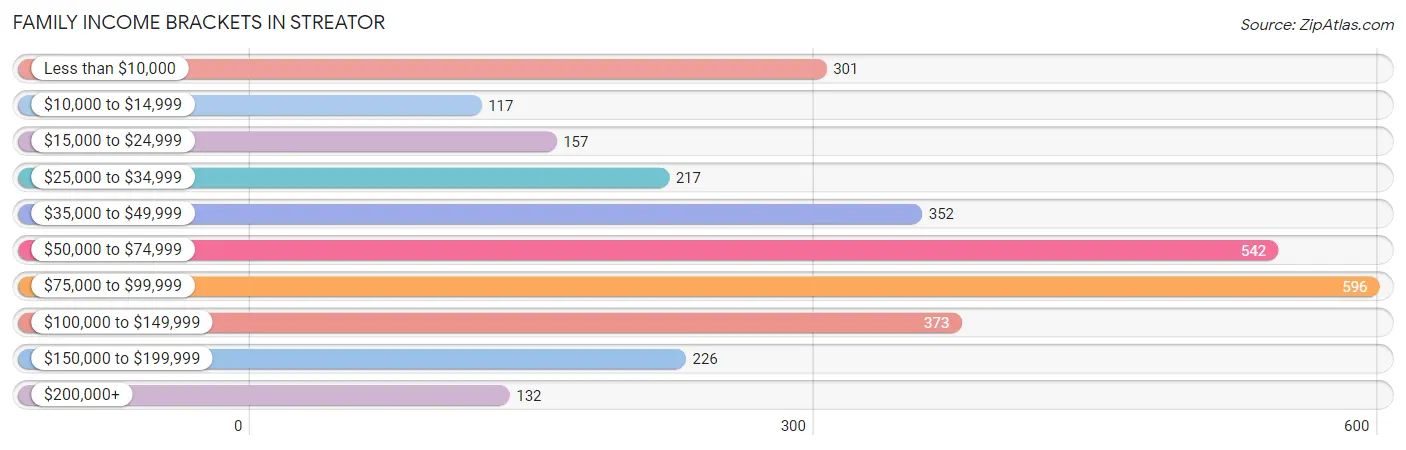
| Income Bracket | # Families | % Families |
| Less than $10,000 | 301 | 10.0% |
| $10,000 to $14,999 | 117 | 3.9% |
| $15,000 to $24,999 | 157 | 5.2% |
| $25,000 to $34,999 | 217 | 7.2% |
| $35,000 to $49,999 | 352 | 11.7% |
| $50,000 to $74,999 | 542 | 18.0% |
| $75,000 to $99,999 | 596 | 19.8% |
| $100,000 to $149,999 | 373 | 12.4% |
| $150,000 to $199,999 | 226 | 7.5% |
| $200,000+ | 132 | 4.4% |
Family Income by Famaliy Size in Streator
4-person families (367 | 12.2%) account for the highest median family income in Streator with $117,566 per family, while 2-person families (1,618 | 53.7%) have the highest median income of $31,724 per family member.
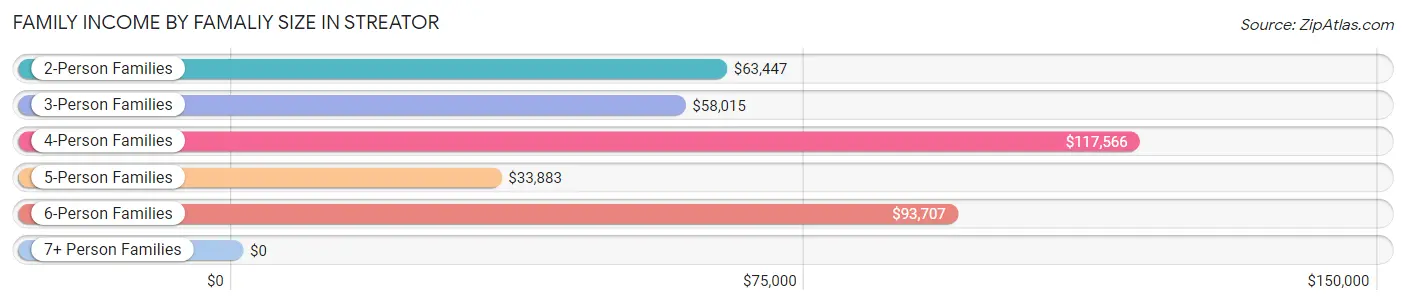
| Income Bracket | # Families | Median Income |
| 2-Person Families | 1,618 (53.7%) | $63,447 |
| 3-Person Families | 701 (23.3%) | $58,015 |
| 4-Person Families | 367 (12.2%) | $117,566 |
| 5-Person Families | 168 (5.6%) | $33,883 |
| 6-Person Families | 80 (2.7%) | $93,707 |
| 7+ Person Families | 77 (2.6%) | $0 |
| Total | 3,011 (100.0%) | $64,627 |
Family Income by Number of Earners in Streator
The median family income in Streator is $64,627, with families comprising 3+ earners (339) having the highest median family income of $117,662, while families with 1 earner (1,168) have the lowest median family income of $36,198, accounting for 11.3% and 38.8% of families, respectively.
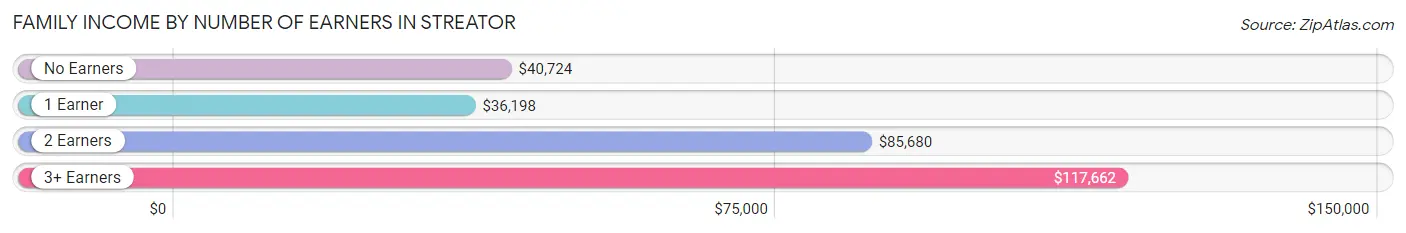
| Number of Earners | # Families | Median Income |
| No Earners | 583 (19.4%) | $40,724 |
| 1 Earner | 1,168 (38.8%) | $36,198 |
| 2 Earners | 921 (30.6%) | $85,680 |
| 3+ Earners | 339 (11.3%) | $117,662 |
| Total | 3,011 (100.0%) | $64,627 |
Household Income in Streator
Household Income Brackets in Streator
With 1,052 households falling in the category, the $50,000 to $74,999 income range is the most frequent in Streator, accounting for 18.0% of all households. In contrast, only 193 households (3.3%) fall into the $200,000+ income bracket, making it the least populous group.
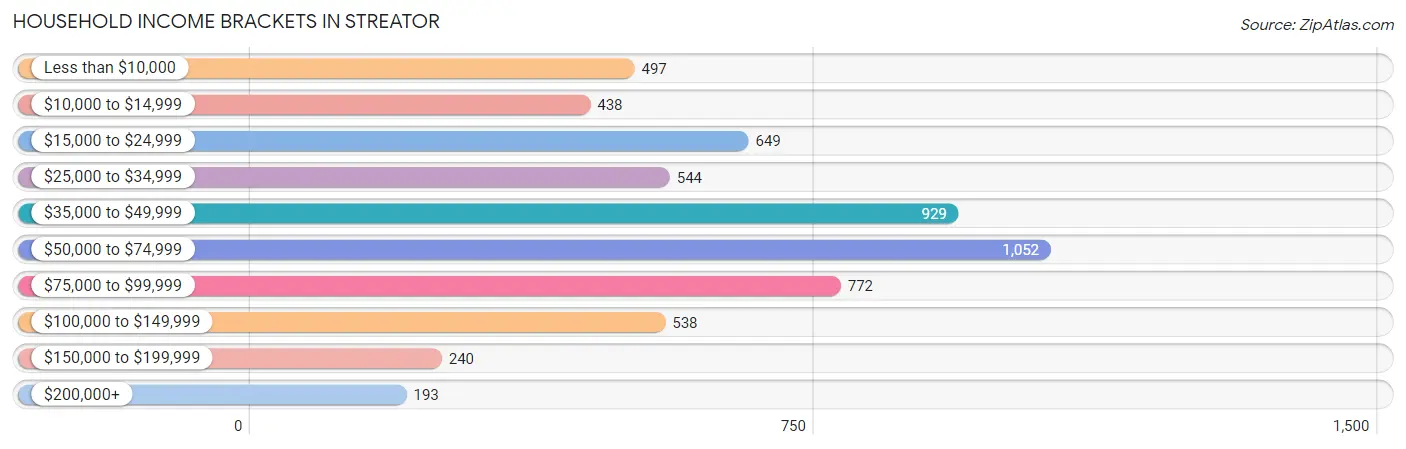
| Income Bracket | # Households | % Households |
| Less than $10,000 | 497 | 8.5% |
| $10,000 to $14,999 | 438 | 7.5% |
| $15,000 to $24,999 | 649 | 11.1% |
| $25,000 to $34,999 | 544 | 9.3% |
| $35,000 to $49,999 | 929 | 15.9% |
| $50,000 to $74,999 | 1,052 | 18.0% |
| $75,000 to $99,999 | 772 | 13.2% |
| $100,000 to $149,999 | 538 | 9.2% |
| $150,000 to $199,999 | 240 | 4.1% |
| $200,000+ | 193 | 3.3% |
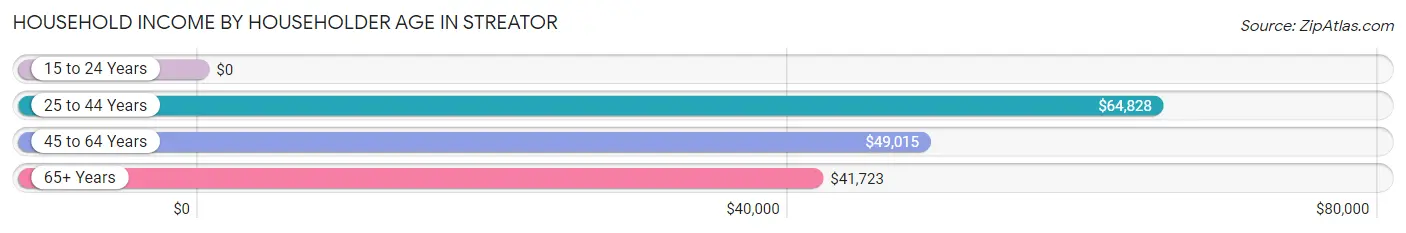
Household Income by Householder Age in Streator
The median household income in Streator is $46,615, with the highest median household income of $64,828 found in the 25 to 44 years age bracket for the primary householder. A total of 1,762 households (30.1%) fall into this category. Meanwhile, the 15 to 24 years age bracket for the primary householder has the lowest median household income of $0, with 406 households (7.0%) in this group.
| Income Bracket | # Households | Median Income |
| 15 to 24 Years | 406 (7.0%) | $0 |
| 25 to 44 Years | 1,762 (30.1%) | $64,828 |
| 45 to 64 Years | 1,788 (30.6%) | $49,015 |
| 65+ Years | 1,889 (32.3%) | $41,723 |
| Total | 5,845 (100.0%) | $46,615 |
Poverty in Streator
Income Below Poverty by Sex and Age in Streator
With 21.2% poverty level for males and 22.9% for females among the residents of Streator, under 5 year old males and 18 to 24 year old females are the most vulnerable to poverty, with 304 males (61.9%) and 335 females (44.6%) in their respective age groups living below the poverty level.
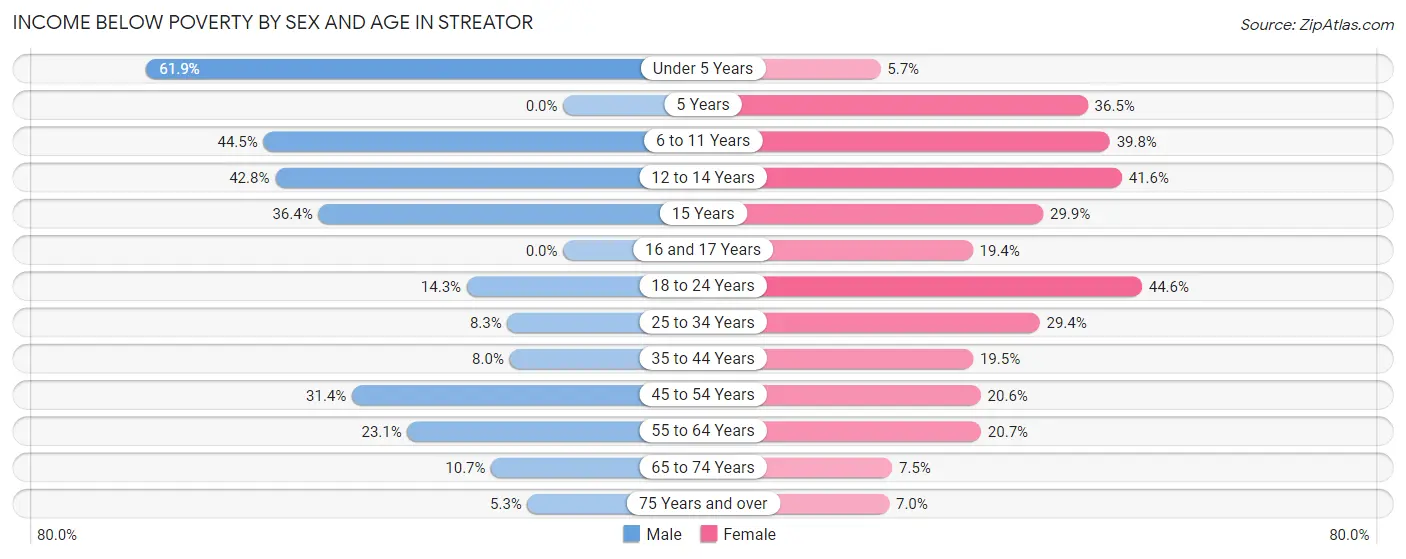
| Age Bracket | Male | Female |
| Under 5 Years | 304 (61.9%) | 13 (5.7%) |
| 5 Years | 0 (0.0%) | 69 (36.5%) |
| 6 to 11 Years | 195 (44.5%) | 107 (39.8%) |
| 12 to 14 Years | 77 (42.8%) | 84 (41.6%) |
| 15 Years | 20 (36.4%) | 49 (29.9%) |
| 16 and 17 Years | 0 (0.0%) | 20 (19.4%) |
| 18 to 24 Years | 63 (14.3%) | 335 (44.6%) |
| 25 to 34 Years | 72 (8.3%) | 219 (29.4%) |
| 35 to 44 Years | 88 (8.0%) | 136 (19.5%) |
| 45 to 54 Years | 165 (31.4%) | 99 (20.6%) |
| 55 to 64 Years | 201 (23.1%) | 150 (20.7%) |
| 65 to 74 Years | 68 (10.7%) | 66 (7.5%) |
| 75 Years and over | 17 (5.3%) | 46 (7.0%) |
| Total | 1,270 (21.2%) | 1,393 (22.9%) |
Income Above Poverty by Sex and Age in Streator
According to the poverty statistics in Streator, males aged 5 years and females aged under 5 years are the age groups that are most secure financially, with 100.0% of males and 94.3% of females in these age groups living above the poverty line.
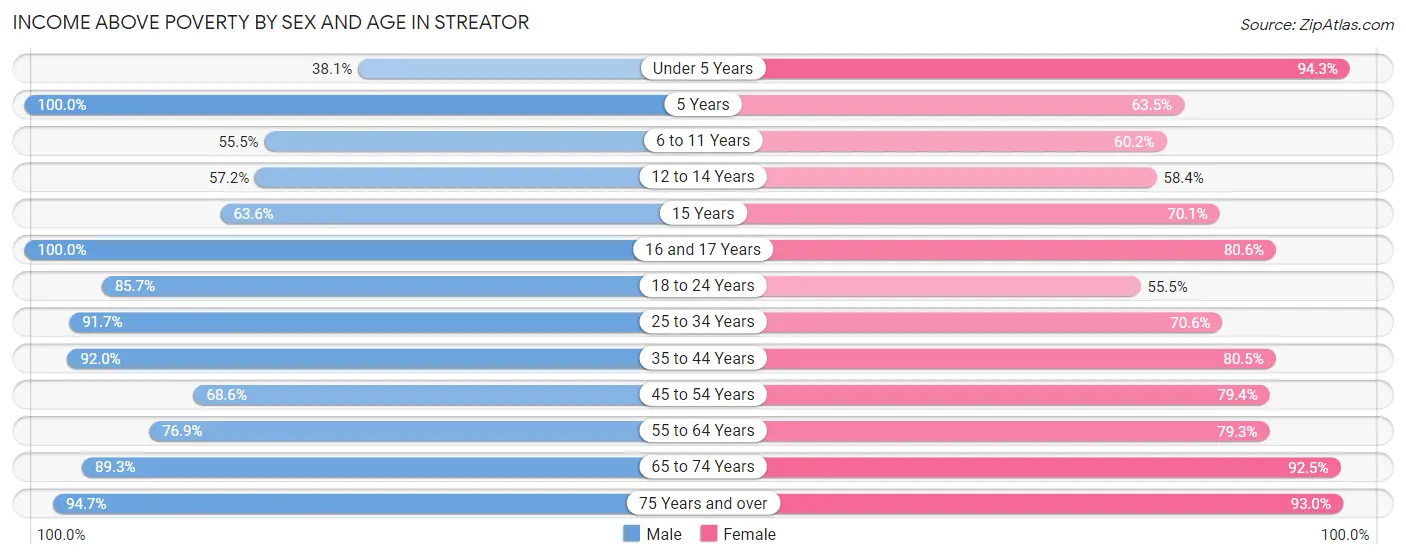
| Age Bracket | Male | Female |
| Under 5 Years | 187 (38.1%) | 214 (94.3%) |
| 5 Years | 14 (100.0%) | 120 (63.5%) |
| 6 to 11 Years | 243 (55.5%) | 162 (60.2%) |
| 12 to 14 Years | 103 (57.2%) | 118 (58.4%) |
| 15 Years | 35 (63.6%) | 115 (70.1%) |
| 16 and 17 Years | 53 (100.0%) | 83 (80.6%) |
| 18 to 24 Years | 377 (85.7%) | 417 (55.4%) |
| 25 to 34 Years | 796 (91.7%) | 527 (70.6%) |
| 35 to 44 Years | 1,018 (92.0%) | 562 (80.5%) |
| 45 to 54 Years | 361 (68.6%) | 381 (79.4%) |
| 55 to 64 Years | 668 (76.9%) | 576 (79.3%) |
| 65 to 74 Years | 568 (89.3%) | 818 (92.5%) |
| 75 Years and over | 304 (94.7%) | 610 (93.0%) |
| Total | 4,727 (78.8%) | 4,703 (77.1%) |
Income Below Poverty Among Married-Couple Families in Streator
The poverty statistics for married-couple families in Streator show that 7.6% or 153 of the total 2,007 families live below the poverty line. Families with 3 or 4 children have the highest poverty rate of 29.6%, comprising of 61 families. On the other hand, families with 1 or 2 children have the lowest poverty rate of 2.0%, which includes 10 families.
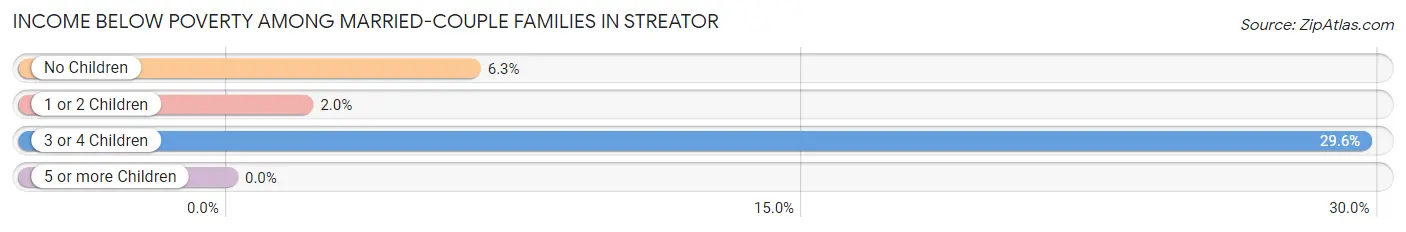
| Children | Above Poverty | Below Poverty |
| No Children | 1,211 (93.7%) | 82 (6.3%) |
| 1 or 2 Children | 498 (98.0%) | 10 (2.0%) |
| 3 or 4 Children | 145 (70.4%) | 61 (29.6%) |
| 5 or more Children | 0 (0.0%) | 0 (0.0%) |
| Total | 1,854 (92.4%) | 153 (7.6%) |
Income Below Poverty Among Single-Parent Households in Streator
According to the poverty data in Streator, 23.2% or 33 single-father households and 53.4% or 460 single-mother households are living below the poverty line. Among single-father households, those with 1 or 2 children have the highest poverty rate, with 33 households (31.4%) experiencing poverty. Likewise, among single-mother households, those with 3 or 4 children have the highest poverty rate, with 60 households (76.9%) falling below the poverty line.
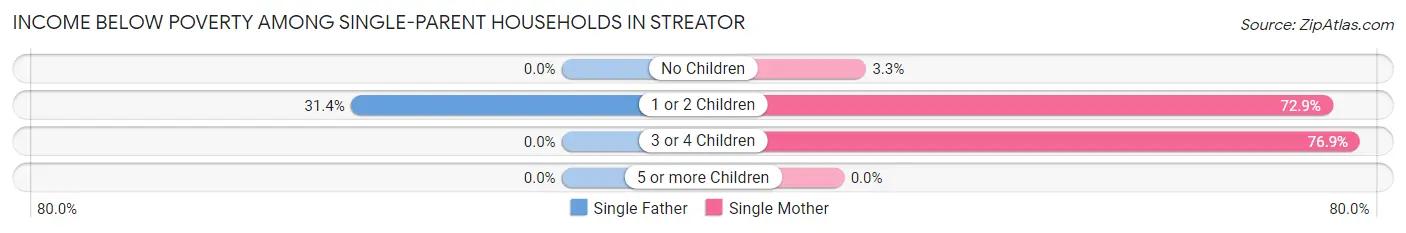
| Children | Single Father | Single Mother |
| No Children | 0 (0.0%) | 8 (3.3%) |
| 1 or 2 Children | 33 (31.4%) | 392 (72.9%) |
| 3 or 4 Children | 0 (0.0%) | 60 (76.9%) |
| 5 or more Children | 0 (0.0%) | 0 (0.0%) |
| Total | 33 (23.2%) | 460 (53.4%) |
Income Below Poverty Among Married-Couple vs Single-Parent Households in Streator
The poverty data for Streator shows that 153 of the married-couple family households (7.6%) and 493 of the single-parent households (49.1%) are living below the poverty level. Within the married-couple family households, those with 3 or 4 children have the highest poverty rate, with 61 households (29.6%) falling below the poverty line. Among the single-parent households, those with 3 or 4 children have the highest poverty rate, with 60 household (76.9%) living below poverty.
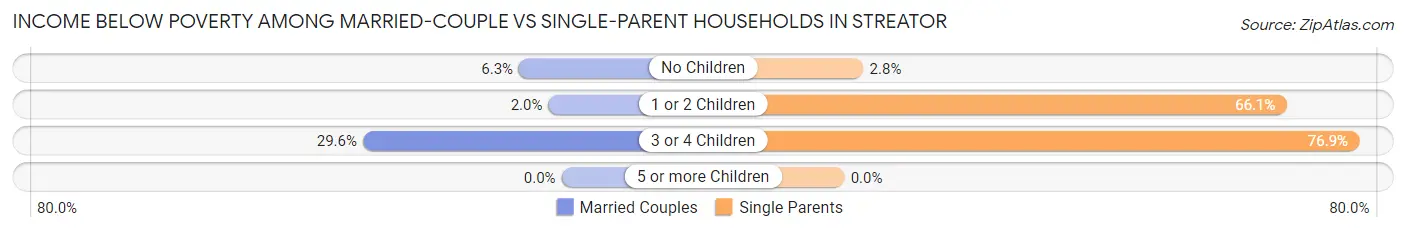
| Children | Married-Couple Families | Single-Parent Households |
| No Children | 82 (6.3%) | 8 (2.8%) |
| 1 or 2 Children | 10 (2.0%) | 425 (66.1%) |
| 3 or 4 Children | 61 (29.6%) | 60 (76.9%) |
| 5 or more Children | 0 (0.0%) | 0 (0.0%) |
| Total | 153 (7.6%) | 493 (49.1%) |
Race in Streator
The most populous races in Streator are White / Caucasian (10,180 | 82.9%), Hispanic or Latino (2,175 | 17.7%), and Two or more Races (794 | 6.5%).
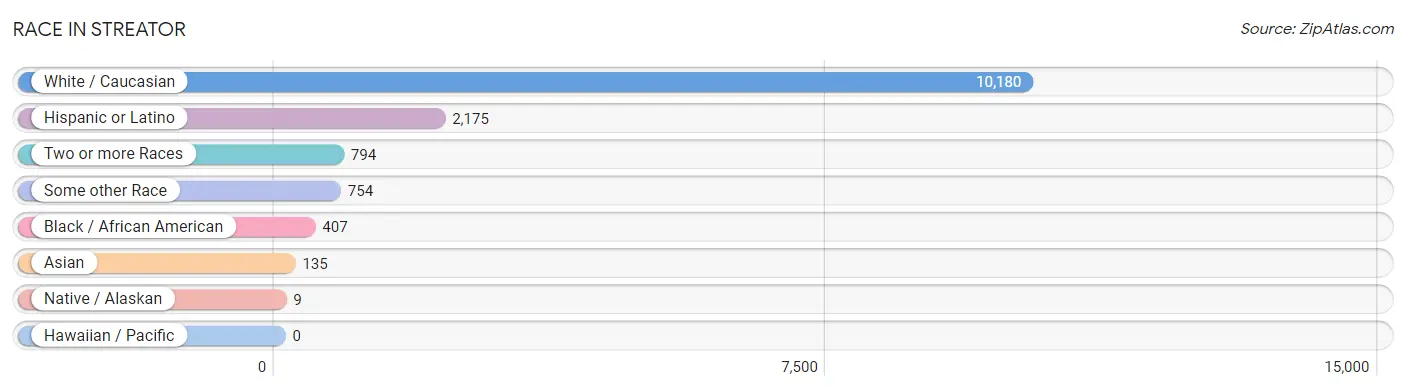
| Race | # Population | % Population |
| Asian | 135 | 1.1% |
| Black / African American | 407 | 3.3% |
| Hawaiian / Pacific | 0 | 0.0% |
| Hispanic or Latino | 2,175 | 17.7% |
| Native / Alaskan | 9 | 0.1% |
| White / Caucasian | 10,180 | 82.9% |
| Two or more Races | 794 | 6.5% |
| Some other Race | 754 | 6.1% |
| Total | 12,279 | 100.0% |
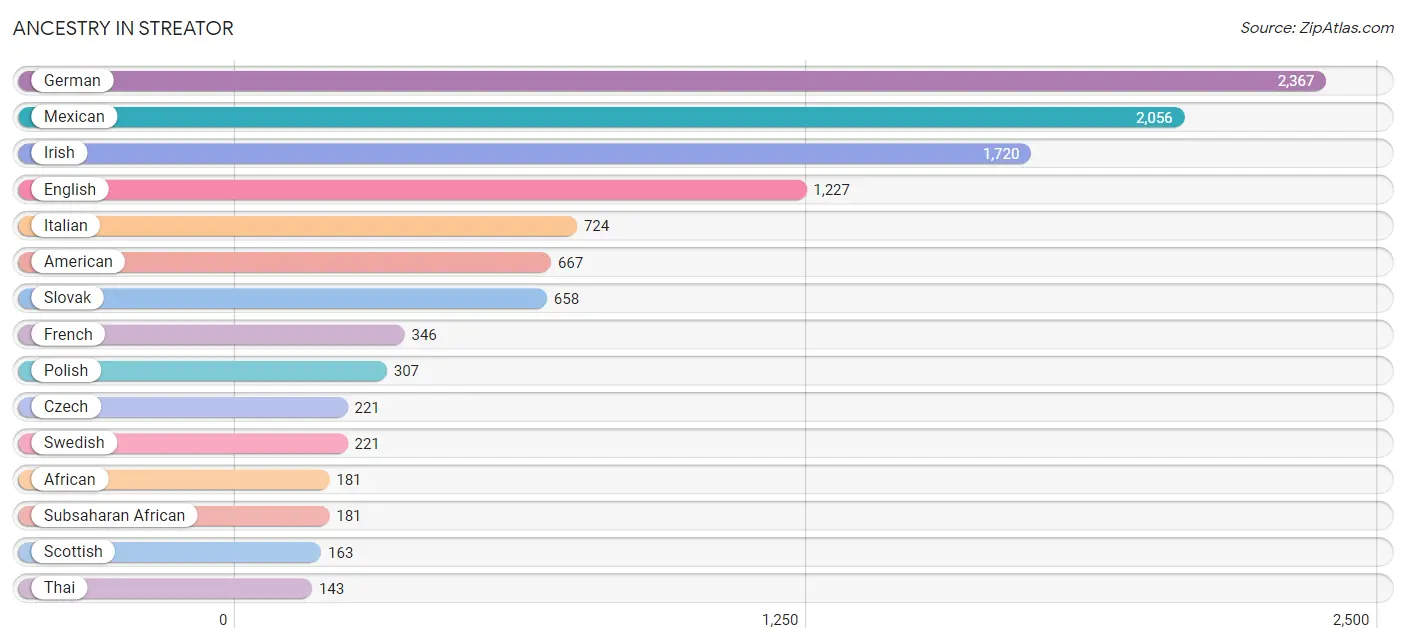
Ancestry in Streator
The most populous ancestries reported in Streator are German (2,367 | 19.3%), Mexican (2,056 | 16.7%), Irish (1,720 | 14.0%), English (1,227 | 10.0%), and Italian (724 | 5.9%), together accounting for 65.9% of all Streator residents.
| Ancestry | # Population | % Population |
| African | 181 | 1.5% |
| American | 667 | 5.4% |
| Austrian | 56 | 0.5% |
| Brazilian | 11 | 0.1% |
| British | 25 | 0.2% |
| Central American | 29 | 0.2% |
| Cherokee | 17 | 0.1% |
| Colombian | 13 | 0.1% |
| Costa Rican | 29 | 0.2% |
| Croatian | 19 | 0.2% |
| Czech | 221 | 1.8% |
| Czechoslovakian | 24 | 0.2% |
| Danish | 42 | 0.3% |
| Dutch | 138 | 1.1% |
| English | 1,227 | 10.0% |
| European | 42 | 0.3% |
| French | 346 | 2.8% |
| French Canadian | 11 | 0.1% |
| German | 2,367 | 19.3% |
| Greek | 52 | 0.4% |
| Hungarian | 22 | 0.2% |
| Irish | 1,720 | 14.0% |
| Italian | 724 | 5.9% |
| Mexican | 2,056 | 16.7% |
| Native Hawaiian | 8 | 0.1% |
| Norwegian | 112 | 0.9% |
| Polish | 307 | 2.5% |
| Portuguese | 8 | 0.1% |
| Puerto Rican | 67 | 0.5% |
| Russian | 6 | 0.1% |
| Scandinavian | 17 | 0.1% |
| Scotch-Irish | 37 | 0.3% |
| Scottish | 163 | 1.3% |
| Slavic | 26 | 0.2% |
| Slovak | 658 | 5.4% |
| South American | 13 | 0.1% |
| Spaniard | 10 | 0.1% |
| Subsaharan African | 181 | 1.5% |
| Swedish | 221 | 1.8% |
| Thai | 143 | 1.2% |
| Welsh | 77 | 0.6% |
| Yugoslavian | 11 | 0.1% | View All 42 Rows |
Immigrants in Streator
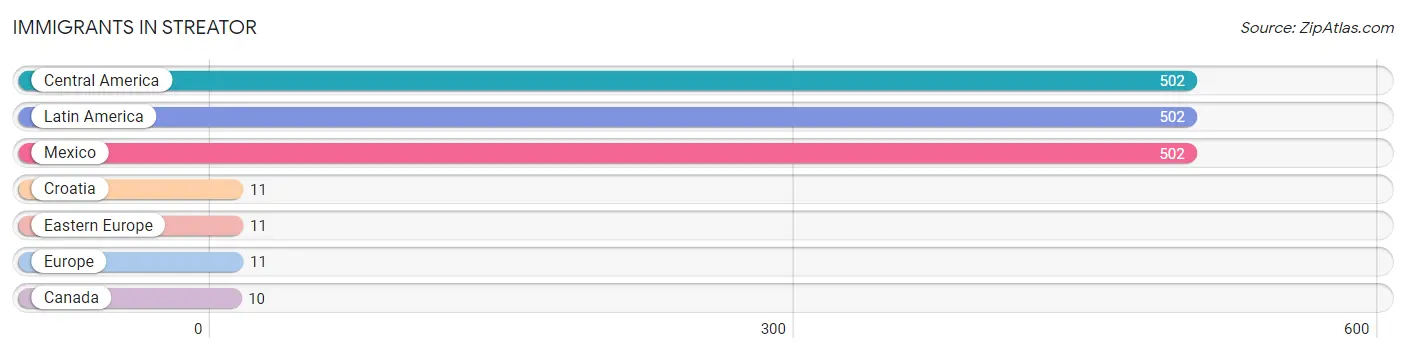
The most numerous immigrant groups reported in Streator came from Central America (502 | 4.1%), Latin America (502 | 4.1%), Mexico (502 | 4.1%), Croatia (11 | 0.1%), and Eastern Europe (11 | 0.1%), together accounting for 12.4% of all Streator residents.
| Immigration Origin | # Population | % Population |
| Canada | 10 | 0.1% |
| Central America | 502 | 4.1% |
| Croatia | 11 | 0.1% |
| Eastern Europe | 11 | 0.1% |
| Europe | 11 | 0.1% |
| Latin America | 502 | 4.1% |
| Mexico | 502 | 4.1% | View All 7 Rows |
Sex and Age in Streator
Sex and Age in Streator
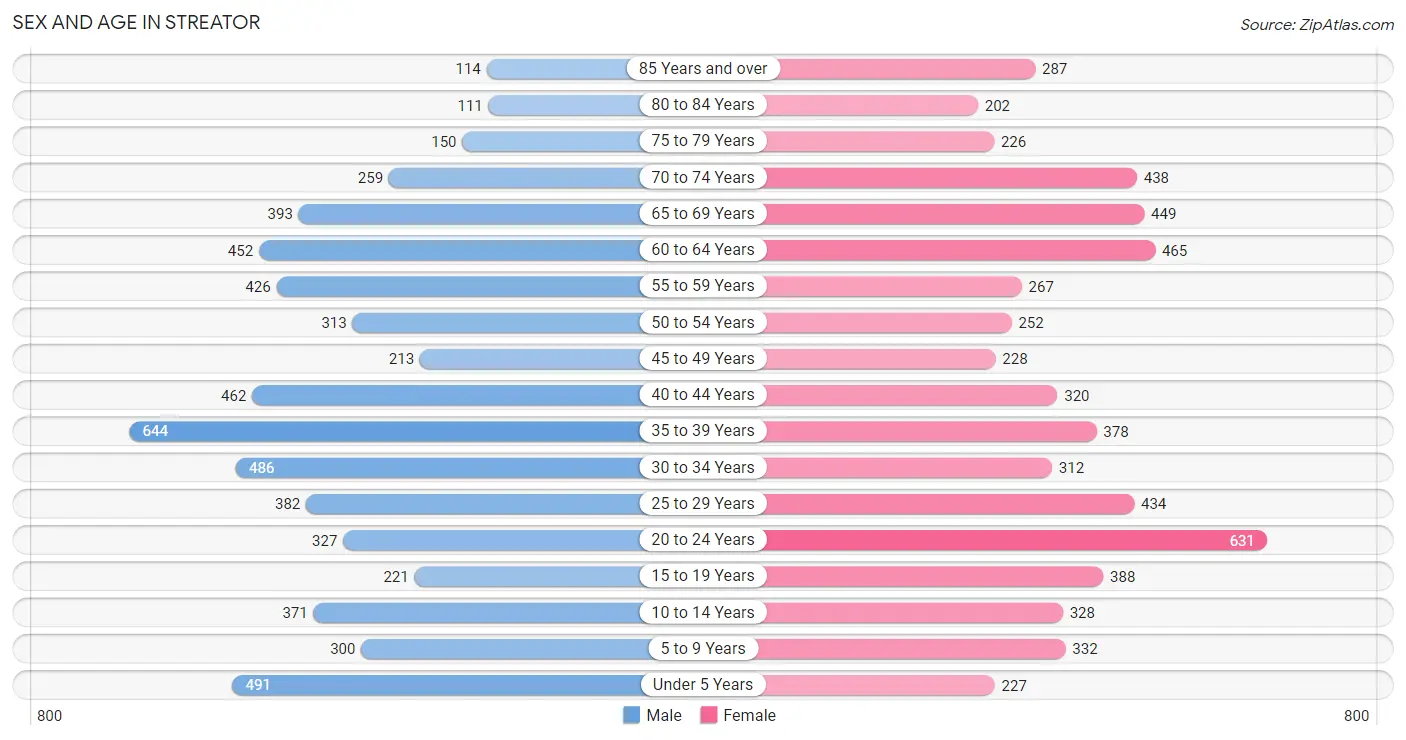
The most populous age groups in Streator are 35 to 39 Years (644 | 10.5%) for men and 20 to 24 Years (631 | 10.2%) for women.
| Age Bracket | Male | Female |
| Under 5 Years | 491 (8.0%) | 227 (3.7%) |
| 5 to 9 Years | 300 (4.9%) | 332 (5.4%) |
| 10 to 14 Years | 371 (6.1%) | 328 (5.3%) |
| 15 to 19 Years | 221 (3.6%) | 388 (6.3%) |
| 20 to 24 Years | 327 (5.3%) | 631 (10.2%) |
| 25 to 29 Years | 382 (6.2%) | 434 (7.0%) |
| 30 to 34 Years | 486 (8.0%) | 312 (5.1%) |
| 35 to 39 Years | 644 (10.5%) | 378 (6.1%) |
| 40 to 44 Years | 462 (7.6%) | 320 (5.2%) |
| 45 to 49 Years | 213 (3.5%) | 228 (3.7%) |
| 50 to 54 Years | 313 (5.1%) | 252 (4.1%) |
| 55 to 59 Years | 426 (7.0%) | 267 (4.3%) |
| 60 to 64 Years | 452 (7.4%) | 465 (7.5%) |
| 65 to 69 Years | 393 (6.4%) | 449 (7.3%) |
| 70 to 74 Years | 259 (4.2%) | 438 (7.1%) |
| 75 to 79 Years | 150 (2.5%) | 226 (3.7%) |
| 80 to 84 Years | 111 (1.8%) | 202 (3.3%) |
| 85 Years and over | 114 (1.9%) | 287 (4.7%) |
| Total | 6,115 (100.0%) | 6,164 (100.0%) |
Families and Households in Streator
Median Family Size in Streator
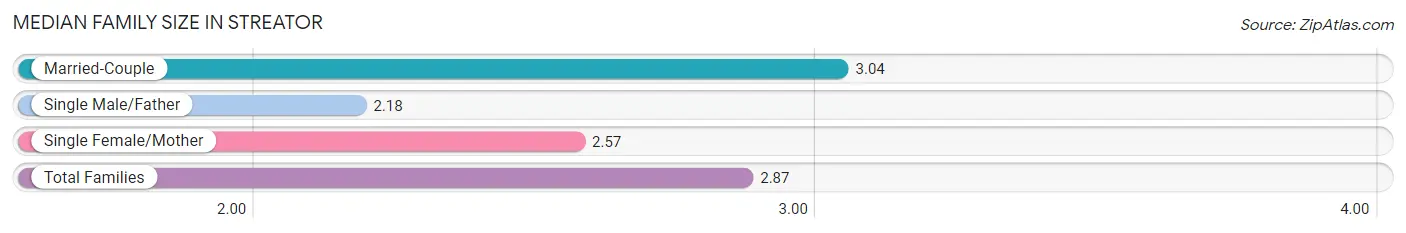
The median family size in Streator is 2.87 persons per family, with married-couple families (2,007 | 66.7%) accounting for the largest median family size of 3.04 persons per family. On the other hand, single male/father families (142 | 4.7%) represent the smallest median family size with 2.18 persons per family.
| Family Type | # Families | Family Size |
| Married-Couple | 2,007 (66.7%) | 3.04 |
| Single Male/Father | 142 (4.7%) | 2.18 |
| Single Female/Mother | 862 (28.6%) | 2.57 |
| Total Families | 3,011 (100.0%) | 2.87 |
Median Household Size in Streator
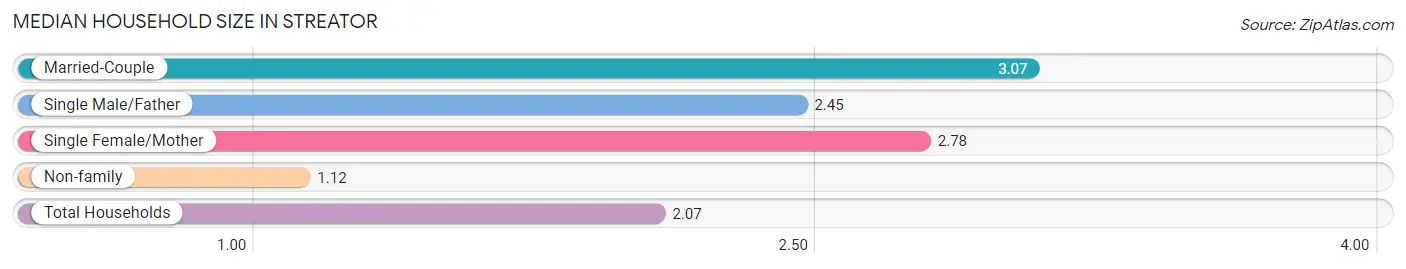
The median household size in Streator is 2.07 persons per household, with married-couple households (2,007 | 34.3%) accounting for the largest median household size of 3.07 persons per household. non-family households (2,834 | 48.5%) represent the smallest median household size with 1.12 persons per household.
| Household Type | # Households | Household Size |
| Married-Couple | 2,007 (34.3%) | 3.07 |
| Single Male/Father | 142 (2.4%) | 2.45 |
| Single Female/Mother | 862 (14.7%) | 2.78 |
| Non-family | 2,834 (48.5%) | 1.12 |
| Total Households | 5,845 (100.0%) | 2.07 |
Household Size by Marriage Status in Streator
Out of a total of 5,845 households in Streator, 3,011 (51.5%) are family households, while 2,834 (48.5%) are nonfamily households. The most numerous type of family households are 2-person households, comprising 1,485, and the most common type of nonfamily households are 1-person households, comprising 2,552.
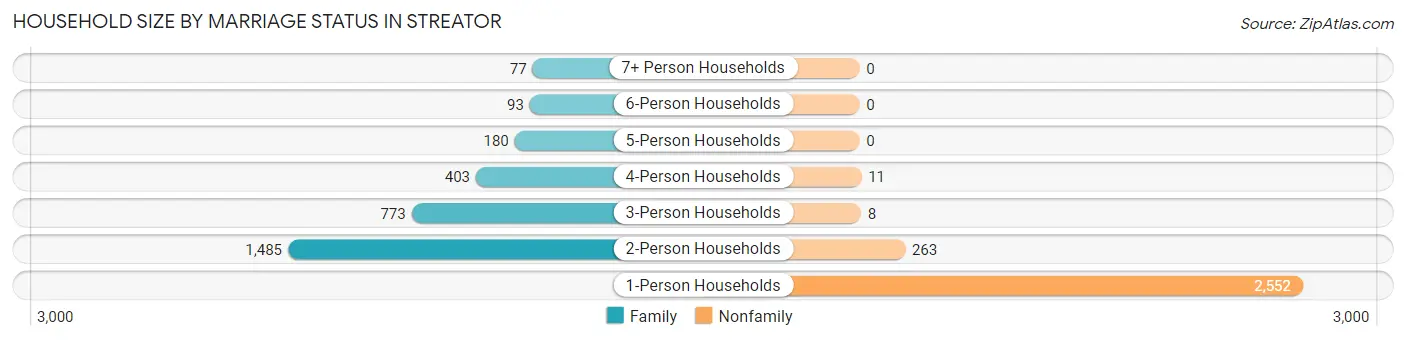
| Household Size | Family Households | Nonfamily Households |
| 1-Person Households | - | 2,552 (43.7%) |
| 2-Person Households | 1,485 (25.4%) | 263 (4.5%) |
| 3-Person Households | 773 (13.2%) | 8 (0.1%) |
| 4-Person Households | 403 (6.9%) | 11 (0.2%) |
| 5-Person Households | 180 (3.1%) | 0 (0.0%) |
| 6-Person Households | 93 (1.6%) | 0 (0.0%) |
| 7+ Person Households | 77 (1.3%) | 0 (0.0%) |
| Total | 3,011 (51.5%) | 2,834 (48.5%) |
Female Fertility in Streator
Fertility by Age in Streator
Average fertility rate in Streator is 106.0 births per 1,000 women. Women in the age bracket of 20 to 34 years have the highest fertility rate with 190.0 births per 1,000 women. Women in the age bracket of 20 to 34 years acount for 89.4% of all women with births.
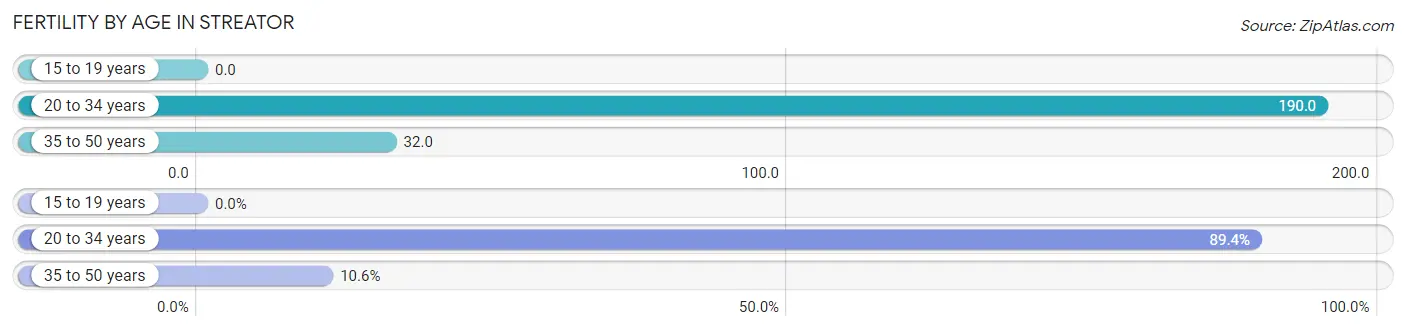
| Age Bracket | Women with Births | Births / 1,000 Women |
| 15 to 19 years | 0 (0.0%) | 0.0 |
| 20 to 34 years | 261 (89.4%) | 190.0 |
| 35 to 50 years | 31 (10.6%) | 32.0 |
| Total | 292 (100.0%) | 106.0 |
Fertility by Age by Marriage Status in Streator
41.1% of women with births (292) in Streator are married. The highest percentage of unmarried women with births falls into 20 to 34 years age bracket with 65.9% of them unmarried at the time of birth, while the lowest percentage of unmarried women with births belong to 35 to 50 years age bracket with 0.0% of them unmarried.
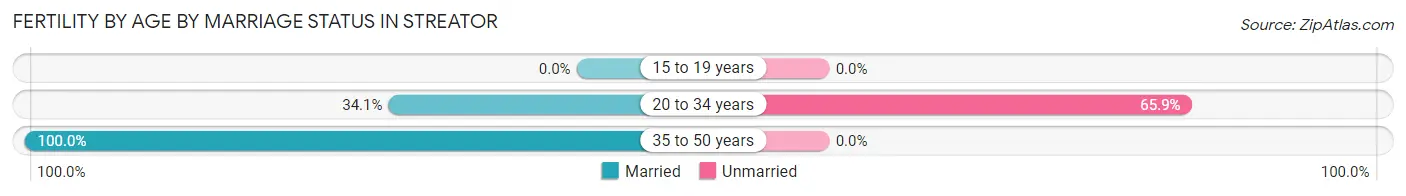
| Age Bracket | Married | Unmarried |
| 15 to 19 years | 0 (0.0%) | 0 (0.0%) |
| 20 to 34 years | 89 (34.1%) | 172 (65.9%) |
| 35 to 50 years | 31 (100.0%) | 0 (0.0%) |
| Total | 120 (41.1%) | 172 (58.9%) |
Fertility by Education in Streator
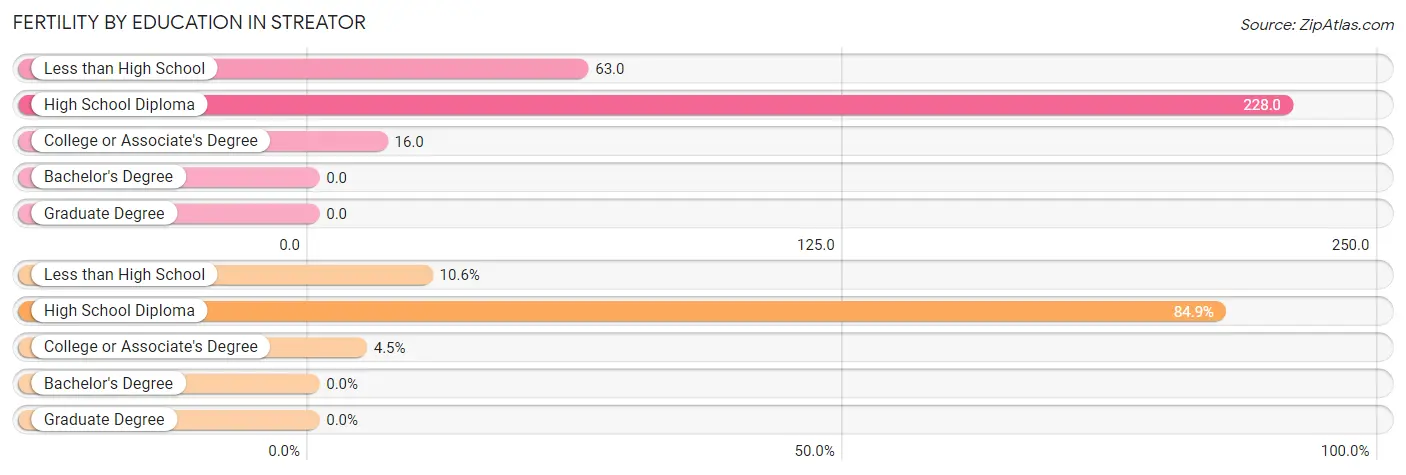
| Educational Attainment | Women with Births | Births / 1,000 Women |
| Less than High School | 31 (10.6%) | 63.0 |
| High School Diploma | 248 (84.9%) | 228.0 |
| College or Associate's Degree | 13 (4.4%) | 16.0 |
| Bachelor's Degree | 0 (0.0%) | 0.0 |
| Graduate Degree | 0 (0.0%) | 0.0 |
| Total | 292 (100.0%) | 106.0 |
Fertility by Education by Marriage Status in Streator
58.9% of women with births in Streator are unmarried. Women with the educational attainment of high school diploma are most likely to be married with 48.4% of them married at childbirth, while women with the educational attainment of less than high school are least likely to be married with 100.0% of them unmarried at childbirth.
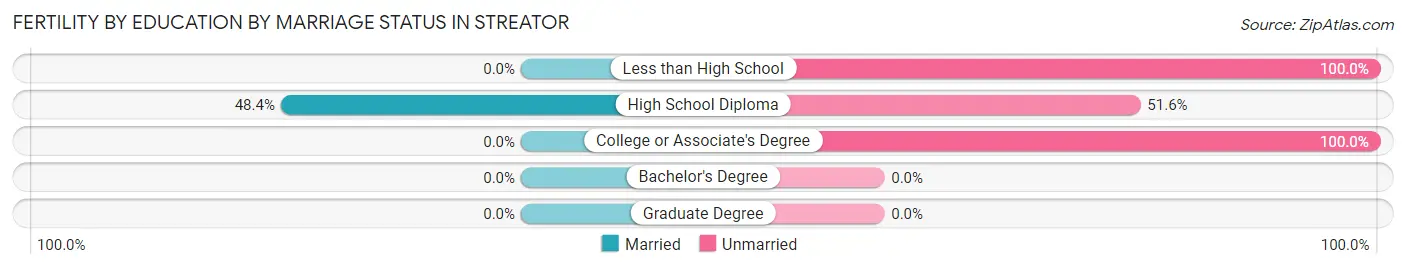
| Educational Attainment | Married | Unmarried |
| Less than High School | 0 (0.0%) | 31 (100.0%) |
| High School Diploma | 120 (48.4%) | 128 (51.6%) |
| College or Associate's Degree | 0 (0.0%) | 13 (100.0%) |
| Bachelor's Degree | 0 (0.0%) | 0 (0.0%) |
| Graduate Degree | 0 (0.0%) | 0 (0.0%) |
| Total | 120 (41.1%) | 172 (58.9%) |
Employment Characteristics in Streator
Employment by Class of Employer in Streator
Among the 5,345 employed individuals in Streator, private company employees (3,991 | 74.7%), state government employees (382 | 7.1%), and local government employees (368 | 6.9%) make up the most common classes of employment.
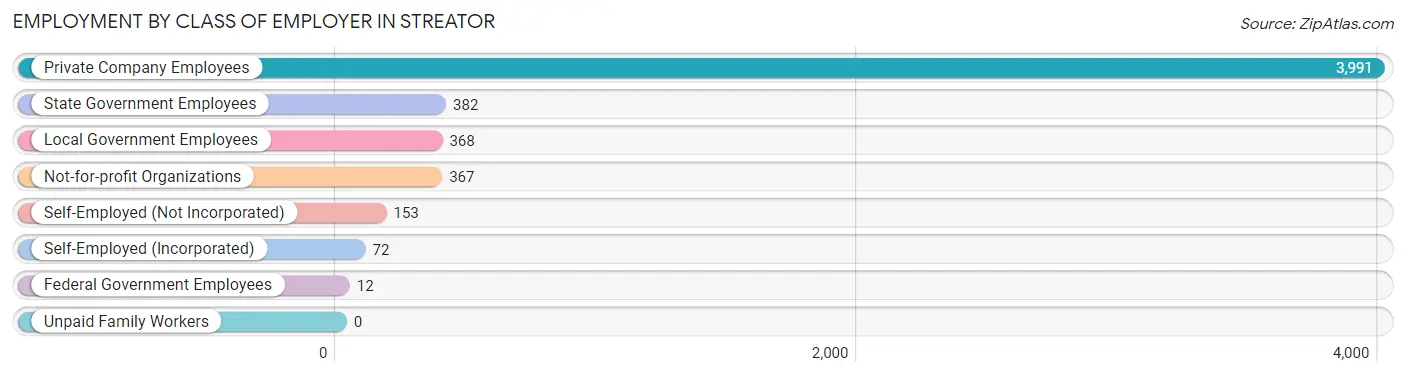
| Employer Class | # Employees | % Employees |
| Private Company Employees | 3,991 | 74.7% |
| Self-Employed (Incorporated) | 72 | 1.3% |
| Self-Employed (Not Incorporated) | 153 | 2.9% |
| Not-for-profit Organizations | 367 | 6.9% |
| Local Government Employees | 368 | 6.9% |
| State Government Employees | 382 | 7.1% |
| Federal Government Employees | 12 | 0.2% |
| Unpaid Family Workers | 0 | 0.0% |
| Total | 5,345 | 100.0% |
Employment Status by Age in Streator
According to the labor force statistics for Streator, out of the total population over 16 years of age (10,011), 61.1% or 6,117 individuals are in the labor force, with 9.1% or 557 of them unemployed. The age group with the highest labor force participation rate is 25 to 29 years, with 95.1% or 776 individuals in the labor force. Within the labor force, the 55 to 59 years age range has the highest percentage of unemployed individuals, with 22.3% or 99 of them being unemployed.
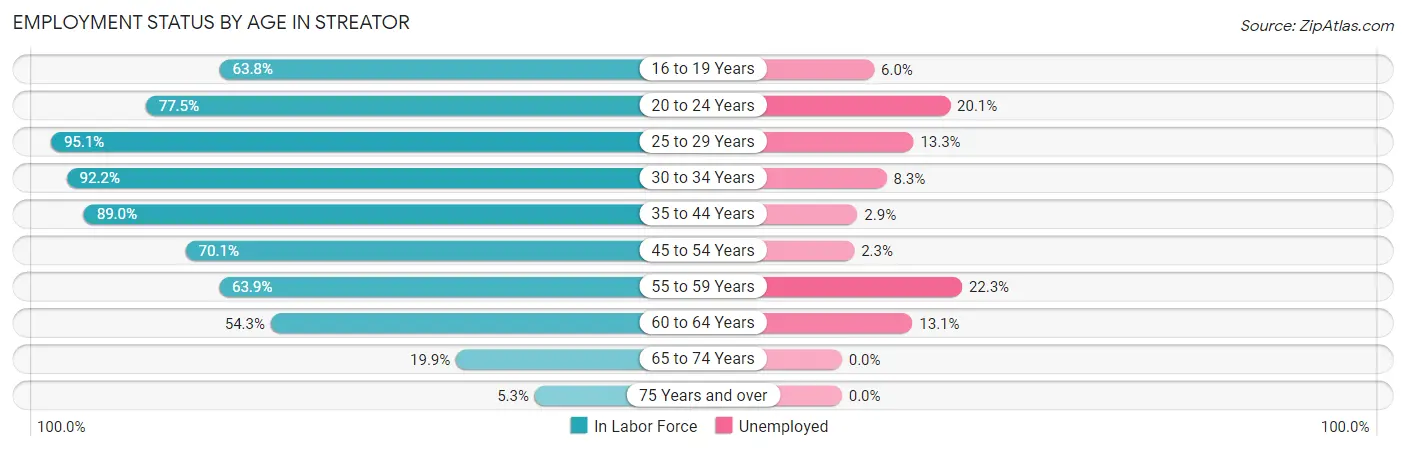
| Age Bracket | In Labor Force | Unemployed |
| 16 to 19 Years | 249 (63.8%) | 15 (6.0%) |
| 20 to 24 Years | 742 (77.5%) | 149 (20.1%) |
| 25 to 29 Years | 776 (95.1%) | 103 (13.3%) |
| 30 to 34 Years | 736 (92.2%) | 61 (8.3%) |
| 35 to 44 Years | 1,606 (89.0%) | 47 (2.9%) |
| 45 to 54 Years | 705 (70.1%) | 16 (2.3%) |
| 55 to 59 Years | 443 (63.9%) | 99 (22.3%) |
| 60 to 64 Years | 498 (54.3%) | 65 (13.1%) |
| 65 to 74 Years | 306 (19.9%) | 0 (0.0%) |
| 75 Years and over | 58 (5.3%) | 0 (0.0%) |
| Total | 6,117 (61.1%) | 557 (9.1%) |
Employment Status by Educational Attainment in Streator
According to labor force statistics for Streator, 79.0% of individuals (4,767) out of the total population between 25 and 64 years of age (6,034) are in the labor force, with 8.2% or 391 of them being unemployed. The group with the highest labor force participation rate are those with the educational attainment of college / associate degree, with 85.4% or 1,756 individuals in the labor force. Within the labor force, individuals with less than high school education have the highest percentage of unemployment, with 20.6% or 138 of them being unemployed.
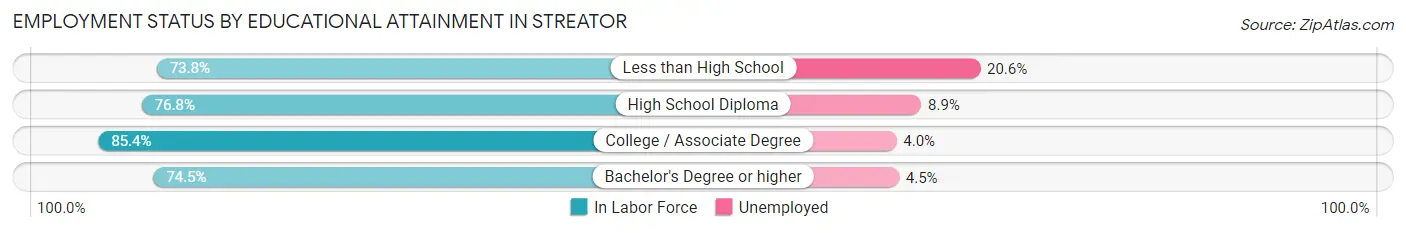
| Educational Attainment | In Labor Force | Unemployed |
| Less than High School | 671 (73.8%) | 187 (20.6%) |
| High School Diploma | 1,737 (76.8%) | 201 (8.9%) |
| College / Associate Degree | 1,756 (85.4%) | 82 (4.0%) |
| Bachelor's Degree or higher | 601 (74.5%) | 36 (4.5%) |
| Total | 4,767 (79.0%) | 495 (8.2%) |
Employment Occupations by Sex in Streator
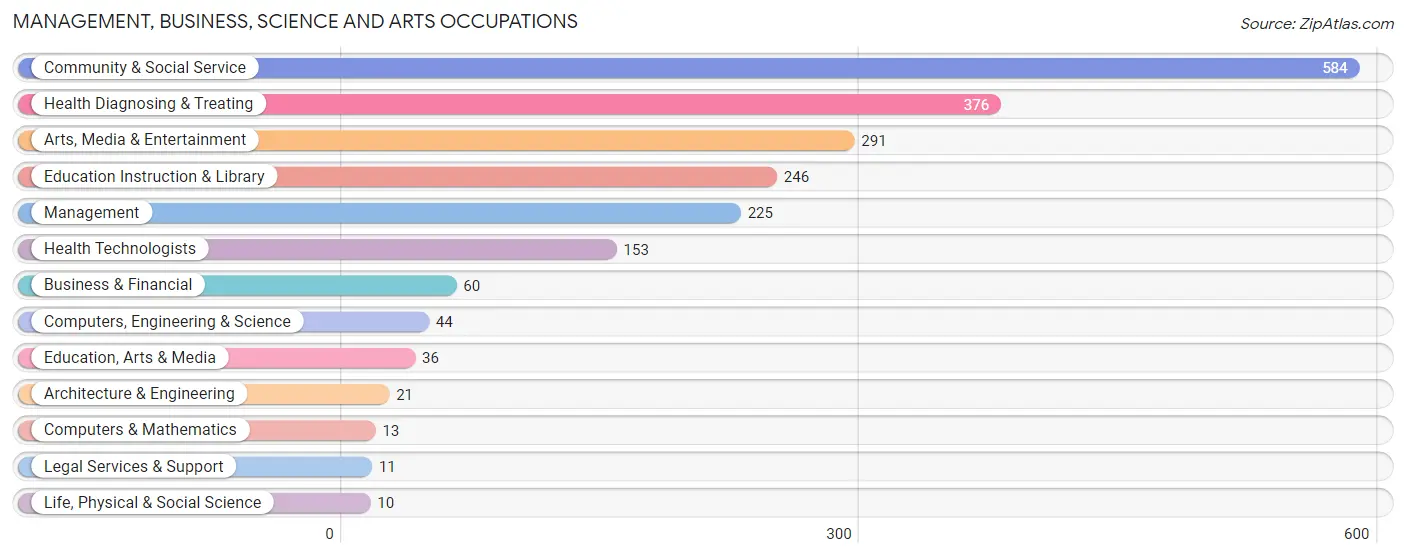
Management, Business, Science and Arts Occupations
The most common Management, Business, Science and Arts occupations in Streator are Community & Social Service (584 | 10.5%), Health Diagnosing & Treating (376 | 6.8%), Arts, Media & Entertainment (291 | 5.2%), Education Instruction & Library (246 | 4.4%), and Management (225 | 4.0%).
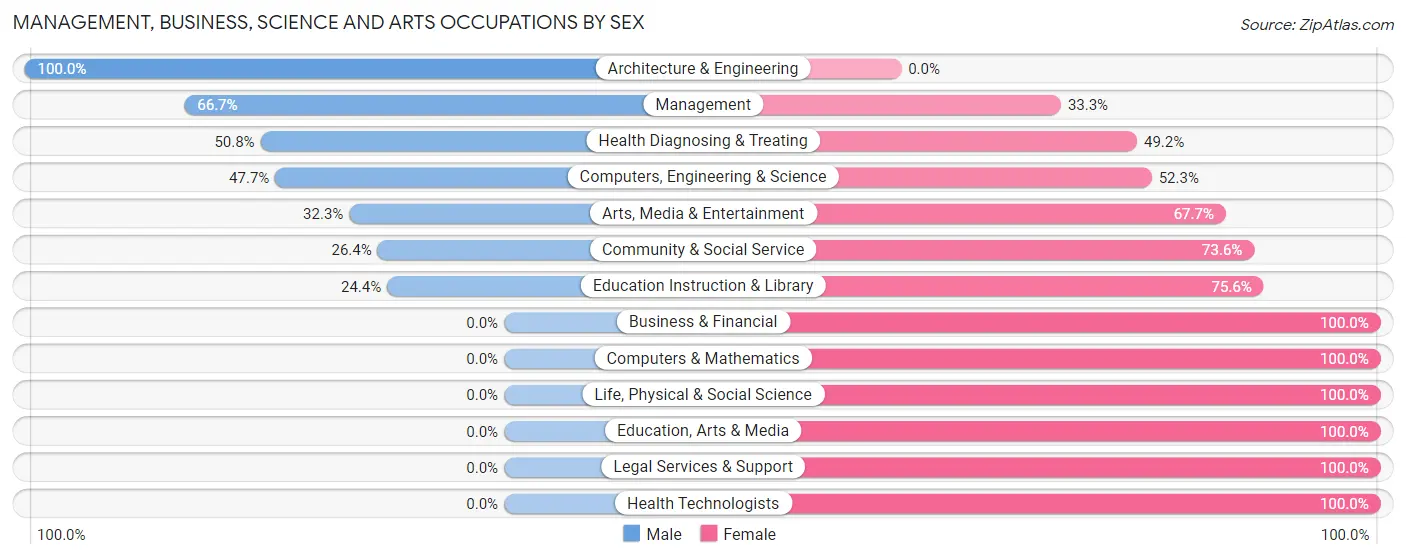
Management, Business, Science and Arts Occupations by Sex
Within the Management, Business, Science and Arts occupations in Streator, the most male-oriented occupations are Architecture & Engineering (100.0%), Management (66.7%), and Health Diagnosing & Treating (50.8%), while the most female-oriented occupations are Business & Financial (100.0%), Computers & Mathematics (100.0%), and Life, Physical & Social Science (100.0%).
| Occupation | Male | Female |
| Management | 150 (66.7%) | 75 (33.3%) |
| Business & Financial | 0 (0.0%) | 60 (100.0%) |
| Computers, Engineering & Science | 21 (47.7%) | 23 (52.3%) |
| Computers & Mathematics | 0 (0.0%) | 13 (100.0%) |
| Architecture & Engineering | 21 (100.0%) | 0 (0.0%) |
| Life, Physical & Social Science | 0 (0.0%) | 10 (100.0%) |
| Community & Social Service | 154 (26.4%) | 430 (73.6%) |
| Education, Arts & Media | 0 (0.0%) | 36 (100.0%) |
| Legal Services & Support | 0 (0.0%) | 11 (100.0%) |
| Education Instruction & Library | 60 (24.4%) | 186 (75.6%) |
| Arts, Media & Entertainment | 94 (32.3%) | 197 (67.7%) |
| Health Diagnosing & Treating | 191 (50.8%) | 185 (49.2%) |
| Health Technologists | 0 (0.0%) | 153 (100.0%) |
| Total (Category) | 516 (40.0%) | 773 (60.0%) |
| Total (Overall) | 3,017 (54.2%) | 2,549 (45.8%) |
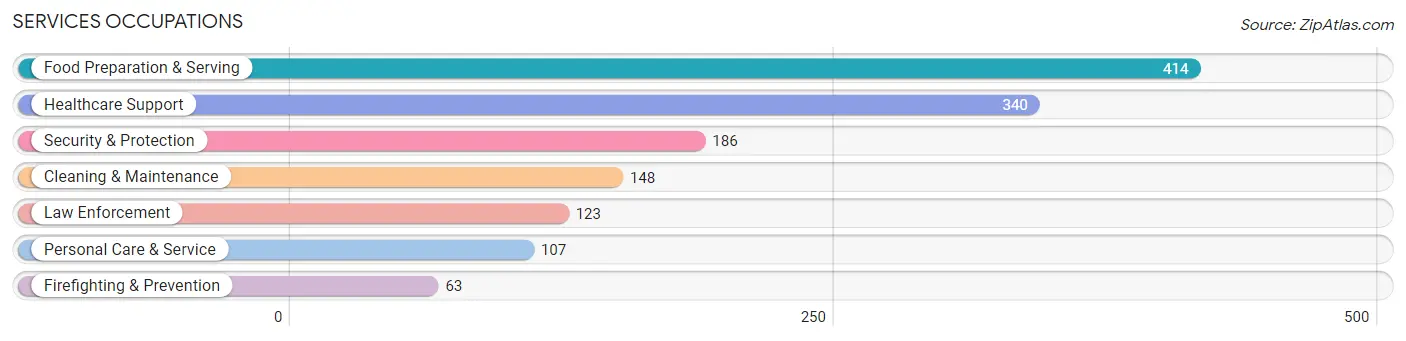
Services Occupations
The most common Services occupations in Streator are Food Preparation & Serving (414 | 7.4%), Healthcare Support (340 | 6.1%), Security & Protection (186 | 3.3%), Cleaning & Maintenance (148 | 2.7%), and Law Enforcement (123 | 2.2%).
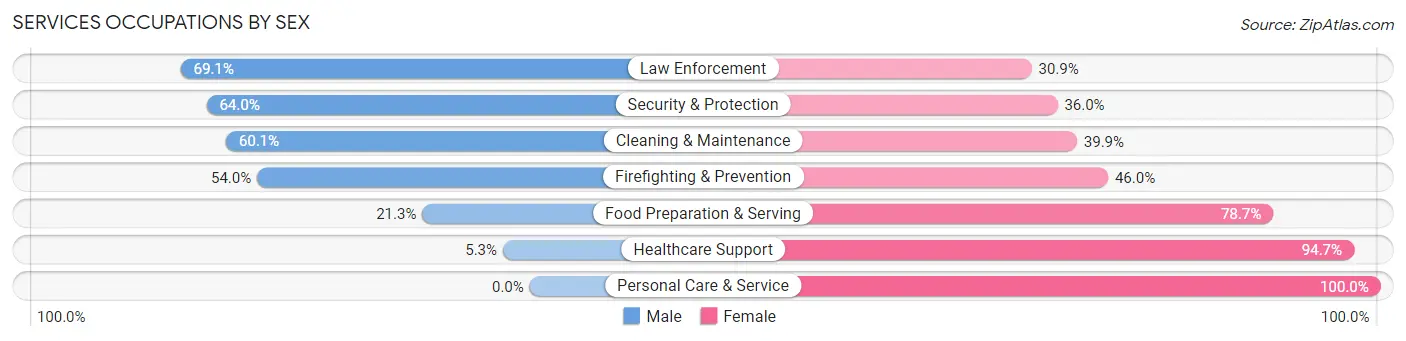
Services Occupations by Sex
Within the Services occupations in Streator, the most male-oriented occupations are Law Enforcement (69.1%), Security & Protection (64.0%), and Cleaning & Maintenance (60.1%), while the most female-oriented occupations are Personal Care & Service (100.0%), Healthcare Support (94.7%), and Food Preparation & Serving (78.7%).
| Occupation | Male | Female |
| Healthcare Support | 18 (5.3%) | 322 (94.7%) |
| Security & Protection | 119 (64.0%) | 67 (36.0%) |
| Firefighting & Prevention | 34 (54.0%) | 29 (46.0%) |
| Law Enforcement | 85 (69.1%) | 38 (30.9%) |
| Food Preparation & Serving | 88 (21.3%) | 326 (78.7%) |
| Cleaning & Maintenance | 89 (60.1%) | 59 (39.9%) |
| Personal Care & Service | 0 (0.0%) | 107 (100.0%) |
| Total (Category) | 314 (26.3%) | 881 (73.7%) |
| Total (Overall) | 3,017 (54.2%) | 2,549 (45.8%) |
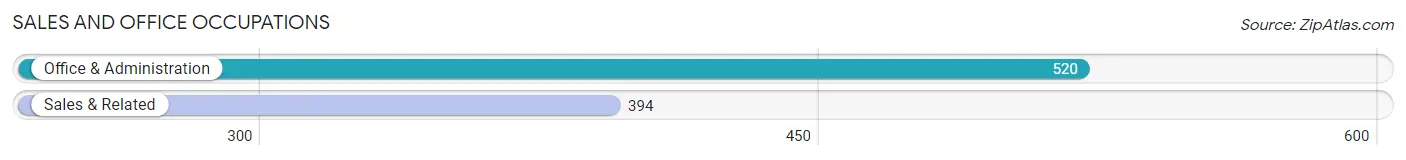
Sales and Office Occupations
The most common Sales and Office occupations in Streator are Office & Administration (520 | 9.3%), and Sales & Related (394 | 7.1%).
Sales and Office Occupations by Sex
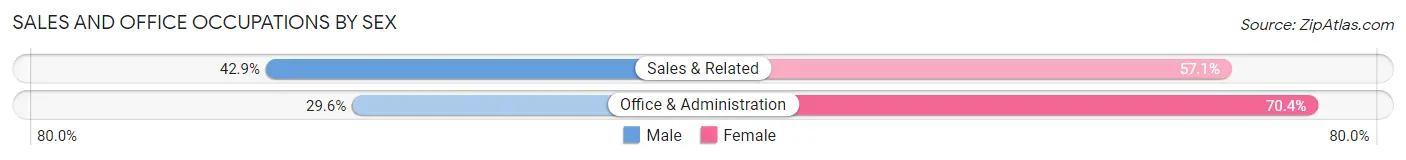
| Occupation | Male | Female |
| Sales & Related | 169 (42.9%) | 225 (57.1%) |
| Office & Administration | 154 (29.6%) | 366 (70.4%) |
| Total (Category) | 323 (35.3%) | 591 (64.7%) |
| Total (Overall) | 3,017 (54.2%) | 2,549 (45.8%) |
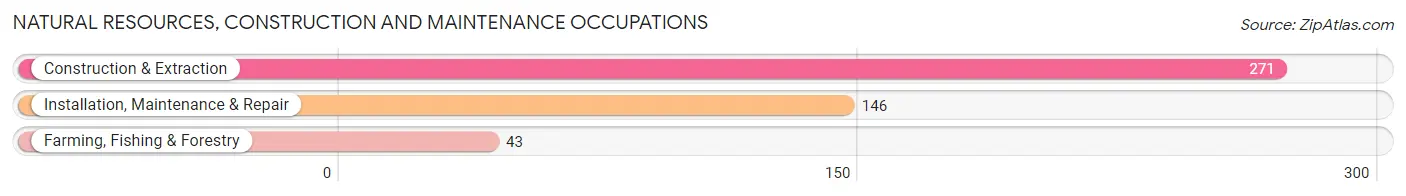
Natural Resources, Construction and Maintenance Occupations
The most common Natural Resources, Construction and Maintenance occupations in Streator are Construction & Extraction (271 | 4.9%), Installation, Maintenance & Repair (146 | 2.6%), and Farming, Fishing & Forestry (43 | 0.8%).
Natural Resources, Construction and Maintenance Occupations by Sex
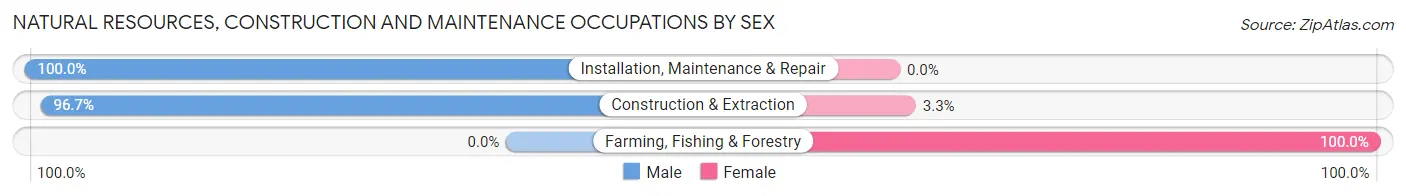
| Occupation | Male | Female |
| Farming, Fishing & Forestry | 0 (0.0%) | 43 (100.0%) |
| Construction & Extraction | 262 (96.7%) | 9 (3.3%) |
| Installation, Maintenance & Repair | 146 (100.0%) | 0 (0.0%) |
| Total (Category) | 408 (88.7%) | 52 (11.3%) |
| Total (Overall) | 3,017 (54.2%) | 2,549 (45.8%) |
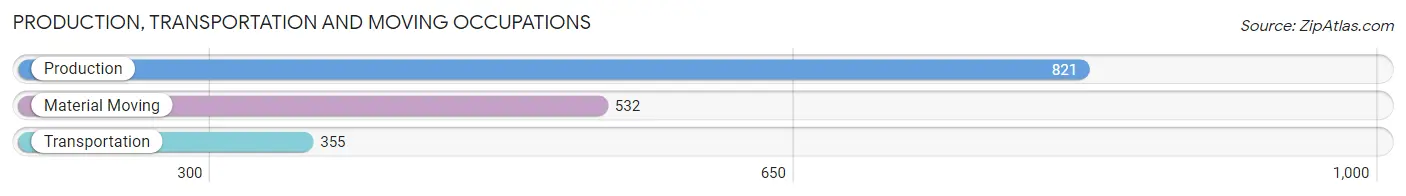
Production, Transportation and Moving Occupations
The most common Production, Transportation and Moving occupations in Streator are Production (821 | 14.7%), Material Moving (532 | 9.6%), and Transportation (355 | 6.4%).
Production, Transportation and Moving Occupations by Sex
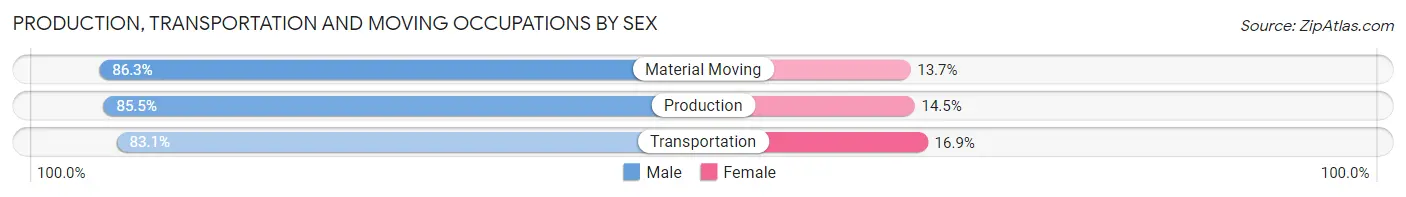
| Occupation | Male | Female |
| Production | 702 (85.5%) | 119 (14.5%) |
| Transportation | 295 (83.1%) | 60 (16.9%) |
| Material Moving | 459 (86.3%) | 73 (13.7%) |
| Total (Category) | 1,456 (85.3%) | 252 (14.7%) |
| Total (Overall) | 3,017 (54.2%) | 2,549 (45.8%) |
Employment Industries by Sex in Streator
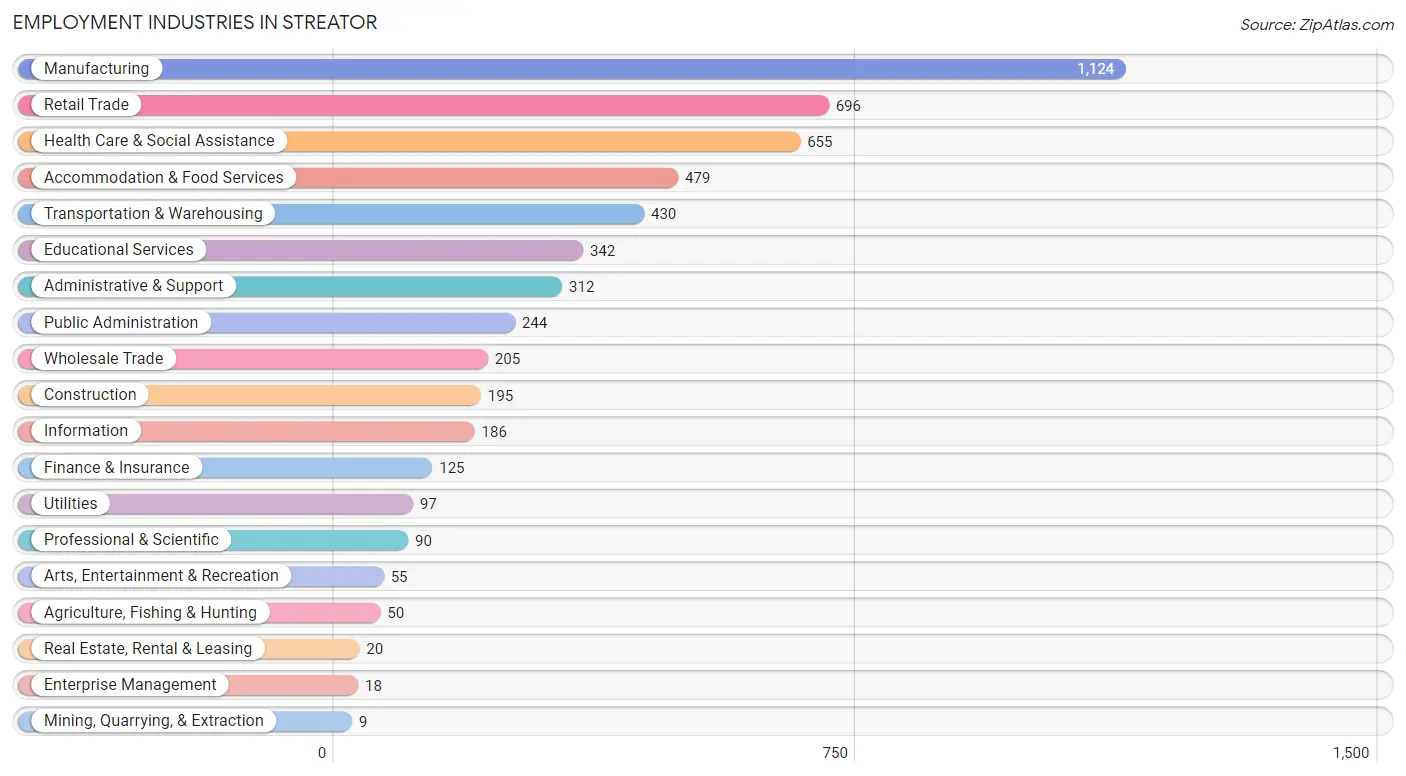
Employment Industries in Streator
The major employment industries in Streator include Manufacturing (1,124 | 20.2%), Retail Trade (696 | 12.5%), Health Care & Social Assistance (655 | 11.8%), Accommodation & Food Services (479 | 8.6%), and Transportation & Warehousing (430 | 7.7%).
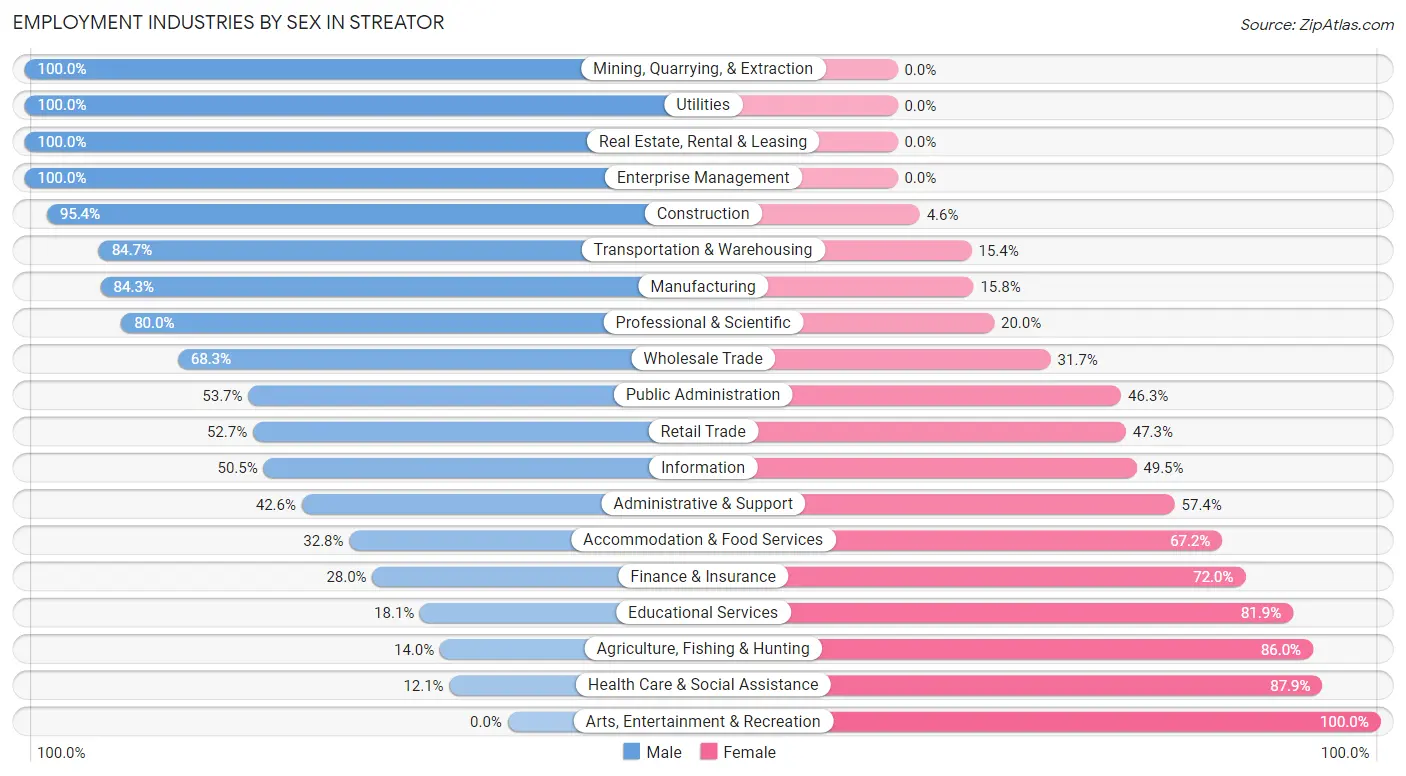
Employment Industries by Sex in Streator
The Streator industries that see more men than women are Mining, Quarrying, & Extraction (100.0%), Utilities (100.0%), and Real Estate, Rental & Leasing (100.0%), whereas the industries that tend to have a higher number of women are Arts, Entertainment & Recreation (100.0%), Health Care & Social Assistance (87.9%), and Agriculture, Fishing & Hunting (86.0%).
| Industry | Male | Female |
| Agriculture, Fishing & Hunting | 7 (14.0%) | 43 (86.0%) |
| Mining, Quarrying, & Extraction | 9 (100.0%) | 0 (0.0%) |
| Construction | 186 (95.4%) | 9 (4.6%) |
| Manufacturing | 947 (84.3%) | 177 (15.8%) |
| Wholesale Trade | 140 (68.3%) | 65 (31.7%) |
| Retail Trade | 367 (52.7%) | 329 (47.3%) |
| Transportation & Warehousing | 364 (84.7%) | 66 (15.3%) |
| Utilities | 97 (100.0%) | 0 (0.0%) |
| Information | 94 (50.5%) | 92 (49.5%) |
| Finance & Insurance | 35 (28.0%) | 90 (72.0%) |
| Real Estate, Rental & Leasing | 20 (100.0%) | 0 (0.0%) |
| Professional & Scientific | 72 (80.0%) | 18 (20.0%) |
| Enterprise Management | 18 (100.0%) | 0 (0.0%) |
| Administrative & Support | 133 (42.6%) | 179 (57.4%) |
| Educational Services | 62 (18.1%) | 280 (81.9%) |
| Health Care & Social Assistance | 79 (12.1%) | 576 (87.9%) |
| Arts, Entertainment & Recreation | 0 (0.0%) | 55 (100.0%) |
| Accommodation & Food Services | 157 (32.8%) | 322 (67.2%) |
| Public Administration | 131 (53.7%) | 113 (46.3%) |
| Total | 3,017 (54.2%) | 2,549 (45.8%) |
Education in Streator
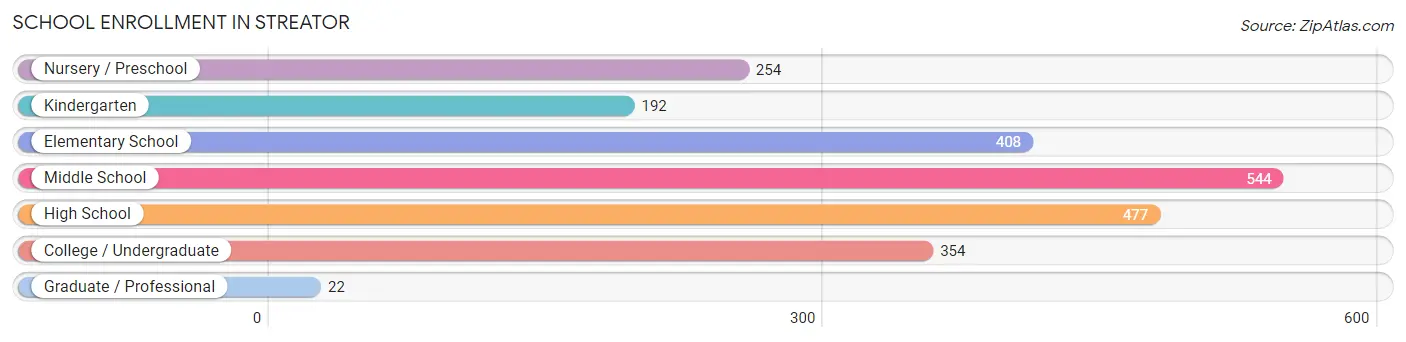
School Enrollment in Streator
The most common levels of schooling among the 2,251 students in Streator are middle school (544 | 24.2%), high school (477 | 21.2%), and elementary school (408 | 18.1%).
| School Level | # Students | % Students |
| Nursery / Preschool | 254 | 11.3% |
| Kindergarten | 192 | 8.5% |
| Elementary School | 408 | 18.1% |
| Middle School | 544 | 24.2% |
| High School | 477 | 21.2% |
| College / Undergraduate | 354 | 15.7% |
| Graduate / Professional | 22 | 1.0% |
| Total | 2,251 | 100.0% |
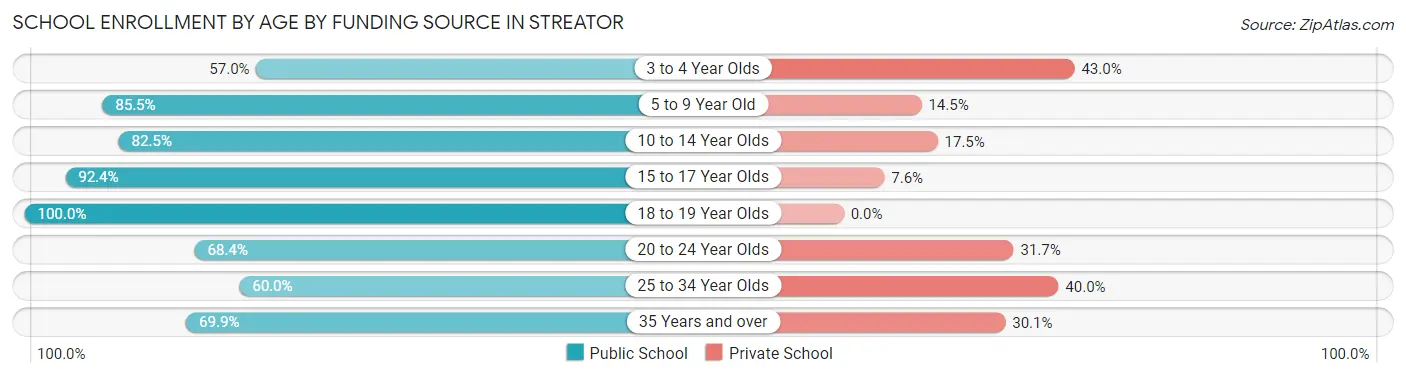
School Enrollment by Age by Funding Source in Streator
Out of a total of 2,251 students who are enrolled in schools in Streator, 425 (18.9%) attend a private institution, while the remaining 1,826 (81.1%) are enrolled in public schools. The age group of 3 to 4 year olds has the highest likelihood of being enrolled in private schools, with 95 (43.0% in the age bracket) enrolled. Conversely, the age group of 18 to 19 year olds has the lowest likelihood of being enrolled in a private school, with 130 (100.0% in the age bracket) attending a public institution.
| Age Bracket | Public School | Private School |
| 3 to 4 Year Olds | 126 (57.0%) | 95 (43.0%) |
| 5 to 9 Year Old | 490 (85.5%) | 83 (14.5%) |
| 10 to 14 Year Olds | 528 (82.5%) | 112 (17.5%) |
| 15 to 17 Year Olds | 329 (92.4%) | 27 (7.6%) |
| 18 to 19 Year Olds | 130 (100.0%) | 0 (0.0%) |
| 20 to 24 Year Olds | 108 (68.3%) | 50 (31.7%) |
| 25 to 34 Year Olds | 42 (60.0%) | 28 (40.0%) |
| 35 Years and over | 72 (69.9%) | 31 (30.1%) |
| Total | 1,826 (81.1%) | 425 (18.9%) |
Educational Attainment by Field of Study in Streator
Education (263 | 22.0%), science & technology (211 | 17.7%), communications (177 | 14.8%), arts & humanities (118 | 9.9%), and business (96 | 8.0%) are the most common fields of study among 1,195 individuals in Streator who have obtained a bachelor's degree or higher.
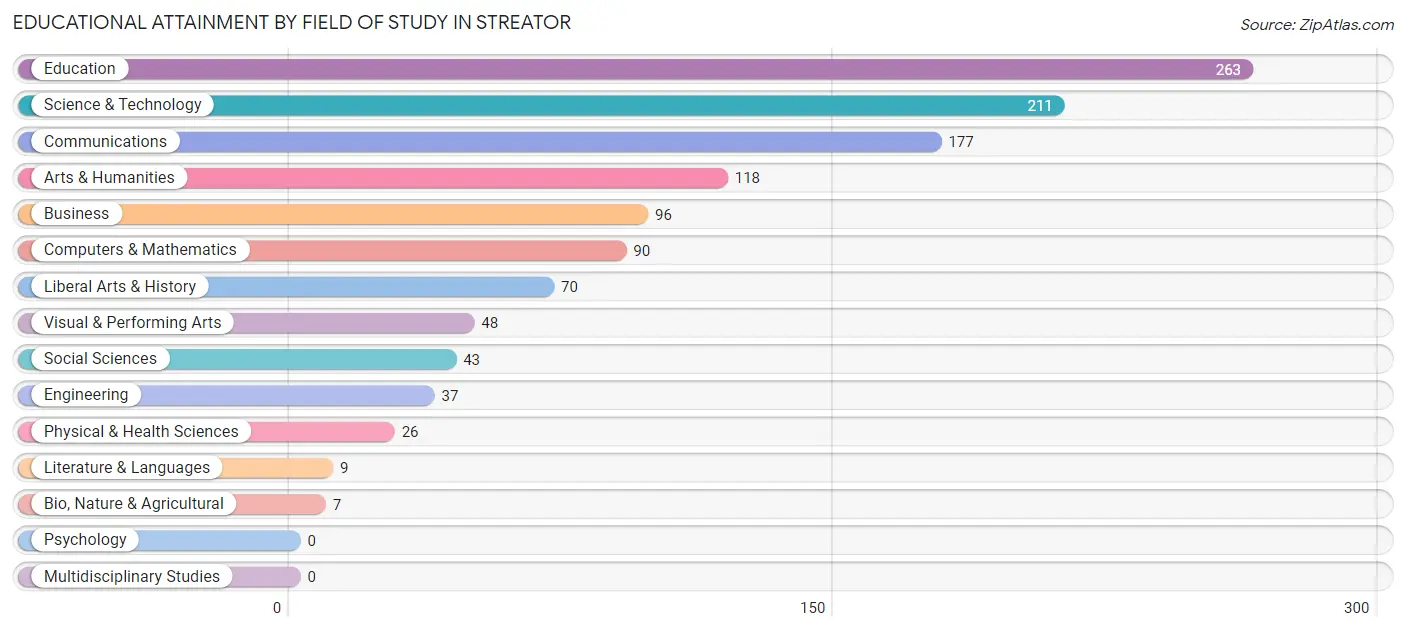
| Field of Study | # Graduates | % Graduates |
| Computers & Mathematics | 90 | 7.5% |
| Bio, Nature & Agricultural | 7 | 0.6% |
| Physical & Health Sciences | 26 | 2.2% |
| Psychology | 0 | 0.0% |
| Social Sciences | 43 | 3.6% |
| Engineering | 37 | 3.1% |
| Multidisciplinary Studies | 0 | 0.0% |
| Science & Technology | 211 | 17.7% |
| Business | 96 | 8.0% |
| Education | 263 | 22.0% |
| Literature & Languages | 9 | 0.7% |
| Liberal Arts & History | 70 | 5.9% |
| Visual & Performing Arts | 48 | 4.0% |
| Communications | 177 | 14.8% |
| Arts & Humanities | 118 | 9.9% |
| Total | 1,195 | 100.0% |
Transportation & Commute in Streator
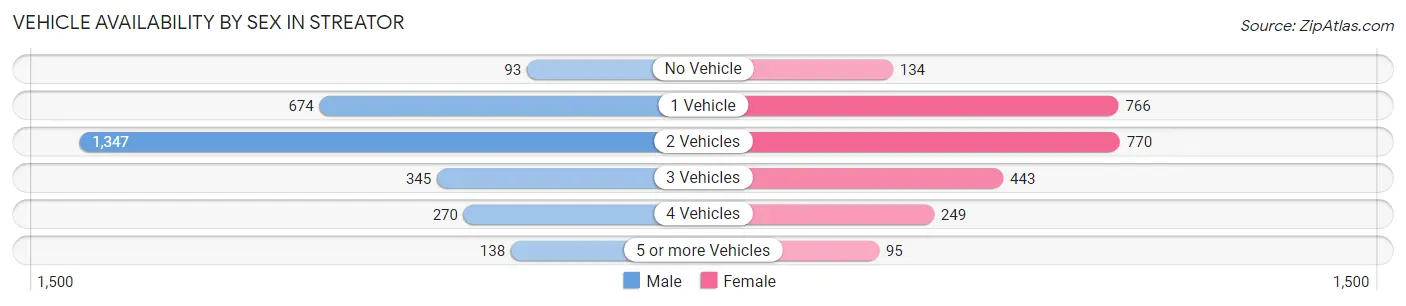
Vehicle Availability by Sex in Streator
The most prevalent vehicle ownership categories in Streator are males with 2 vehicles (1,347, accounting for 47.0%) and females with 2 vehicles (770, making up 54.8%).
| Vehicles Available | Male | Female |
| No Vehicle | 93 (3.2%) | 134 (5.4%) |
| 1 Vehicle | 674 (23.5%) | 766 (31.2%) |
| 2 Vehicles | 1,347 (47.0%) | 770 (31.3%) |
| 3 Vehicles | 345 (12.0%) | 443 (18.0%) |
| 4 Vehicles | 270 (9.4%) | 249 (10.1%) |
| 5 or more Vehicles | 138 (4.8%) | 95 (3.9%) |
| Total | 2,867 (100.0%) | 2,457 (100.0%) |
Commute Time in Streator
The most frequently occuring commute durations in Streator are 5 to 9 minutes (1,357 commuters, 26.5%), 30 to 34 minutes (862 commuters, 16.8%), and 10 to 14 minutes (764 commuters, 14.9%).
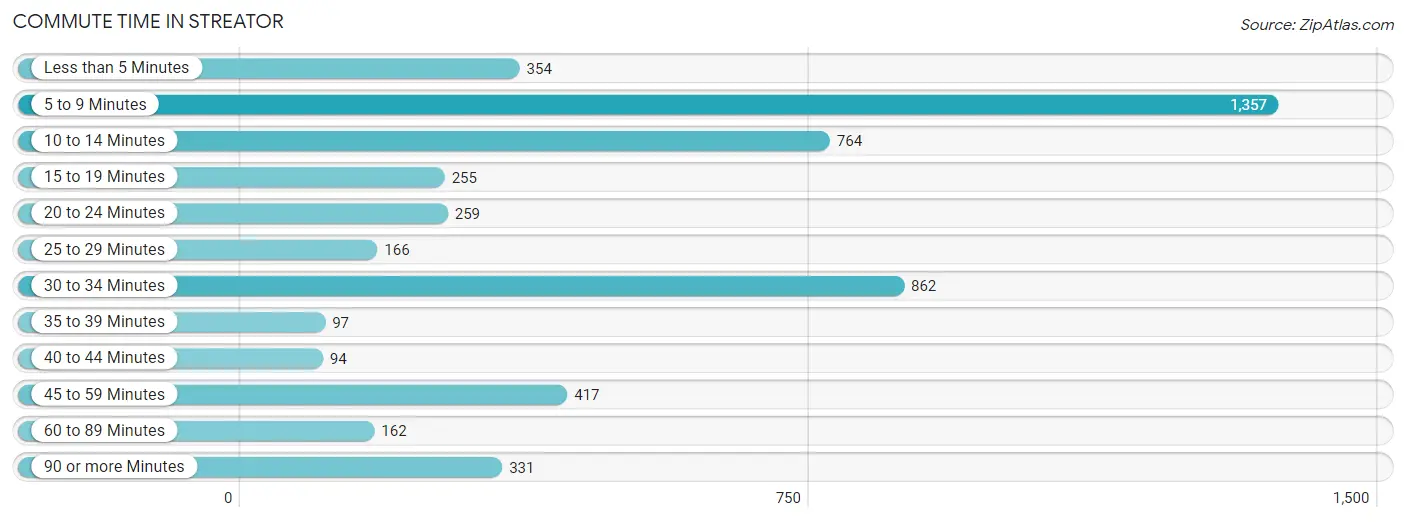
| Commute Time | # Commuters | % Commuters |
| Less than 5 Minutes | 354 | 6.9% |
| 5 to 9 Minutes | 1,357 | 26.5% |
| 10 to 14 Minutes | 764 | 14.9% |
| 15 to 19 Minutes | 255 | 5.0% |
| 20 to 24 Minutes | 259 | 5.1% |
| 25 to 29 Minutes | 166 | 3.2% |
| 30 to 34 Minutes | 862 | 16.8% |
| 35 to 39 Minutes | 97 | 1.9% |
| 40 to 44 Minutes | 94 | 1.8% |
| 45 to 59 Minutes | 417 | 8.2% |
| 60 to 89 Minutes | 162 | 3.2% |
| 90 or more Minutes | 331 | 6.5% |
Commute Time by Sex in Streator
The most common commute times in Streator are 5 to 9 minutes (657 commuters, 24.2%) for males and 5 to 9 minutes (700 commuters, 29.1%) for females.
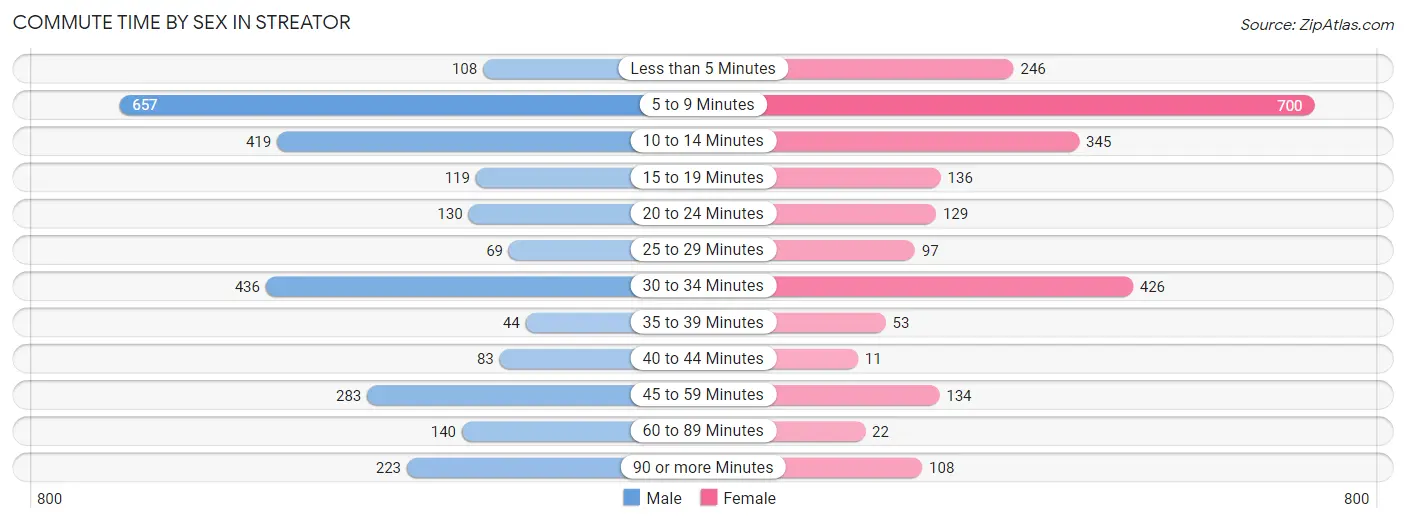
| Commute Time | Male | Female |
| Less than 5 Minutes | 108 (4.0%) | 246 (10.2%) |
| 5 to 9 Minutes | 657 (24.2%) | 700 (29.1%) |
| 10 to 14 Minutes | 419 (15.5%) | 345 (14.3%) |
| 15 to 19 Minutes | 119 (4.4%) | 136 (5.7%) |
| 20 to 24 Minutes | 130 (4.8%) | 129 (5.4%) |
| 25 to 29 Minutes | 69 (2.5%) | 97 (4.0%) |
| 30 to 34 Minutes | 436 (16.1%) | 426 (17.7%) |
| 35 to 39 Minutes | 44 (1.6%) | 53 (2.2%) |
| 40 to 44 Minutes | 83 (3.1%) | 11 (0.5%) |
| 45 to 59 Minutes | 283 (10.4%) | 134 (5.6%) |
| 60 to 89 Minutes | 140 (5.2%) | 22 (0.9%) |
| 90 or more Minutes | 223 (8.2%) | 108 (4.5%) |
Time of Departure to Work by Sex in Streator
The most frequent times of departure to work in Streator are 12:00 AM to 4:59 AM (415, 15.3%) for males and 7:30 AM to 7:59 AM (434, 18.0%) for females.
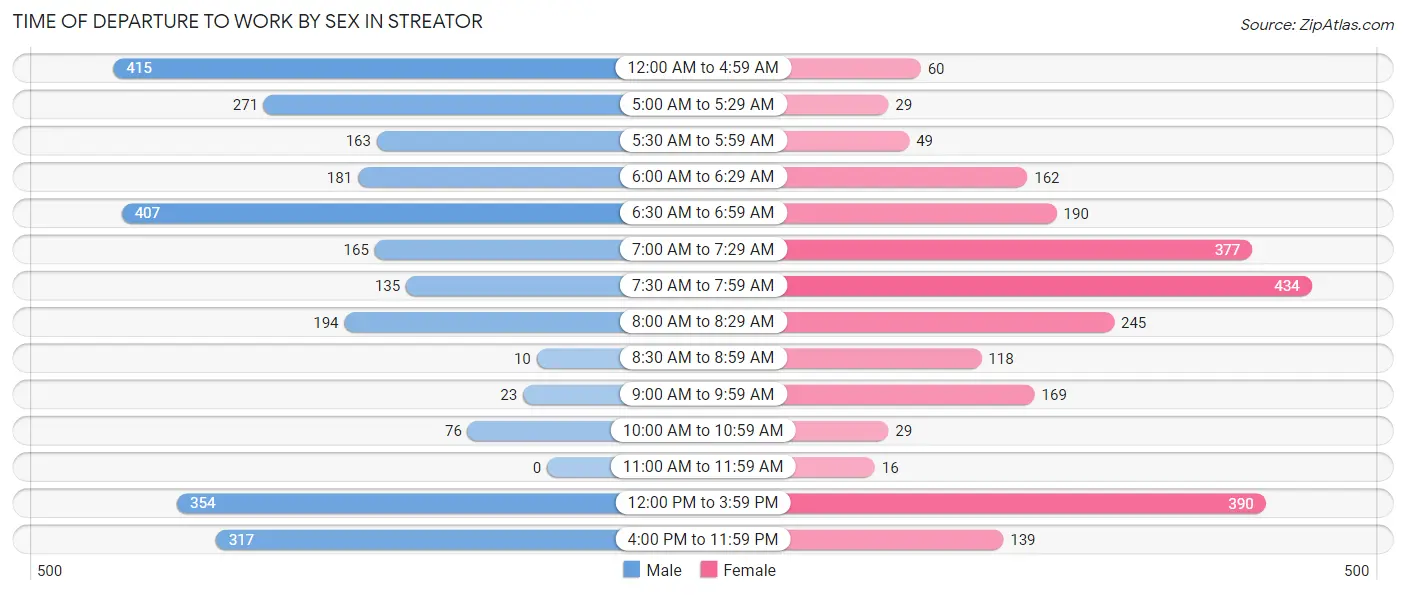
| Time of Departure | Male | Female |
| 12:00 AM to 4:59 AM | 415 (15.3%) | 60 (2.5%) |
| 5:00 AM to 5:29 AM | 271 (10.0%) | 29 (1.2%) |
| 5:30 AM to 5:59 AM | 163 (6.0%) | 49 (2.0%) |
| 6:00 AM to 6:29 AM | 181 (6.7%) | 162 (6.7%) |
| 6:30 AM to 6:59 AM | 407 (15.0%) | 190 (7.9%) |
| 7:00 AM to 7:29 AM | 165 (6.1%) | 377 (15.7%) |
| 7:30 AM to 7:59 AM | 135 (5.0%) | 434 (18.0%) |
| 8:00 AM to 8:29 AM | 194 (7.2%) | 245 (10.2%) |
| 8:30 AM to 8:59 AM | 10 (0.4%) | 118 (4.9%) |
| 9:00 AM to 9:59 AM | 23 (0.9%) | 169 (7.0%) |
| 10:00 AM to 10:59 AM | 76 (2.8%) | 29 (1.2%) |
| 11:00 AM to 11:59 AM | 0 (0.0%) | 16 (0.7%) |
| 12:00 PM to 3:59 PM | 354 (13.1%) | 390 (16.2%) |
| 4:00 PM to 11:59 PM | 317 (11.7%) | 139 (5.8%) |
| Total | 2,711 (100.0%) | 2,407 (100.0%) |
Housing Occupancy in Streator
Occupancy by Ownership in Streator
Of the total 5,845 dwellings in Streator, owner-occupied units account for 3,507 (60.0%), while renter-occupied units make up 2,338 (40.0%).
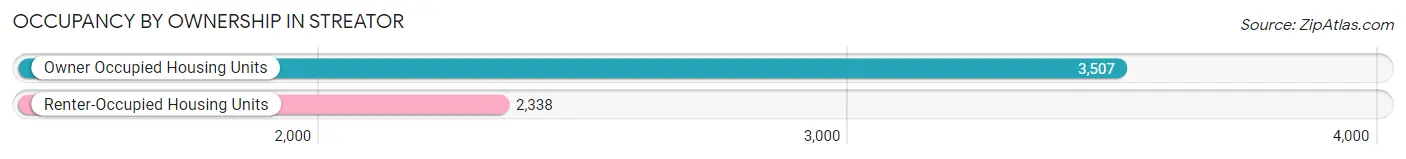
| Occupancy | # Housing Units | % Housing Units |
| Owner Occupied Housing Units | 3,507 | 60.0% |
| Renter-Occupied Housing Units | 2,338 | 40.0% |
| Total Occupied Housing Units | 5,845 | 100.0% |
Occupancy by Household Size in Streator
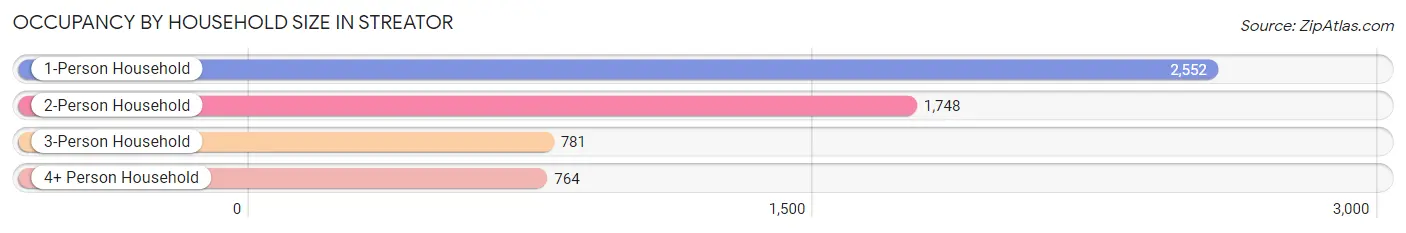
| Household Size | # Housing Units | % Housing Units |
| 1-Person Household | 2,552 | 43.7% |
| 2-Person Household | 1,748 | 29.9% |
| 3-Person Household | 781 | 13.4% |
| 4+ Person Household | 764 | 13.1% |
| Total Housing Units | 5,845 | 100.0% |
Occupancy by Ownership by Household Size in Streator
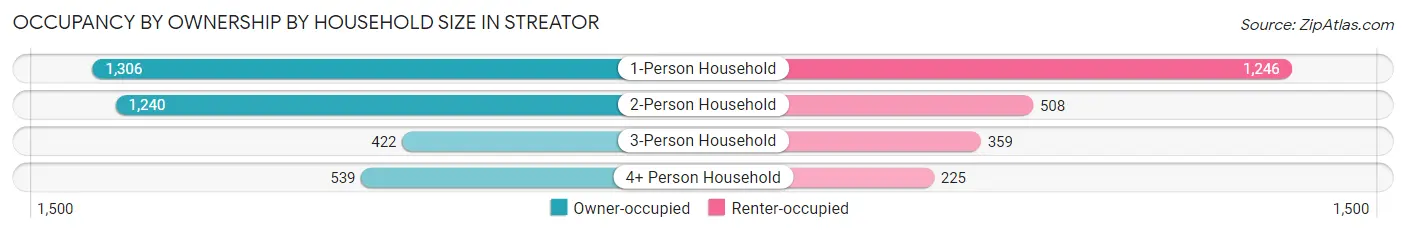
| Household Size | Owner-occupied | Renter-occupied |
| 1-Person Household | 1,306 (51.2%) | 1,246 (48.8%) |
| 2-Person Household | 1,240 (70.9%) | 508 (29.1%) |
| 3-Person Household | 422 (54.0%) | 359 (46.0%) |
| 4+ Person Household | 539 (70.6%) | 225 (29.4%) |
| Total Housing Units | 3,507 (60.0%) | 2,338 (40.0%) |
Occupancy by Educational Attainment in Streator
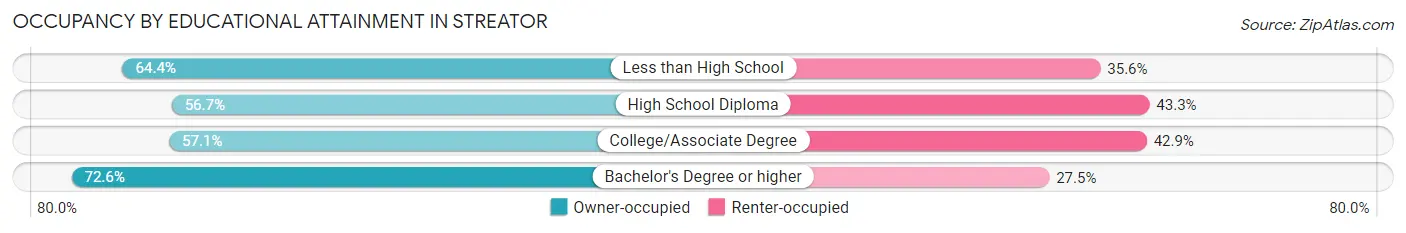
| Household Size | Owner-occupied | Renter-occupied |
| Less than High School | 511 (64.4%) | 282 (35.6%) |
| High School Diploma | 1,289 (56.7%) | 986 (43.3%) |
| College/Associate Degree | 1,136 (57.1%) | 854 (42.9%) |
| Bachelor's Degree or higher | 571 (72.6%) | 216 (27.5%) |
Occupancy by Age of Householder in Streator
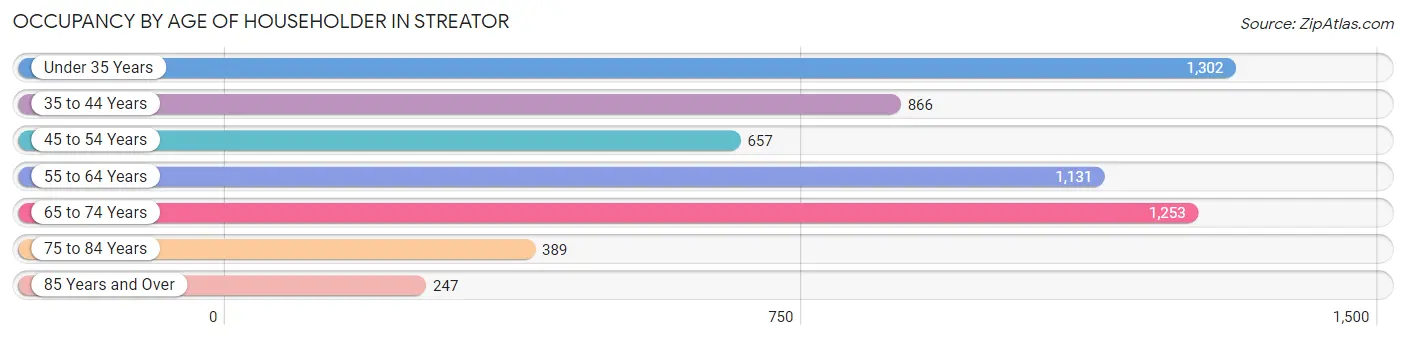
| Age Bracket | # Households | % Households |
| Under 35 Years | 1,302 | 22.3% |
| 35 to 44 Years | 866 | 14.8% |
| 45 to 54 Years | 657 | 11.2% |
| 55 to 64 Years | 1,131 | 19.4% |
| 65 to 74 Years | 1,253 | 21.4% |
| 75 to 84 Years | 389 | 6.7% |
| 85 Years and Over | 247 | 4.2% |
| Total | 5,845 | 100.0% |
Housing Finances in Streator
Median Income by Occupancy in Streator
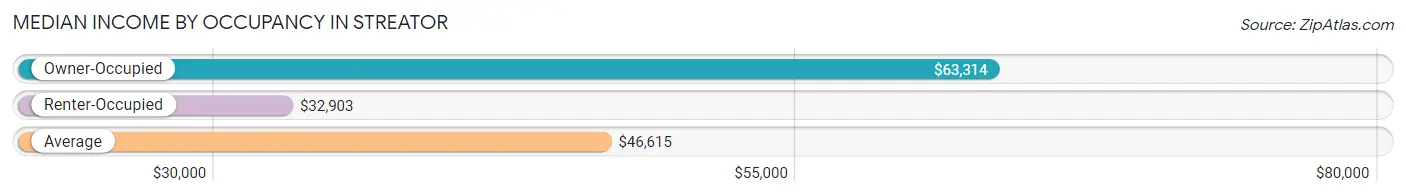
| Occupancy Type | # Households | Median Income |
| Owner-Occupied | 3,507 (60.0%) | $63,314 |
| Renter-Occupied | 2,338 (40.0%) | $32,903 |
| Average | 5,845 (100.0%) | $46,615 |
Occupancy by Householder Income Bracket in Streator
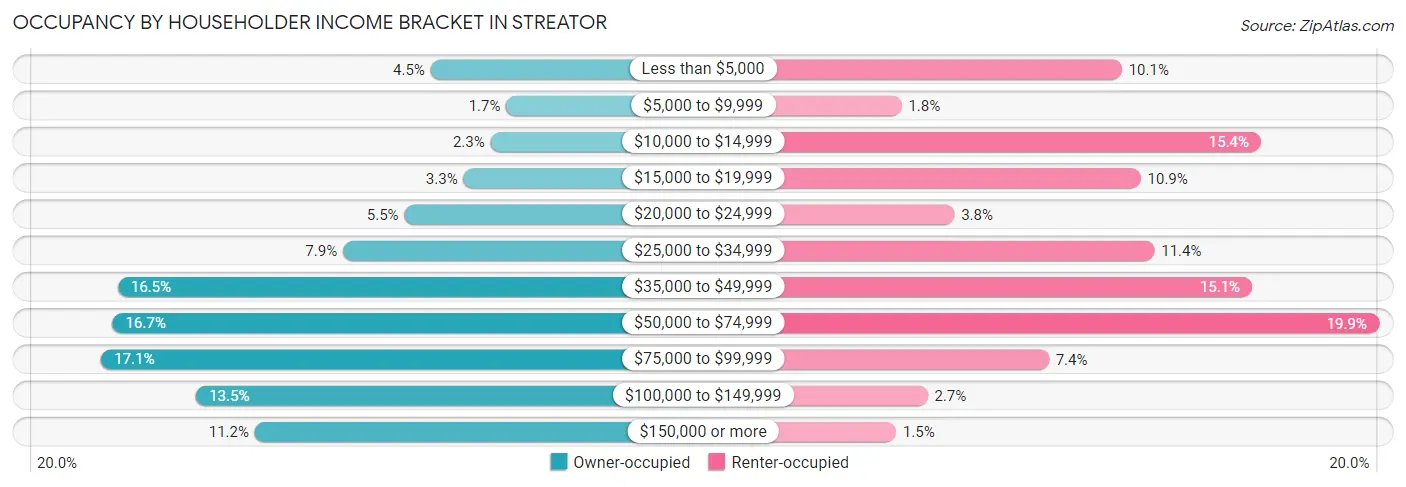
| Income Bracket | Owner-occupied | Renter-occupied |
| Less than $5,000 | 159 (4.5%) | 237 (10.1%) |
| $5,000 to $9,999 | 58 (1.7%) | 41 (1.8%) |
| $10,000 to $14,999 | 79 (2.2%) | 361 (15.4%) |
| $15,000 to $19,999 | 115 (3.3%) | 254 (10.9%) |
| $20,000 to $24,999 | 194 (5.5%) | 88 (3.8%) |
| $25,000 to $34,999 | 276 (7.9%) | 266 (11.4%) |
| $35,000 to $49,999 | 577 (16.5%) | 353 (15.1%) |
| $50,000 to $74,999 | 584 (16.7%) | 466 (19.9%) |
| $75,000 to $99,999 | 599 (17.1%) | 172 (7.4%) |
| $100,000 to $149,999 | 472 (13.5%) | 64 (2.7%) |
| $150,000 or more | 394 (11.2%) | 36 (1.5%) |
| Total | 3,507 (100.0%) | 2,338 (100.0%) |
Monthly Housing Cost Tiers in Streator
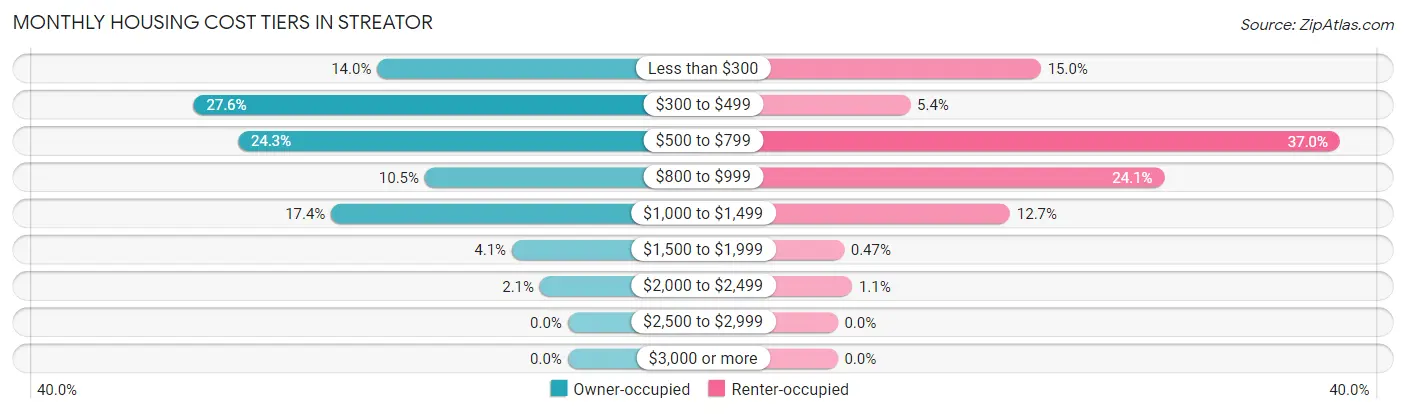
| Monthly Cost | Owner-occupied | Renter-occupied |
| Less than $300 | 492 (14.0%) | 350 (15.0%) |
| $300 to $499 | 967 (27.6%) | 125 (5.3%) |
| $500 to $799 | 852 (24.3%) | 865 (37.0%) |
| $800 to $999 | 369 (10.5%) | 563 (24.1%) |
| $1,000 to $1,499 | 611 (17.4%) | 297 (12.7%) |
| $1,500 to $1,999 | 144 (4.1%) | 11 (0.5%) |
| $2,000 to $2,499 | 72 (2.1%) | 25 (1.1%) |
| $2,500 to $2,999 | 0 (0.0%) | 0 (0.0%) |
| $3,000 or more | 0 (0.0%) | 0 (0.0%) |
| Total | 3,507 (100.0%) | 2,338 (100.0%) |
Physical Housing Characteristics in Streator
Housing Structures in Streator
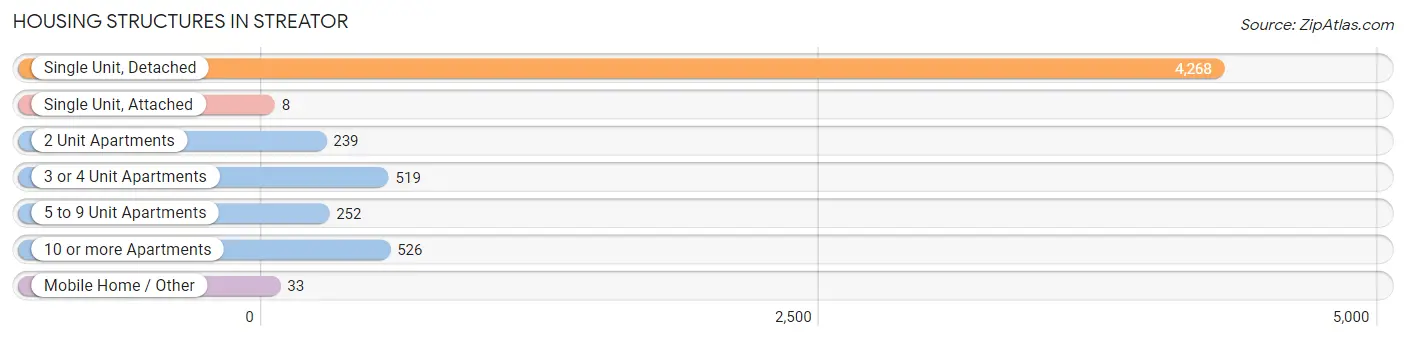
| Structure Type | # Housing Units | % Housing Units |
| Single Unit, Detached | 4,268 | 73.0% |
| Single Unit, Attached | 8 | 0.1% |
| 2 Unit Apartments | 239 | 4.1% |
| 3 or 4 Unit Apartments | 519 | 8.9% |
| 5 to 9 Unit Apartments | 252 | 4.3% |
| 10 or more Apartments | 526 | 9.0% |
| Mobile Home / Other | 33 | 0.6% |
| Total | 5,845 | 100.0% |
Housing Structures by Occupancy in Streator
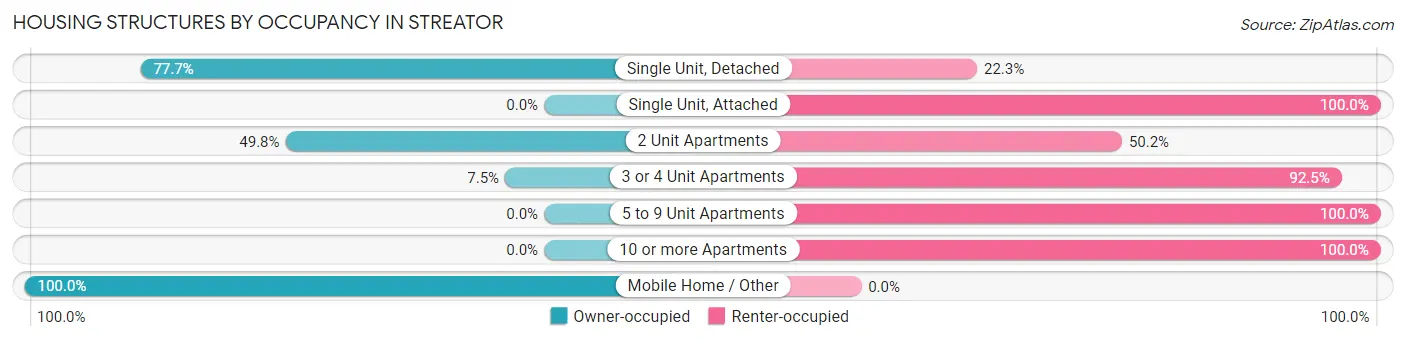
| Structure Type | Owner-occupied | Renter-occupied |
| Single Unit, Detached | 3,316 (77.7%) | 952 (22.3%) |
| Single Unit, Attached | 0 (0.0%) | 8 (100.0%) |
| 2 Unit Apartments | 119 (49.8%) | 120 (50.2%) |
| 3 or 4 Unit Apartments | 39 (7.5%) | 480 (92.5%) |
| 5 to 9 Unit Apartments | 0 (0.0%) | 252 (100.0%) |
| 10 or more Apartments | 0 (0.0%) | 526 (100.0%) |
| Mobile Home / Other | 33 (100.0%) | 0 (0.0%) |
| Total | 3,507 (60.0%) | 2,338 (40.0%) |
Housing Structures by Number of Rooms in Streator
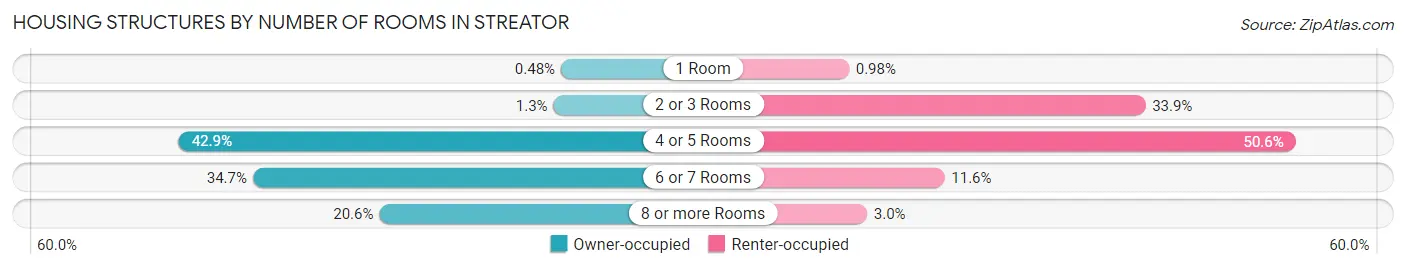
| Number of Rooms | Owner-occupied | Renter-occupied |
| 1 Room | 17 (0.5%) | 23 (1.0%) |
| 2 or 3 Rooms | 46 (1.3%) | 792 (33.9%) |
| 4 or 5 Rooms | 1,504 (42.9%) | 1,182 (50.6%) |
| 6 or 7 Rooms | 1,216 (34.7%) | 271 (11.6%) |
| 8 or more Rooms | 724 (20.6%) | 70 (3.0%) |
| Total | 3,507 (100.0%) | 2,338 (100.0%) |
Housing Structure by Heating Type in Streator
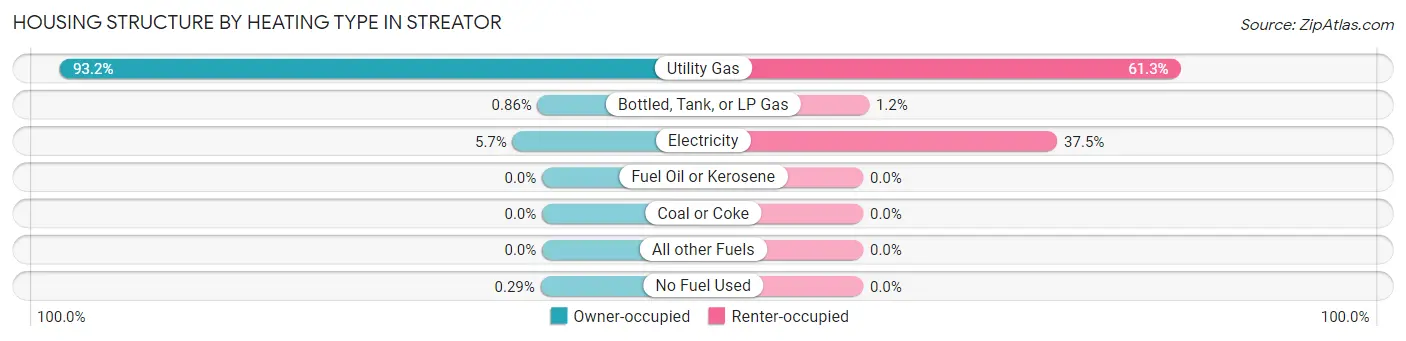
| Heating Type | Owner-occupied | Renter-occupied |
| Utility Gas | 3,267 (93.2%) | 1,434 (61.3%) |
| Bottled, Tank, or LP Gas | 30 (0.9%) | 27 (1.1%) |
| Electricity | 200 (5.7%) | 877 (37.5%) |
| Fuel Oil or Kerosene | 0 (0.0%) | 0 (0.0%) |
| Coal or Coke | 0 (0.0%) | 0 (0.0%) |
| All other Fuels | 0 (0.0%) | 0 (0.0%) |
| No Fuel Used | 10 (0.3%) | 0 (0.0%) |
| Total | 3,507 (100.0%) | 2,338 (100.0%) |
Household Vehicle Usage in Streator
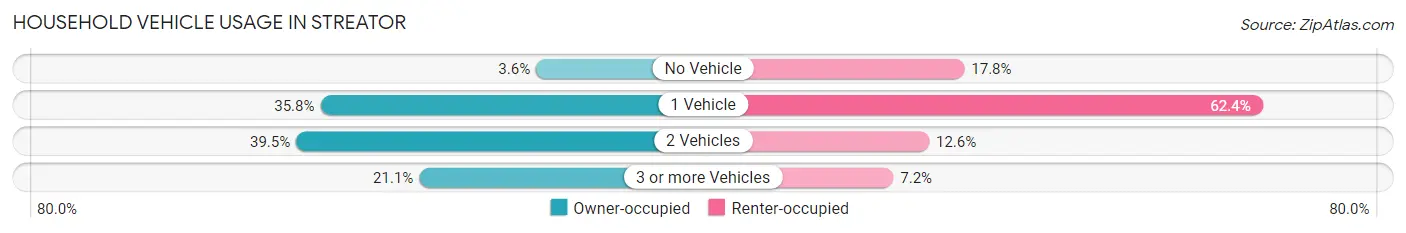
| Vehicles per Household | Owner-occupied | Renter-occupied |
| No Vehicle | 127 (3.6%) | 417 (17.8%) |
| 1 Vehicle | 1,257 (35.8%) | 1,458 (62.4%) |
| 2 Vehicles | 1,384 (39.5%) | 294 (12.6%) |
| 3 or more Vehicles | 739 (21.1%) | 169 (7.2%) |
| Total | 3,507 (100.0%) | 2,338 (100.0%) |
Real Estate & Mortgages in Streator
Real Estate and Mortgage Overview in Streator
| Characteristic | Without Mortgage | With Mortgage |
| Housing Units | 2,084 | 1,423 |
| Median Property Value | $72,600 | $88,000 |
| Median Household Income | $45,167 | $248 |
| Monthly Housing Costs | $408 | $0 |
| Real Estate Taxes | $1,530 | $87 |
Property Value by Mortgage Status in Streator
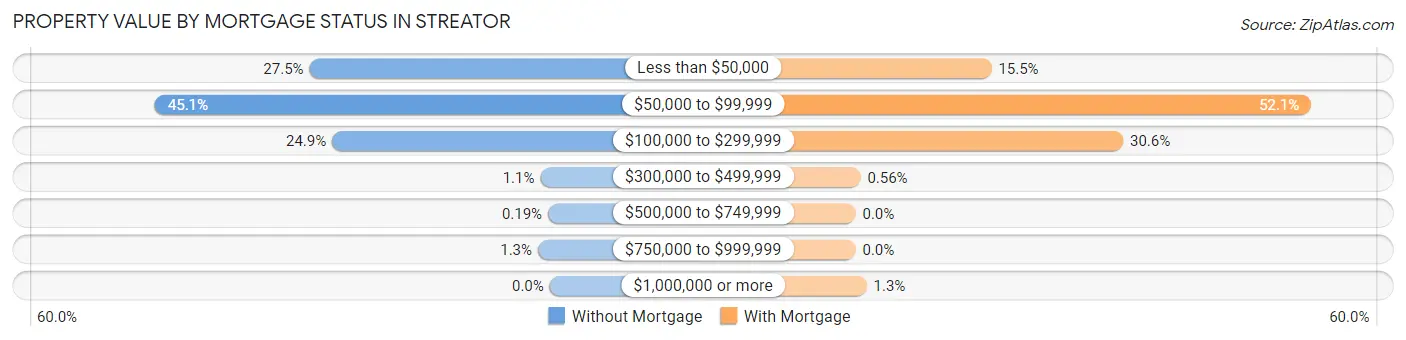
| Property Value | Without Mortgage | With Mortgage |
| Less than $50,000 | 572 (27.5%) | 221 (15.5%) |
| $50,000 to $99,999 | 940 (45.1%) | 741 (52.1%) |
| $100,000 to $299,999 | 518 (24.9%) | 435 (30.6%) |
| $300,000 to $499,999 | 22 (1.1%) | 8 (0.6%) |
| $500,000 to $749,999 | 4 (0.2%) | 0 (0.0%) |
| $750,000 to $999,999 | 28 (1.3%) | 0 (0.0%) |
| $1,000,000 or more | 0 (0.0%) | 18 (1.3%) |
| Total | 2,084 (100.0%) | 1,423 (100.0%) |
Household Income by Mortgage Status in Streator
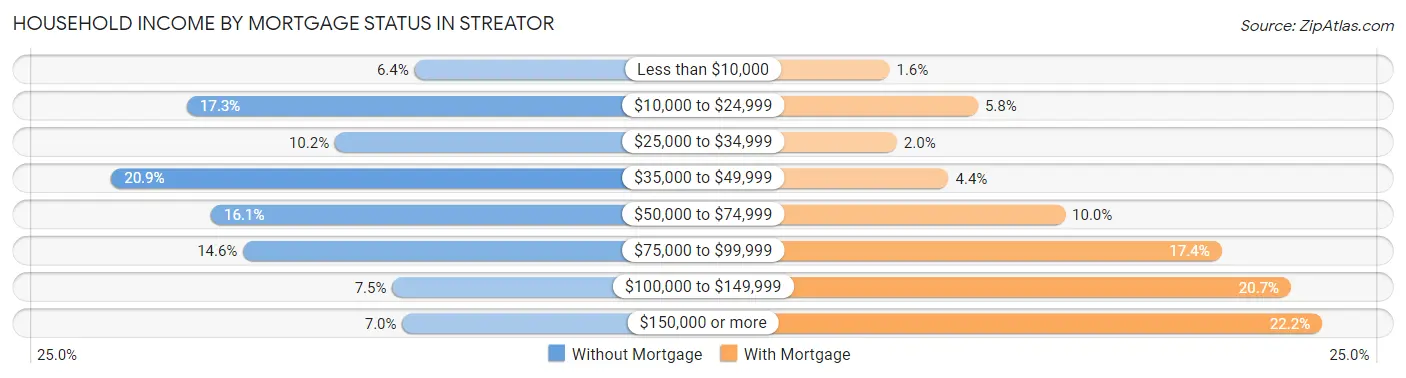
| Household Income | Without Mortgage | With Mortgage |
| Less than $10,000 | 134 (6.4%) | 23 (1.6%) |
| $10,000 to $24,999 | 360 (17.3%) | 83 (5.8%) |
| $25,000 to $34,999 | 213 (10.2%) | 28 (2.0%) |
| $35,000 to $49,999 | 435 (20.9%) | 63 (4.4%) |
| $50,000 to $74,999 | 336 (16.1%) | 142 (10.0%) |
| $75,000 to $99,999 | 304 (14.6%) | 248 (17.4%) |
| $100,000 to $149,999 | 156 (7.5%) | 295 (20.7%) |
| $150,000 or more | 146 (7.0%) | 316 (22.2%) |
| Total | 2,084 (100.0%) | 1,423 (100.0%) |
Property Value to Household Income Ratio in Streator
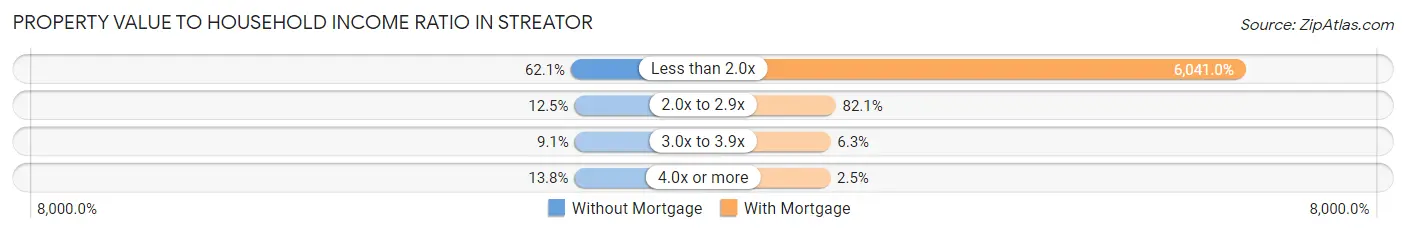
| Value-to-Income Ratio | Without Mortgage | With Mortgage |
| Less than 2.0x | 1,295 (62.1%) | 85,964 (6,041.0%) |
| 2.0x to 2.9x | 260 (12.5%) | 1,168 (82.1%) |
| 3.0x to 3.9x | 189 (9.1%) | 90 (6.3%) |
| 4.0x or more | 288 (13.8%) | 36 (2.5%) |
| Total | 2,084 (100.0%) | 1,423 (100.0%) |
Real Estate Taxes by Mortgage Status in Streator
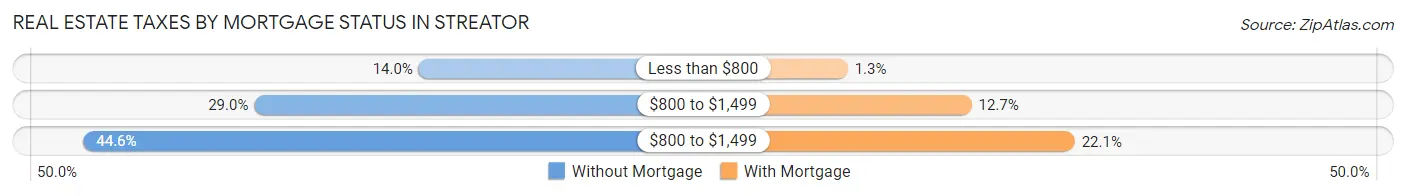
| Property Taxes | Without Mortgage | With Mortgage |
| Less than $800 | 292 (14.0%) | 19 (1.3%) |
| $800 to $1,499 | 605 (29.0%) | 180 (12.7%) |
| $800 to $1,499 | 930 (44.6%) | 314 (22.1%) |
| Total | 2,084 (100.0%) | 1,423 (100.0%) |
Health & Disability in Streator
Health Insurance Coverage by Age in Streator
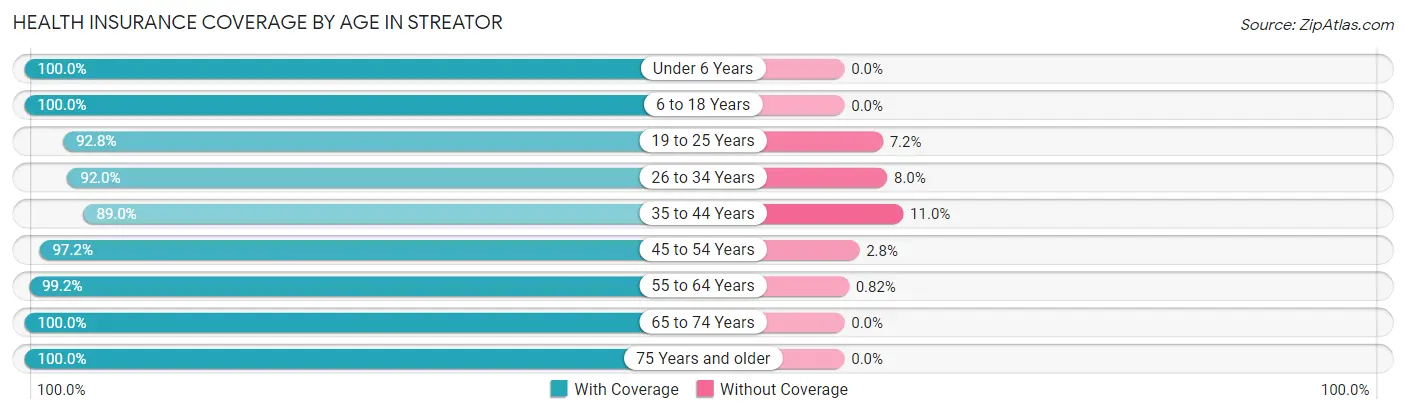
| Age Bracket | With Coverage | Without Coverage |
| Under 6 Years | 921 (100.0%) | 0 (0.0%) |
| 6 to 18 Years | 1,580 (100.0%) | 0 (0.0%) |
| 19 to 25 Years | 1,113 (92.8%) | 86 (7.2%) |
| 26 to 34 Years | 1,408 (92.0%) | 122 (8.0%) |
| 35 to 44 Years | 1,606 (89.0%) | 198 (11.0%) |
| 45 to 54 Years | 978 (97.2%) | 28 (2.8%) |
| 55 to 64 Years | 1,582 (99.2%) | 13 (0.8%) |
| 65 to 74 Years | 1,520 (100.0%) | 0 (0.0%) |
| 75 Years and older | 977 (100.0%) | 0 (0.0%) |
| Total | 11,685 (96.3%) | 447 (3.7%) |
Health Insurance Coverage by Citizenship Status in Streator
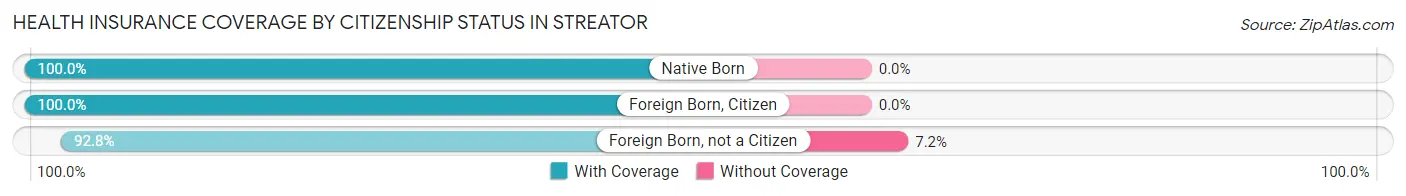
| Citizenship Status | With Coverage | Without Coverage |
| Native Born | 921 (100.0%) | 0 (0.0%) |
| Foreign Born, Citizen | 1,580 (100.0%) | 0 (0.0%) |
| Foreign Born, not a Citizen | 1,113 (92.8%) | 86 (7.2%) |
Health Insurance Coverage by Household Income in Streator
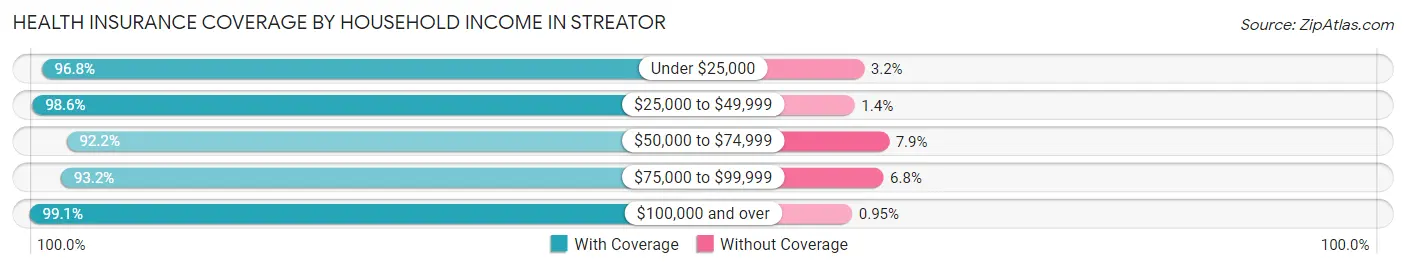
| Household Income | With Coverage | Without Coverage |
| Under $25,000 | 2,333 (96.8%) | 77 (3.2%) |
| $25,000 to $49,999 | 2,624 (98.6%) | 38 (1.4%) |
| $50,000 to $74,999 | 1,937 (92.1%) | 165 (7.9%) |
| $75,000 to $99,999 | 1,916 (93.2%) | 140 (6.8%) |
| $100,000 and over | 2,826 (99.1%) | 27 (0.9%) |
Public vs Private Health Insurance Coverage by Age in Streator
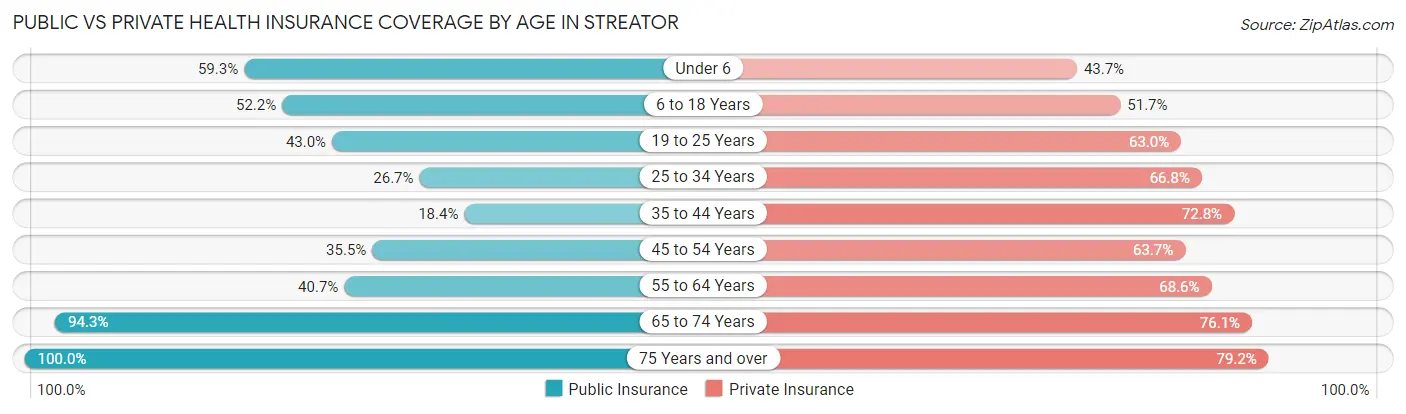
| Age Bracket | Public Insurance | Private Insurance |
| Under 6 | 546 (59.3%) | 402 (43.6%) |
| 6 to 18 Years | 825 (52.2%) | 817 (51.7%) |
| 19 to 25 Years | 515 (42.9%) | 755 (63.0%) |
| 25 to 34 Years | 409 (26.7%) | 1,022 (66.8%) |
| 35 to 44 Years | 332 (18.4%) | 1,313 (72.8%) |
| 45 to 54 Years | 357 (35.5%) | 641 (63.7%) |
| 55 to 64 Years | 649 (40.7%) | 1,094 (68.6%) |
| 65 to 74 Years | 1,434 (94.3%) | 1,157 (76.1%) |
| 75 Years and over | 977 (100.0%) | 774 (79.2%) |
| Total | 6,044 (49.8%) | 7,975 (65.7%) |
Disability Status by Sex by Age in Streator
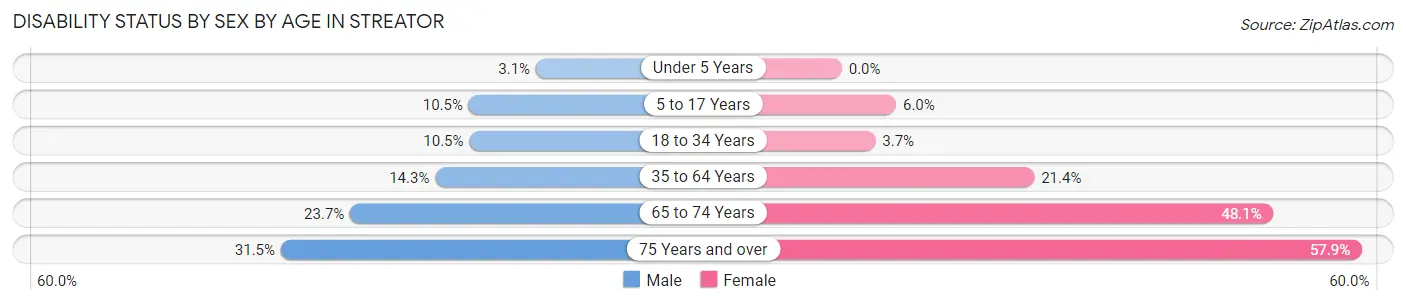
| Age Bracket | Male | Female |
| Under 5 Years | 15 (3.0%) | 0 (0.0%) |
| 5 to 17 Years | 82 (10.5%) | 56 (6.0%) |
| 18 to 34 Years | 137 (10.5%) | 56 (3.7%) |
| 35 to 64 Years | 357 (14.3%) | 408 (21.4%) |
| 65 to 74 Years | 151 (23.7%) | 425 (48.1%) |
| 75 Years and over | 101 (31.5%) | 380 (57.9%) |
Disability Class by Sex by Age in Streator
Disability Class: Hearing Difficulty
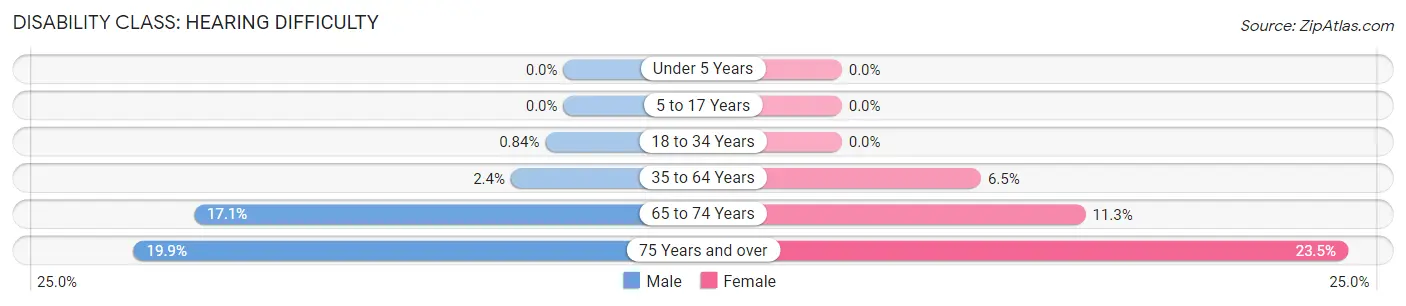
| Age Bracket | Male | Female |
| Under 5 Years | 0 (0.0%) | 0 (0.0%) |
| 5 to 17 Years | 0 (0.0%) | 0 (0.0%) |
| 18 to 34 Years | 11 (0.8%) | 0 (0.0%) |
| 35 to 64 Years | 61 (2.4%) | 123 (6.5%) |
| 65 to 74 Years | 109 (17.1%) | 100 (11.3%) |
| 75 Years and over | 64 (19.9%) | 154 (23.5%) |
Disability Class: Vision Difficulty
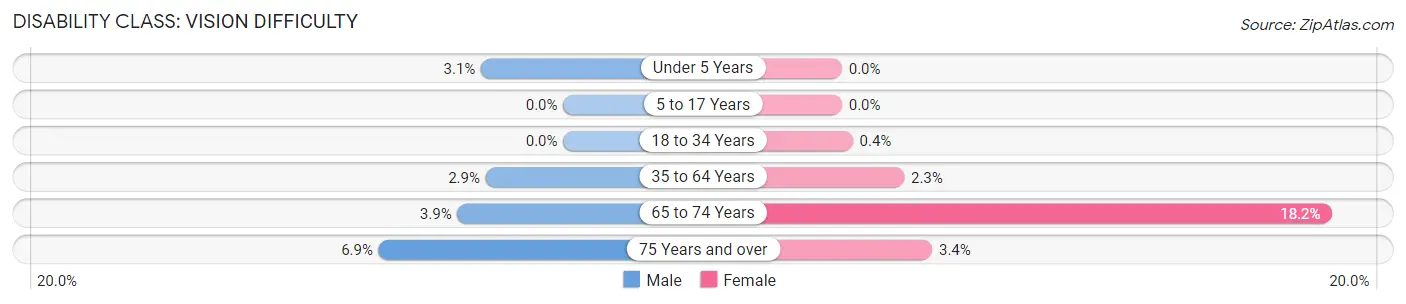
| Age Bracket | Male | Female |
| Under 5 Years | 15 (3.0%) | 0 (0.0%) |
| 5 to 17 Years | 0 (0.0%) | 0 (0.0%) |
| 18 to 34 Years | 0 (0.0%) | 6 (0.4%) |
| 35 to 64 Years | 72 (2.9%) | 44 (2.3%) |
| 65 to 74 Years | 25 (3.9%) | 161 (18.2%) |
| 75 Years and over | 22 (6.9%) | 22 (3.4%) |
Disability Class: Cognitive Difficulty
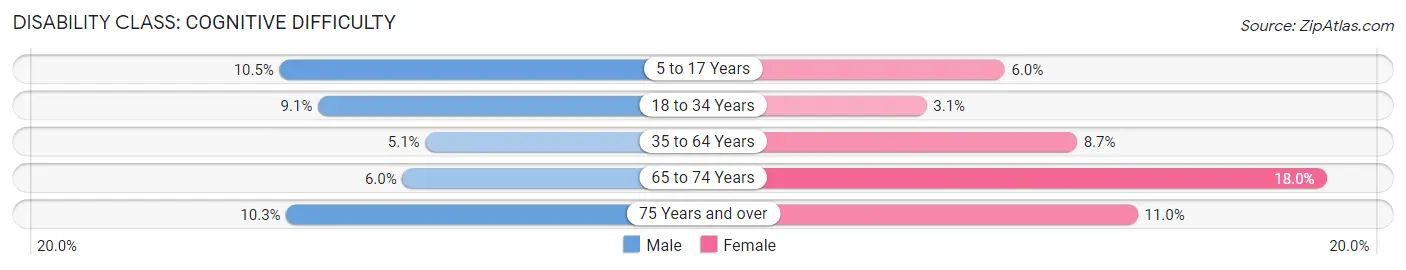
| Age Bracket | Male | Female |
| 5 to 17 Years | 82 (10.5%) | 56 (6.0%) |
| 18 to 34 Years | 119 (9.1%) | 47 (3.1%) |
| 35 to 64 Years | 128 (5.1%) | 166 (8.7%) |
| 65 to 74 Years | 38 (6.0%) | 159 (18.0%) |
| 75 Years and over | 33 (10.3%) | 72 (11.0%) |
Disability Class: Ambulatory Difficulty
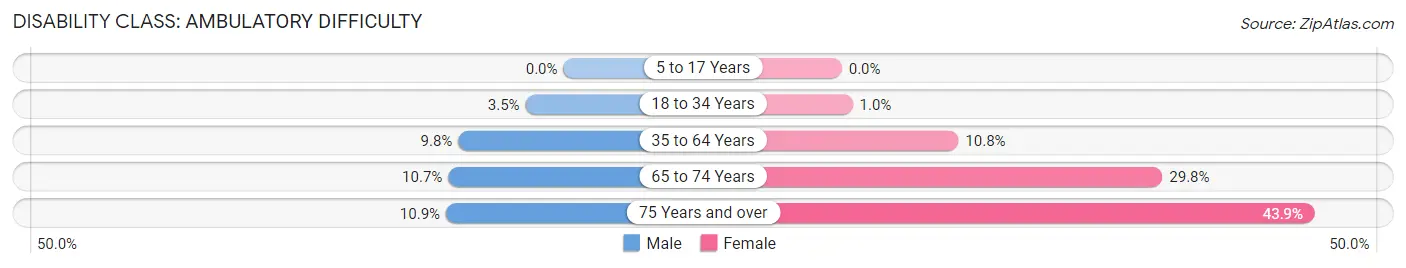
| Age Bracket | Male | Female |
| 5 to 17 Years | 0 (0.0%) | 0 (0.0%) |
| 18 to 34 Years | 46 (3.5%) | 15 (1.0%) |
| 35 to 64 Years | 244 (9.8%) | 206 (10.8%) |
| 65 to 74 Years | 68 (10.7%) | 263 (29.7%) |
| 75 Years and over | 35 (10.9%) | 288 (43.9%) |
Disability Class: Self-Care Difficulty
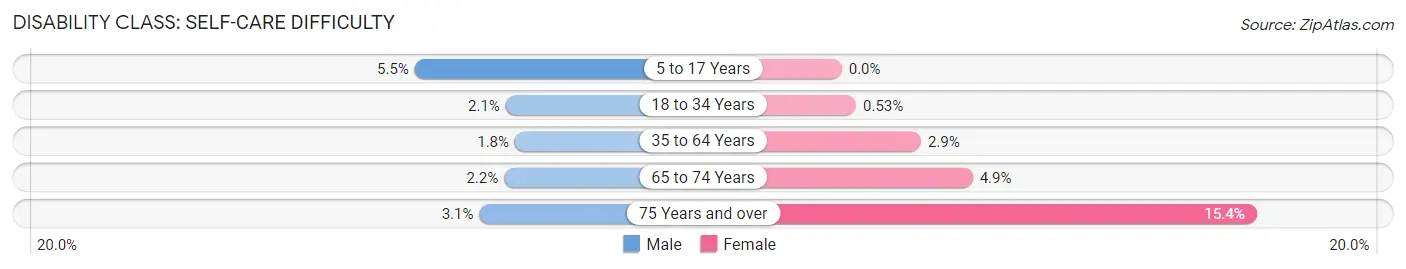
| Age Bracket | Male | Female |
| 5 to 17 Years | 43 (5.5%) | 0 (0.0%) |
| 18 to 34 Years | 28 (2.1%) | 8 (0.5%) |
| 35 to 64 Years | 45 (1.8%) | 56 (2.9%) |
| 65 to 74 Years | 14 (2.2%) | 43 (4.9%) |
| 75 Years and over | 10 (3.1%) | 101 (15.4%) |
Technology Access in Streator
Computing Device Access in Streator
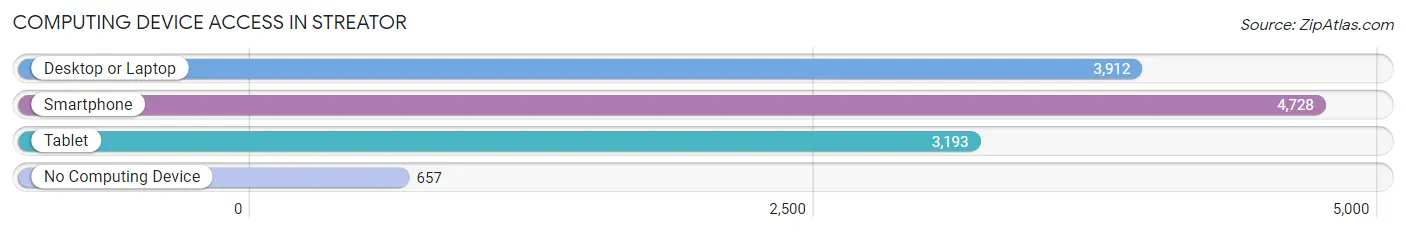
| Device Type | # Households | % Households |
| Desktop or Laptop | 3,912 | 66.9% |
| Smartphone | 4,728 | 80.9% |
| Tablet | 3,193 | 54.6% |
| No Computing Device | 657 | 11.2% |
| Total | 5,845 | 100.0% |
Internet Access in Streator
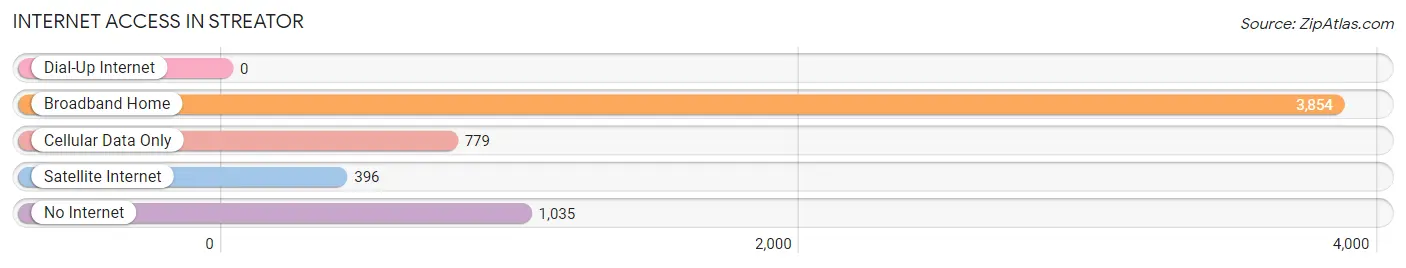
| Internet Type | # Households | % Households |
| Dial-Up Internet | 0 | 0.0% |
| Broadband Home | 3,854 | 65.9% |
| Cellular Data Only | 779 | 13.3% |
| Satellite Internet | 396 | 6.8% |
| No Internet | 1,035 | 17.7% |
| Total | 5,845 | 100.0% |
Streator Summary
Streator, Illinois is a city located in LaSalle County, Illinois, United States. It is situated on the Vermilion River, approximately 80 miles southwest of Chicago. The city has a population of 13,710 as of the 2010 census.
History
Streator was founded in 1868 by William Streator, a coal miner from Pennsylvania. He purchased the land from the government and began to develop the area. The city was incorporated in 1873 and was named after William Streator.
The city grew rapidly in the late 19th century due to the coal mining industry. The city was home to several coal mines, including the Streator Coal Company, which was the largest coal mine in the world at the time. The city also had a large number of brickyards, which produced bricks for the construction of buildings in the city.
In the early 20th century, Streator was a major center for the production of glass. The city was home to several glass factories, including the Streator Glass Company, which was the largest glass factory in the world at the time.
Geography
Streator is located at 41°7′N 88°45′W (41.1167, -88.7500). According to the 2010 census, the city has a total area of 8.3 square miles (21.5 km2), of which 8.2 square miles (21.3 km2) is land and 0.1 square miles (0.2 km2) is water.
The city is located in the Vermilion River Valley, which is part of the Illinois River Valley. The city is surrounded by rolling hills and farmland.
Economy
Streator’s economy is largely based on manufacturing and agriculture. The city is home to several manufacturing companies, including Streator Brick and Tile, Streator Glass, and Streator Coal. The city is also home to several agricultural businesses, including grain elevators, feed mills, and dairy farms.
The city is also home to several retail businesses, including grocery stores, restaurants, and clothing stores.
Demographics
As of the 2010 census, the city had a population of 13,710. The racial makeup of the city was 92.2% White, 4.2% African American, 0.4% Native American, 0.7% Asian, 0.1% Pacific Islander, 1.2% from other races, and 1.2% from two or more races. Hispanic or Latino of any race were 3.2% of the population.
The median income for a household in the city was $37,945, and the median income for a family was $45,945. The per capita income for the city was $18,945. About 11.2% of families and 14.2% of the population were below the poverty line, including 19.2% of those under age 18 and 8.2% of those age 65 or over.
Streator is served by the Streator-Woodland Community Unit School District #2. The district has four elementary schools, one middle school, and one high school. The city is also home to St. Mary’s Catholic School, which serves students in grades K-8.
Common Questions
What is Per Capita Income in Streator?
Per Capita income in Streator is $31,706.
What is the Median Family Income in Streator?
Median Family Income in Streator is $64,627.
What is the Median Household income in Streator?
Median Household Income in Streator is $46,615.
What is Income or Wage Gap in Streator?
Income or Wage Gap in Streator is 49.2%.
Women in Streator earn 50.8 cents for every dollar earned by a man.
What is Inequality or Gini Index in Streator?
Inequality or Gini Index in Streator is 0.47.
What is the Total Population of Streator?
Total Population of Streator is 12,279.
What is the Total Male Population of Streator?
Total Male Population of Streator is 6,115.
What is the Total Female Population of Streator?
Total Female Population of Streator is 6,164.
What is the Ratio of Males per 100 Females in Streator?
There are 99.21 Males per 100 Females in Streator.
What is the Ratio of Females per 100 Males in Streator?
There are 100.80 Females per 100 Males in Streator.
What is the Median Population Age in Streator?
Median Population Age in Streator is 39.5 Years.
What is the Average Family Size in Streator
Average Family Size in Streator is 2.9 People.
What is the Average Household Size in Streator
Average Household Size in Streator is 2.1 People.
How Large is the Labor Force in Streator?
There are 6,117 People in the Labor Forcein in Streator.
What is the Percentage of People in the Labor Force in Streator?
61.1% of People are in the Labor Force in Streator.
What is the Unemployment Rate in Streator?
Unemployment Rate in Streator is 9.1%.