Strawn, IL Map & Demographics
Strawn Map
Strawn Overview
$32,687
PER CAPITA INCOME
$108,125
AVG FAMILY INCOME
$66,250
AVG HOUSEHOLD INCOME
0.29
INEQUALITY / GINI INDEX
77
TOTAL POPULATION
41
MALE POPULATION
36
FEMALE POPULATION
113.89
MALES / 100 FEMALES
87.80
FEMALES / 100 MALES
31.8
MEDIAN AGE
3.4
AVG FAMILY SIZE
2.5
AVG HOUSEHOLD SIZE
42
LABOR FORCE [ PEOPLE ]
76.4%
PERCENT IN LABOR FORCE
Strawn Zip Codes
Strawn Area Codes
Income in Strawn
Income Overview in Strawn
Per Capita Income in Strawn is $32,687, while median incomes of families and households are $108,125 and $66,250 respectively.
| Characteristic | Number | Measure |
| Per Capita Income | 77 | $32,687 |
| Median Family Income | 17 | $108,125 |
| Mean Family Income | 17 | $89,759 |
| Median Household Income | 31 | $66,250 |
| Mean Household Income | 31 | $77,848 |
| Income Deficit | 17 | $0 |
| Wage / Income Gap (%) | 77 | 0.00% |
| Wage / Income Gap ($) | 77 | 100.00¢ per $1 |
| Gini / Inequality Index | 77 | 0.29 |
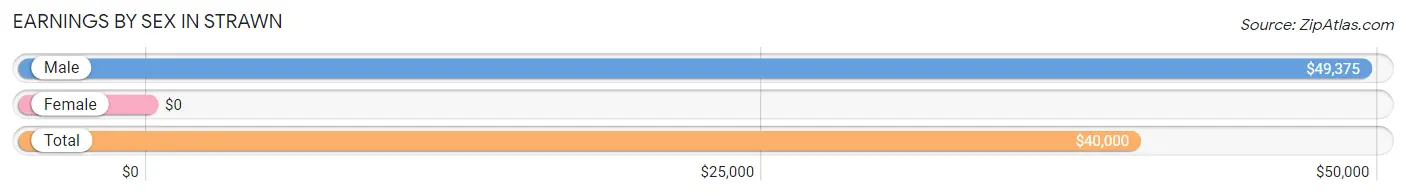
Earnings by Sex in Strawn
| Sex | Number | Average Earnings |
| Male | 31 (64.6%) | $49,375 |
| Female | 17 (35.4%) | $0 |
| Total | 48 (100.0%) | $40,000 |
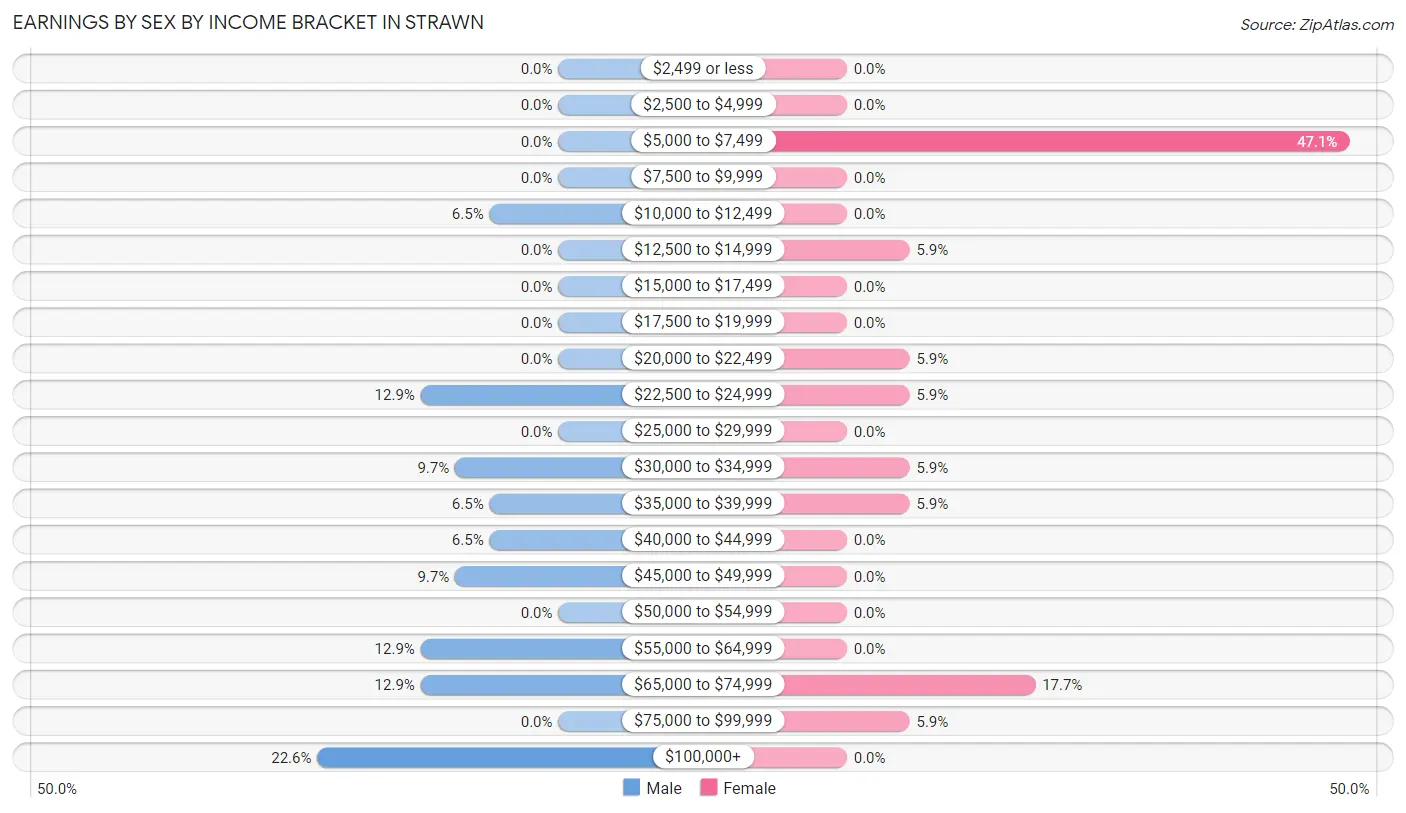
Earnings by Sex by Income Bracket in Strawn
The most common earnings brackets in Strawn are $100,000+ for men (7 | 22.6%) and $5,000 to $7,499 for women (8 | 47.1%).
| Income | Male | Female |
| $2,499 or less | 0 (0.0%) | 0 (0.0%) |
| $2,500 to $4,999 | 0 (0.0%) | 0 (0.0%) |
| $5,000 to $7,499 | 0 (0.0%) | 8 (47.1%) |
| $7,500 to $9,999 | 0 (0.0%) | 0 (0.0%) |
| $10,000 to $12,499 | 2 (6.5%) | 0 (0.0%) |
| $12,500 to $14,999 | 0 (0.0%) | 1 (5.9%) |
| $15,000 to $17,499 | 0 (0.0%) | 0 (0.0%) |
| $17,500 to $19,999 | 0 (0.0%) | 0 (0.0%) |
| $20,000 to $22,499 | 0 (0.0%) | 1 (5.9%) |
| $22,500 to $24,999 | 4 (12.9%) | 1 (5.9%) |
| $25,000 to $29,999 | 0 (0.0%) | 0 (0.0%) |
| $30,000 to $34,999 | 3 (9.7%) | 1 (5.9%) |
| $35,000 to $39,999 | 2 (6.5%) | 1 (5.9%) |
| $40,000 to $44,999 | 2 (6.5%) | 0 (0.0%) |
| $45,000 to $49,999 | 3 (9.7%) | 0 (0.0%) |
| $50,000 to $54,999 | 0 (0.0%) | 0 (0.0%) |
| $55,000 to $64,999 | 4 (12.9%) | 0 (0.0%) |
| $65,000 to $74,999 | 4 (12.9%) | 3 (17.6%) |
| $75,000 to $99,999 | 0 (0.0%) | 1 (5.9%) |
| $100,000+ | 7 (22.6%) | 0 (0.0%) |
| Total | 31 (100.0%) | 17 (100.0%) |
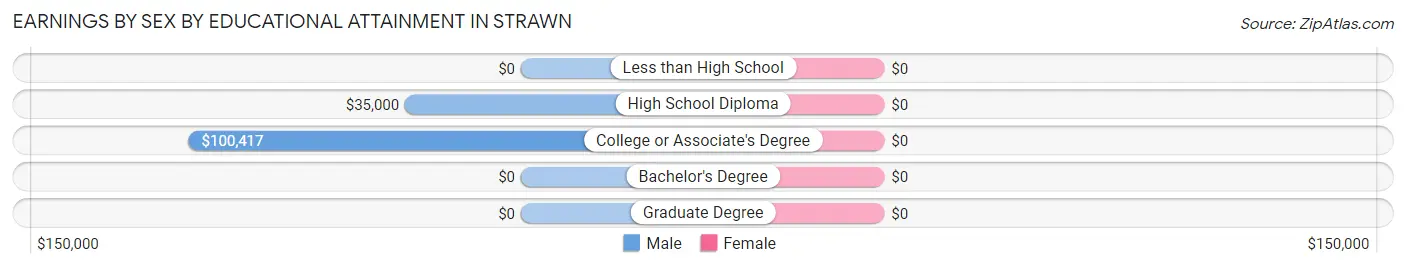
Earnings by Sex by Educational Attainment in Strawn
| Educational Attainment | Male Income | Female Income |
| Less than High School | - | - |
| High School Diploma | $35,000 | $0 |
| College or Associate's Degree | $100,417 | $0 |
| Bachelor's Degree | - | - |
| Graduate Degree | - | - |
| Total | $49,375 | $0 |
Family Income in Strawn
Family Income Brackets in Strawn
According to the Strawn family income data, there are 8 families falling into the $100,000 to $149,999 income range, which is the most common income bracket and makes up 47.1% of all families.
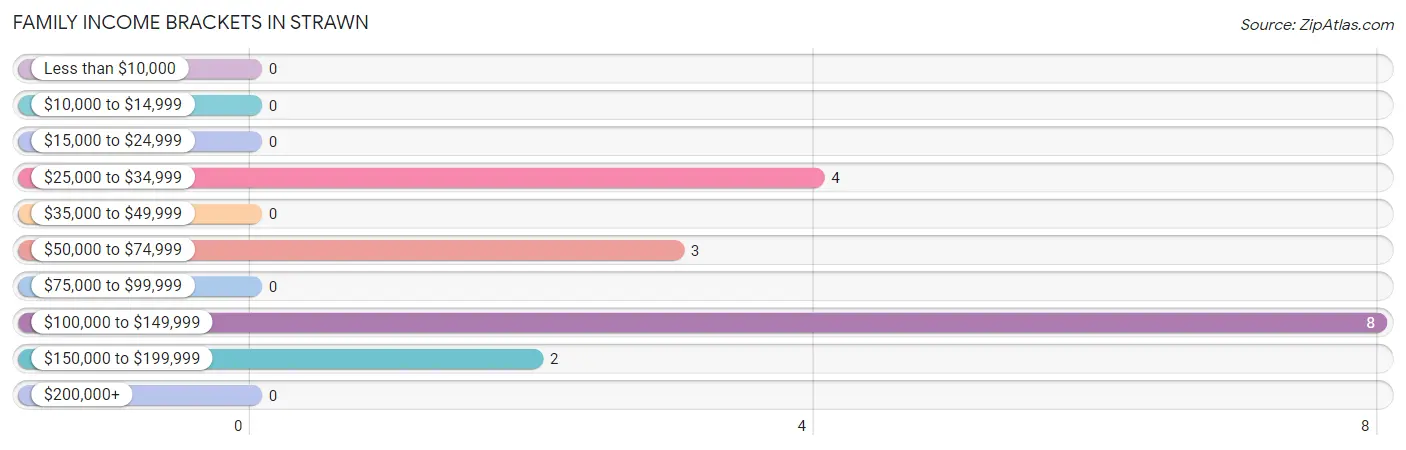
| Income Bracket | # Families | % Families |
| Less than $10,000 | 0 | 0.0% |
| $10,000 to $14,999 | 0 | 0.0% |
| $15,000 to $24,999 | 0 | 0.0% |
| $25,000 to $34,999 | 4 | 23.5% |
| $35,000 to $49,999 | 0 | 0.0% |
| $50,000 to $74,999 | 3 | 17.6% |
| $75,000 to $99,999 | 0 | 0.0% |
| $100,000 to $149,999 | 8 | 47.1% |
| $150,000 to $199,999 | 2 | 11.8% |
| $200,000+ | 0 | 0.0% |
Family Income by Famaliy Size in Strawn
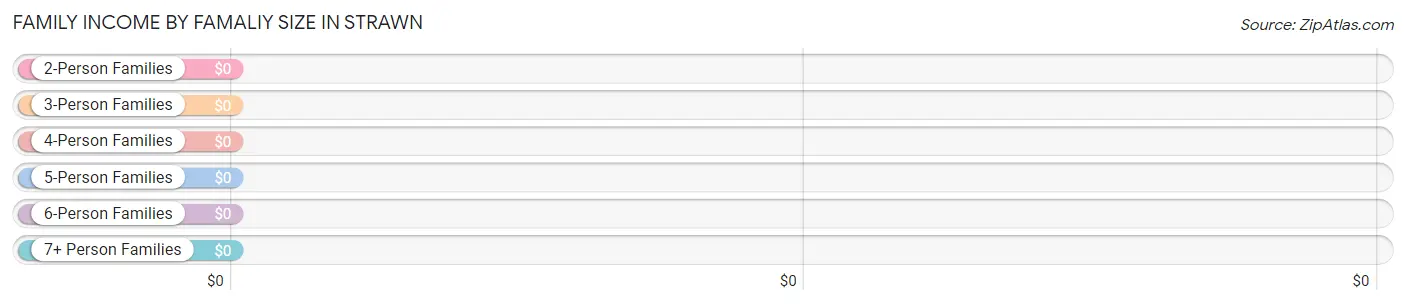
| Income Bracket | # Families | Median Income |
| 2-Person Families | 5 (29.4%) | $0 |
| 3-Person Families | 8 (47.1%) | $0 |
| 4-Person Families | 0 (0.0%) | $0 |
| 5-Person Families | 4 (23.5%) | $0 |
| 6-Person Families | 0 (0.0%) | $0 |
| 7+ Person Families | 0 (0.0%) | $0 |
| Total | 17 (100.0%) | $108,125 |
Family Income by Number of Earners in Strawn
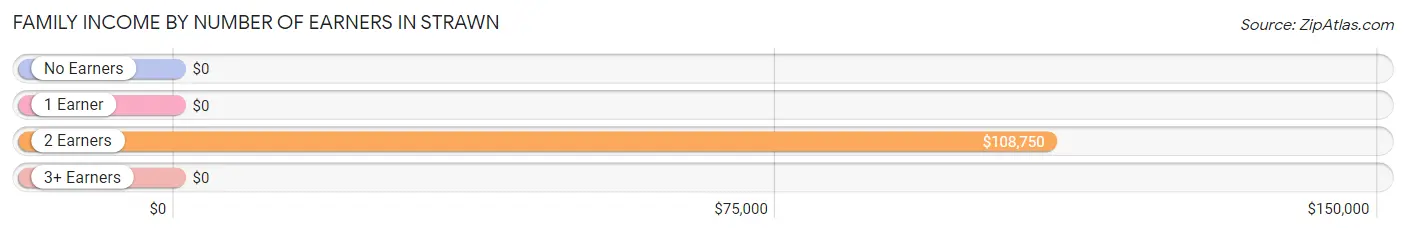
| Number of Earners | # Families | Median Income |
| No Earners | 0 (0.0%) | $0 |
| 1 Earner | 5 (29.4%) | $0 |
| 2 Earners | 12 (70.6%) | $108,750 |
| 3+ Earners | 0 (0.0%) | $0 |
| Total | 17 (100.0%) | $108,125 |
Household Income in Strawn
Household Income Brackets in Strawn
With 10 households falling in the category, the $100,000 to $149,999 income range is the most frequent in Strawn, accounting for 32.3% of all households.
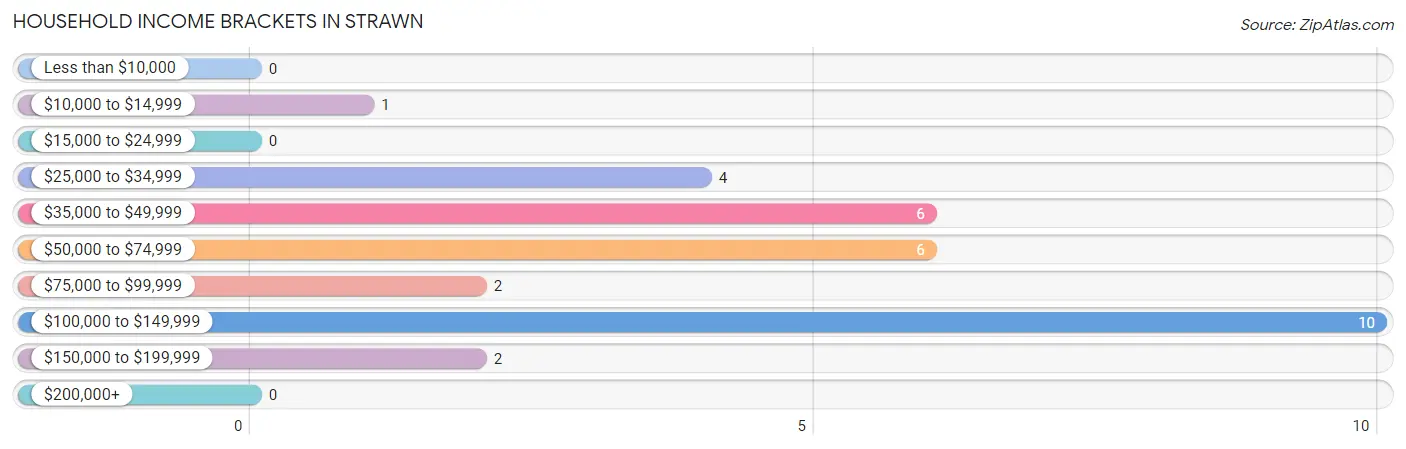
| Income Bracket | # Households | % Households |
| Less than $10,000 | 0 | 0.0% |
| $10,000 to $14,999 | 1 | 3.2% |
| $15,000 to $24,999 | 0 | 0.0% |
| $25,000 to $34,999 | 4 | 12.9% |
| $35,000 to $49,999 | 6 | 19.4% |
| $50,000 to $74,999 | 6 | 19.4% |
| $75,000 to $99,999 | 2 | 6.5% |
| $100,000 to $149,999 | 10 | 32.3% |
| $150,000 to $199,999 | 2 | 6.5% |
| $200,000+ | 0 | 0.0% |
Household Income by Householder Age in Strawn
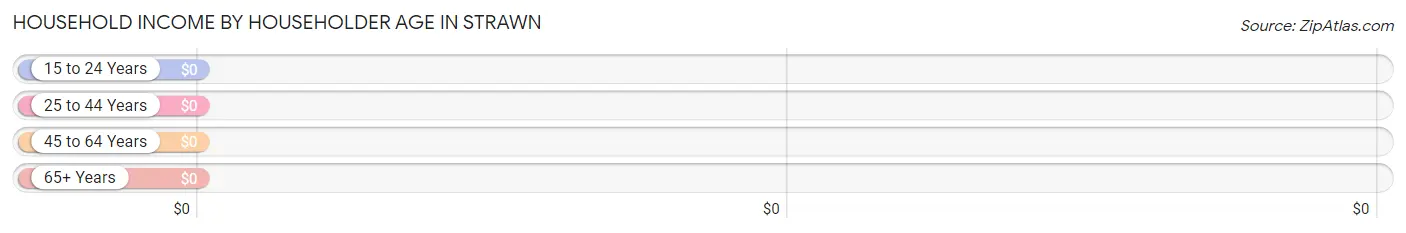
| Income Bracket | # Households | Median Income |
| 15 to 24 Years | 0 (0.0%) | $0 |
| 25 to 44 Years | 16 (51.6%) | $0 |
| 45 to 64 Years | 13 (41.9%) | $0 |
| 65+ Years | 2 (6.5%) | $0 |
| Total | 31 (100.0%) | $66,250 |
Poverty in Strawn
Income Below Poverty by Sex and Age in Strawn
With 17.1% poverty level for males and 47.2% for females among the residents of Strawn, 45 to 54 year old males and 6 to 11 year old females are the most vulnerable to poverty, with 4 males (44.4%) and 4 females (100.0%) in their respective age groups living below the poverty level.
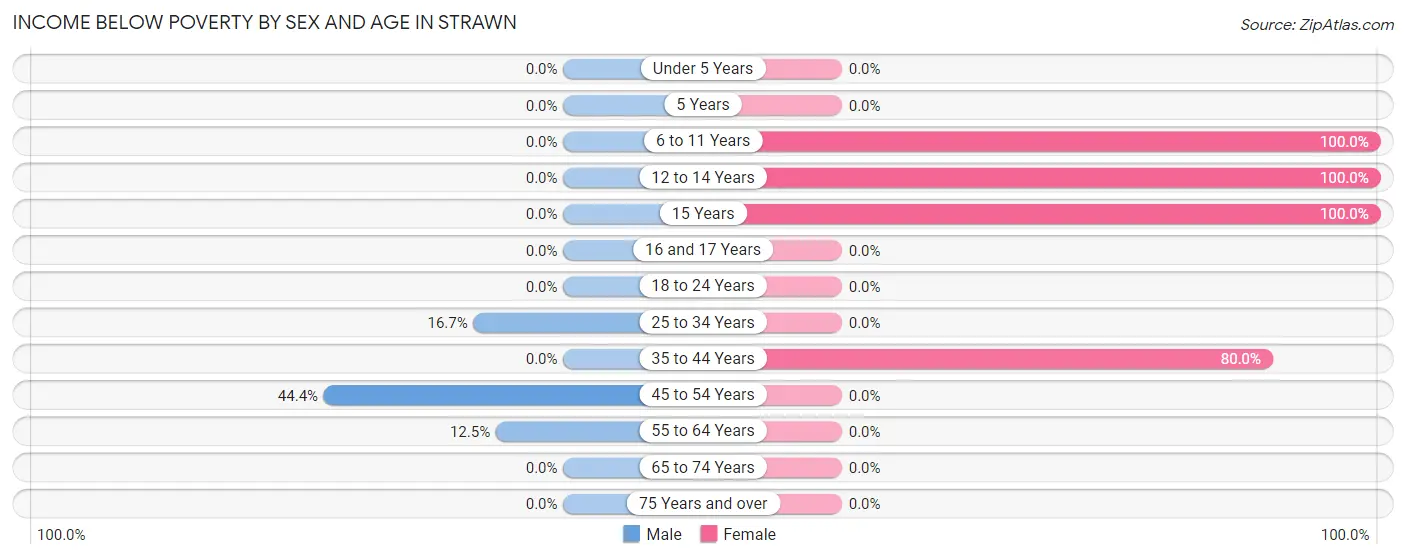
| Age Bracket | Male | Female |
| Under 5 Years | 0 (0.0%) | 0 (0.0%) |
| 5 Years | 0 (0.0%) | 0 (0.0%) |
| 6 to 11 Years | 0 (0.0%) | 4 (100.0%) |
| 12 to 14 Years | 0 (0.0%) | 5 (100.0%) |
| 15 Years | 0 (0.0%) | 4 (100.0%) |
| 16 and 17 Years | 0 (0.0%) | 0 (0.0%) |
| 18 to 24 Years | 0 (0.0%) | 0 (0.0%) |
| 25 to 34 Years | 2 (16.7%) | 0 (0.0%) |
| 35 to 44 Years | 0 (0.0%) | 4 (80.0%) |
| 45 to 54 Years | 4 (44.4%) | 0 (0.0%) |
| 55 to 64 Years | 1 (12.5%) | 0 (0.0%) |
| 65 to 74 Years | 0 (0.0%) | 0 (0.0%) |
| 75 Years and over | 0 (0.0%) | 0 (0.0%) |
| Total | 7 (17.1%) | 17 (47.2%) |
Income Above Poverty by Sex and Age in Strawn
According to the poverty statistics in Strawn, males aged under 5 years and females aged 16 and 17 years are the age groups that are most secure financially, with 100.0% of males and 100.0% of females in these age groups living above the poverty line.
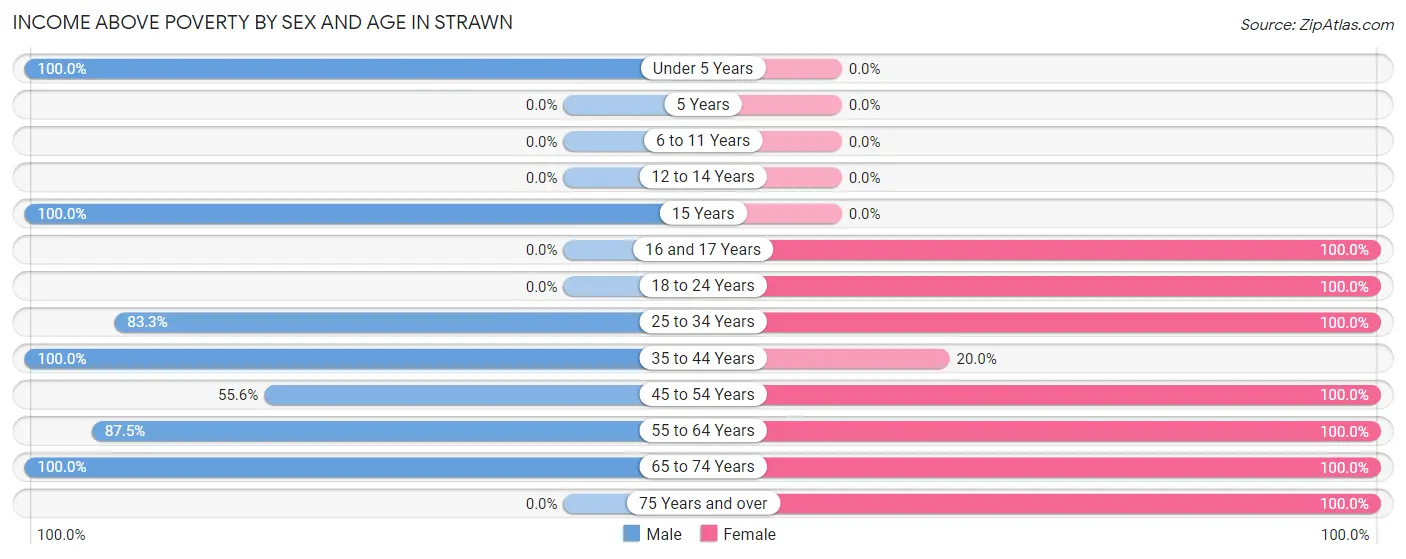
| Age Bracket | Male | Female |
| Under 5 Years | 6 (100.0%) | 0 (0.0%) |
| 5 Years | 0 (0.0%) | 0 (0.0%) |
| 6 to 11 Years | 0 (0.0%) | 0 (0.0%) |
| 12 to 14 Years | 0 (0.0%) | 0 (0.0%) |
| 15 Years | 3 (100.0%) | 0 (0.0%) |
| 16 and 17 Years | 0 (0.0%) | 2 (100.0%) |
| 18 to 24 Years | 0 (0.0%) | 1 (100.0%) |
| 25 to 34 Years | 10 (83.3%) | 7 (100.0%) |
| 35 to 44 Years | 2 (100.0%) | 1 (20.0%) |
| 45 to 54 Years | 5 (55.6%) | 2 (100.0%) |
| 55 to 64 Years | 7 (87.5%) | 4 (100.0%) |
| 65 to 74 Years | 1 (100.0%) | 1 (100.0%) |
| 75 Years and over | 0 (0.0%) | 1 (100.0%) |
| Total | 34 (82.9%) | 19 (52.8%) |
Income Below Poverty Among Married-Couple Families in Strawn
The poverty statistics for married-couple families in Strawn show that 28.6% or 4 of the total 14 families live below the poverty line. Families with 3 or 4 children have the highest poverty rate of 100.0%, comprising of 4 families. On the other hand, families with no children have the lowest poverty rate of 0.0%, which includes 0 families.
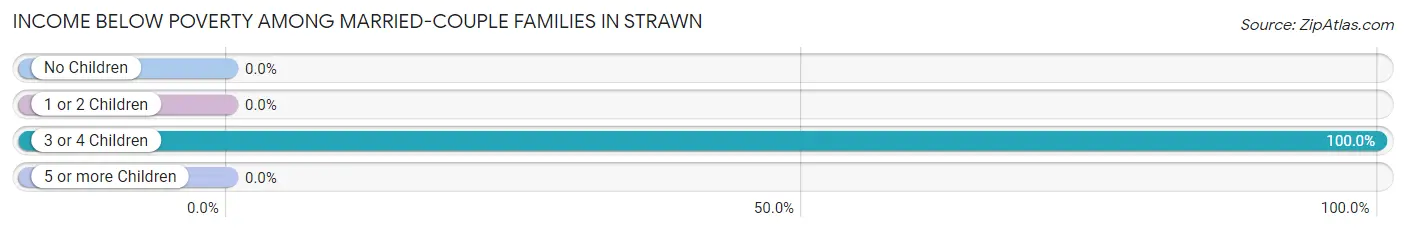
| Children | Above Poverty | Below Poverty |
| No Children | 2 (100.0%) | 0 (0.0%) |
| 1 or 2 Children | 8 (100.0%) | 0 (0.0%) |
| 3 or 4 Children | 0 (0.0%) | 4 (100.0%) |
| 5 or more Children | 0 (0.0%) | 0 (0.0%) |
| Total | 10 (71.4%) | 4 (28.6%) |
Income Below Poverty Among Single-Parent Households in Strawn
| Children | Single Father | Single Mother |
| No Children | 0 (0.0%) | 0 (0.0%) |
| 1 or 2 Children | 0 (0.0%) | 0 (0.0%) |
| 3 or 4 Children | 0 (0.0%) | 0 (0.0%) |
| 5 or more Children | 0 (0.0%) | 0 (0.0%) |
| Total | 0 (0.0%) | 0 (0.0%) |
Income Below Poverty Among Married-Couple vs Single-Parent Households in Strawn
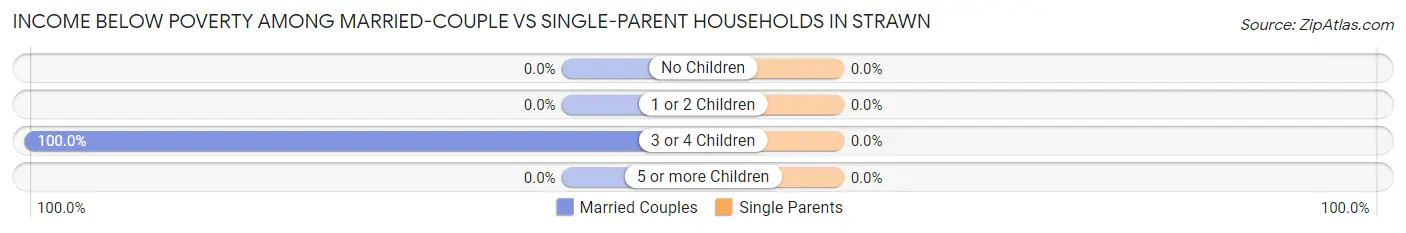
| Children | Married-Couple Families | Single-Parent Households |
| No Children | 0 (0.0%) | 0 (0.0%) |
| 1 or 2 Children | 0 (0.0%) | 0 (0.0%) |
| 3 or 4 Children | 4 (100.0%) | 0 (0.0%) |
| 5 or more Children | 0 (0.0%) | 0 (0.0%) |
| Total | 4 (28.6%) | 0 (0.0%) |
Race in Strawn
The most populous races in Strawn are , and White / Caucasian (77 | 100.0%).
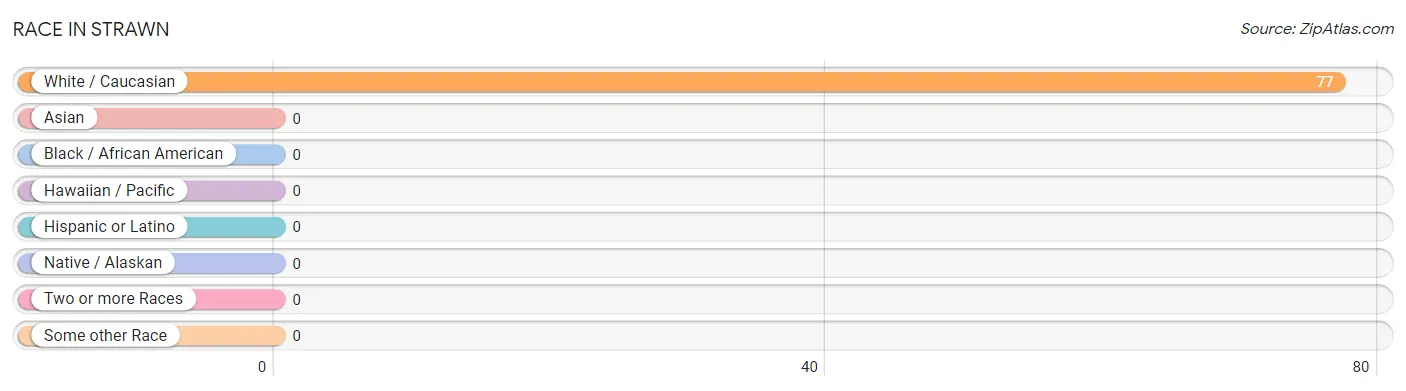
| Race | # Population | % Population |
| Asian | 0 | 0.0% |
| Black / African American | 0 | 0.0% |
| Hawaiian / Pacific | 0 | 0.0% |
| Hispanic or Latino | 0 | 0.0% |
| Native / Alaskan | 0 | 0.0% |
| White / Caucasian | 77 | 100.0% |
| Two or more Races | 0 | 0.0% |
| Some other Race | 0 | 0.0% |
| Total | 77 | 100.0% |
Ancestry in Strawn
The most populous ancestries reported in Strawn are Irish (26 | 33.8%), American (23 | 29.9%), German (13 | 16.9%), English (2 | 2.6%), and Italian (1 | 1.3%), together accounting for 84.4% of all Strawn residents.
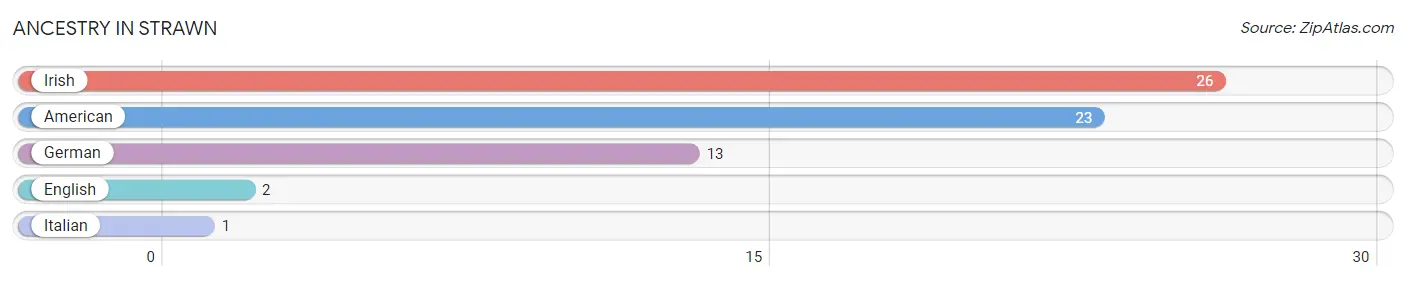
| Ancestry | # Population | % Population |
| American | 23 | 29.9% |
| English | 2 | 2.6% |
| German | 13 | 16.9% |
| Irish | 26 | 33.8% |
| Italian | 1 | 1.3% | View All 5 Rows |
Immigrants in Strawn

| Immigration Origin | # Population | % Population | View All 0 Rows |
Sex and Age in Strawn
Sex and Age in Strawn
The most populous age groups in Strawn are 30 to 34 Years (10 | 24.4%) for men and 25 to 29 Years (7 | 19.4%) for women.
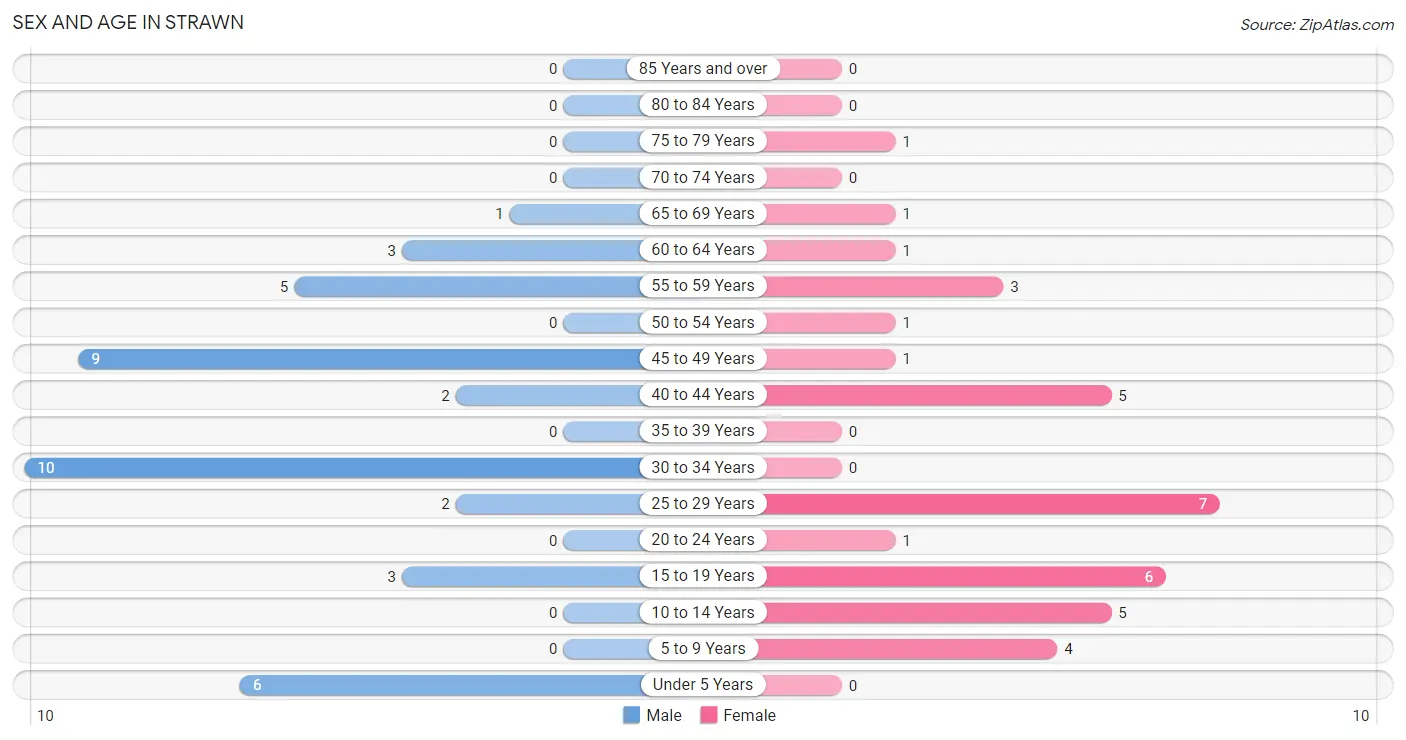
| Age Bracket | Male | Female |
| Under 5 Years | 6 (14.6%) | 0 (0.0%) |
| 5 to 9 Years | 0 (0.0%) | 4 (11.1%) |
| 10 to 14 Years | 0 (0.0%) | 5 (13.9%) |
| 15 to 19 Years | 3 (7.3%) | 6 (16.7%) |
| 20 to 24 Years | 0 (0.0%) | 1 (2.8%) |
| 25 to 29 Years | 2 (4.9%) | 7 (19.4%) |
| 30 to 34 Years | 10 (24.4%) | 0 (0.0%) |
| 35 to 39 Years | 0 (0.0%) | 0 (0.0%) |
| 40 to 44 Years | 2 (4.9%) | 5 (13.9%) |
| 45 to 49 Years | 9 (22.0%) | 1 (2.8%) |
| 50 to 54 Years | 0 (0.0%) | 1 (2.8%) |
| 55 to 59 Years | 5 (12.2%) | 3 (8.3%) |
| 60 to 64 Years | 3 (7.3%) | 1 (2.8%) |
| 65 to 69 Years | 1 (2.4%) | 1 (2.8%) |
| 70 to 74 Years | 0 (0.0%) | 0 (0.0%) |
| 75 to 79 Years | 0 (0.0%) | 1 (2.8%) |
| 80 to 84 Years | 0 (0.0%) | 0 (0.0%) |
| 85 Years and over | 0 (0.0%) | 0 (0.0%) |
| Total | 41 (100.0%) | 36 (100.0%) |
Families and Households in Strawn
Median Family Size in Strawn
The median family size in Strawn is 3.35 persons per family, with married-couple families (14 | 82.4%) accounting for the largest median family size of 3.64 persons per family. On the other hand, single male/father families (2 | 11.8%) represent the smallest median family size with 2.00 persons per family.
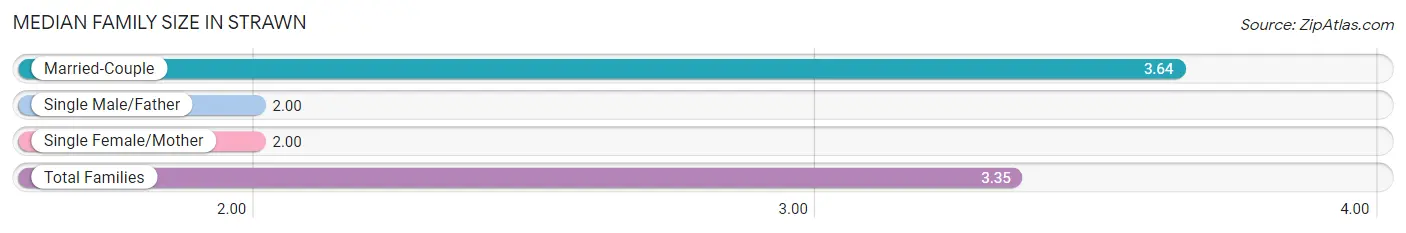
| Family Type | # Families | Family Size |
| Married-Couple | 14 (82.4%) | 3.64 |
| Single Male/Father | 2 (11.8%) | 2.00 |
| Single Female/Mother | 1 (5.9%) | 2.00 |
| Total Families | 17 (100.0%) | 3.35 |
Median Household Size in Strawn
The median household size in Strawn is 2.48 persons per household, with single female/mother households (1 | 3.2%) accounting for the largest median household size of 4 persons per household. non-family households (14 | 45.2%) represent the smallest median household size with 1.29 persons per household.
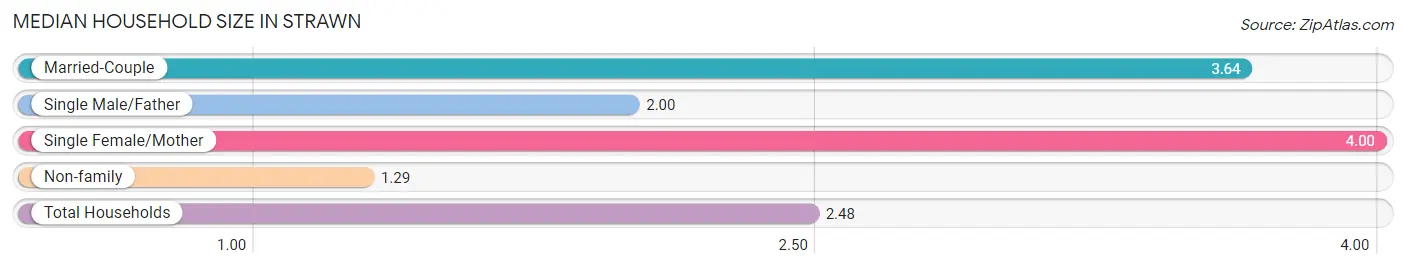
| Household Type | # Households | Household Size |
| Married-Couple | 14 (45.2%) | 3.64 |
| Single Male/Father | 2 (6.5%) | 2.00 |
| Single Female/Mother | 1 (3.2%) | 4.00 |
| Non-family | 14 (45.2%) | 1.29 |
| Total Households | 31 (100.0%) | 2.48 |
Household Size by Marriage Status in Strawn
Out of a total of 31 households in Strawn, 17 (54.8%) are family households, while 14 (45.2%) are nonfamily households. The most numerous type of family households are 3-person households, comprising 9, and the most common type of nonfamily households are 1-person households, comprising 11.
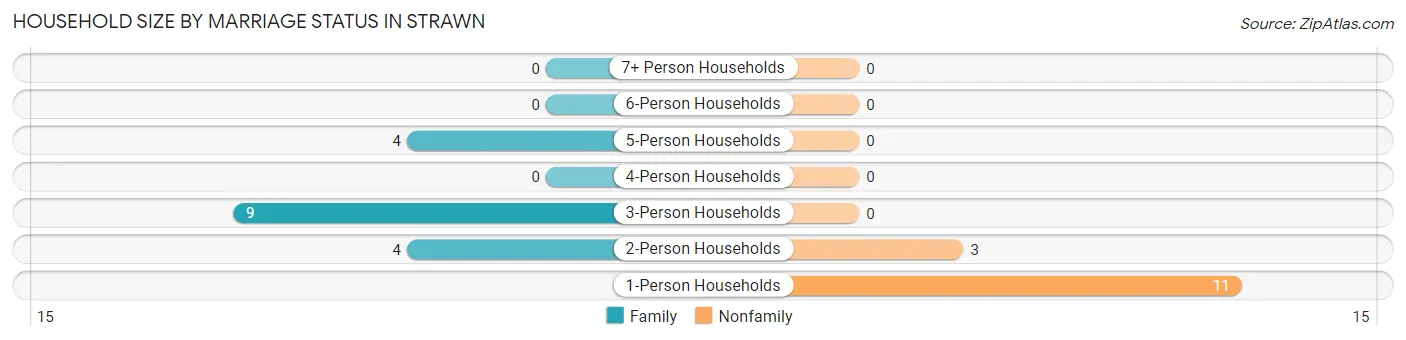
| Household Size | Family Households | Nonfamily Households |
| 1-Person Households | - | 11 (35.5%) |
| 2-Person Households | 4 (12.9%) | 3 (9.7%) |
| 3-Person Households | 9 (29.0%) | 0 (0.0%) |
| 4-Person Households | 0 (0.0%) | 0 (0.0%) |
| 5-Person Households | 4 (12.9%) | 0 (0.0%) |
| 6-Person Households | 0 (0.0%) | 0 (0.0%) |
| 7+ Person Households | 0 (0.0%) | 0 (0.0%) |
| Total | 17 (54.8%) | 14 (45.2%) |
Female Fertility in Strawn
Fertility by Age in Strawn
Average fertility rate in Strawn is 286.0 births per 1,000 women. Women in the age bracket of 20 to 34 years have the highest fertility rate with 750.0 births per 1,000 women. Women in the age bracket of 20 to 34 years acount for 100.0% of all women with births.
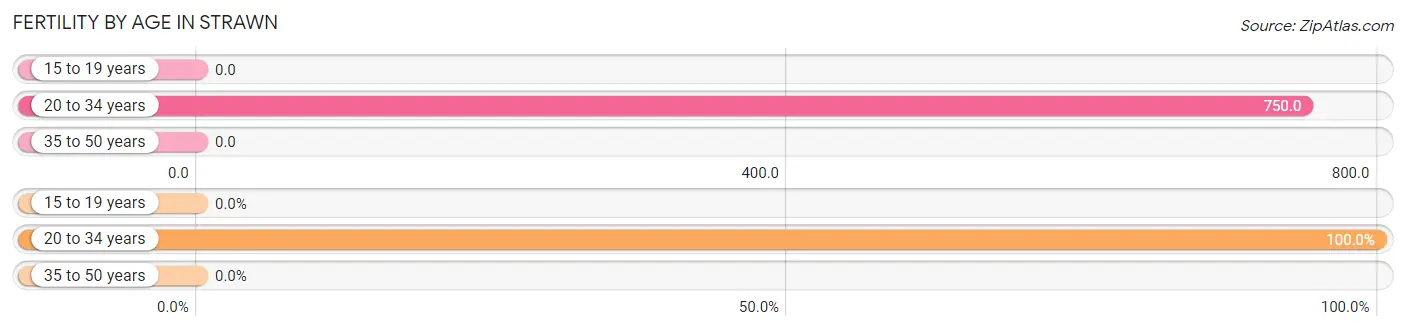
| Age Bracket | Women with Births | Births / 1,000 Women |
| 15 to 19 years | 0 (0.0%) | 0.0 |
| 20 to 34 years | 6 (100.0%) | 750.0 |
| 35 to 50 years | 0 (0.0%) | 0.0 |
| Total | 6 (100.0%) | 286.0 |
Fertility by Age by Marriage Status in Strawn
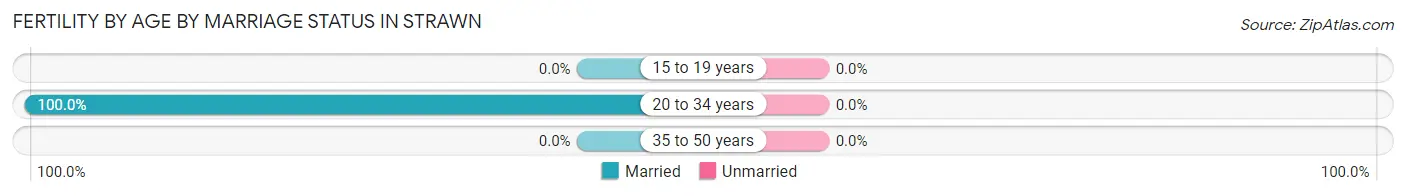
| Age Bracket | Married | Unmarried |
| 15 to 19 years | 0 (0.0%) | 0 (0.0%) |
| 20 to 34 years | 6 (100.0%) | 0 (0.0%) |
| 35 to 50 years | 0 (0.0%) | 0 (0.0%) |
| Total | 6 (100.0%) | 0 (0.0%) |
Fertility by Education in Strawn
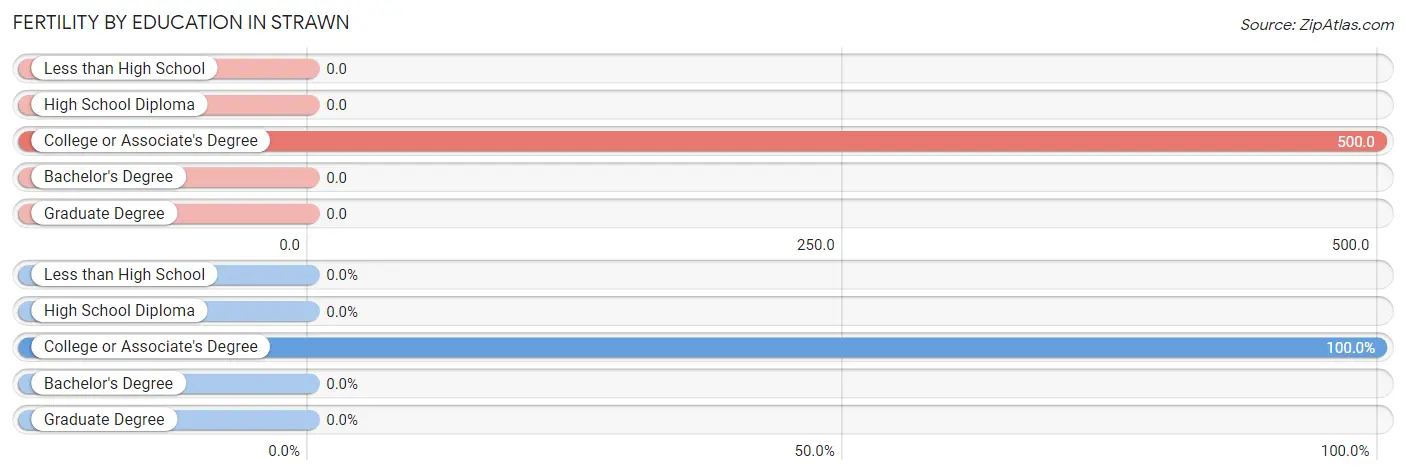
| Educational Attainment | Women with Births | Births / 1,000 Women |
| Less than High School | 0 (0.0%) | 0.0 |
| High School Diploma | 0 (0.0%) | 0.0 |
| College or Associate's Degree | 6 (100.0%) | 500.0 |
| Bachelor's Degree | 0 (0.0%) | 0.0 |
| Graduate Degree | 0 (0.0%) | 0.0 |
| Total | 6 (100.0%) | 286.0 |
Fertility by Education by Marriage Status in Strawn
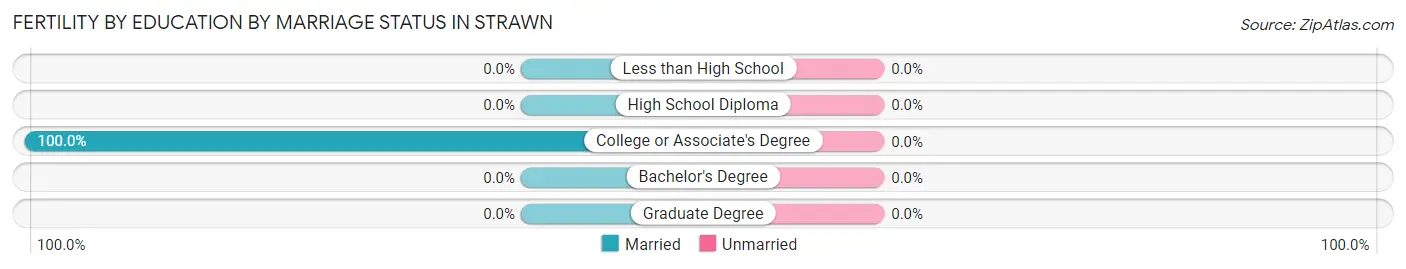
| Educational Attainment | Married | Unmarried |
| Less than High School | 0 (0.0%) | 0 (0.0%) |
| High School Diploma | 0 (0.0%) | 0 (0.0%) |
| College or Associate's Degree | 6 (100.0%) | 0 (0.0%) |
| Bachelor's Degree | 0 (0.0%) | 0 (0.0%) |
| Graduate Degree | 0 (0.0%) | 0 (0.0%) |
| Total | 6 (100.0%) | 0 (0.0%) |
Employment Characteristics in Strawn
Employment by Class of Employer in Strawn
Among the 42 employed individuals in Strawn, private company employees (40 | 95.2%), self-employed (incorporated) (1 | 2.4%), and not-for-profit organizations (1 | 2.4%) make up the most common classes of employment.
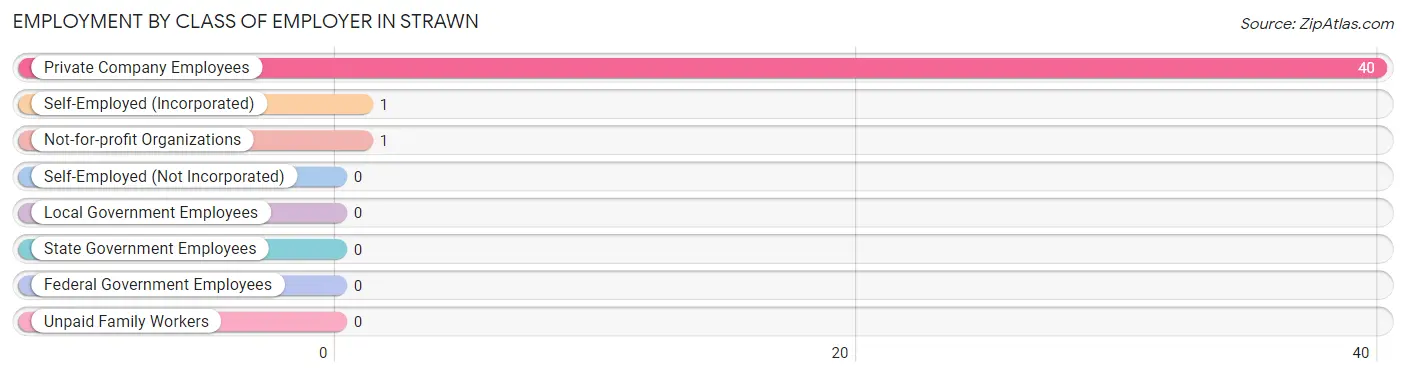
| Employer Class | # Employees | % Employees |
| Private Company Employees | 40 | 95.2% |
| Self-Employed (Incorporated) | 1 | 2.4% |
| Self-Employed (Not Incorporated) | 0 | 0.0% |
| Not-for-profit Organizations | 1 | 2.4% |
| Local Government Employees | 0 | 0.0% |
| State Government Employees | 0 | 0.0% |
| Federal Government Employees | 0 | 0.0% |
| Unpaid Family Workers | 0 | 0.0% |
| Total | 42 | 100.0% |
Employment Status by Age in Strawn
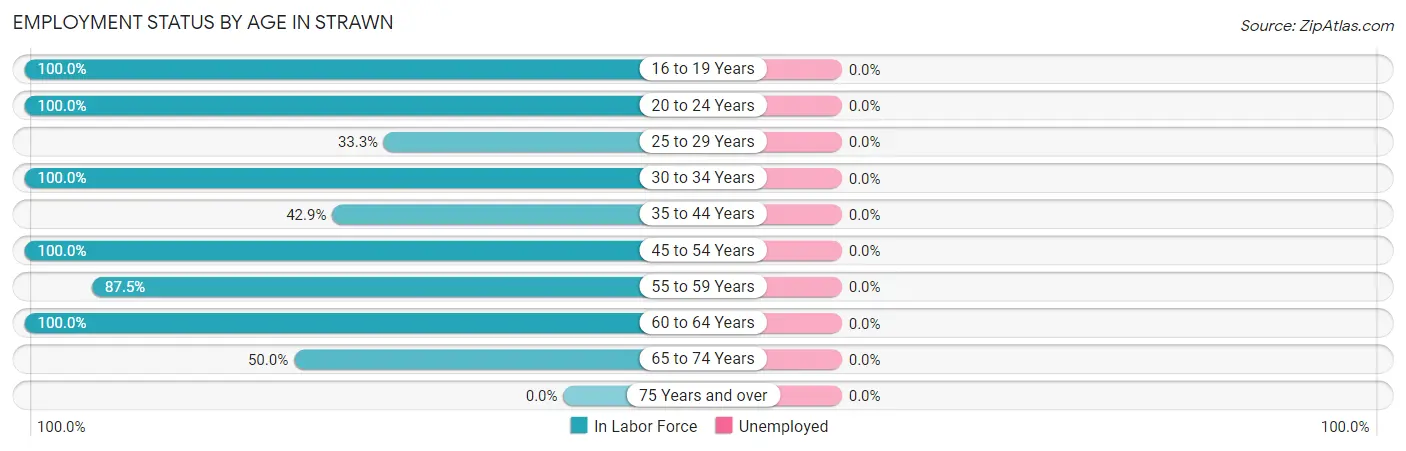
| Age Bracket | In Labor Force | Unemployed |
| 16 to 19 Years | 2 (100.0%) | 0 (0.0%) |
| 20 to 24 Years | 1 (100.0%) | 0 (0.0%) |
| 25 to 29 Years | 3 (33.3%) | 0 (0.0%) |
| 30 to 34 Years | 10 (100.0%) | 0 (0.0%) |
| 35 to 44 Years | 3 (42.9%) | 0 (0.0%) |
| 45 to 54 Years | 11 (100.0%) | 0 (0.0%) |
| 55 to 59 Years | 7 (87.5%) | 0 (0.0%) |
| 60 to 64 Years | 4 (100.0%) | 0 (0.0%) |
| 65 to 74 Years | 1 (50.0%) | 0 (0.0%) |
| 75 Years and over | 0 (0.0%) | 0 (0.0%) |
| Total | 42 (76.4%) | 0 (0.0%) |
Employment Status by Educational Attainment in Strawn
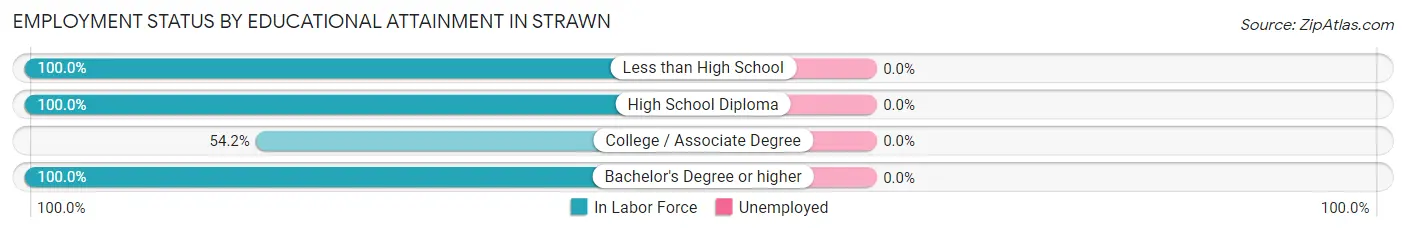
| Educational Attainment | In Labor Force | Unemployed |
| Less than High School | 2 (100.0%) | 0 (0.0%) |
| High School Diploma | 21 (100.0%) | 0 (0.0%) |
| College / Associate Degree | 13 (54.2%) | 0 (0.0%) |
| Bachelor's Degree or higher | 2 (100.0%) | 0 (0.0%) |
| Total | 38 (77.6%) | 0 (0.0%) |
Employment Occupations by Sex in Strawn
Management, Business, Science and Arts Occupations
The most common Management, Business, Science and Arts occupations in Strawn are Management (3 | 7.1%), Business & Financial (3 | 7.1%), Computers, Engineering & Science (2 | 4.8%), Health Diagnosing & Treating (2 | 4.8%), and Computers & Mathematics (1 | 2.4%).
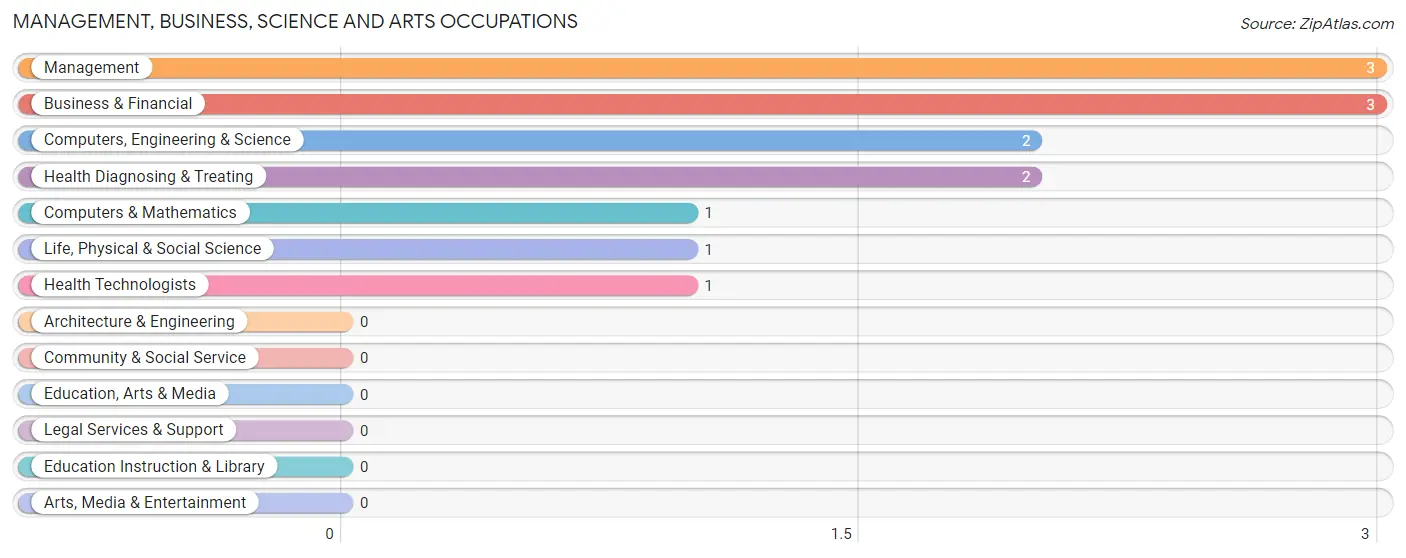
Management, Business, Science and Arts Occupations by Sex
Within the Management, Business, Science and Arts occupations in Strawn, the most male-oriented occupations are Life, Physical & Social Science (100.0%), Management (66.7%), and Computers, Engineering & Science (50.0%), while the most female-oriented occupations are Business & Financial (100.0%), Computers & Mathematics (100.0%), and Health Diagnosing & Treating (100.0%).
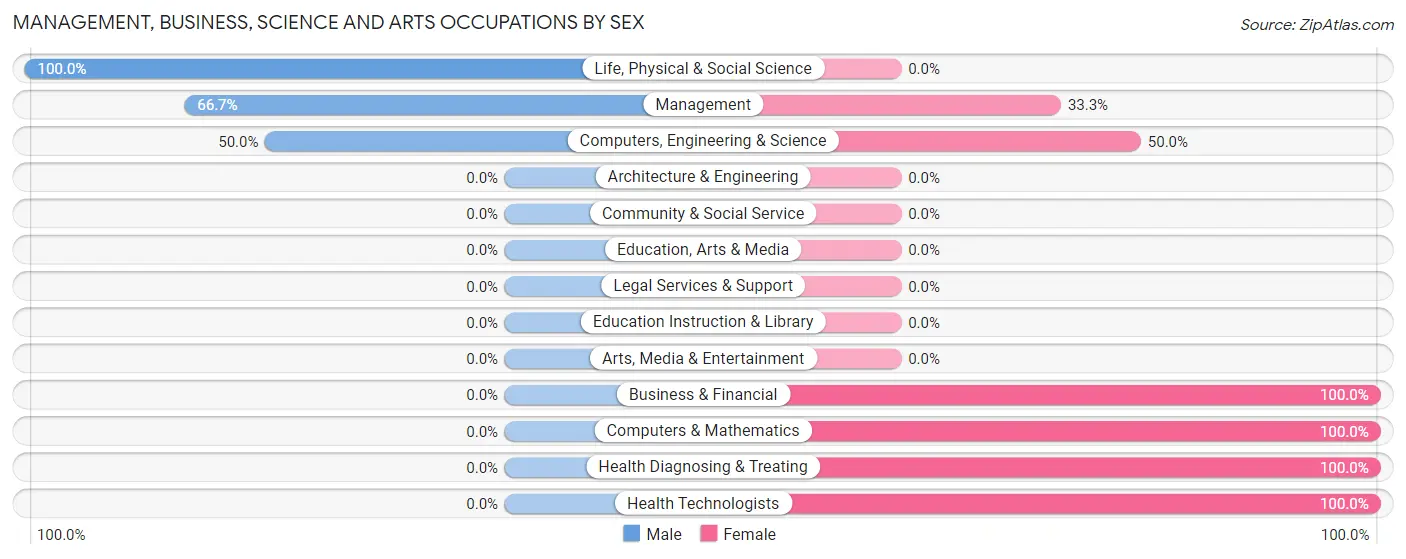
| Occupation | Male | Female |
| Management | 2 (66.7%) | 1 (33.3%) |
| Business & Financial | 0 (0.0%) | 3 (100.0%) |
| Computers, Engineering & Science | 1 (50.0%) | 1 (50.0%) |
| Computers & Mathematics | 0 (0.0%) | 1 (100.0%) |
| Architecture & Engineering | 0 (0.0%) | 0 (0.0%) |
| Life, Physical & Social Science | 1 (100.0%) | 0 (0.0%) |
| Community & Social Service | 0 (0.0%) | 0 (0.0%) |
| Education, Arts & Media | 0 (0.0%) | 0 (0.0%) |
| Legal Services & Support | 0 (0.0%) | 0 (0.0%) |
| Education Instruction & Library | 0 (0.0%) | 0 (0.0%) |
| Arts, Media & Entertainment | 0 (0.0%) | 0 (0.0%) |
| Health Diagnosing & Treating | 0 (0.0%) | 2 (100.0%) |
| Health Technologists | 0 (0.0%) | 1 (100.0%) |
| Total (Category) | 3 (30.0%) | 7 (70.0%) |
| Total (Overall) | 31 (73.8%) | 11 (26.2%) |
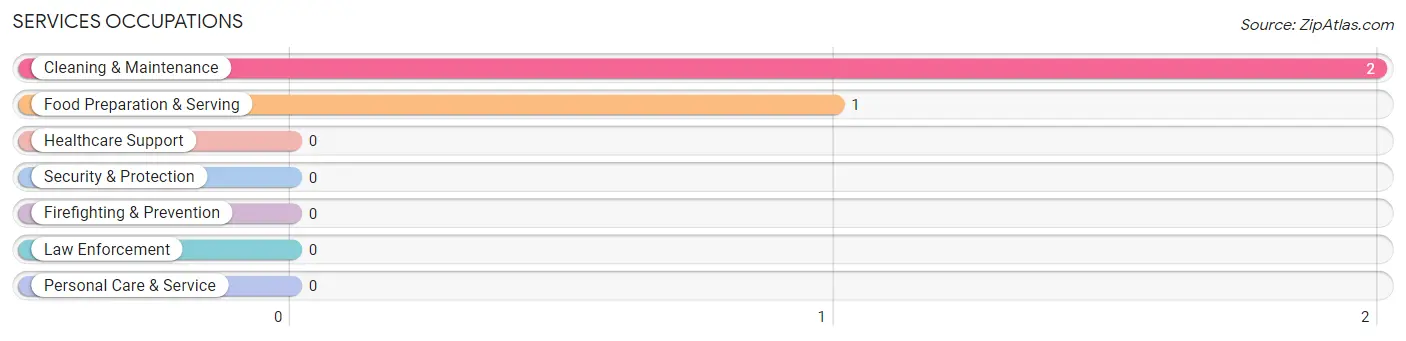
Services Occupations
The most common Services occupations in Strawn are Cleaning & Maintenance (2 | 4.8%), and Food Preparation & Serving (1 | 2.4%).
Services Occupations by Sex
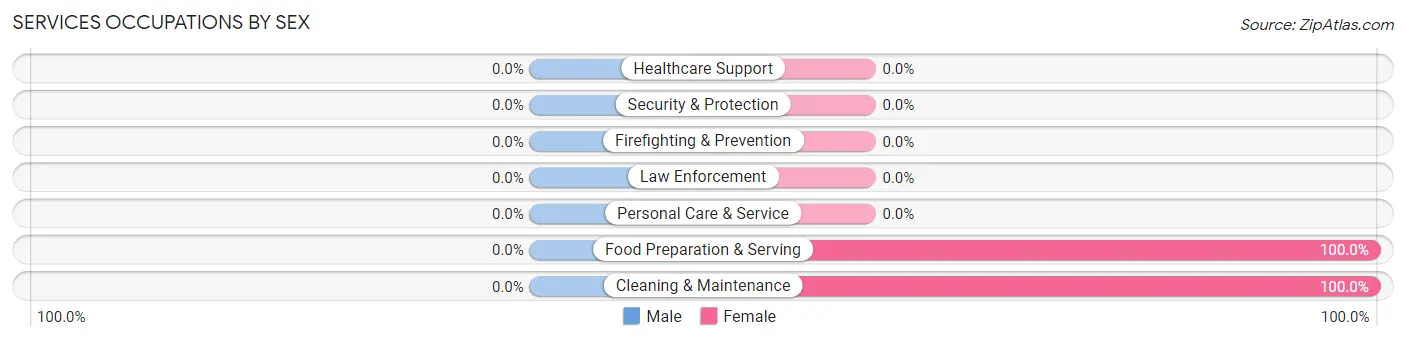
| Occupation | Male | Female |
| Healthcare Support | 0 (0.0%) | 0 (0.0%) |
| Security & Protection | 0 (0.0%) | 0 (0.0%) |
| Firefighting & Prevention | 0 (0.0%) | 0 (0.0%) |
| Law Enforcement | 0 (0.0%) | 0 (0.0%) |
| Food Preparation & Serving | 0 (0.0%) | 1 (100.0%) |
| Cleaning & Maintenance | 0 (0.0%) | 2 (100.0%) |
| Personal Care & Service | 0 (0.0%) | 0 (0.0%) |
| Total (Category) | 0 (0.0%) | 3 (100.0%) |
| Total (Overall) | 31 (73.8%) | 11 (26.2%) |
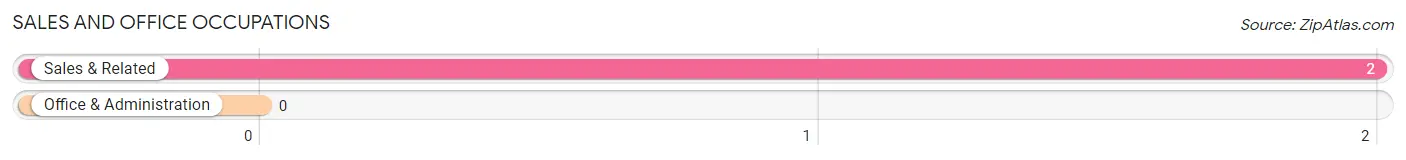
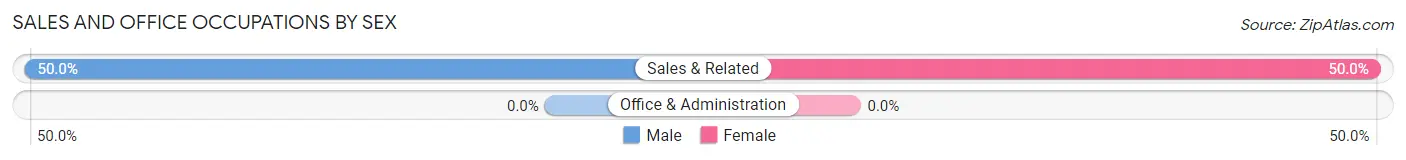
Sales and Office Occupations
The most common Sales and Office occupations in Strawn are , and Sales & Related (2 | 4.8%).
Sales and Office Occupations by Sex
| Occupation | Male | Female |
| Sales & Related | 1 (50.0%) | 1 (50.0%) |
| Office & Administration | 0 (0.0%) | 0 (0.0%) |
| Total (Category) | 1 (50.0%) | 1 (50.0%) |
| Total (Overall) | 31 (73.8%) | 11 (26.2%) |
Natural Resources, Construction and Maintenance Occupations
The most common Natural Resources, Construction and Maintenance occupations in Strawn are Construction & Extraction (6 | 14.3%), and Farming, Fishing & Forestry (3 | 7.1%).
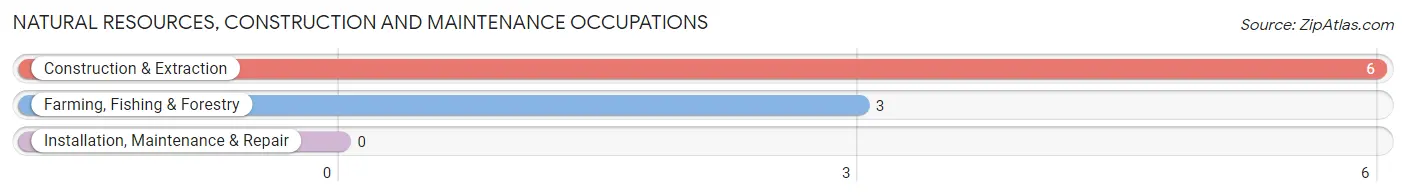
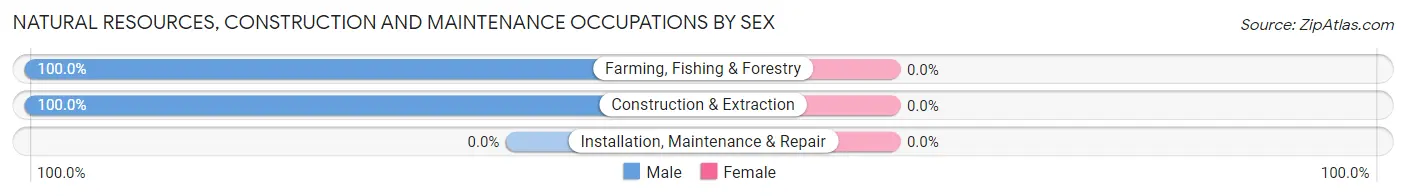
Natural Resources, Construction and Maintenance Occupations by Sex
| Occupation | Male | Female |
| Farming, Fishing & Forestry | 3 (100.0%) | 0 (0.0%) |
| Construction & Extraction | 6 (100.0%) | 0 (0.0%) |
| Installation, Maintenance & Repair | 0 (0.0%) | 0 (0.0%) |
| Total (Category) | 9 (100.0%) | 0 (0.0%) |
| Total (Overall) | 31 (73.8%) | 11 (26.2%) |
Production, Transportation and Moving Occupations
The most common Production, Transportation and Moving occupations in Strawn are Transportation (10 | 23.8%), Production (5 | 11.9%), and Material Moving (3 | 7.1%).
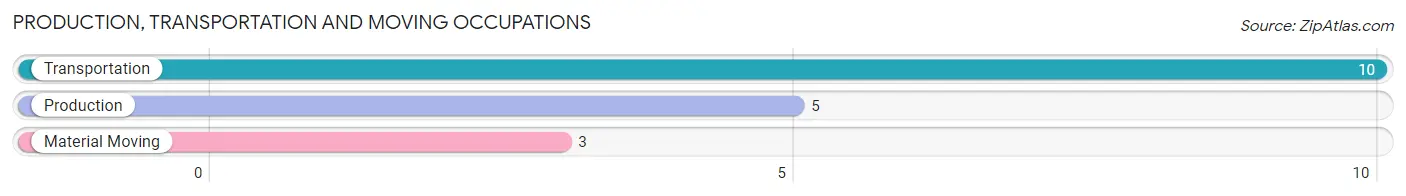
Production, Transportation and Moving Occupations by Sex
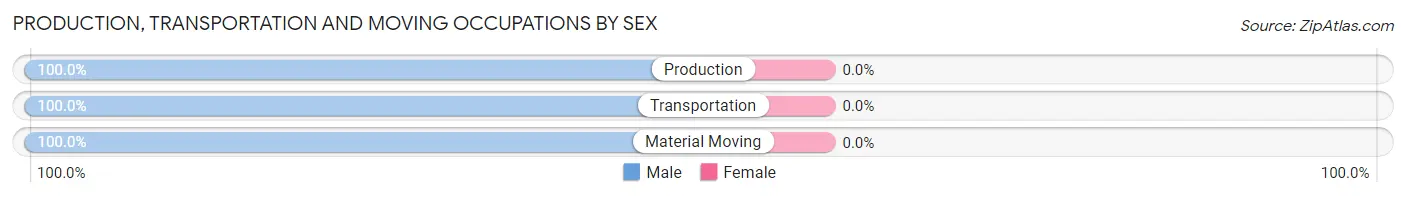
| Occupation | Male | Female |
| Production | 5 (100.0%) | 0 (0.0%) |
| Transportation | 10 (100.0%) | 0 (0.0%) |
| Material Moving | 3 (100.0%) | 0 (0.0%) |
| Total (Category) | 18 (100.0%) | 0 (0.0%) |
| Total (Overall) | 31 (73.8%) | 11 (26.2%) |
Employment Industries by Sex in Strawn
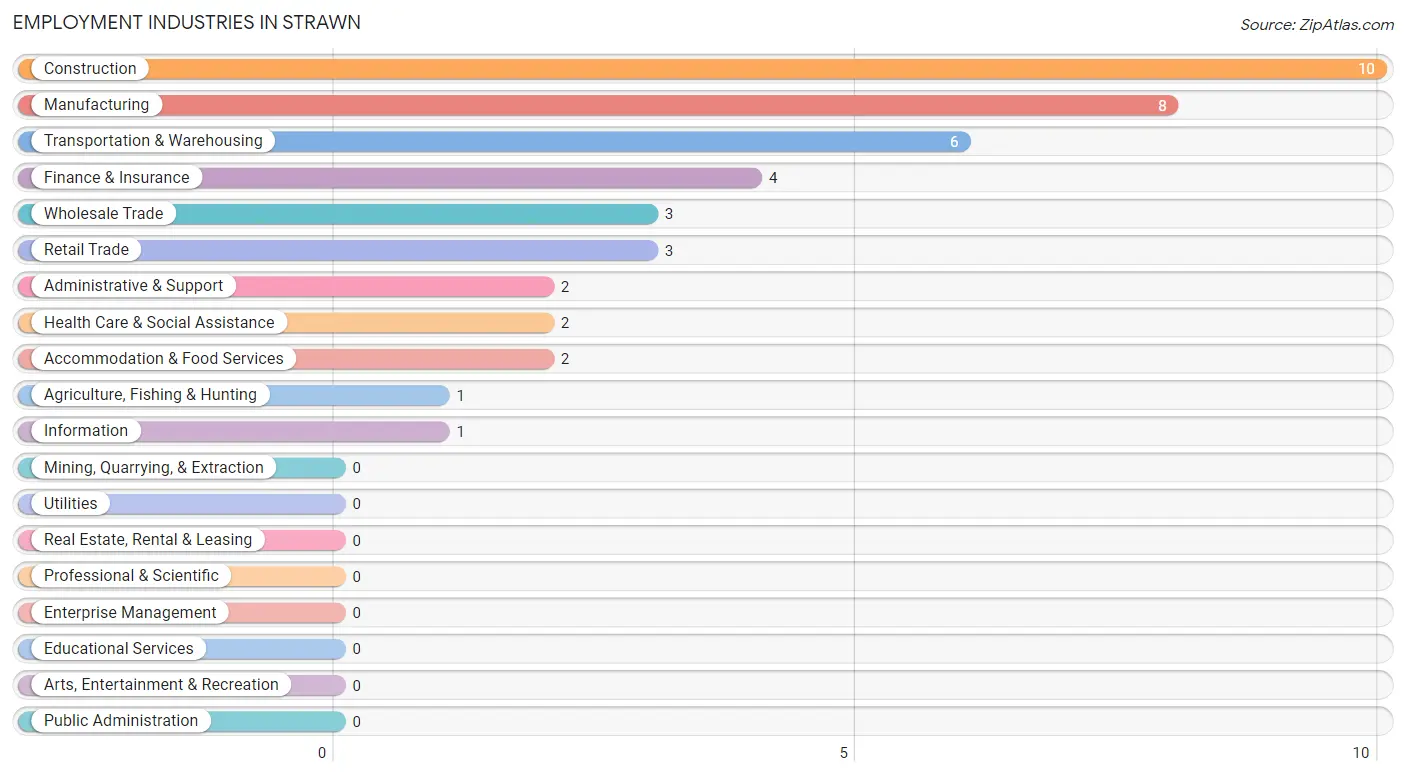
Employment Industries in Strawn
The major employment industries in Strawn include Construction (10 | 23.8%), Manufacturing (8 | 19.1%), Transportation & Warehousing (6 | 14.3%), Finance & Insurance (4 | 9.5%), and Wholesale Trade (3 | 7.1%).
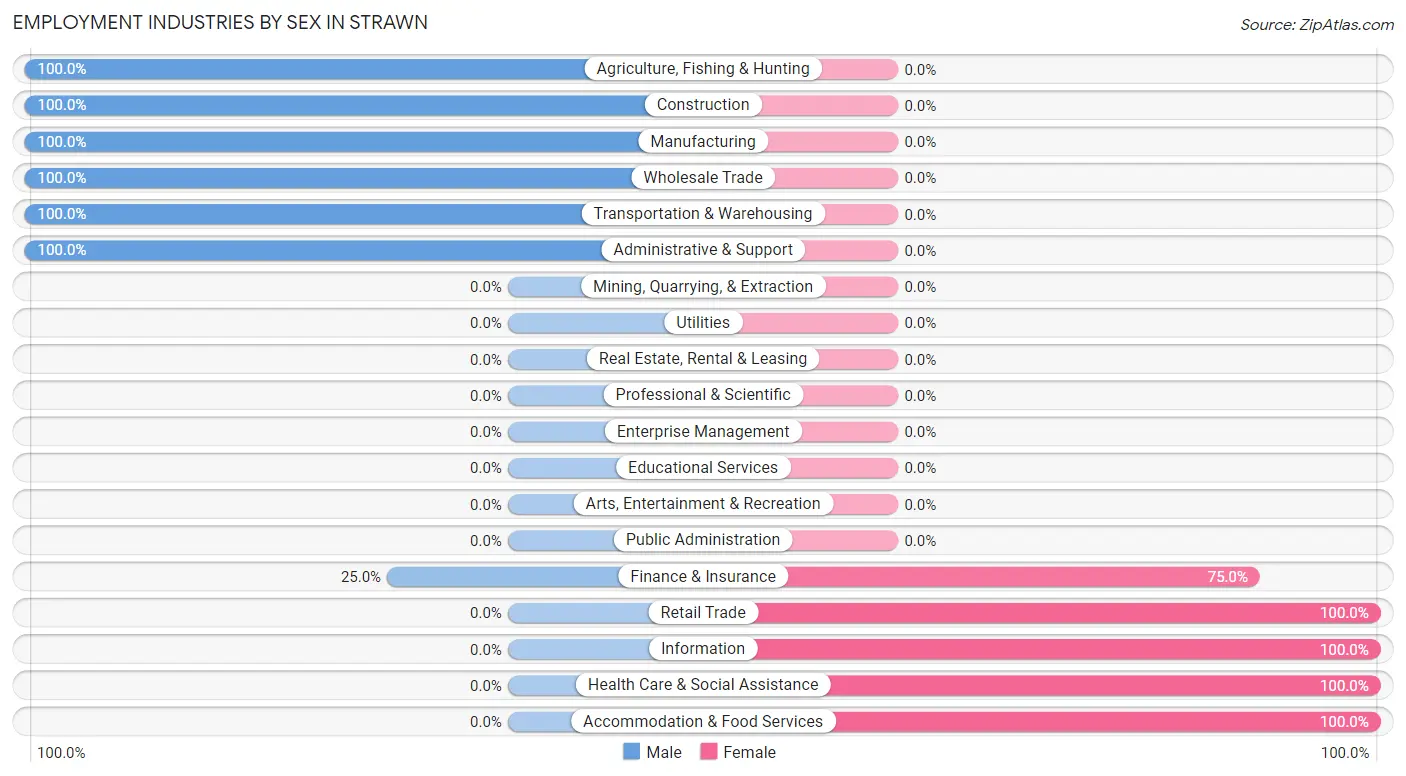
Employment Industries by Sex in Strawn
The Strawn industries that see more men than women are Agriculture, Fishing & Hunting (100.0%), Construction (100.0%), and Manufacturing (100.0%), whereas the industries that tend to have a higher number of women are Retail Trade (100.0%), Information (100.0%), and Health Care & Social Assistance (100.0%).
| Industry | Male | Female |
| Agriculture, Fishing & Hunting | 1 (100.0%) | 0 (0.0%) |
| Mining, Quarrying, & Extraction | 0 (0.0%) | 0 (0.0%) |
| Construction | 10 (100.0%) | 0 (0.0%) |
| Manufacturing | 8 (100.0%) | 0 (0.0%) |
| Wholesale Trade | 3 (100.0%) | 0 (0.0%) |
| Retail Trade | 0 (0.0%) | 3 (100.0%) |
| Transportation & Warehousing | 6 (100.0%) | 0 (0.0%) |
| Utilities | 0 (0.0%) | 0 (0.0%) |
| Information | 0 (0.0%) | 1 (100.0%) |
| Finance & Insurance | 1 (25.0%) | 3 (75.0%) |
| Real Estate, Rental & Leasing | 0 (0.0%) | 0 (0.0%) |
| Professional & Scientific | 0 (0.0%) | 0 (0.0%) |
| Enterprise Management | 0 (0.0%) | 0 (0.0%) |
| Administrative & Support | 2 (100.0%) | 0 (0.0%) |
| Educational Services | 0 (0.0%) | 0 (0.0%) |
| Health Care & Social Assistance | 0 (0.0%) | 2 (100.0%) |
| Arts, Entertainment & Recreation | 0 (0.0%) | 0 (0.0%) |
| Accommodation & Food Services | 0 (0.0%) | 2 (100.0%) |
| Public Administration | 0 (0.0%) | 0 (0.0%) |
| Total | 31 (73.8%) | 11 (26.2%) |
Education in Strawn
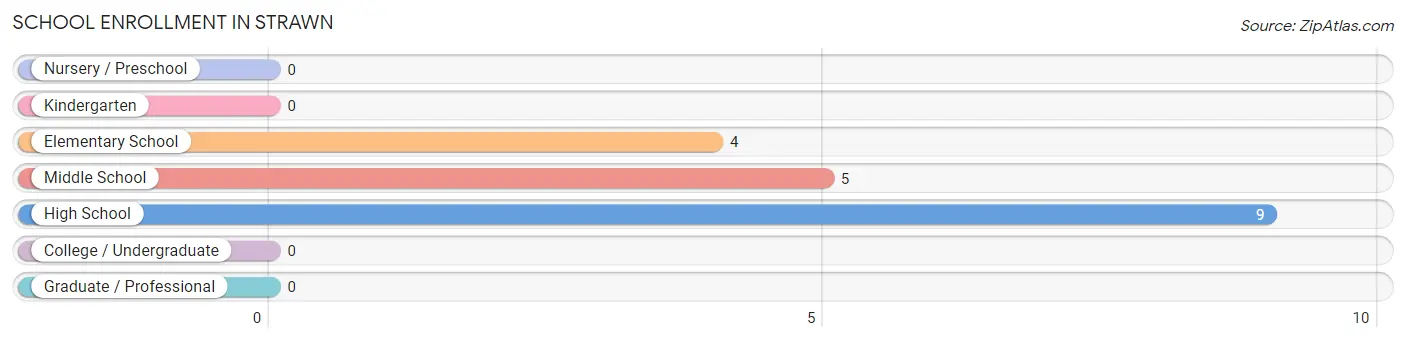
School Enrollment in Strawn
The most common levels of schooling among the 18 students in Strawn are high school (9 | 50.0%), middle school (5 | 27.8%), and elementary school (4 | 22.2%).
| School Level | # Students | % Students |
| Nursery / Preschool | 0 | 0.0% |
| Kindergarten | 0 | 0.0% |
| Elementary School | 4 | 22.2% |
| Middle School | 5 | 27.8% |
| High School | 9 | 50.0% |
| College / Undergraduate | 0 | 0.0% |
| Graduate / Professional | 0 | 0.0% |
| Total | 18 | 100.0% |
School Enrollment by Age by Funding Source in Strawn
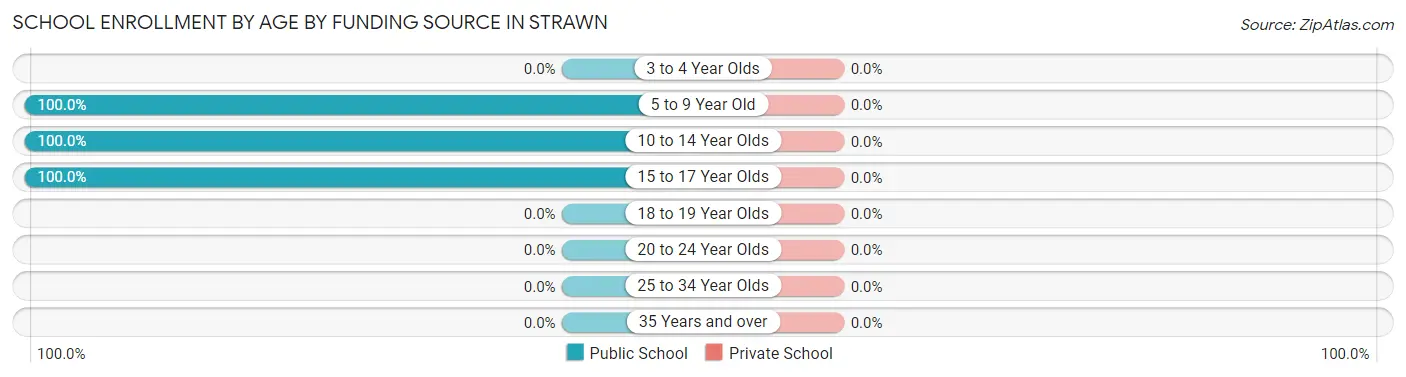
| Age Bracket | Public School | Private School |
| 3 to 4 Year Olds | 0 (0.0%) | 0 (0.0%) |
| 5 to 9 Year Old | 4 (100.0%) | 0 (0.0%) |
| 10 to 14 Year Olds | 5 (100.0%) | 0 (0.0%) |
| 15 to 17 Year Olds | 9 (100.0%) | 0 (0.0%) |
| 18 to 19 Year Olds | 0 (0.0%) | 0 (0.0%) |
| 20 to 24 Year Olds | 0 (0.0%) | 0 (0.0%) |
| 25 to 34 Year Olds | 0 (0.0%) | 0 (0.0%) |
| 35 Years and over | 0 (0.0%) | 0 (0.0%) |
| Total | 18 (100.0%) | 0 (0.0%) |
Educational Attainment by Field of Study in Strawn
Bio, nature & agricultural (1 | 25.0%), business (1 | 25.0%), education (1 | 25.0%), and liberal arts & history (1 | 25.0%) are the most common fields of study among 4 individuals in Strawn who have obtained a bachelor's degree or higher.
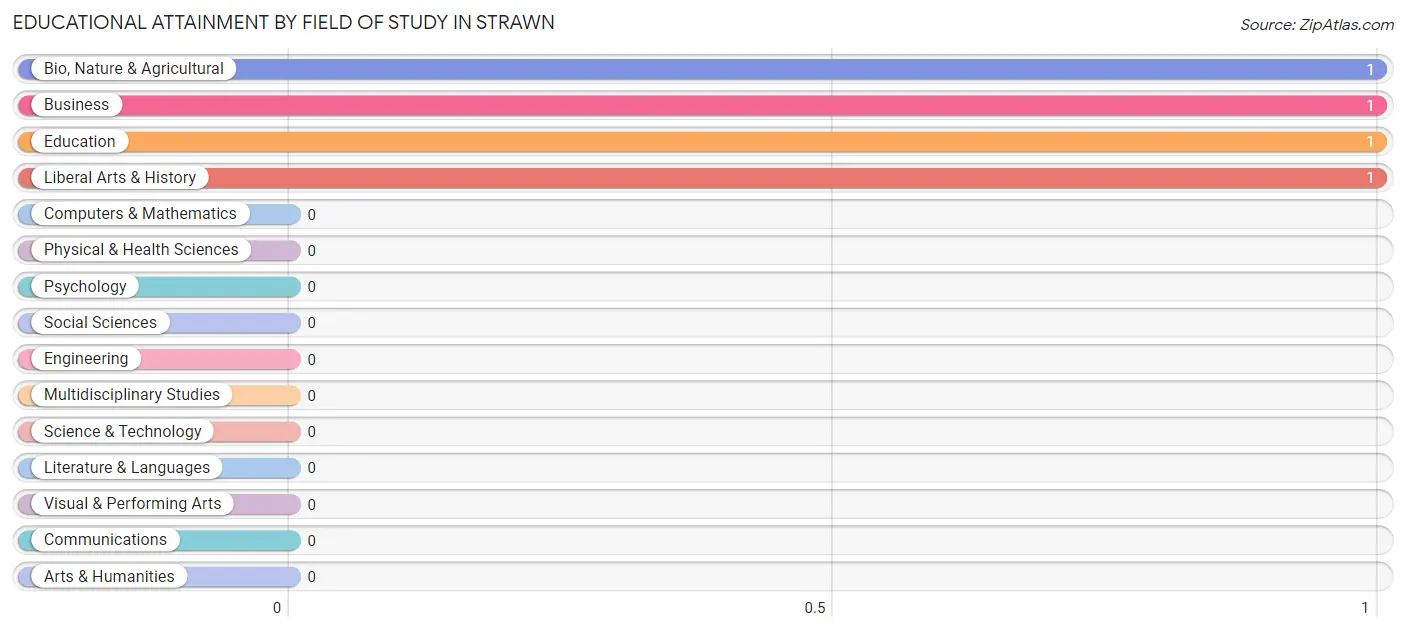
| Field of Study | # Graduates | % Graduates |
| Computers & Mathematics | 0 | 0.0% |
| Bio, Nature & Agricultural | 1 | 25.0% |
| Physical & Health Sciences | 0 | 0.0% |
| Psychology | 0 | 0.0% |
| Social Sciences | 0 | 0.0% |
| Engineering | 0 | 0.0% |
| Multidisciplinary Studies | 0 | 0.0% |
| Science & Technology | 0 | 0.0% |
| Business | 1 | 25.0% |
| Education | 1 | 25.0% |
| Literature & Languages | 0 | 0.0% |
| Liberal Arts & History | 1 | 25.0% |
| Visual & Performing Arts | 0 | 0.0% |
| Communications | 0 | 0.0% |
| Arts & Humanities | 0 | 0.0% |
| Total | 4 | 100.0% |
Transportation & Commute in Strawn
Vehicle Availability by Sex in Strawn
The most prevalent vehicle ownership categories in Strawn are males with 2 vehicles (20, accounting for 64.5%) and females with 2 vehicles (8, making up 181.8%).
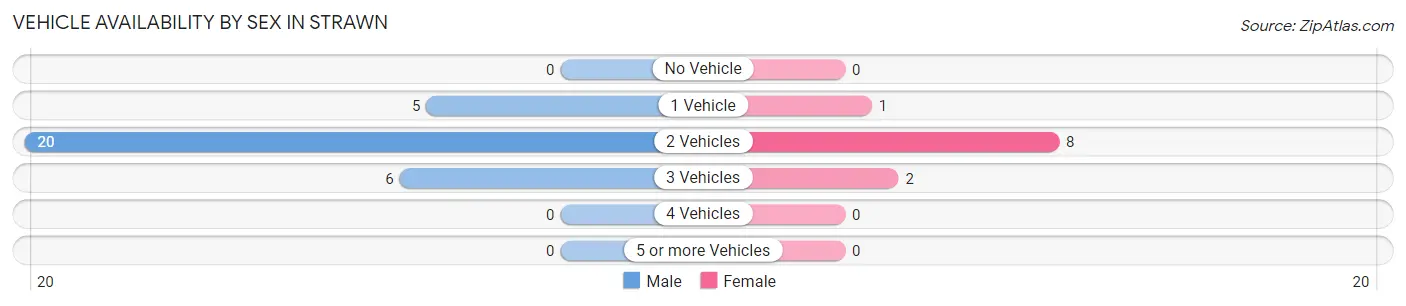
| Vehicles Available | Male | Female |
| No Vehicle | 0 (0.0%) | 0 (0.0%) |
| 1 Vehicle | 5 (16.1%) | 1 (9.1%) |
| 2 Vehicles | 20 (64.5%) | 8 (72.7%) |
| 3 Vehicles | 6 (19.4%) | 2 (18.2%) |
| 4 Vehicles | 0 (0.0%) | 0 (0.0%) |
| 5 or more Vehicles | 0 (0.0%) | 0 (0.0%) |
| Total | 31 (100.0%) | 11 (100.0%) |
Commute Time in Strawn
The most frequently occuring commute durations in Strawn are 10 to 14 minutes (13 commuters, 34.2%), 15 to 19 minutes (5 commuters, 13.2%), and 45 to 59 minutes (5 commuters, 13.2%).
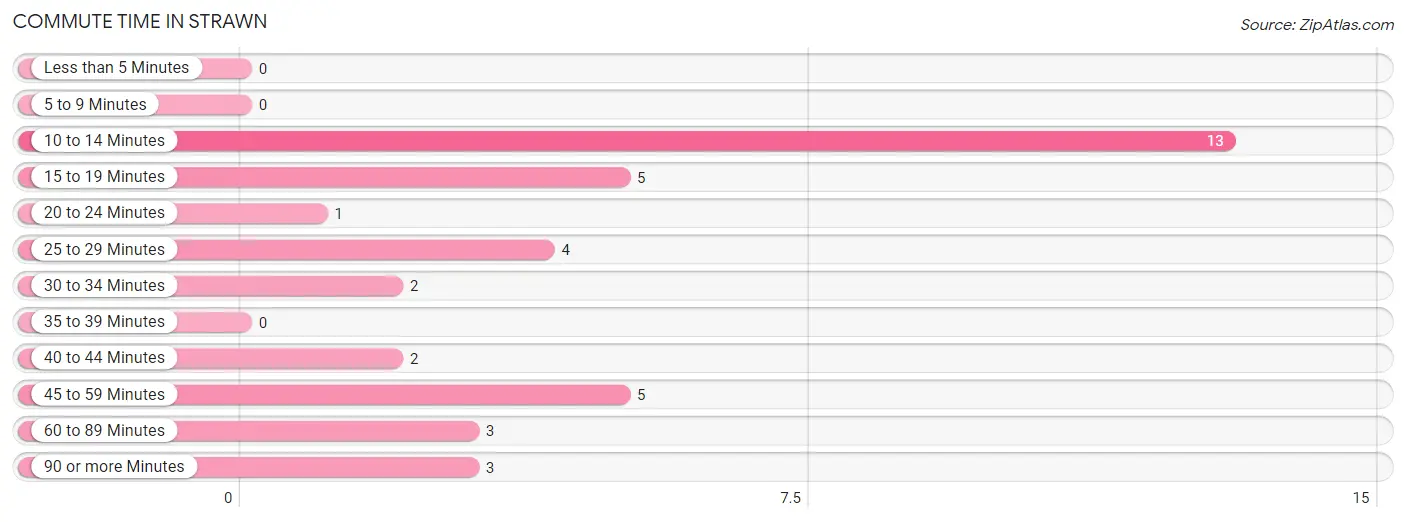
| Commute Time | # Commuters | % Commuters |
| Less than 5 Minutes | 0 | 0.0% |
| 5 to 9 Minutes | 0 | 0.0% |
| 10 to 14 Minutes | 13 | 34.2% |
| 15 to 19 Minutes | 5 | 13.2% |
| 20 to 24 Minutes | 1 | 2.6% |
| 25 to 29 Minutes | 4 | 10.5% |
| 30 to 34 Minutes | 2 | 5.3% |
| 35 to 39 Minutes | 0 | 0.0% |
| 40 to 44 Minutes | 2 | 5.3% |
| 45 to 59 Minutes | 5 | 13.2% |
| 60 to 89 Minutes | 3 | 7.9% |
| 90 or more Minutes | 3 | 7.9% |
Commute Time by Sex in Strawn
The most common commute times in Strawn are 10 to 14 minutes (11 commuters, 35.5%) for males and 10 to 14 minutes (2 commuters, 28.6%) for females.
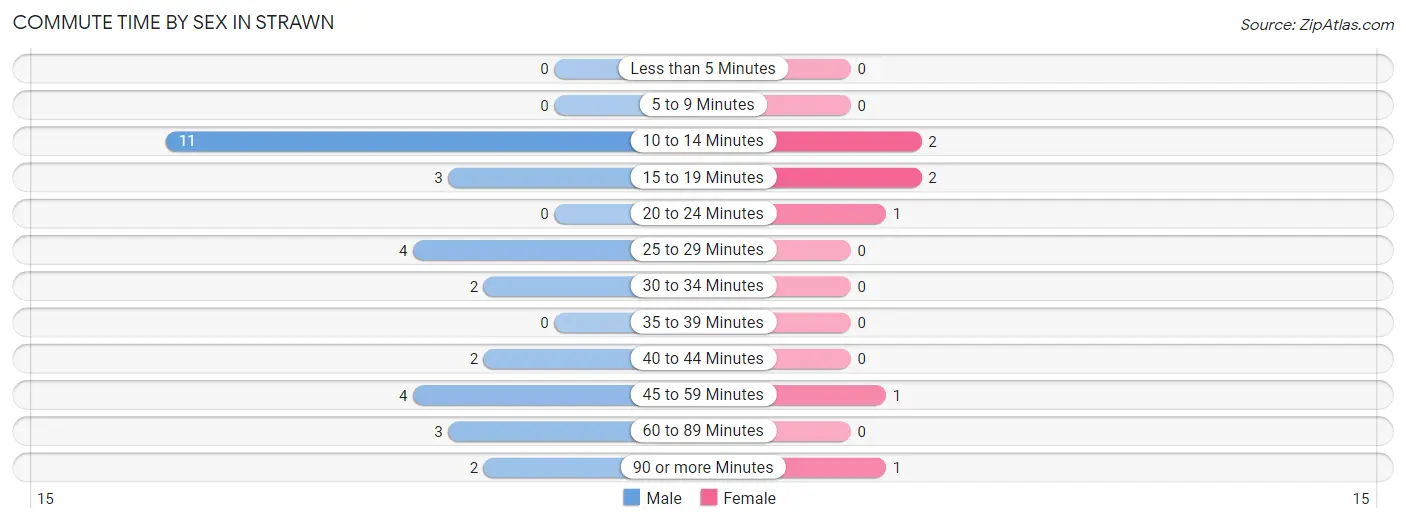
| Commute Time | Male | Female |
| Less than 5 Minutes | 0 (0.0%) | 0 (0.0%) |
| 5 to 9 Minutes | 0 (0.0%) | 0 (0.0%) |
| 10 to 14 Minutes | 11 (35.5%) | 2 (28.6%) |
| 15 to 19 Minutes | 3 (9.7%) | 2 (28.6%) |
| 20 to 24 Minutes | 0 (0.0%) | 1 (14.3%) |
| 25 to 29 Minutes | 4 (12.9%) | 0 (0.0%) |
| 30 to 34 Minutes | 2 (6.5%) | 0 (0.0%) |
| 35 to 39 Minutes | 0 (0.0%) | 0 (0.0%) |
| 40 to 44 Minutes | 2 (6.5%) | 0 (0.0%) |
| 45 to 59 Minutes | 4 (12.9%) | 1 (14.3%) |
| 60 to 89 Minutes | 3 (9.7%) | 0 (0.0%) |
| 90 or more Minutes | 2 (6.5%) | 1 (14.3%) |
Time of Departure to Work by Sex in Strawn
The most frequent times of departure to work in Strawn are 12:00 AM to 4:59 AM (8, 25.8%) for males and 12:00 PM to 3:59 PM (3, 42.9%) for females.
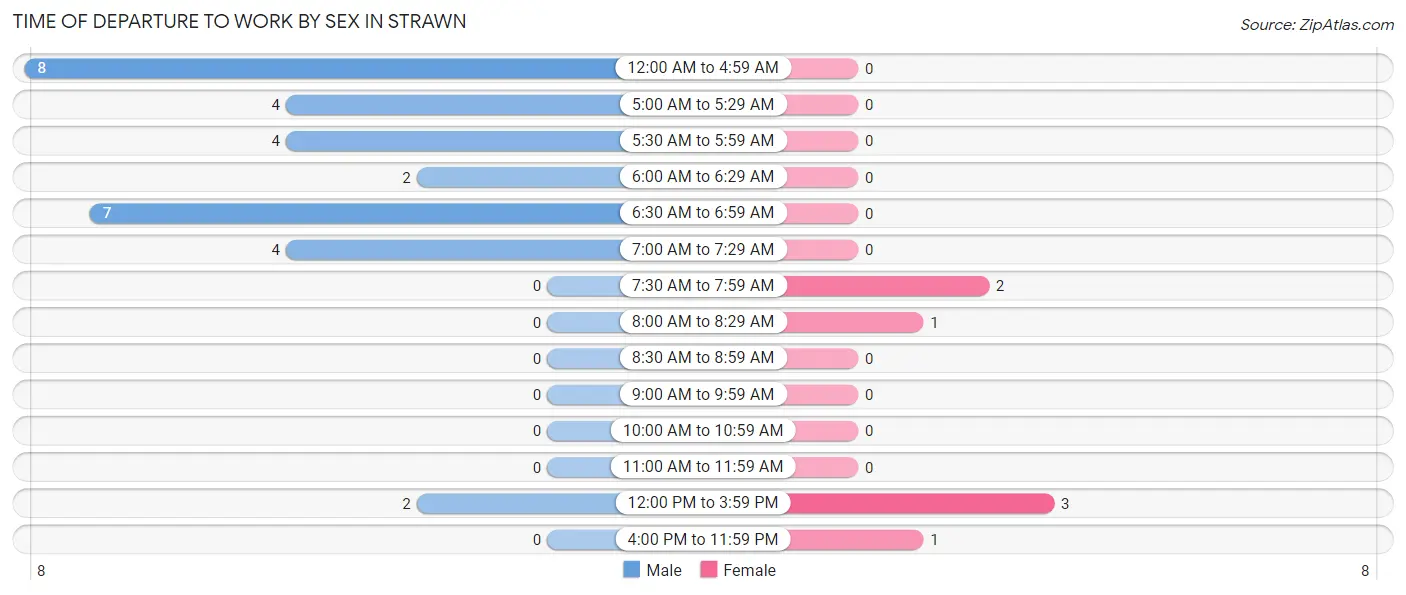
| Time of Departure | Male | Female |
| 12:00 AM to 4:59 AM | 8 (25.8%) | 0 (0.0%) |
| 5:00 AM to 5:29 AM | 4 (12.9%) | 0 (0.0%) |
| 5:30 AM to 5:59 AM | 4 (12.9%) | 0 (0.0%) |
| 6:00 AM to 6:29 AM | 2 (6.5%) | 0 (0.0%) |
| 6:30 AM to 6:59 AM | 7 (22.6%) | 0 (0.0%) |
| 7:00 AM to 7:29 AM | 4 (12.9%) | 0 (0.0%) |
| 7:30 AM to 7:59 AM | 0 (0.0%) | 2 (28.6%) |
| 8:00 AM to 8:29 AM | 0 (0.0%) | 1 (14.3%) |
| 8:30 AM to 8:59 AM | 0 (0.0%) | 0 (0.0%) |
| 9:00 AM to 9:59 AM | 0 (0.0%) | 0 (0.0%) |
| 10:00 AM to 10:59 AM | 0 (0.0%) | 0 (0.0%) |
| 11:00 AM to 11:59 AM | 0 (0.0%) | 0 (0.0%) |
| 12:00 PM to 3:59 PM | 2 (6.5%) | 3 (42.9%) |
| 4:00 PM to 11:59 PM | 0 (0.0%) | 1 (14.3%) |
| Total | 31 (100.0%) | 7 (100.0%) |
Housing Occupancy in Strawn
Occupancy by Ownership in Strawn
Of the total 31 dwellings in Strawn, owner-occupied units account for 25 (80.6%), while renter-occupied units make up 6 (19.4%).
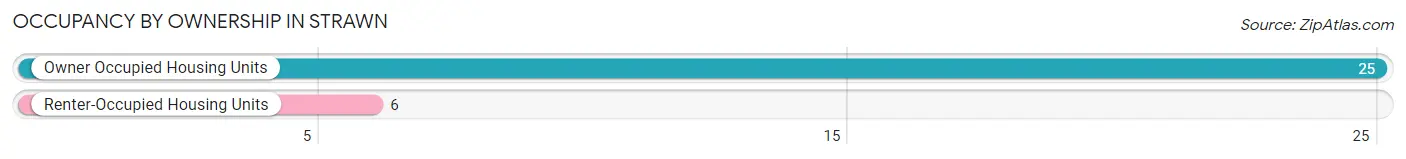
| Occupancy | # Housing Units | % Housing Units |
| Owner Occupied Housing Units | 25 | 80.6% |
| Renter-Occupied Housing Units | 6 | 19.4% |
| Total Occupied Housing Units | 31 | 100.0% |
Occupancy by Household Size in Strawn
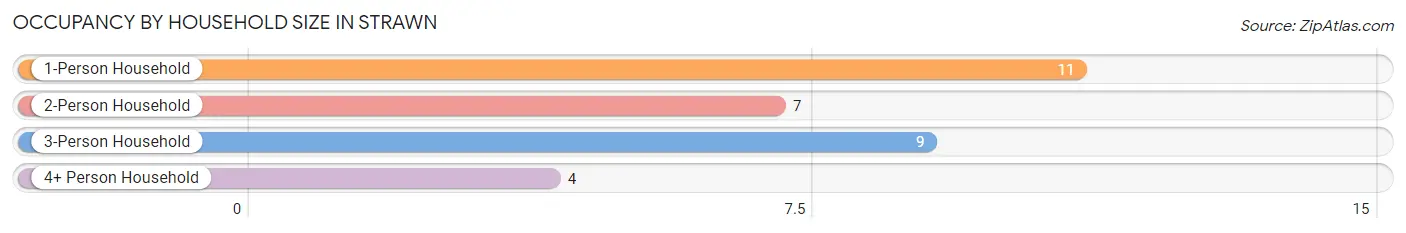
| Household Size | # Housing Units | % Housing Units |
| 1-Person Household | 11 | 35.5% |
| 2-Person Household | 7 | 22.6% |
| 3-Person Household | 9 | 29.0% |
| 4+ Person Household | 4 | 12.9% |
| Total Housing Units | 31 | 100.0% |
Occupancy by Ownership by Household Size in Strawn
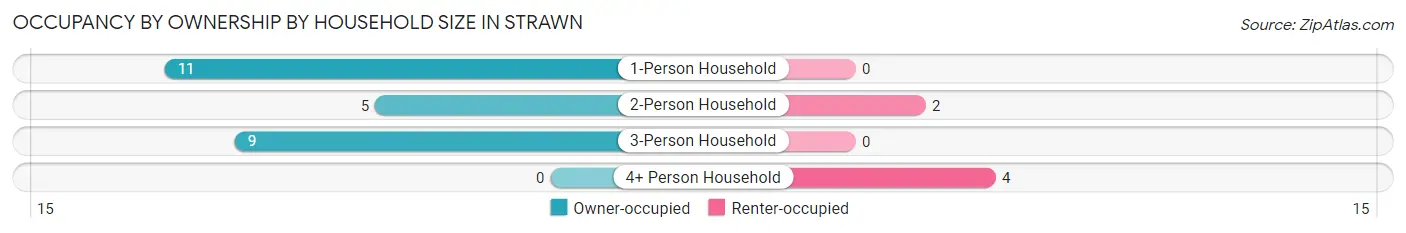
| Household Size | Owner-occupied | Renter-occupied |
| 1-Person Household | 11 (100.0%) | 0 (0.0%) |
| 2-Person Household | 5 (71.4%) | 2 (28.6%) |
| 3-Person Household | 9 (100.0%) | 0 (0.0%) |
| 4+ Person Household | 0 (0.0%) | 4 (100.0%) |
| Total Housing Units | 25 (80.6%) | 6 (19.4%) |
Occupancy by Educational Attainment in Strawn
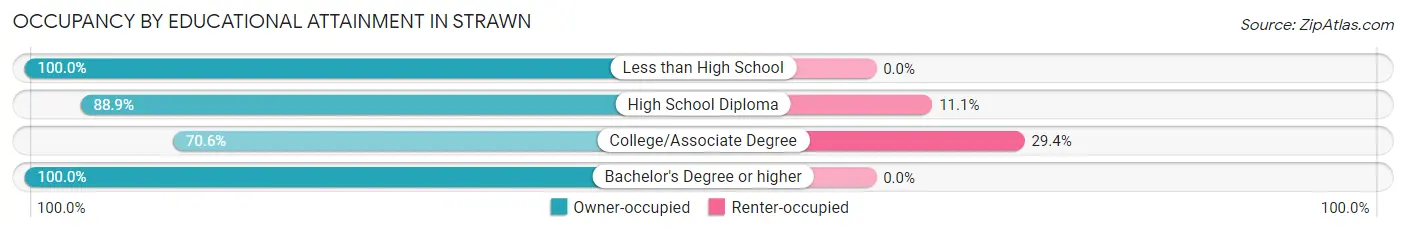
| Household Size | Owner-occupied | Renter-occupied |
| Less than High School | 2 (100.0%) | 0 (0.0%) |
| High School Diploma | 8 (88.9%) | 1 (11.1%) |
| College/Associate Degree | 12 (70.6%) | 5 (29.4%) |
| Bachelor's Degree or higher | 3 (100.0%) | 0 (0.0%) |
Occupancy by Age of Householder in Strawn
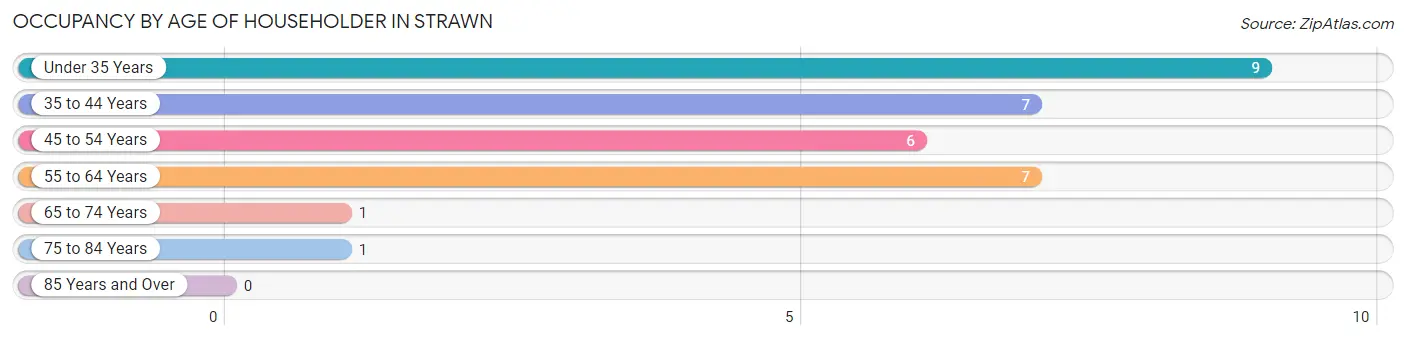
| Age Bracket | # Households | % Households |
| Under 35 Years | 9 | 29.0% |
| 35 to 44 Years | 7 | 22.6% |
| 45 to 54 Years | 6 | 19.4% |
| 55 to 64 Years | 7 | 22.6% |
| 65 to 74 Years | 1 | 3.2% |
| 75 to 84 Years | 1 | 3.2% |
| 85 Years and Over | 0 | 0.0% |
| Total | 31 | 100.0% |
Housing Finances in Strawn
Median Income by Occupancy in Strawn
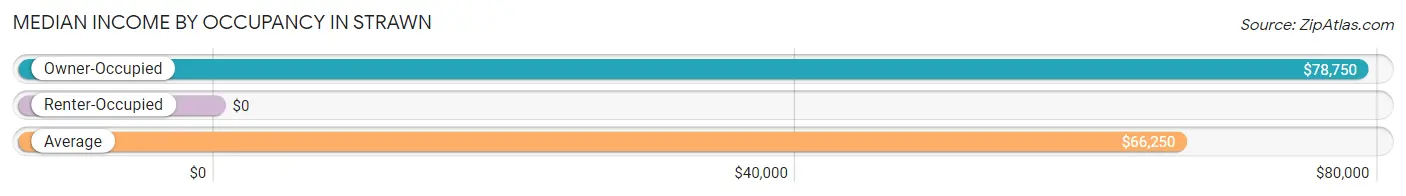
| Occupancy Type | # Households | Median Income |
| Owner-Occupied | 25 (80.6%) | $78,750 |
| Renter-Occupied | 6 (19.4%) | $0 |
| Average | 31 (100.0%) | $66,250 |
Occupancy by Householder Income Bracket in Strawn
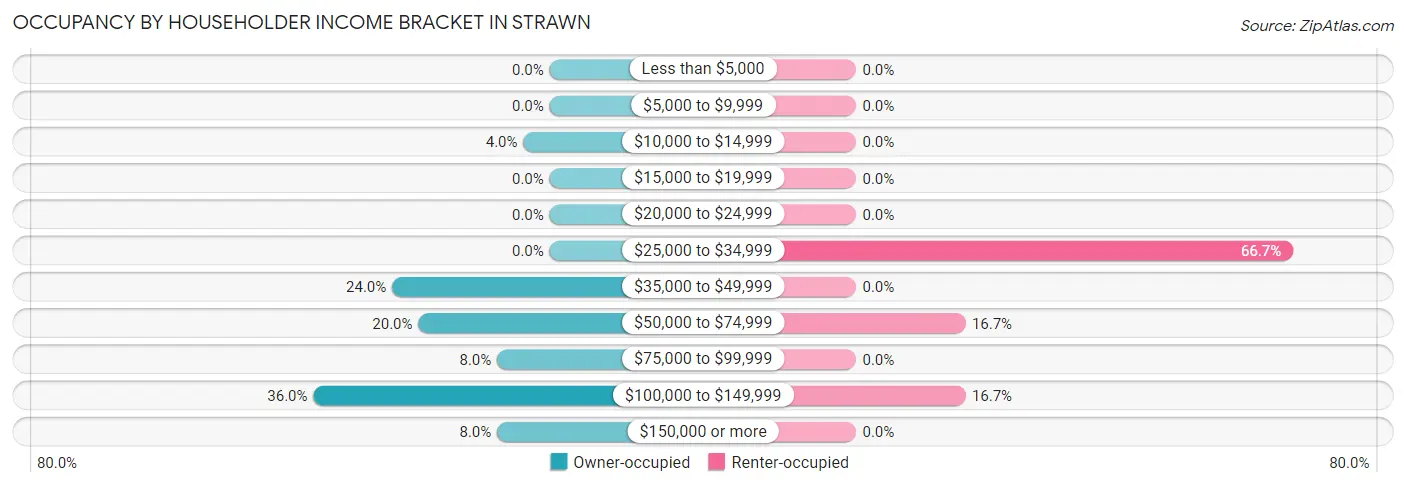
| Income Bracket | Owner-occupied | Renter-occupied |
| Less than $5,000 | 0 (0.0%) | 0 (0.0%) |
| $5,000 to $9,999 | 0 (0.0%) | 0 (0.0%) |
| $10,000 to $14,999 | 1 (4.0%) | 0 (0.0%) |
| $15,000 to $19,999 | 0 (0.0%) | 0 (0.0%) |
| $20,000 to $24,999 | 0 (0.0%) | 0 (0.0%) |
| $25,000 to $34,999 | 0 (0.0%) | 4 (66.7%) |
| $35,000 to $49,999 | 6 (24.0%) | 0 (0.0%) |
| $50,000 to $74,999 | 5 (20.0%) | 1 (16.7%) |
| $75,000 to $99,999 | 2 (8.0%) | 0 (0.0%) |
| $100,000 to $149,999 | 9 (36.0%) | 1 (16.7%) |
| $150,000 or more | 2 (8.0%) | 0 (0.0%) |
| Total | 25 (100.0%) | 6 (100.0%) |
Monthly Housing Cost Tiers in Strawn
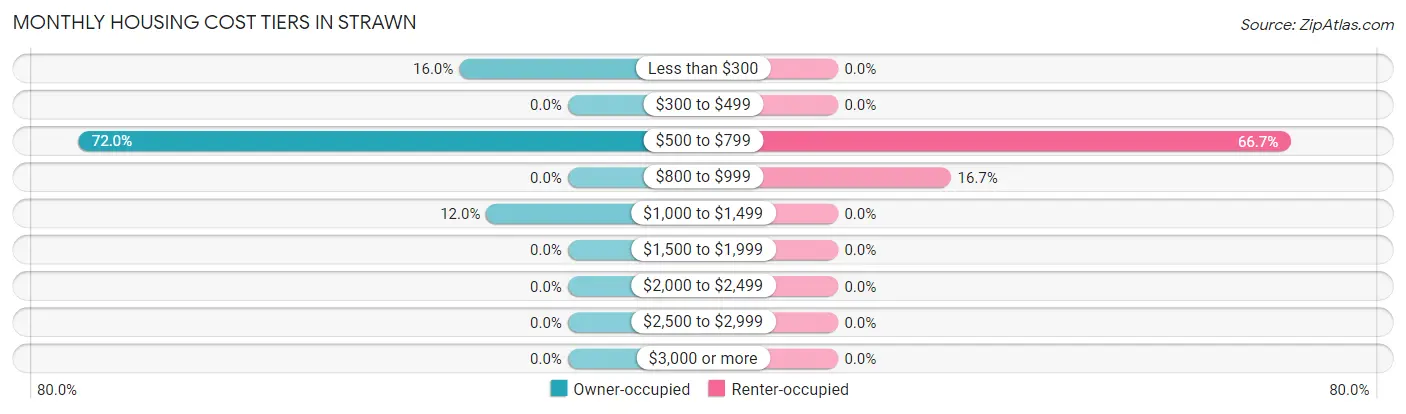
| Monthly Cost | Owner-occupied | Renter-occupied |
| Less than $300 | 4 (16.0%) | 0 (0.0%) |
| $300 to $499 | 0 (0.0%) | 0 (0.0%) |
| $500 to $799 | 18 (72.0%) | 4 (66.7%) |
| $800 to $999 | 0 (0.0%) | 1 (16.7%) |
| $1,000 to $1,499 | 3 (12.0%) | 0 (0.0%) |
| $1,500 to $1,999 | 0 (0.0%) | 0 (0.0%) |
| $2,000 to $2,499 | 0 (0.0%) | 0 (0.0%) |
| $2,500 to $2,999 | 0 (0.0%) | 0 (0.0%) |
| $3,000 or more | 0 (0.0%) | 0 (0.0%) |
| Total | 25 (100.0%) | 6 (100.0%) |
Physical Housing Characteristics in Strawn
Housing Structures in Strawn
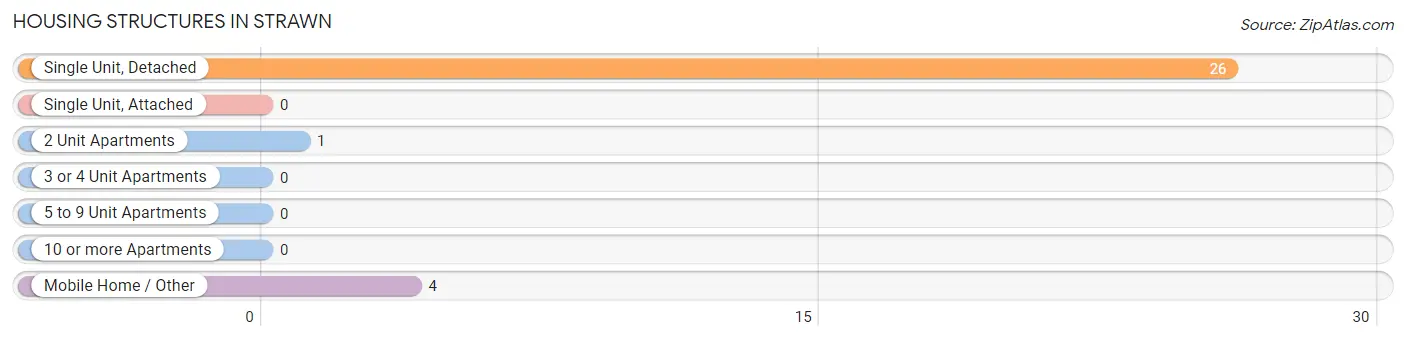
| Structure Type | # Housing Units | % Housing Units |
| Single Unit, Detached | 26 | 83.9% |
| Single Unit, Attached | 0 | 0.0% |
| 2 Unit Apartments | 1 | 3.2% |
| 3 or 4 Unit Apartments | 0 | 0.0% |
| 5 to 9 Unit Apartments | 0 | 0.0% |
| 10 or more Apartments | 0 | 0.0% |
| Mobile Home / Other | 4 | 12.9% |
| Total | 31 | 100.0% |
Housing Structures by Occupancy in Strawn
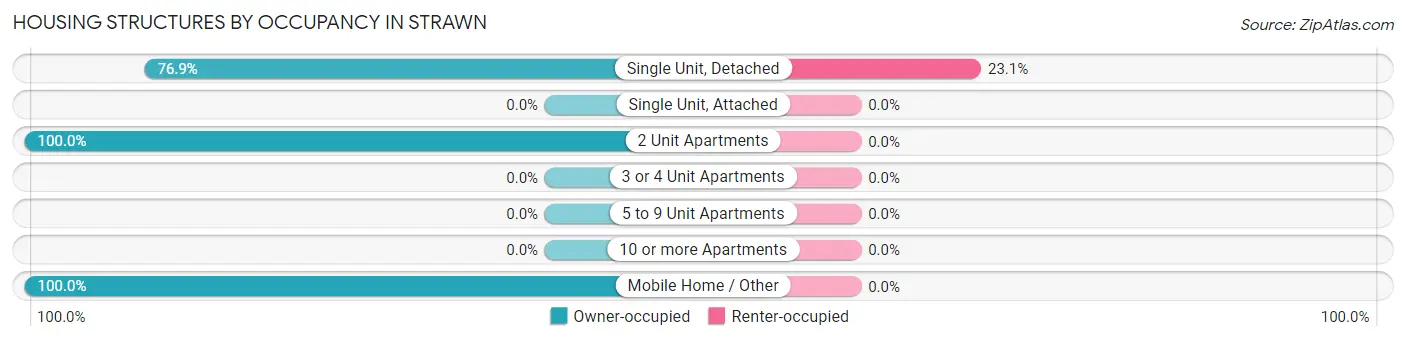
| Structure Type | Owner-occupied | Renter-occupied |
| Single Unit, Detached | 20 (76.9%) | 6 (23.1%) |
| Single Unit, Attached | 0 (0.0%) | 0 (0.0%) |
| 2 Unit Apartments | 1 (100.0%) | 0 (0.0%) |
| 3 or 4 Unit Apartments | 0 (0.0%) | 0 (0.0%) |
| 5 to 9 Unit Apartments | 0 (0.0%) | 0 (0.0%) |
| 10 or more Apartments | 0 (0.0%) | 0 (0.0%) |
| Mobile Home / Other | 4 (100.0%) | 0 (0.0%) |
| Total | 25 (80.6%) | 6 (19.4%) |
Housing Structures by Number of Rooms in Strawn
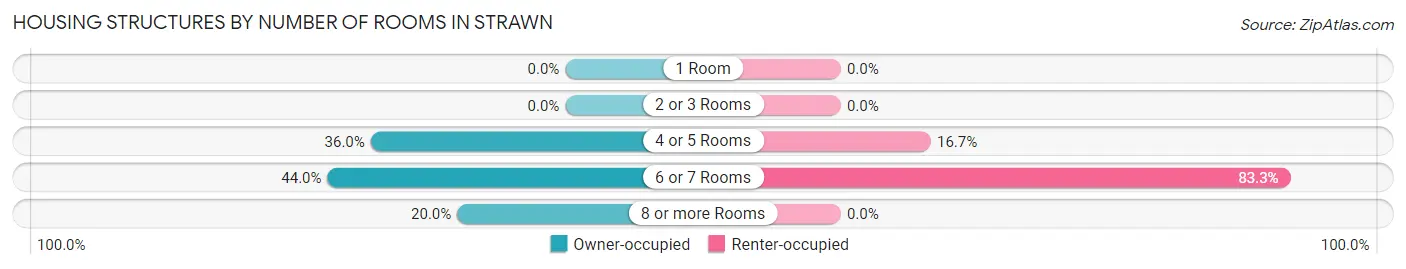
| Number of Rooms | Owner-occupied | Renter-occupied |
| 1 Room | 0 (0.0%) | 0 (0.0%) |
| 2 or 3 Rooms | 0 (0.0%) | 0 (0.0%) |
| 4 or 5 Rooms | 9 (36.0%) | 1 (16.7%) |
| 6 or 7 Rooms | 11 (44.0%) | 5 (83.3%) |
| 8 or more Rooms | 5 (20.0%) | 0 (0.0%) |
| Total | 25 (100.0%) | 6 (100.0%) |
Housing Structure by Heating Type in Strawn
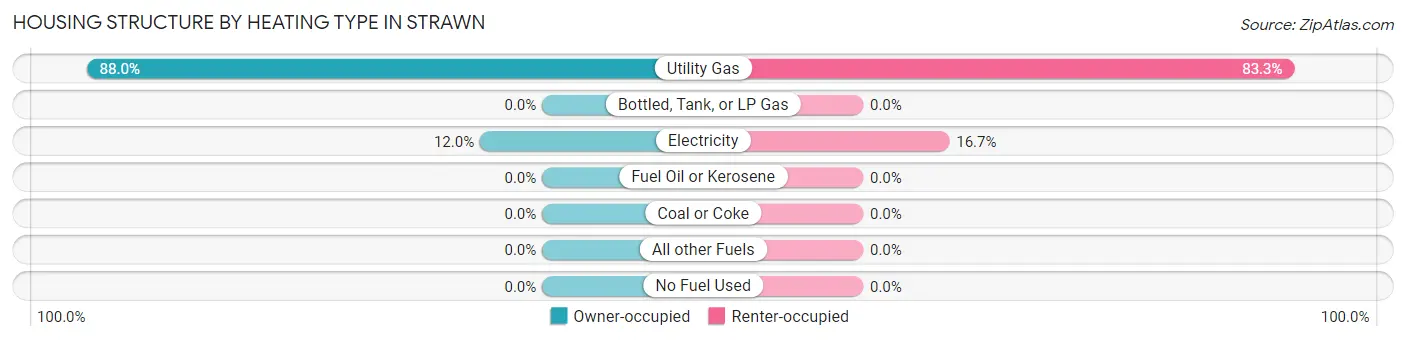
| Heating Type | Owner-occupied | Renter-occupied |
| Utility Gas | 22 (88.0%) | 5 (83.3%) |
| Bottled, Tank, or LP Gas | 0 (0.0%) | 0 (0.0%) |
| Electricity | 3 (12.0%) | 1 (16.7%) |
| Fuel Oil or Kerosene | 0 (0.0%) | 0 (0.0%) |
| Coal or Coke | 0 (0.0%) | 0 (0.0%) |
| All other Fuels | 0 (0.0%) | 0 (0.0%) |
| No Fuel Used | 0 (0.0%) | 0 (0.0%) |
| Total | 25 (100.0%) | 6 (100.0%) |
Household Vehicle Usage in Strawn
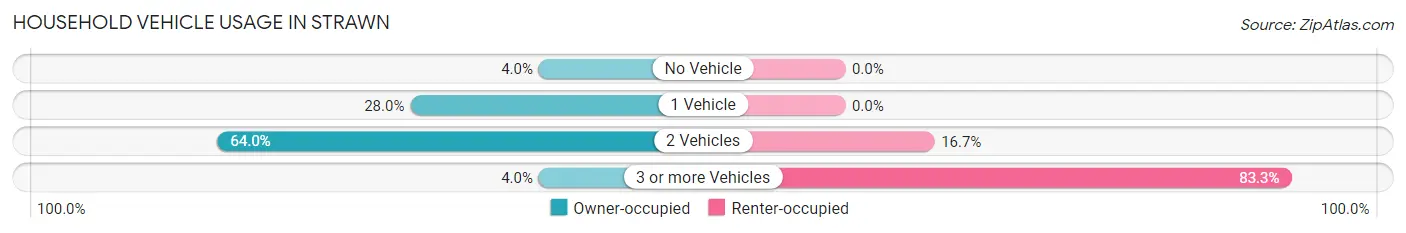
| Vehicles per Household | Owner-occupied | Renter-occupied |
| No Vehicle | 1 (4.0%) | 0 (0.0%) |
| 1 Vehicle | 7 (28.0%) | 0 (0.0%) |
| 2 Vehicles | 16 (64.0%) | 1 (16.7%) |
| 3 or more Vehicles | 1 (4.0%) | 5 (83.3%) |
| Total | 25 (100.0%) | 6 (100.0%) |
Real Estate & Mortgages in Strawn
Real Estate and Mortgage Overview in Strawn
| Characteristic | Without Mortgage | With Mortgage |
| Housing Units | 7 | 18 |
| Median Property Value | $38,800 | $68,000 |
| Median Household Income | $53,125 | $0 |
| Monthly Housing Costs | $717 | $0 |
| Real Estate Taxes | - | - |
Property Value by Mortgage Status in Strawn
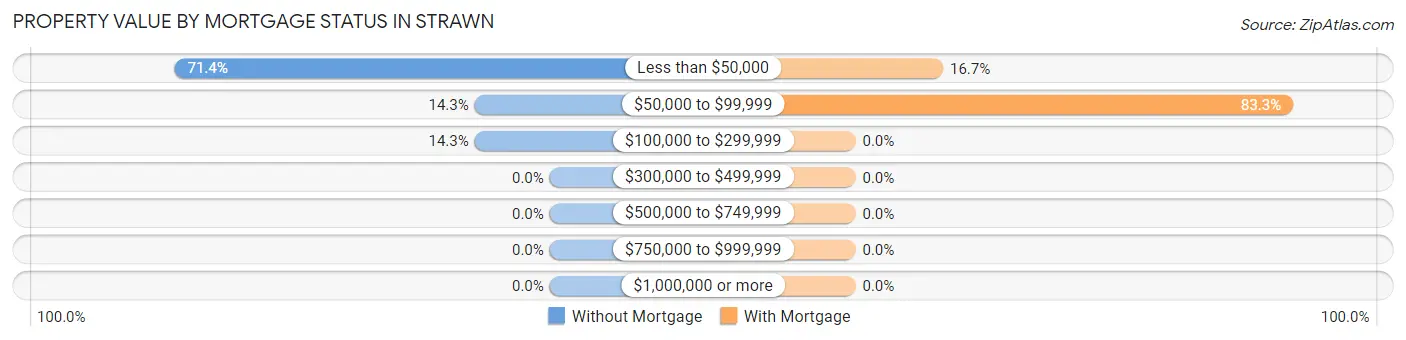
| Property Value | Without Mortgage | With Mortgage |
| Less than $50,000 | 5 (71.4%) | 3 (16.7%) |
| $50,000 to $99,999 | 1 (14.3%) | 15 (83.3%) |
| $100,000 to $299,999 | 1 (14.3%) | 0 (0.0%) |
| $300,000 to $499,999 | 0 (0.0%) | 0 (0.0%) |
| $500,000 to $749,999 | 0 (0.0%) | 0 (0.0%) |
| $750,000 to $999,999 | 0 (0.0%) | 0 (0.0%) |
| $1,000,000 or more | 0 (0.0%) | 0 (0.0%) |
| Total | 7 (100.0%) | 18 (100.0%) |
Household Income by Mortgage Status in Strawn
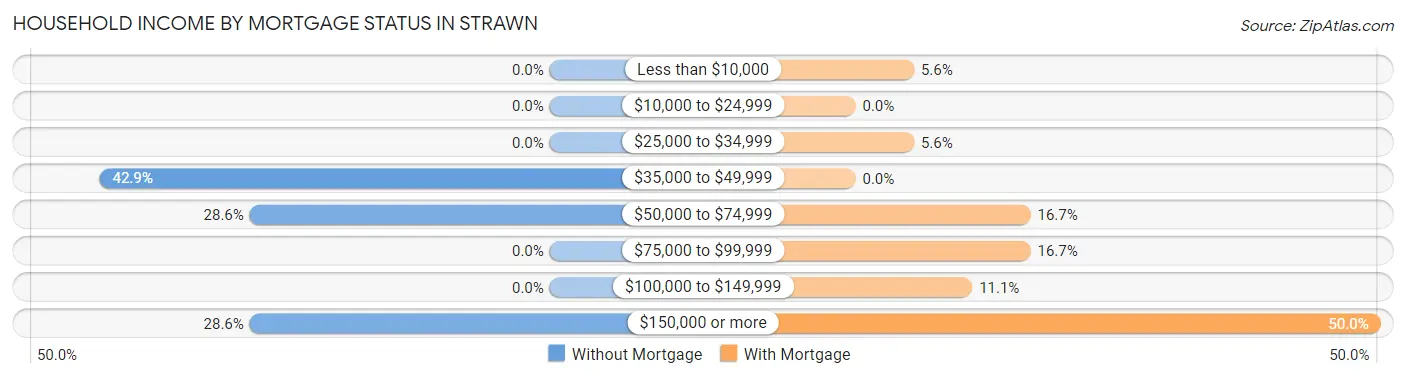
| Household Income | Without Mortgage | With Mortgage |
| Less than $10,000 | 0 (0.0%) | 1 (5.6%) |
| $10,000 to $24,999 | 0 (0.0%) | 0 (0.0%) |
| $25,000 to $34,999 | 0 (0.0%) | 1 (5.6%) |
| $35,000 to $49,999 | 3 (42.9%) | 0 (0.0%) |
| $50,000 to $74,999 | 2 (28.6%) | 3 (16.7%) |
| $75,000 to $99,999 | 0 (0.0%) | 3 (16.7%) |
| $100,000 to $149,999 | 0 (0.0%) | 2 (11.1%) |
| $150,000 or more | 2 (28.6%) | 9 (50.0%) |
| Total | 7 (100.0%) | 18 (100.0%) |
Property Value to Household Income Ratio in Strawn
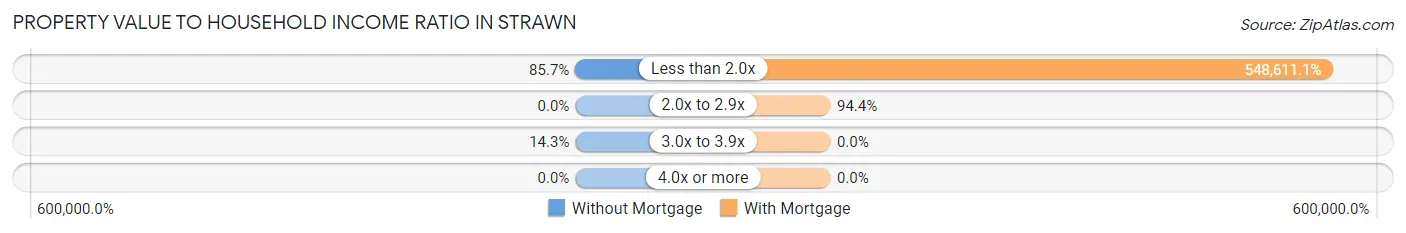
| Value-to-Income Ratio | Without Mortgage | With Mortgage |
| Less than 2.0x | 6 (85.7%) | 98,750 (548,611.1%) |
| 2.0x to 2.9x | 0 (0.0%) | 17 (94.4%) |
| 3.0x to 3.9x | 1 (14.3%) | 0 (0.0%) |
| 4.0x or more | 0 (0.0%) | 0 (0.0%) |
| Total | 7 (100.0%) | 18 (100.0%) |
Real Estate Taxes by Mortgage Status in Strawn
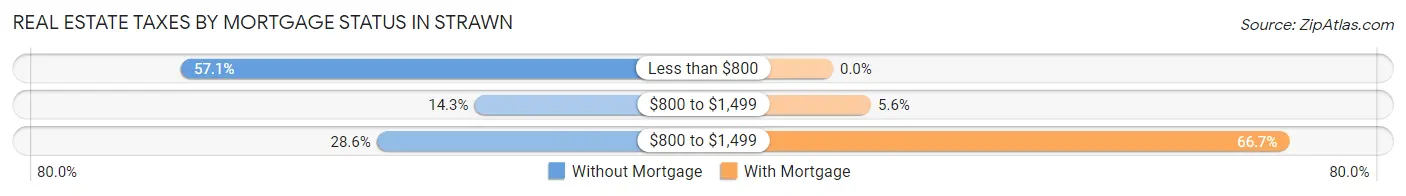
| Property Taxes | Without Mortgage | With Mortgage |
| Less than $800 | 4 (57.1%) | 0 (0.0%) |
| $800 to $1,499 | 1 (14.3%) | 1 (5.6%) |
| $800 to $1,499 | 2 (28.6%) | 12 (66.7%) |
| Total | 7 (100.0%) | 18 (100.0%) |
Health & Disability in Strawn
Health Insurance Coverage by Age in Strawn
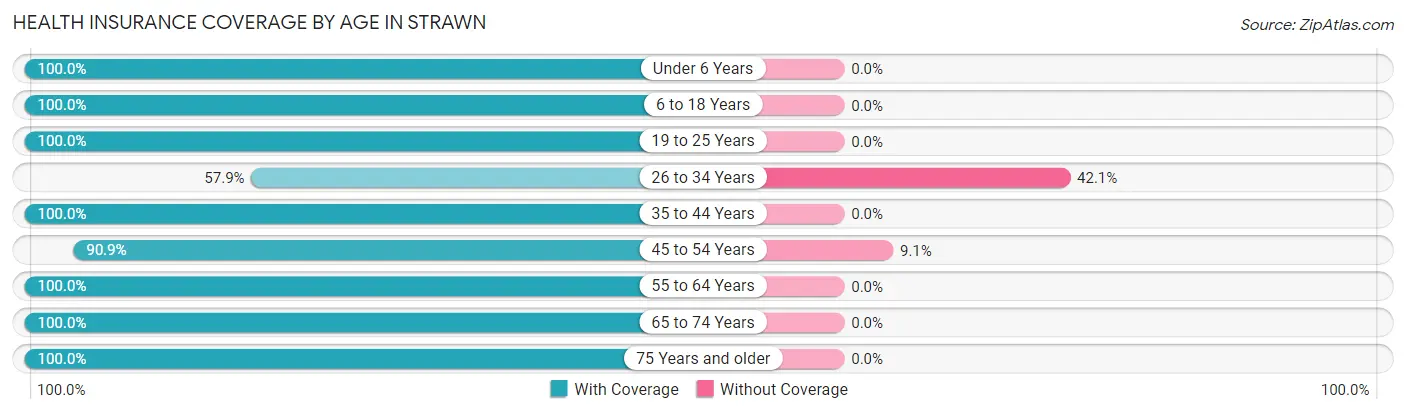
| Age Bracket | With Coverage | Without Coverage |
| Under 6 Years | 6 (100.0%) | 0 (0.0%) |
| 6 to 18 Years | 18 (100.0%) | 0 (0.0%) |
| 19 to 25 Years | 1 (100.0%) | 0 (0.0%) |
| 26 to 34 Years | 11 (57.9%) | 8 (42.1%) |
| 35 to 44 Years | 7 (100.0%) | 0 (0.0%) |
| 45 to 54 Years | 10 (90.9%) | 1 (9.1%) |
| 55 to 64 Years | 12 (100.0%) | 0 (0.0%) |
| 65 to 74 Years | 2 (100.0%) | 0 (0.0%) |
| 75 Years and older | 1 (100.0%) | 0 (0.0%) |
| Total | 68 (88.3%) | 9 (11.7%) |
Health Insurance Coverage by Citizenship Status in Strawn
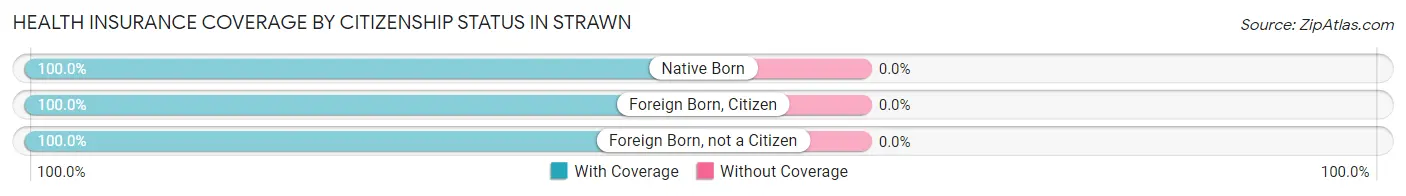
| Citizenship Status | With Coverage | Without Coverage |
| Native Born | 6 (100.0%) | 0 (0.0%) |
| Foreign Born, Citizen | 18 (100.0%) | 0 (0.0%) |
| Foreign Born, not a Citizen | 1 (100.0%) | 0 (0.0%) |
Health Insurance Coverage by Household Income in Strawn
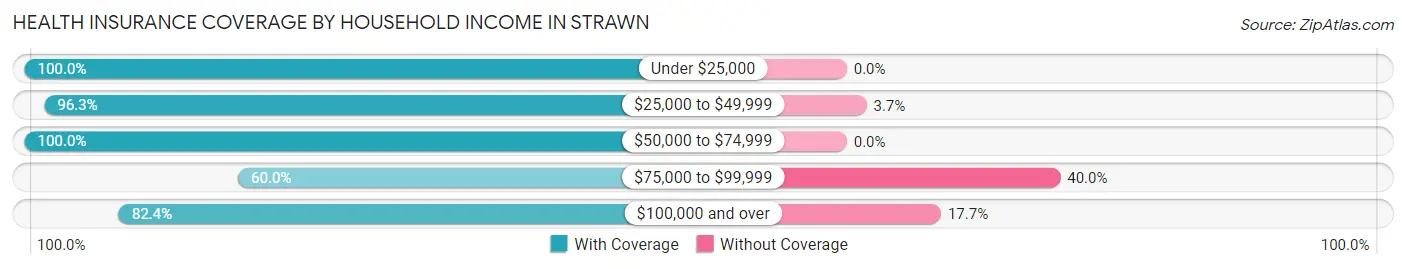
| Household Income | With Coverage | Without Coverage |
| Under $25,000 | 1 (100.0%) | 0 (0.0%) |
| $25,000 to $49,999 | 26 (96.3%) | 1 (3.7%) |
| $50,000 to $74,999 | 10 (100.0%) | 0 (0.0%) |
| $75,000 to $99,999 | 3 (60.0%) | 2 (40.0%) |
| $100,000 and over | 28 (82.4%) | 6 (17.6%) |
Public vs Private Health Insurance Coverage by Age in Strawn
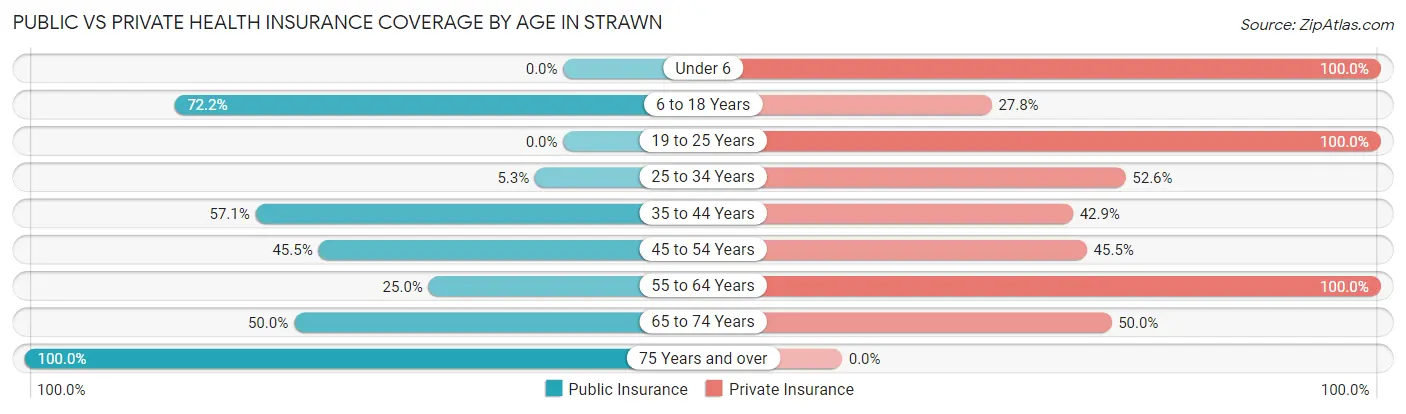
| Age Bracket | Public Insurance | Private Insurance |
| Under 6 | 0 (0.0%) | 6 (100.0%) |
| 6 to 18 Years | 13 (72.2%) | 5 (27.8%) |
| 19 to 25 Years | 0 (0.0%) | 1 (100.0%) |
| 25 to 34 Years | 1 (5.3%) | 10 (52.6%) |
| 35 to 44 Years | 4 (57.1%) | 3 (42.9%) |
| 45 to 54 Years | 5 (45.5%) | 5 (45.5%) |
| 55 to 64 Years | 3 (25.0%) | 12 (100.0%) |
| 65 to 74 Years | 1 (50.0%) | 1 (50.0%) |
| 75 Years and over | 1 (100.0%) | 0 (0.0%) |
| Total | 28 (36.4%) | 43 (55.8%) |
Disability Status by Sex by Age in Strawn
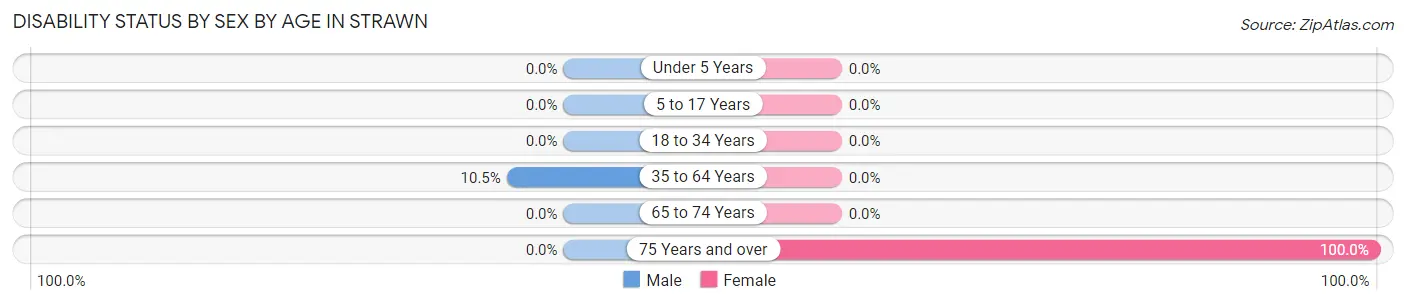
| Age Bracket | Male | Female |
| Under 5 Years | 0 (0.0%) | 0 (0.0%) |
| 5 to 17 Years | 0 (0.0%) | 0 (0.0%) |
| 18 to 34 Years | 0 (0.0%) | 0 (0.0%) |
| 35 to 64 Years | 2 (10.5%) | 0 (0.0%) |
| 65 to 74 Years | 0 (0.0%) | 0 (0.0%) |
| 75 Years and over | 0 (0.0%) | 1 (100.0%) |
Disability Class by Sex by Age in Strawn
Disability Class: Hearing Difficulty
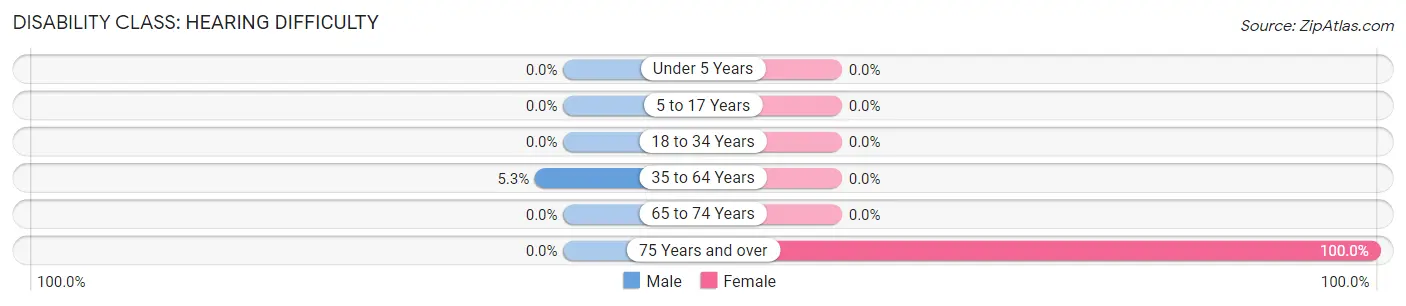
| Age Bracket | Male | Female |
| Under 5 Years | 0 (0.0%) | 0 (0.0%) |
| 5 to 17 Years | 0 (0.0%) | 0 (0.0%) |
| 18 to 34 Years | 0 (0.0%) | 0 (0.0%) |
| 35 to 64 Years | 1 (5.3%) | 0 (0.0%) |
| 65 to 74 Years | 0 (0.0%) | 0 (0.0%) |
| 75 Years and over | 0 (0.0%) | 1 (100.0%) |
Disability Class: Vision Difficulty
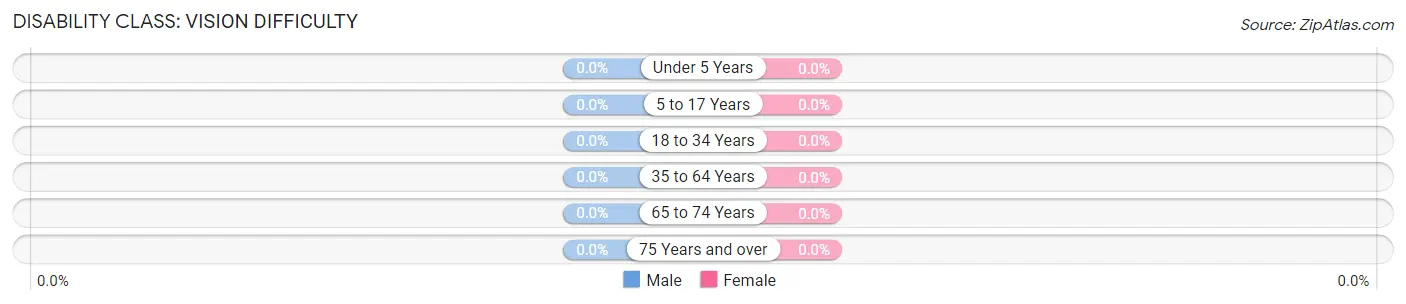
| Age Bracket | Male | Female |
| Under 5 Years | 0 (0.0%) | 0 (0.0%) |
| 5 to 17 Years | 0 (0.0%) | 0 (0.0%) |
| 18 to 34 Years | 0 (0.0%) | 0 (0.0%) |
| 35 to 64 Years | 0 (0.0%) | 0 (0.0%) |
| 65 to 74 Years | 0 (0.0%) | 0 (0.0%) |
| 75 Years and over | 0 (0.0%) | 0 (0.0%) |
Disability Class: Cognitive Difficulty
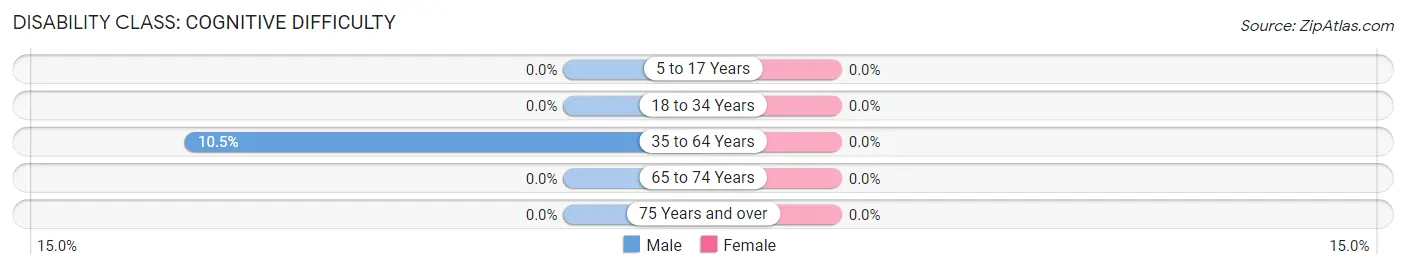
| Age Bracket | Male | Female |
| 5 to 17 Years | 0 (0.0%) | 0 (0.0%) |
| 18 to 34 Years | 0 (0.0%) | 0 (0.0%) |
| 35 to 64 Years | 2 (10.5%) | 0 (0.0%) |
| 65 to 74 Years | 0 (0.0%) | 0 (0.0%) |
| 75 Years and over | 0 (0.0%) | 0 (0.0%) |
Disability Class: Ambulatory Difficulty
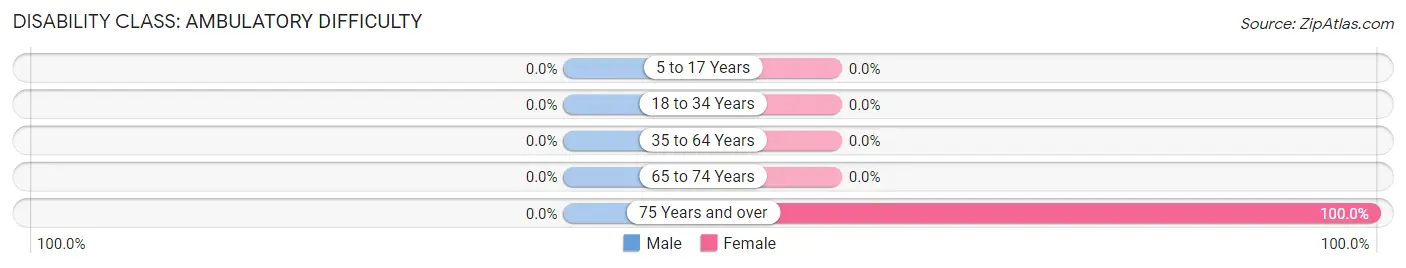
| Age Bracket | Male | Female |
| 5 to 17 Years | 0 (0.0%) | 0 (0.0%) |
| 18 to 34 Years | 0 (0.0%) | 0 (0.0%) |
| 35 to 64 Years | 0 (0.0%) | 0 (0.0%) |
| 65 to 74 Years | 0 (0.0%) | 0 (0.0%) |
| 75 Years and over | 0 (0.0%) | 1 (100.0%) |
Disability Class: Self-Care Difficulty
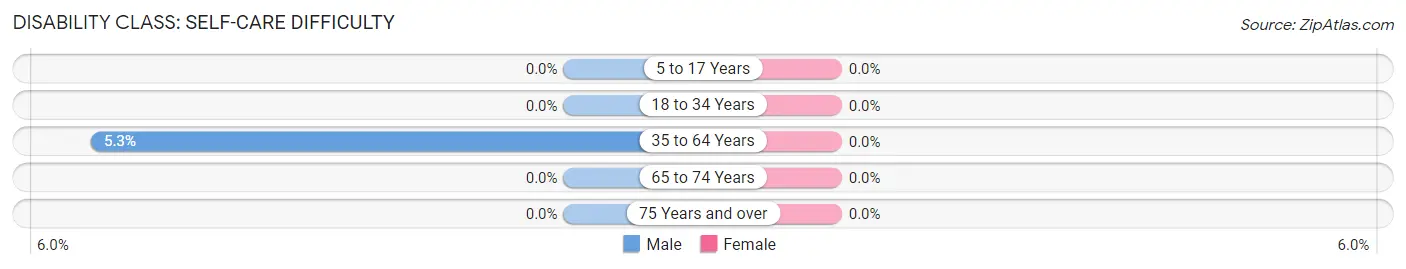
| Age Bracket | Male | Female |
| 5 to 17 Years | 0 (0.0%) | 0 (0.0%) |
| 18 to 34 Years | 0 (0.0%) | 0 (0.0%) |
| 35 to 64 Years | 1 (5.3%) | 0 (0.0%) |
| 65 to 74 Years | 0 (0.0%) | 0 (0.0%) |
| 75 Years and over | 0 (0.0%) | 0 (0.0%) |
Technology Access in Strawn
Computing Device Access in Strawn
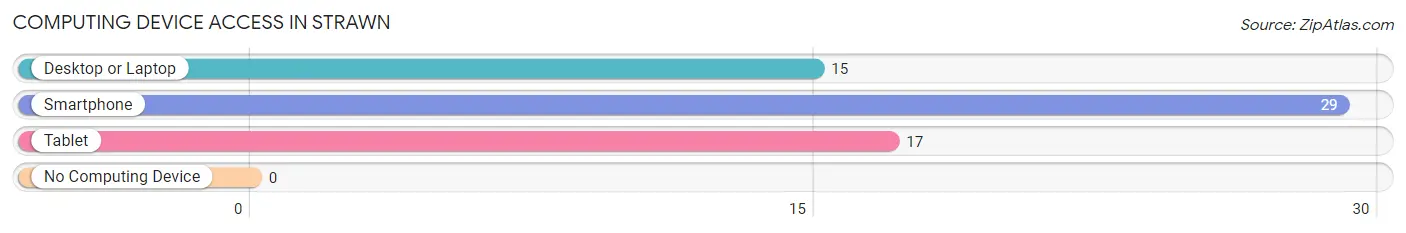
| Device Type | # Households | % Households |
| Desktop or Laptop | 15 | 48.4% |
| Smartphone | 29 | 93.5% |
| Tablet | 17 | 54.8% |
| No Computing Device | 0 | 0.0% |
| Total | 31 | 100.0% |
Internet Access in Strawn
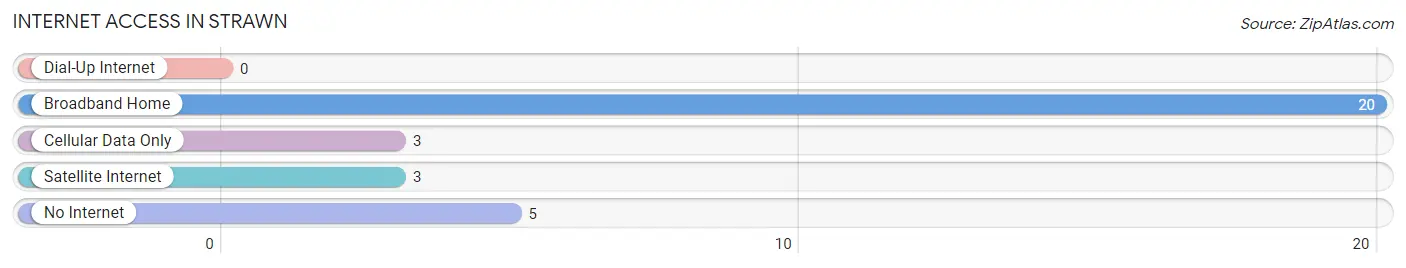
| Internet Type | # Households | % Households |
| Dial-Up Internet | 0 | 0.0% |
| Broadband Home | 20 | 64.5% |
| Cellular Data Only | 3 | 9.7% |
| Satellite Internet | 3 | 9.7% |
| No Internet | 5 | 16.1% |
| Total | 31 | 100.0% |
Strawn Summary
Strawn is a small village located in Livingston County, Illinois. It is situated in the north-central part of the state, about 50 miles south of Chicago. The village has a population of approximately 500 people and covers an area of 0.6 square miles.
History
Strawn was founded in 1854 by a group of settlers from Ohio. The village was named after the Strawn family, who were among the first settlers. The Strawns were farmers and the village was initially a farming community. In the late 19th century, the village began to grow and develop. The first post office was established in 1871 and the first school was built in 1876.
In the early 20th century, Strawn began to experience a period of growth and development. The village was incorporated in 1912 and the first mayor was elected in 1913. The village also saw the construction of a new school, a bank, and a library.
Geography
Strawn is located in the north-central part of Illinois, about 50 miles south of Chicago. The village is situated in Livingston County, which is part of the Central Illinois region. The village is located on the banks of the Vermilion River, which flows through the area. The village is surrounded by farmland and is located near the cities of Pontiac and Dwight.
The climate in Strawn is typical of the Midwest, with hot summers and cold winters. The average temperature in the summer is around 75 degrees Fahrenheit, while the average temperature in the winter is around 25 degrees Fahrenheit.
Economy
The economy of Strawn is largely based on agriculture. The village is surrounded by farmland and many of the residents are involved in farming. The village also has a few small businesses, including a grocery store, a hardware store, and a few restaurants.
Demographics
As of the 2010 census, the population of Strawn was 498. The racial makeup of the village was 97.2% White, 0.2% African American, 0.2% Native American, 0.4% Asian, 0.2% from other races, and 1.9% from two or more races. The median household income was $45,000 and the median family income was $50,000. The per capita income was $20,000.
Strawn is a small village with a rich history and a strong sense of community. The village is surrounded by farmland and is home to a diverse population. The village has a few small businesses and is a great place to live and work.
Common Questions
What is Per Capita Income in Strawn?
Per Capita income in Strawn is $32,687.
What is the Median Family Income in Strawn?
Median Family Income in Strawn is $108,125.
What is the Median Household income in Strawn?
Median Household Income in Strawn is $66,250.
What is Inequality or Gini Index in Strawn?
Inequality or Gini Index in Strawn is 0.29.
What is the Total Population of Strawn?
Total Population of Strawn is 77.
What is the Total Male Population of Strawn?
Total Male Population of Strawn is 41.
What is the Total Female Population of Strawn?
Total Female Population of Strawn is 36.
What is the Ratio of Males per 100 Females in Strawn?
There are 113.89 Males per 100 Females in Strawn.
What is the Ratio of Females per 100 Males in Strawn?
There are 87.80 Females per 100 Males in Strawn.
What is the Median Population Age in Strawn?
Median Population Age in Strawn is 31.8 Years.
What is the Average Family Size in Strawn
Average Family Size in Strawn is 3.4 People.
What is the Average Household Size in Strawn
Average Household Size in Strawn is 2.5 People.
How Large is the Labor Force in Strawn?
There are 42 People in the Labor Forcein in Strawn.
What is the Percentage of People in the Labor Force in Strawn?
76.4% of People are in the Labor Force in Strawn.