Standard, IL Map & Demographics
Standard Map
Standard Overview
$39,834
PER CAPITA INCOME
$93,750
AVG FAMILY INCOME
$45,625
AVG HOUSEHOLD INCOME
25.4%
WAGE / INCOME GAP [ % ]
74.6¢/ $1
WAGE / INCOME GAP [ $ ]
0.57
INEQUALITY / GINI INDEX
300
TOTAL POPULATION
157
MALE POPULATION
143
FEMALE POPULATION
109.79
MALES / 100 FEMALES
91.08
FEMALES / 100 MALES
44.3
MEDIAN AGE
3.1
AVG FAMILY SIZE
2.0
AVG HOUSEHOLD SIZE
143
LABOR FORCE [ PEOPLE ]
60.1%
PERCENT IN LABOR FORCE
4.9%
UNEMPLOYMENT RATE
Standard Zip Codes
Standard Area Codes
Income in Standard
Income Overview in Standard
Per Capita Income in Standard is $39,834, while median incomes of families and households are $93,750 and $45,625 respectively.
| Characteristic | Number | Measure |
| Per Capita Income | 300 | $39,834 |
| Median Family Income | 66 | $93,750 |
| Mean Family Income | 66 | $166,598 |
| Median Household Income | 153 | $45,625 |
| Mean Household Income | 153 | $93,718 |
| Income Deficit | 66 | $0 |
| Wage / Income Gap (%) | 300 | 25.37% |
| Wage / Income Gap ($) | 300 | 74.63¢ per $1 |
| Gini / Inequality Index | 300 | 0.57 |
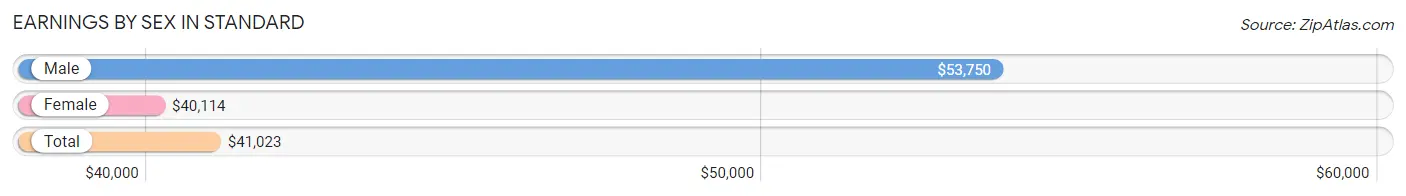
Earnings by Sex in Standard
Average Earnings in Standard are $41,023, $53,750 for men and $40,114 for women, a difference of 25.4%.
| Sex | Number | Average Earnings |
| Male | 74 (50.3%) | $53,750 |
| Female | 73 (49.7%) | $40,114 |
| Total | 147 (100.0%) | $41,023 |
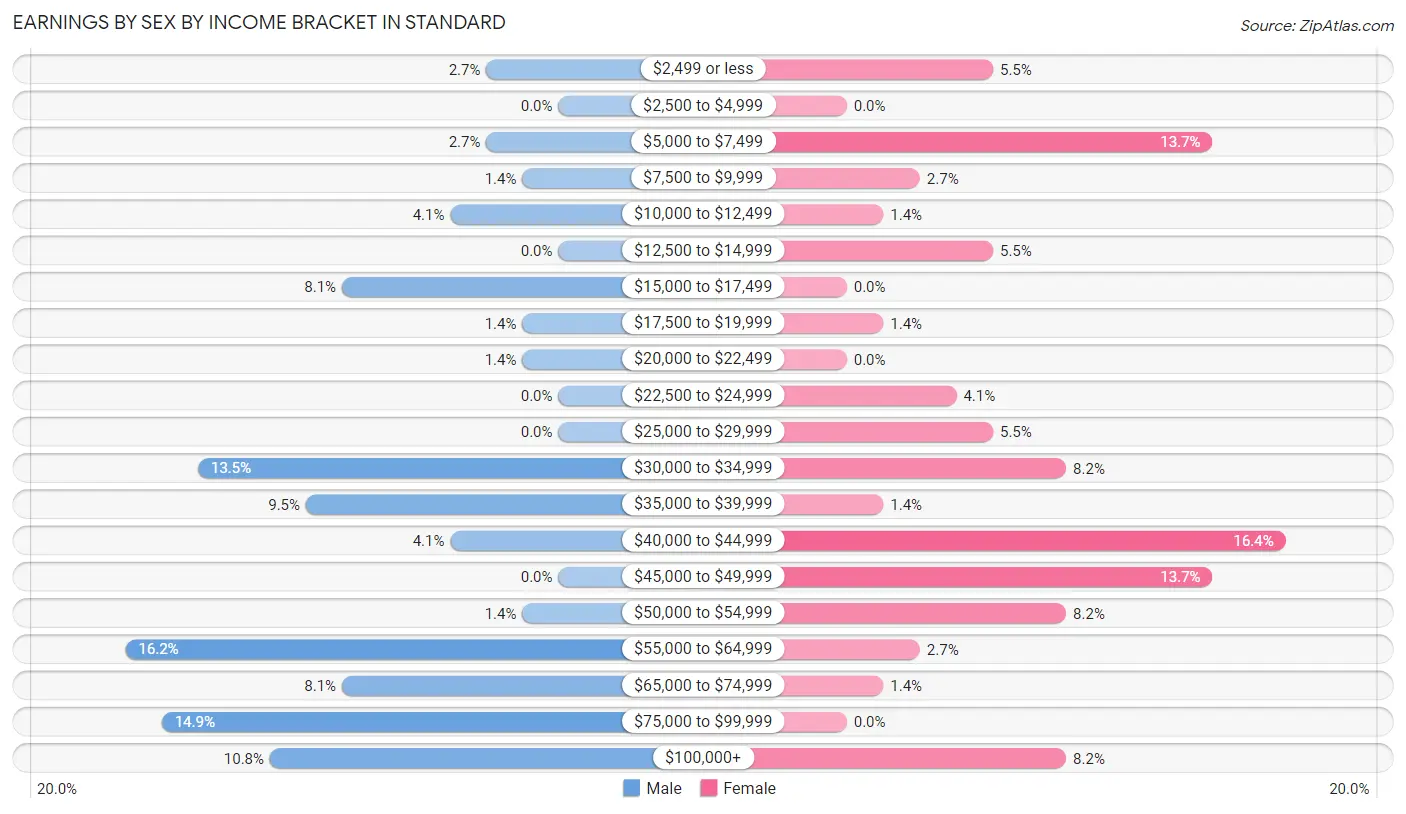
Earnings by Sex by Income Bracket in Standard
The most common earnings brackets in Standard are $55,000 to $64,999 for men (12 | 16.2%) and $40,000 to $44,999 for women (12 | 16.4%).
| Income | Male | Female |
| $2,499 or less | 2 (2.7%) | 4 (5.5%) |
| $2,500 to $4,999 | 0 (0.0%) | 0 (0.0%) |
| $5,000 to $7,499 | 2 (2.7%) | 10 (13.7%) |
| $7,500 to $9,999 | 1 (1.3%) | 2 (2.7%) |
| $10,000 to $12,499 | 3 (4.1%) | 1 (1.4%) |
| $12,500 to $14,999 | 0 (0.0%) | 4 (5.5%) |
| $15,000 to $17,499 | 6 (8.1%) | 0 (0.0%) |
| $17,500 to $19,999 | 1 (1.3%) | 1 (1.4%) |
| $20,000 to $22,499 | 1 (1.3%) | 0 (0.0%) |
| $22,500 to $24,999 | 0 (0.0%) | 3 (4.1%) |
| $25,000 to $29,999 | 0 (0.0%) | 4 (5.5%) |
| $30,000 to $34,999 | 10 (13.5%) | 6 (8.2%) |
| $35,000 to $39,999 | 7 (9.5%) | 1 (1.4%) |
| $40,000 to $44,999 | 3 (4.1%) | 12 (16.4%) |
| $45,000 to $49,999 | 0 (0.0%) | 10 (13.7%) |
| $50,000 to $54,999 | 1 (1.3%) | 6 (8.2%) |
| $55,000 to $64,999 | 12 (16.2%) | 2 (2.7%) |
| $65,000 to $74,999 | 6 (8.1%) | 1 (1.4%) |
| $75,000 to $99,999 | 11 (14.9%) | 0 (0.0%) |
| $100,000+ | 8 (10.8%) | 6 (8.2%) |
| Total | 74 (100.0%) | 73 (100.0%) |
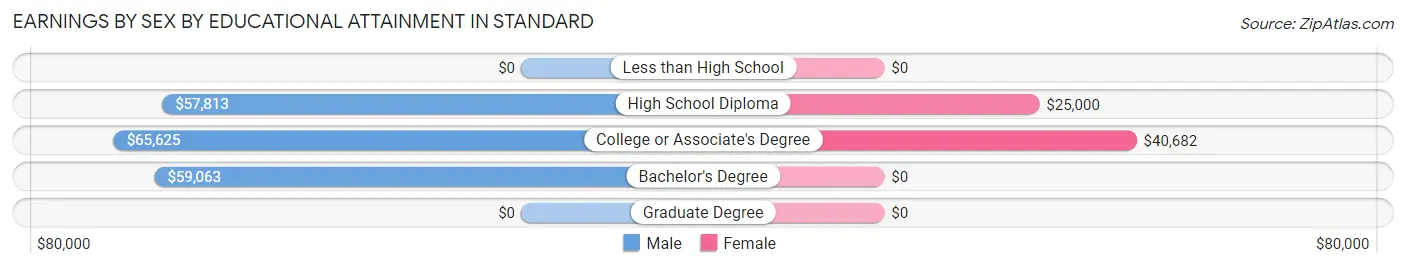
Earnings by Sex by Educational Attainment in Standard
Average earnings in Standard are $59,375 for men and $40,114 for women, a difference of 32.4%. Men with an educational attainment of college or associate's degree enjoy the highest average annual earnings of $65,625, while those with high school diploma education earn the least with $57,813. Women with an educational attainment of college or associate's degree earn the most with the average annual earnings of $40,682, while those with high school diploma education have the smallest earnings of $25,000.
| Educational Attainment | Male Income | Female Income |
| Less than High School | - | - |
| High School Diploma | $57,813 | $25,000 |
| College or Associate's Degree | $65,625 | $40,682 |
| Bachelor's Degree | $59,063 | $0 |
| Graduate Degree | - | - |
| Total | $59,375 | $40,114 |
Family Income in Standard
Family Income Brackets in Standard
According to the Standard family income data, there are 16 families falling into the $35,000 to $49,999 income range, which is the most common income bracket and makes up 24.2% of all families.
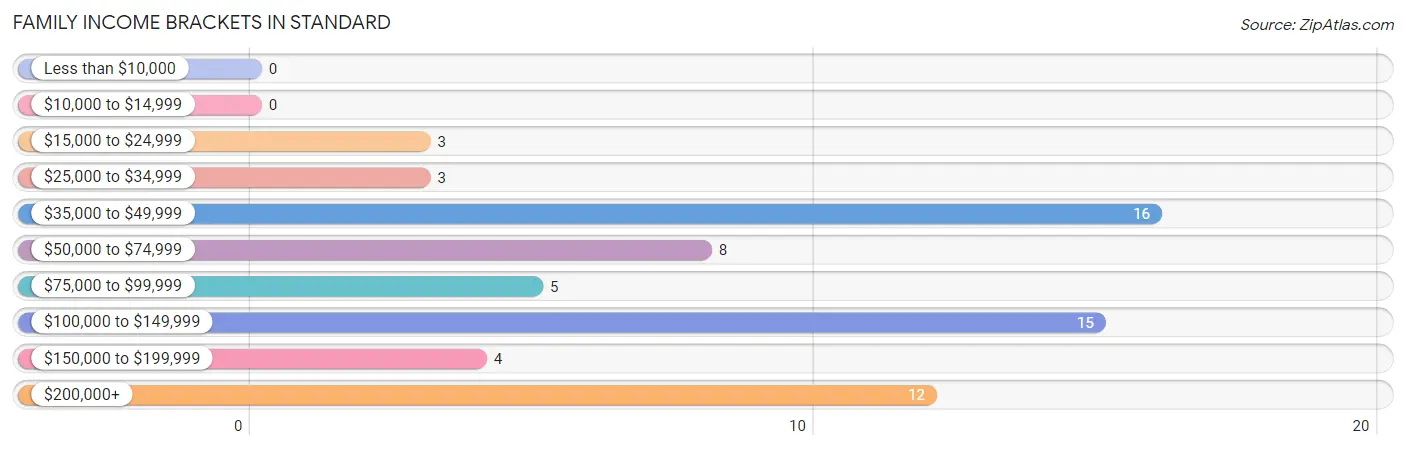
| Income Bracket | # Families | % Families |
| Less than $10,000 | 0 | 0.0% |
| $10,000 to $14,999 | 0 | 0.0% |
| $15,000 to $24,999 | 3 | 4.5% |
| $25,000 to $34,999 | 3 | 4.5% |
| $35,000 to $49,999 | 16 | 24.2% |
| $50,000 to $74,999 | 8 | 12.1% |
| $75,000 to $99,999 | 5 | 7.6% |
| $100,000 to $149,999 | 15 | 22.7% |
| $150,000 to $199,999 | 4 | 6.1% |
| $200,000+ | 12 | 18.2% |
Family Income by Famaliy Size in Standard
5-person families (17 | 25.8%) account for the highest median family income in Standard with $250,001 per family, while 5-person families (17 | 25.8%) have the highest median income of $50,000 per family member.
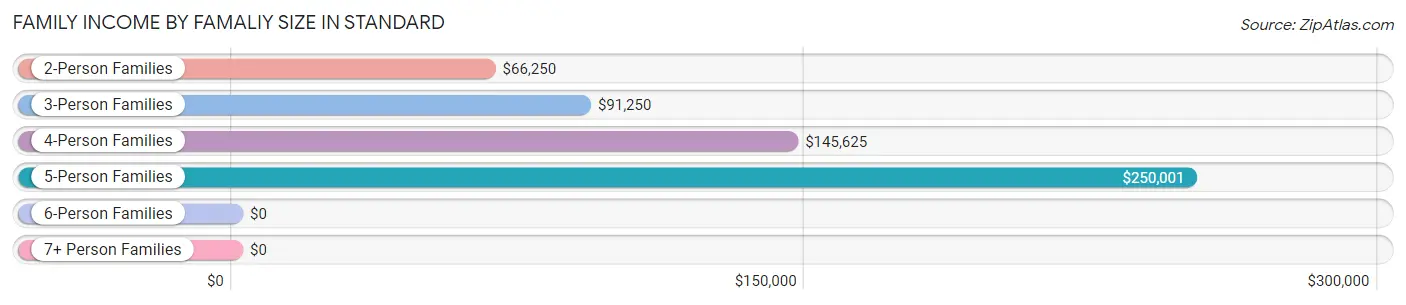
| Income Bracket | # Families | Median Income |
| 2-Person Families | 25 (37.9%) | $66,250 |
| 3-Person Families | 19 (28.8%) | $91,250 |
| 4-Person Families | 5 (7.6%) | $145,625 |
| 5-Person Families | 17 (25.8%) | $250,001 |
| 6-Person Families | 0 (0.0%) | $0 |
| 7+ Person Families | 0 (0.0%) | $0 |
| Total | 66 (100.0%) | $93,750 |
Family Income by Number of Earners in Standard
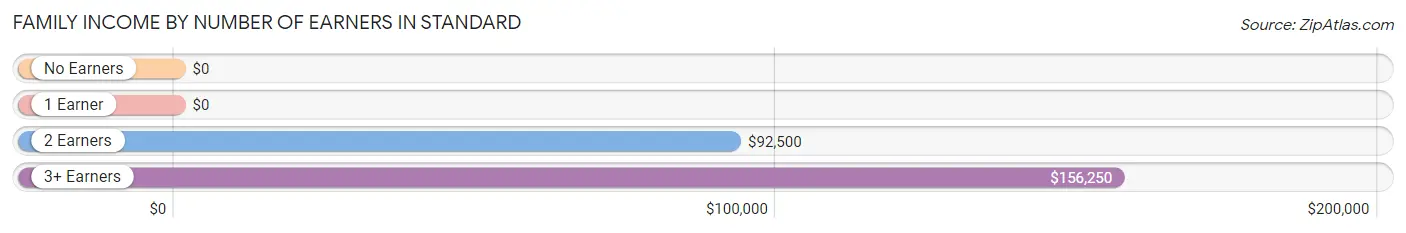
| Number of Earners | # Families | Median Income |
| No Earners | 6 (9.1%) | $0 |
| 1 Earner | 30 (45.5%) | $0 |
| 2 Earners | 26 (39.4%) | $92,500 |
| 3+ Earners | 4 (6.1%) | $156,250 |
| Total | 66 (100.0%) | $93,750 |
Household Income in Standard
Household Income Brackets in Standard
With 38 households falling in the category, the $35,000 to $49,999 income range is the most frequent in Standard, accounting for 24.8% of all households. In contrast, only 4 households (2.6%) fall into the $150,000 to $199,999 income bracket, making it the least populous group.
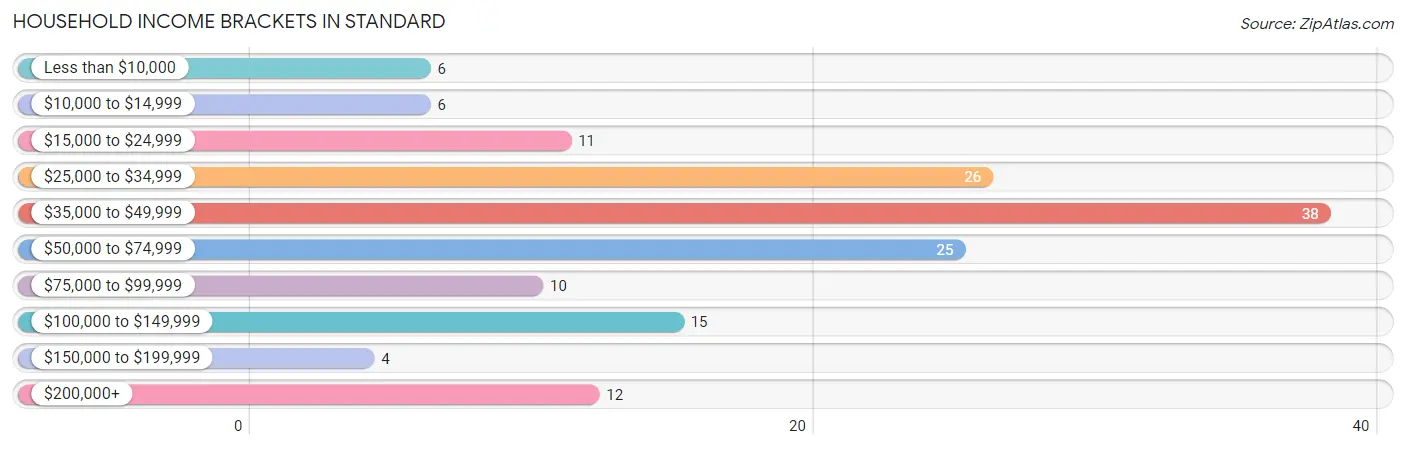
| Income Bracket | # Households | % Households |
| Less than $10,000 | 6 | 3.9% |
| $10,000 to $14,999 | 6 | 3.9% |
| $15,000 to $24,999 | 11 | 7.2% |
| $25,000 to $34,999 | 26 | 17.0% |
| $35,000 to $49,999 | 38 | 24.8% |
| $50,000 to $74,999 | 25 | 16.3% |
| $75,000 to $99,999 | 10 | 6.5% |
| $100,000 to $149,999 | 15 | 9.8% |
| $150,000 to $199,999 | 4 | 2.6% |
| $200,000+ | 12 | 7.8% |
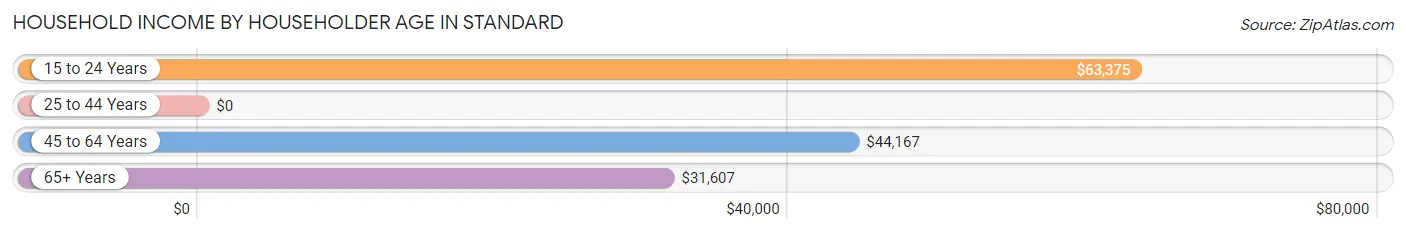
Household Income by Householder Age in Standard
The median household income in Standard is $45,625, with the highest median household income of $63,375 found in the 15 to 24 years age bracket for the primary householder. A total of 13 households (8.5%) fall into this category. Meanwhile, the 25 to 44 years age bracket for the primary householder has the lowest median household income of $0, with 39 households (25.5%) in this group.
| Income Bracket | # Households | Median Income |
| 15 to 24 Years | 13 (8.5%) | $63,375 |
| 25 to 44 Years | 39 (25.5%) | $0 |
| 45 to 64 Years | 46 (30.1%) | $44,167 |
| 65+ Years | 55 (35.9%) | $31,607 |
| Total | 153 (100.0%) | $45,625 |
Poverty in Standard
Income Below Poverty by Sex and Age in Standard
With 5.7% poverty level for males and 8.4% for females among the residents of Standard, 65 to 74 year old males and 18 to 24 year old females are the most vulnerable to poverty, with 5 males (71.4%) and 1 females (33.3%) in their respective age groups living below the poverty level.
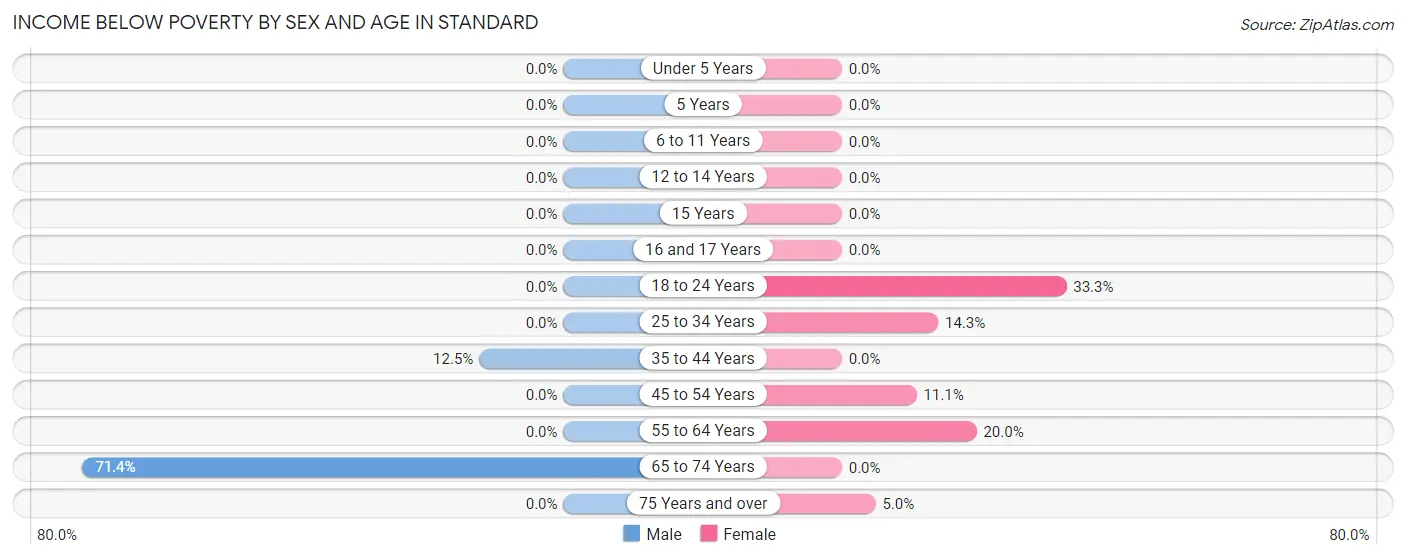
| Age Bracket | Male | Female |
| Under 5 Years | 0 (0.0%) | 0 (0.0%) |
| 5 Years | 0 (0.0%) | 0 (0.0%) |
| 6 to 11 Years | 0 (0.0%) | 0 (0.0%) |
| 12 to 14 Years | 0 (0.0%) | 0 (0.0%) |
| 15 Years | 0 (0.0%) | 0 (0.0%) |
| 16 and 17 Years | 0 (0.0%) | 0 (0.0%) |
| 18 to 24 Years | 0 (0.0%) | 1 (33.3%) |
| 25 to 34 Years | 0 (0.0%) | 2 (14.3%) |
| 35 to 44 Years | 4 (12.5%) | 0 (0.0%) |
| 45 to 54 Years | 0 (0.0%) | 2 (11.1%) |
| 55 to 64 Years | 0 (0.0%) | 5 (20.0%) |
| 65 to 74 Years | 5 (71.4%) | 0 (0.0%) |
| 75 Years and over | 0 (0.0%) | 2 (5.0%) |
| Total | 9 (5.7%) | 12 (8.4%) |
Income Above Poverty by Sex and Age in Standard
According to the poverty statistics in Standard, males aged under 5 years and females aged under 5 years are the age groups that are most secure financially, with 100.0% of males and 100.0% of females in these age groups living above the poverty line.
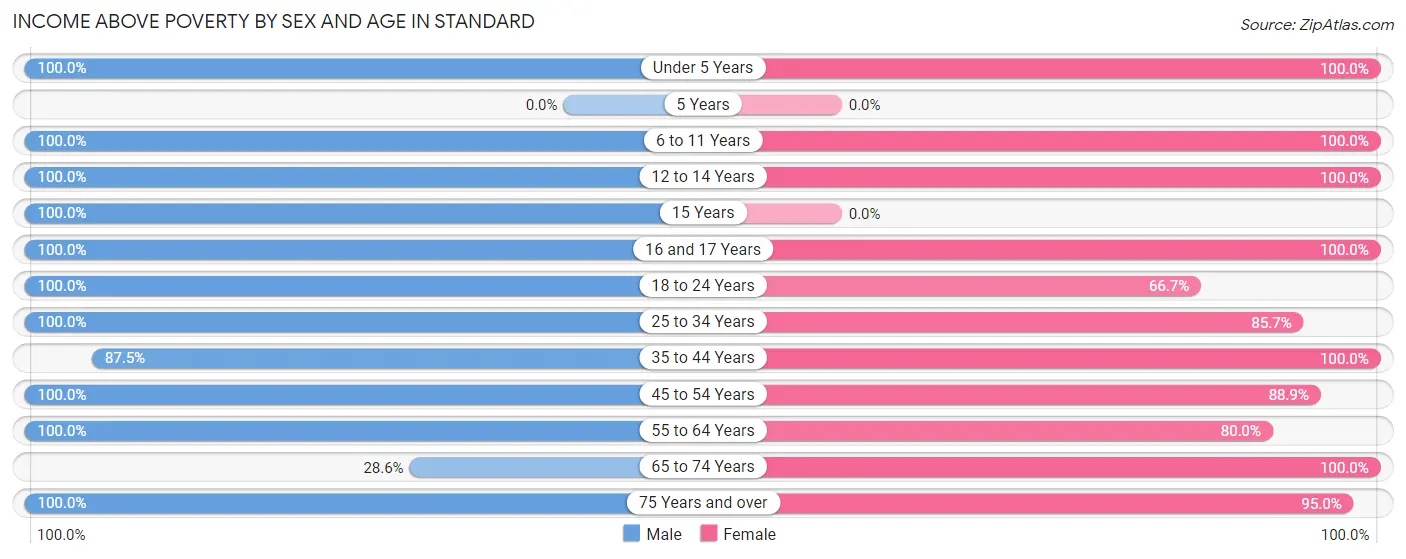
| Age Bracket | Male | Female |
| Under 5 Years | 24 (100.0%) | 3 (100.0%) |
| 5 Years | 0 (0.0%) | 0 (0.0%) |
| 6 to 11 Years | 8 (100.0%) | 8 (100.0%) |
| 12 to 14 Years | 11 (100.0%) | 5 (100.0%) |
| 15 Years | 3 (100.0%) | 0 (0.0%) |
| 16 and 17 Years | 3 (100.0%) | 4 (100.0%) |
| 18 to 24 Years | 15 (100.0%) | 2 (66.7%) |
| 25 to 34 Years | 8 (100.0%) | 12 (85.7%) |
| 35 to 44 Years | 28 (87.5%) | 18 (100.0%) |
| 45 to 54 Years | 11 (100.0%) | 16 (88.9%) |
| 55 to 64 Years | 21 (100.0%) | 20 (80.0%) |
| 65 to 74 Years | 2 (28.6%) | 5 (100.0%) |
| 75 Years and over | 14 (100.0%) | 38 (95.0%) |
| Total | 148 (94.3%) | 131 (91.6%) |
Income Below Poverty Among Married-Couple Families in Standard
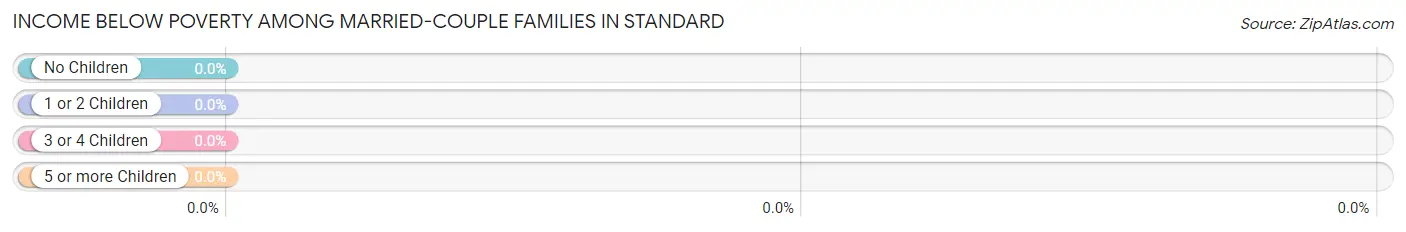
| Children | Above Poverty | Below Poverty |
| No Children | 23 (100.0%) | 0 (0.0%) |
| 1 or 2 Children | 20 (100.0%) | 0 (0.0%) |
| 3 or 4 Children | 13 (100.0%) | 0 (0.0%) |
| 5 or more Children | 0 (0.0%) | 0 (0.0%) |
| Total | 56 (100.0%) | 0 (0.0%) |
Income Below Poverty Among Single-Parent Households in Standard
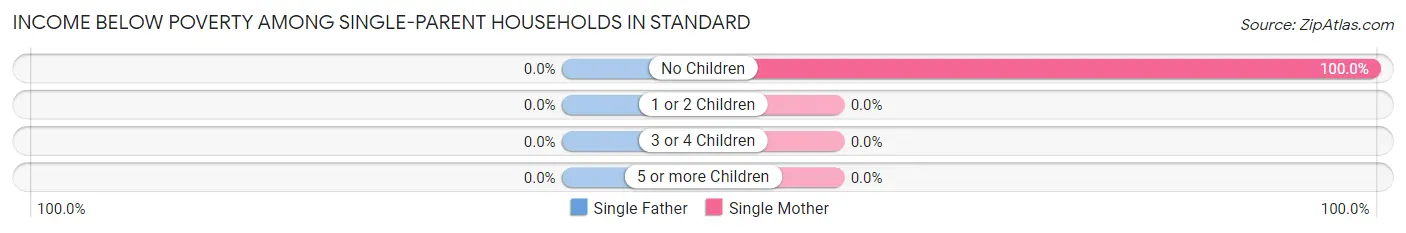
| Children | Single Father | Single Mother |
| No Children | 0 (0.0%) | 3 (100.0%) |
| 1 or 2 Children | 0 (0.0%) | 0 (0.0%) |
| 3 or 4 Children | 0 (0.0%) | 0 (0.0%) |
| 5 or more Children | 0 (0.0%) | 0 (0.0%) |
| Total | 0 (0.0%) | 3 (60.0%) |
Income Below Poverty Among Married-Couple vs Single-Parent Households in Standard
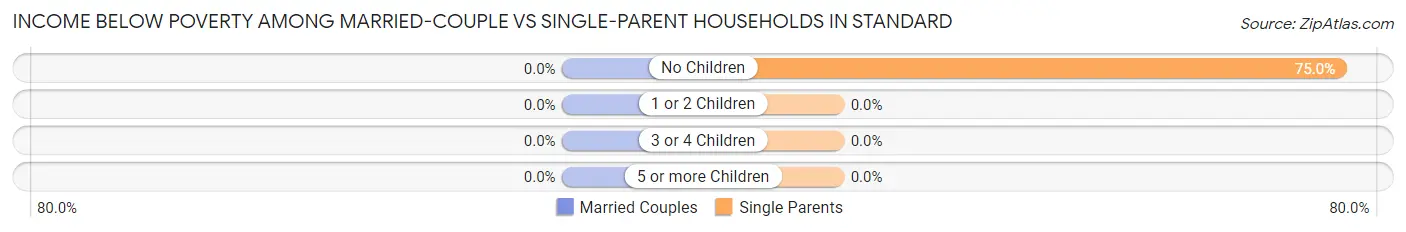
| Children | Married-Couple Families | Single-Parent Households |
| No Children | 0 (0.0%) | 3 (75.0%) |
| 1 or 2 Children | 0 (0.0%) | 0 (0.0%) |
| 3 or 4 Children | 0 (0.0%) | 0 (0.0%) |
| 5 or more Children | 0 (0.0%) | 0 (0.0%) |
| Total | 0 (0.0%) | 3 (30.0%) |
Race in Standard
The most populous races in Standard are White / Caucasian (288 | 96.0%), Hispanic or Latino (39 | 13.0%), and Some other Race (10 | 3.3%).
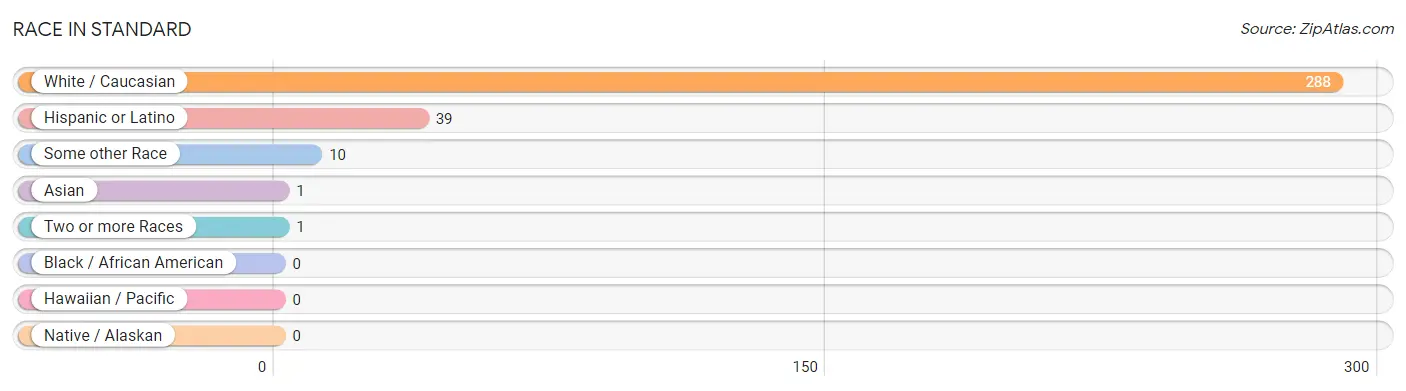
| Race | # Population | % Population |
| Asian | 1 | 0.3% |
| Black / African American | 0 | 0.0% |
| Hawaiian / Pacific | 0 | 0.0% |
| Hispanic or Latino | 39 | 13.0% |
| Native / Alaskan | 0 | 0.0% |
| White / Caucasian | 288 | 96.0% |
| Two or more Races | 1 | 0.3% |
| Some other Race | 10 | 3.3% |
| Total | 300 | 100.0% |
Ancestry in Standard
The most populous ancestries reported in Standard are German (94 | 31.3%), Italian (67 | 22.3%), Irish (38 | 12.7%), Mexican (29 | 9.7%), and American (21 | 7.0%), together accounting for 83.0% of all Standard residents.
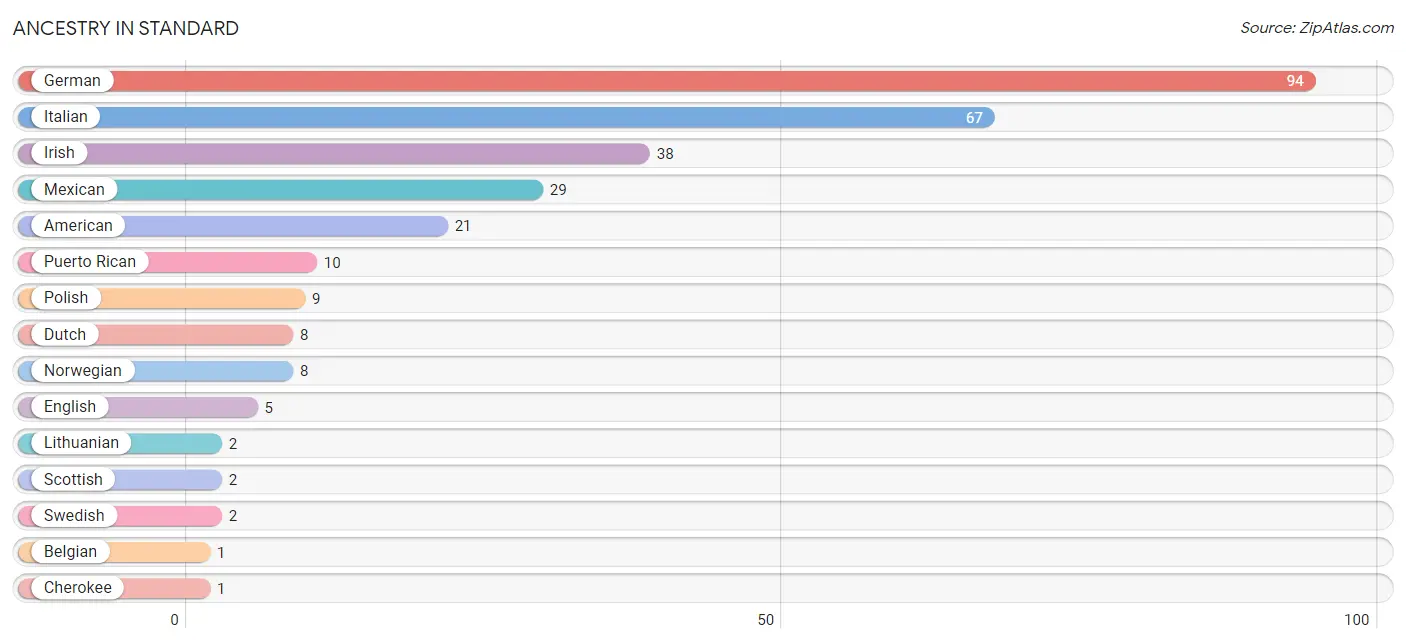
| Ancestry | # Population | % Population |
| American | 21 | 7.0% |
| Belgian | 1 | 0.3% |
| Cherokee | 1 | 0.3% |
| Dutch | 8 | 2.7% |
| Eastern European | 1 | 0.3% |
| English | 5 | 1.7% |
| French | 1 | 0.3% |
| German | 94 | 31.3% |
| Irish | 38 | 12.7% |
| Italian | 67 | 22.3% |
| Korean | 1 | 0.3% |
| Lithuanian | 2 | 0.7% |
| Mexican | 29 | 9.7% |
| Norwegian | 8 | 2.7% |
| Polish | 9 | 3.0% |
| Puerto Rican | 10 | 3.3% |
| Scotch-Irish | 1 | 0.3% |
| Scottish | 2 | 0.7% |
| Swedish | 2 | 0.7% | View All 19 Rows |
Immigrants in Standard
The most numerous immigrant groups reported in Standard came from Central America (4 | 1.3%), Latin America (4 | 1.3%), Mexico (4 | 1.3%), Asia (1 | 0.3%), and Philippines (1 | 0.3%), together accounting for 4.6% of all Standard residents.
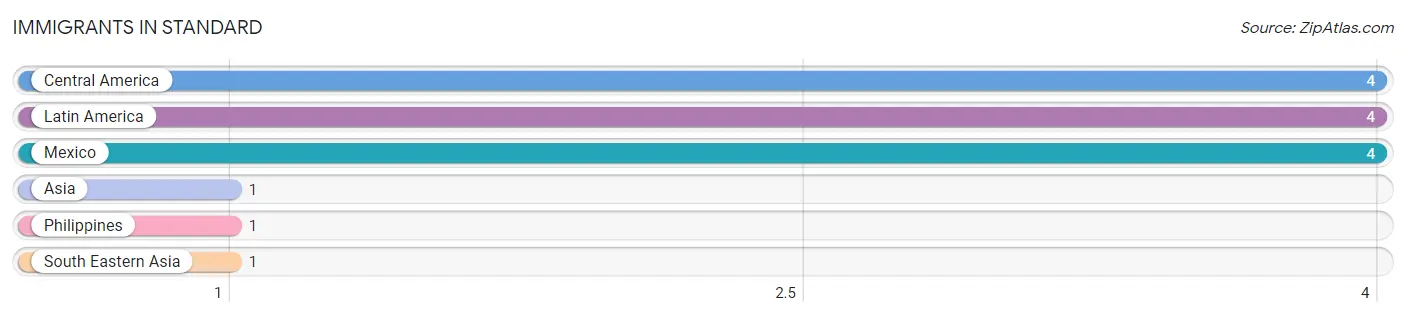
| Immigration Origin | # Population | % Population |
| Asia | 1 | 0.3% |
| Central America | 4 | 1.3% |
| Latin America | 4 | 1.3% |
| Mexico | 4 | 1.3% |
| Philippines | 1 | 0.3% |
| South Eastern Asia | 1 | 0.3% | View All 6 Rows |
Sex and Age in Standard
Sex and Age in Standard
The most populous age groups in Standard are Under 5 Years (24 | 15.3%) for men and 85 Years and over (27 | 18.9%) for women.
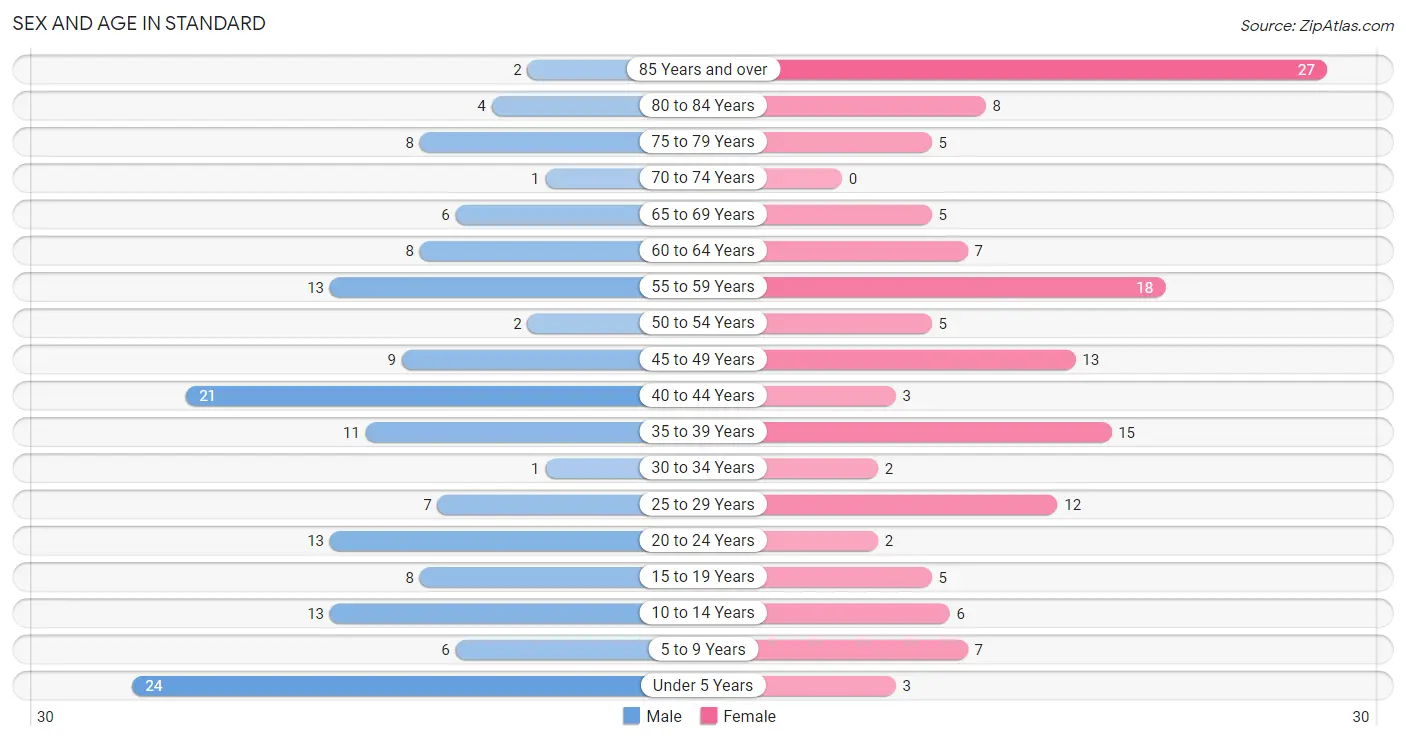
| Age Bracket | Male | Female |
| Under 5 Years | 24 (15.3%) | 3 (2.1%) |
| 5 to 9 Years | 6 (3.8%) | 7 (4.9%) |
| 10 to 14 Years | 13 (8.3%) | 6 (4.2%) |
| 15 to 19 Years | 8 (5.1%) | 5 (3.5%) |
| 20 to 24 Years | 13 (8.3%) | 2 (1.4%) |
| 25 to 29 Years | 7 (4.5%) | 12 (8.4%) |
| 30 to 34 Years | 1 (0.6%) | 2 (1.4%) |
| 35 to 39 Years | 11 (7.0%) | 15 (10.5%) |
| 40 to 44 Years | 21 (13.4%) | 3 (2.1%) |
| 45 to 49 Years | 9 (5.7%) | 13 (9.1%) |
| 50 to 54 Years | 2 (1.3%) | 5 (3.5%) |
| 55 to 59 Years | 13 (8.3%) | 18 (12.6%) |
| 60 to 64 Years | 8 (5.1%) | 7 (4.9%) |
| 65 to 69 Years | 6 (3.8%) | 5 (3.5%) |
| 70 to 74 Years | 1 (0.6%) | 0 (0.0%) |
| 75 to 79 Years | 8 (5.1%) | 5 (3.5%) |
| 80 to 84 Years | 4 (2.5%) | 8 (5.6%) |
| 85 Years and over | 2 (1.3%) | 27 (18.9%) |
| Total | 157 (100.0%) | 143 (100.0%) |
Families and Households in Standard
Median Family Size in Standard
The median family size in Standard is 3.09 persons per family, with single male/father families (5 | 7.6%) accounting for the largest median family size of 3.4 persons per family. On the other hand, single female/mother families (5 | 7.6%) represent the smallest median family size with 2.60 persons per family.
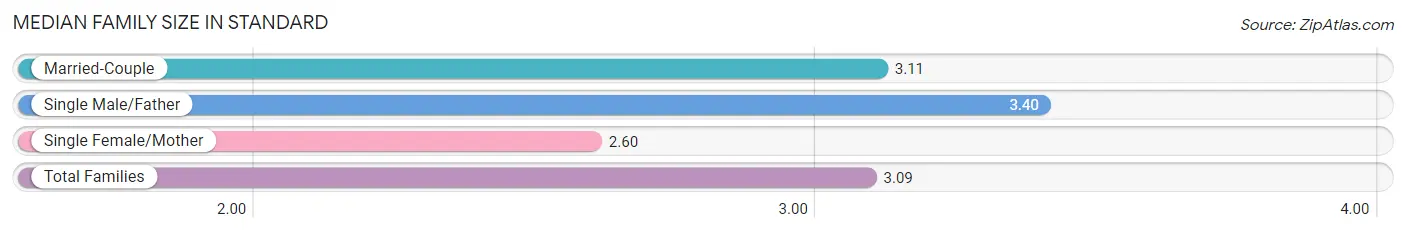
| Family Type | # Families | Family Size |
| Married-Couple | 56 (84.9%) | 3.11 |
| Single Male/Father | 5 (7.6%) | 3.40 |
| Single Female/Mother | 5 (7.6%) | 2.60 |
| Total Families | 66 (100.0%) | 3.09 |
Median Household Size in Standard
The median household size in Standard is 1.96 persons per household, with single male/father households (5 | 3.3%) accounting for the largest median household size of 3.4 persons per household. non-family households (87 | 56.9%) represent the smallest median household size with 1.07 persons per household.
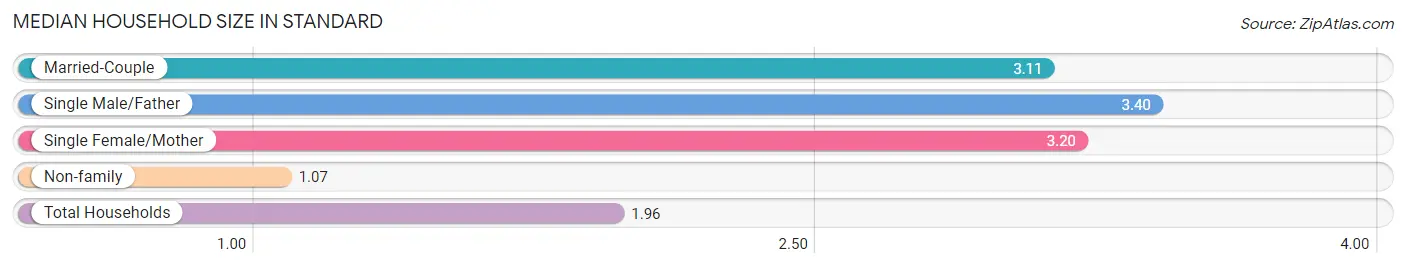
| Household Type | # Households | Household Size |
| Married-Couple | 56 (36.6%) | 3.11 |
| Single Male/Father | 5 (3.3%) | 3.40 |
| Single Female/Mother | 5 (3.3%) | 3.20 |
| Non-family | 87 (56.9%) | 1.07 |
| Total Households | 153 (100.0%) | 1.96 |
Household Size by Marriage Status in Standard
Out of a total of 153 households in Standard, 66 (43.1%) are family households, while 87 (56.9%) are nonfamily households. The most numerous type of family households are 2-person households, comprising 22, and the most common type of nonfamily households are 1-person households, comprising 75.
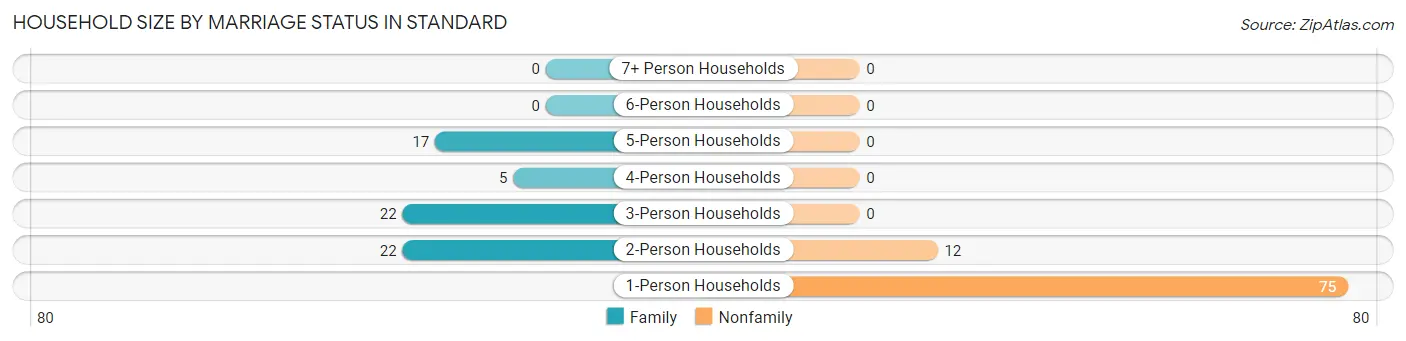
| Household Size | Family Households | Nonfamily Households |
| 1-Person Households | - | 75 (49.0%) |
| 2-Person Households | 22 (14.4%) | 12 (7.8%) |
| 3-Person Households | 22 (14.4%) | 0 (0.0%) |
| 4-Person Households | 5 (3.3%) | 0 (0.0%) |
| 5-Person Households | 17 (11.1%) | 0 (0.0%) |
| 6-Person Households | 0 (0.0%) | 0 (0.0%) |
| 7+ Person Households | 0 (0.0%) | 0 (0.0%) |
| Total | 66 (43.1%) | 87 (56.9%) |
Female Fertility in Standard
Fertility by Age in Standard
Average fertility rate in Standard is 192.0 births per 1,000 women. Women in the age bracket of 20 to 34 years have the highest fertility rate with 625.0 births per 1,000 women. Women in the age bracket of 20 to 34 years acount for 100.0% of all women with births.
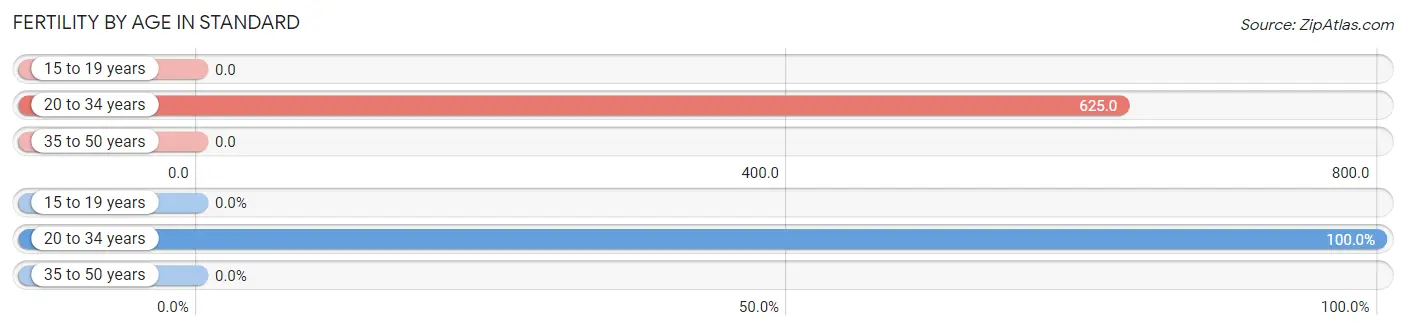
| Age Bracket | Women with Births | Births / 1,000 Women |
| 15 to 19 years | 0 (0.0%) | 0.0 |
| 20 to 34 years | 10 (100.0%) | 625.0 |
| 35 to 50 years | 0 (0.0%) | 0.0 |
| Total | 10 (100.0%) | 192.0 |
Fertility by Age by Marriage Status in Standard
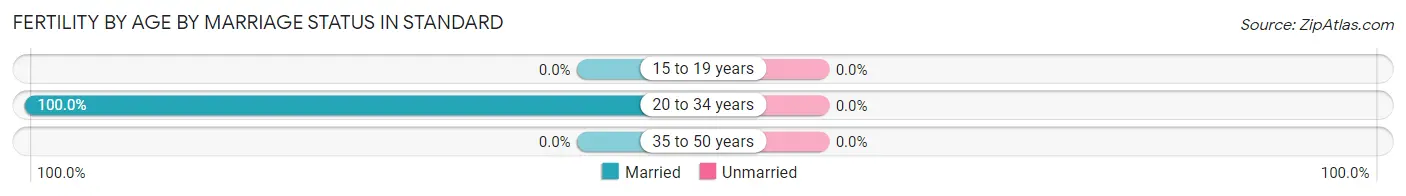
| Age Bracket | Married | Unmarried |
| 15 to 19 years | 0 (0.0%) | 0 (0.0%) |
| 20 to 34 years | 10 (100.0%) | 0 (0.0%) |
| 35 to 50 years | 0 (0.0%) | 0 (0.0%) |
| Total | 10 (100.0%) | 0 (0.0%) |
Fertility by Education in Standard
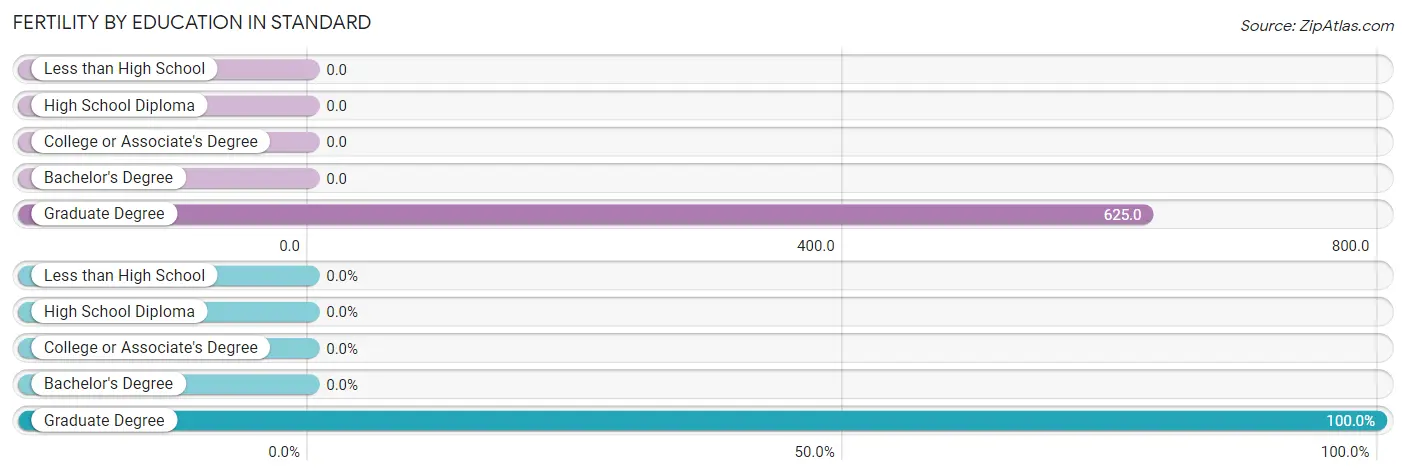
| Educational Attainment | Women with Births | Births / 1,000 Women |
| Less than High School | 0 (0.0%) | 0.0 |
| High School Diploma | 0 (0.0%) | 0.0 |
| College or Associate's Degree | 0 (0.0%) | 0.0 |
| Bachelor's Degree | 0 (0.0%) | 0.0 |
| Graduate Degree | 10 (100.0%) | 625.0 |
| Total | 10 (100.0%) | 192.0 |
Fertility by Education by Marriage Status in Standard
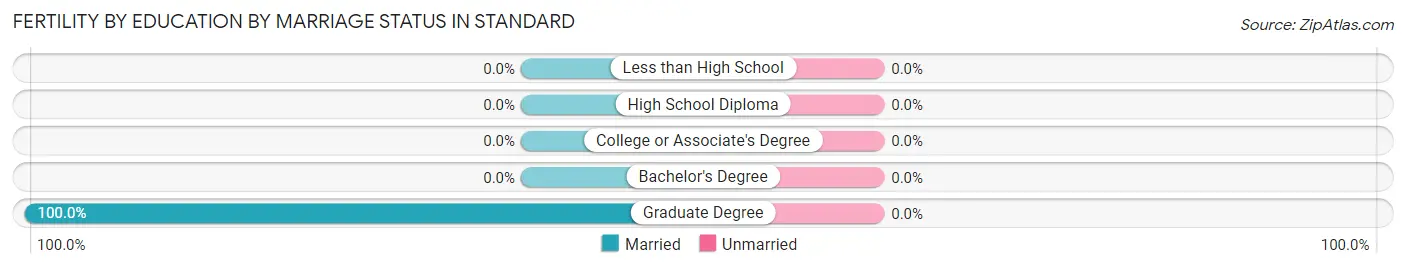
| Educational Attainment | Married | Unmarried |
| Less than High School | 0 (0.0%) | 0 (0.0%) |
| High School Diploma | 0 (0.0%) | 0 (0.0%) |
| College or Associate's Degree | 0 (0.0%) | 0 (0.0%) |
| Bachelor's Degree | 0 (0.0%) | 0 (0.0%) |
| Graduate Degree | 10 (100.0%) | 0 (0.0%) |
| Total | 10 (100.0%) | 0 (0.0%) |
Employment Characteristics in Standard
Employment by Class of Employer in Standard
Among the 136 employed individuals in Standard, private company employees (95 | 69.9%), local government employees (17 | 12.5%), and self-employed (not incorporated) (13 | 9.6%) make up the most common classes of employment.
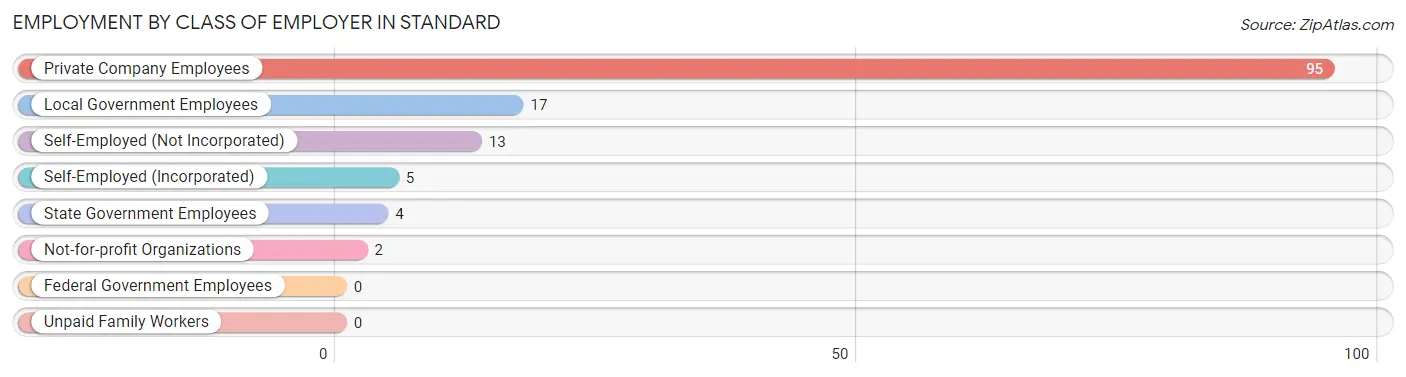
| Employer Class | # Employees | % Employees |
| Private Company Employees | 95 | 69.9% |
| Self-Employed (Incorporated) | 5 | 3.7% |
| Self-Employed (Not Incorporated) | 13 | 9.6% |
| Not-for-profit Organizations | 2 | 1.5% |
| Local Government Employees | 17 | 12.5% |
| State Government Employees | 4 | 2.9% |
| Federal Government Employees | 0 | 0.0% |
| Unpaid Family Workers | 0 | 0.0% |
| Total | 136 | 100.0% |
Employment Status by Age in Standard
According to the labor force statistics for Standard, out of the total population over 16 years of age (238), 60.1% or 143 individuals are in the labor force, with 4.9% or 7 of them unemployed. The age group with the highest labor force participation rate is 20 to 24 years, with 100.0% or 15 individuals in the labor force. Within the labor force, the 35 to 44 years age range has the highest percentage of unemployed individuals, with 17.9% or 7 of them being unemployed.
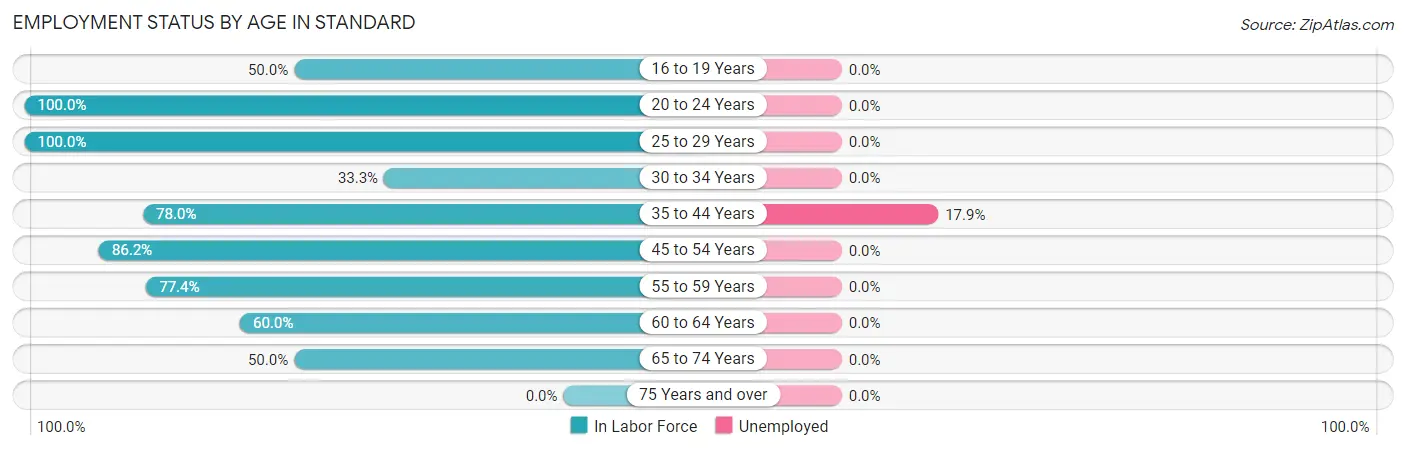
| Age Bracket | In Labor Force | Unemployed |
| 16 to 19 Years | 5 (50.0%) | 0 (0.0%) |
| 20 to 24 Years | 15 (100.0%) | 0 (0.0%) |
| 25 to 29 Years | 19 (100.0%) | 0 (0.0%) |
| 30 to 34 Years | 1 (33.3%) | 0 (0.0%) |
| 35 to 44 Years | 39 (78.0%) | 7 (17.9%) |
| 45 to 54 Years | 25 (86.2%) | 0 (0.0%) |
| 55 to 59 Years | 24 (77.4%) | 0 (0.0%) |
| 60 to 64 Years | 9 (60.0%) | 0 (0.0%) |
| 65 to 74 Years | 6 (50.0%) | 0 (0.0%) |
| 75 Years and over | 0 (0.0%) | 0 (0.0%) |
| Total | 143 (60.1%) | 7 (4.9%) |
Employment Status by Educational Attainment in Standard
According to labor force statistics for Standard, 79.6% of individuals (117) out of the total population between 25 and 64 years of age (147) are in the labor force, with 6.0% or 7 of them being unemployed. The group with the highest labor force participation rate are those with the educational attainment of less than high school, with 100.0% or 13 individuals in the labor force. Within the labor force, individuals with less than high school education have the highest percentage of unemployment, with 53.8% or 7 of them being unemployed.
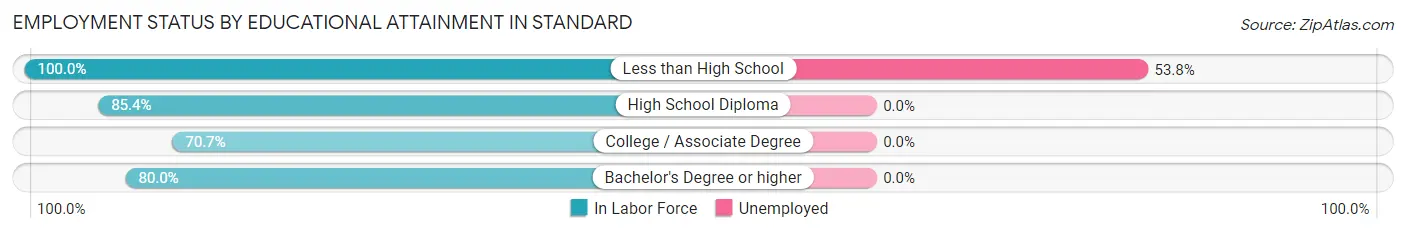
| Educational Attainment | In Labor Force | Unemployed |
| Less than High School | 13 (100.0%) | 7 (53.8%) |
| High School Diploma | 35 (85.4%) | 0 (0.0%) |
| College / Associate Degree | 41 (70.7%) | 0 (0.0%) |
| Bachelor's Degree or higher | 28 (80.0%) | 0 (0.0%) |
| Total | 117 (79.6%) | 9 (6.0%) |
Employment Occupations by Sex in Standard
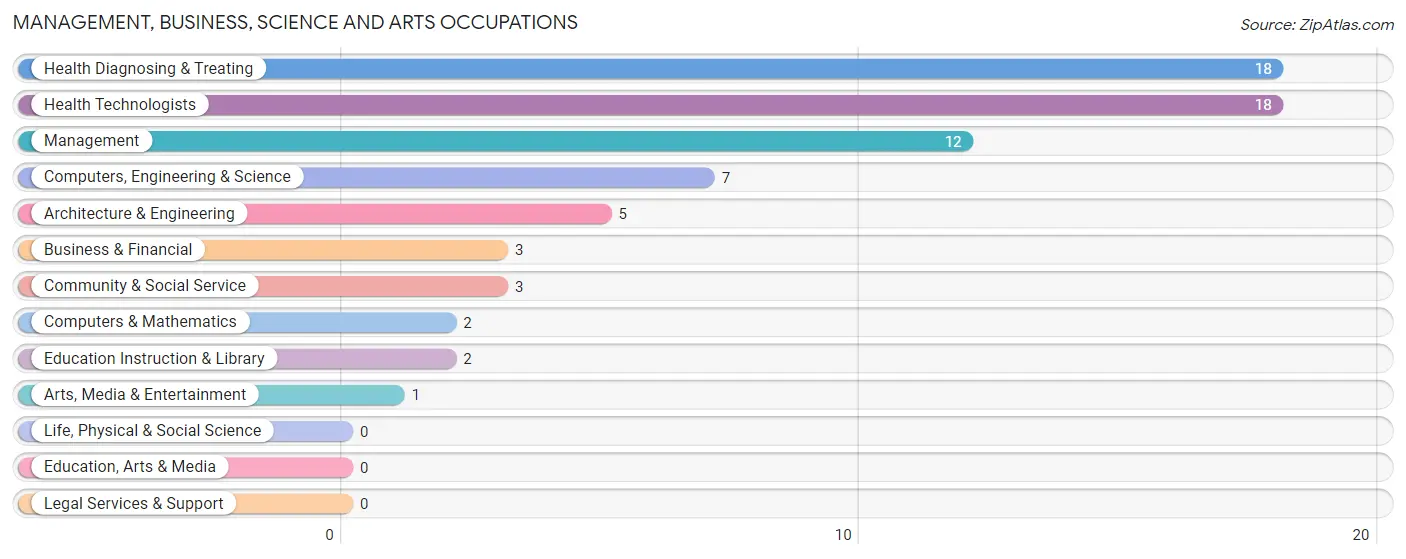
Management, Business, Science and Arts Occupations
The most common Management, Business, Science and Arts occupations in Standard are Health Diagnosing & Treating (18 | 13.2%), Health Technologists (18 | 13.2%), Management (12 | 8.8%), Computers, Engineering & Science (7 | 5.1%), and Architecture & Engineering (5 | 3.7%).
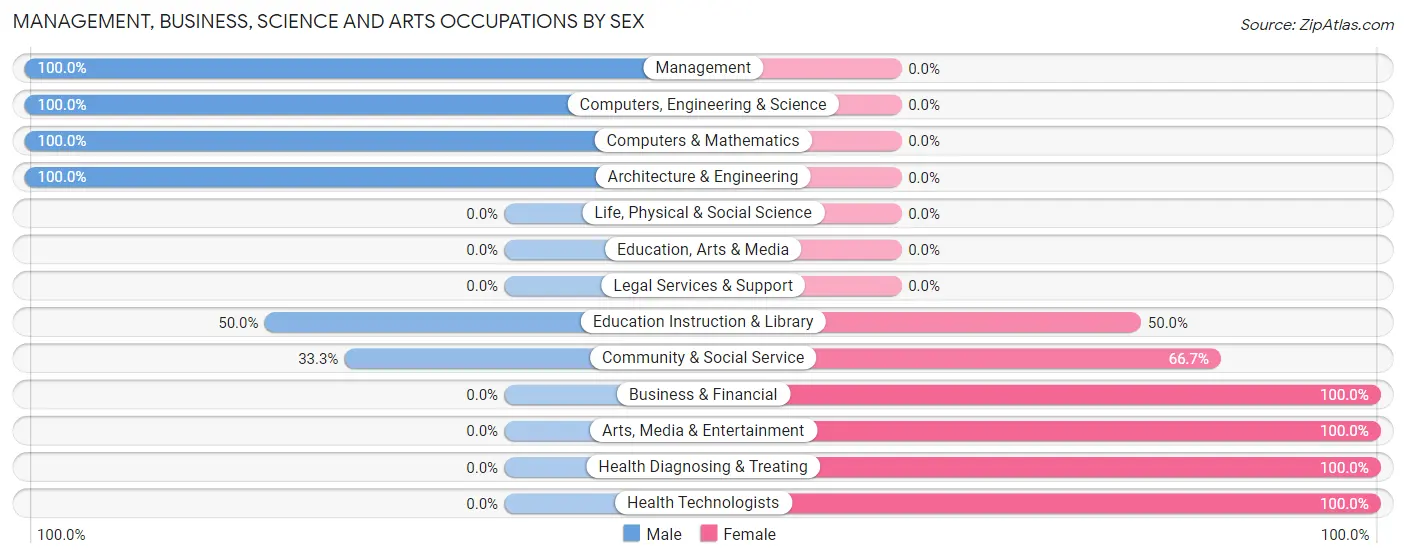
Management, Business, Science and Arts Occupations by Sex
Within the Management, Business, Science and Arts occupations in Standard, the most male-oriented occupations are Management (100.0%), Computers, Engineering & Science (100.0%), and Computers & Mathematics (100.0%), while the most female-oriented occupations are Business & Financial (100.0%), Arts, Media & Entertainment (100.0%), and Health Diagnosing & Treating (100.0%).
| Occupation | Male | Female |
| Management | 12 (100.0%) | 0 (0.0%) |
| Business & Financial | 0 (0.0%) | 3 (100.0%) |
| Computers, Engineering & Science | 7 (100.0%) | 0 (0.0%) |
| Computers & Mathematics | 2 (100.0%) | 0 (0.0%) |
| Architecture & Engineering | 5 (100.0%) | 0 (0.0%) |
| Life, Physical & Social Science | 0 (0.0%) | 0 (0.0%) |
| Community & Social Service | 1 (33.3%) | 2 (66.7%) |
| Education, Arts & Media | 0 (0.0%) | 0 (0.0%) |
| Legal Services & Support | 0 (0.0%) | 0 (0.0%) |
| Education Instruction & Library | 1 (50.0%) | 1 (50.0%) |
| Arts, Media & Entertainment | 0 (0.0%) | 1 (100.0%) |
| Health Diagnosing & Treating | 0 (0.0%) | 18 (100.0%) |
| Health Technologists | 0 (0.0%) | 18 (100.0%) |
| Total (Category) | 20 (46.5%) | 23 (53.5%) |
| Total (Overall) | 70 (51.5%) | 66 (48.5%) |
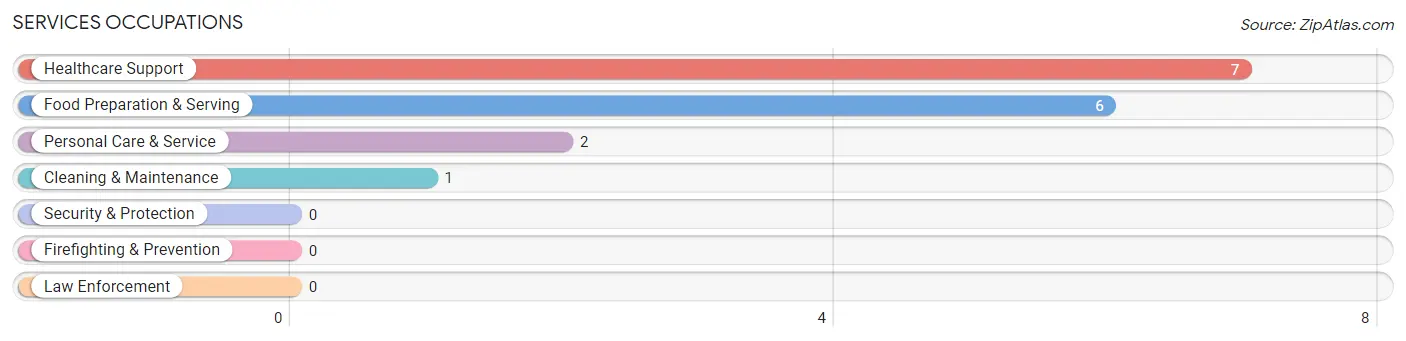
Services Occupations
The most common Services occupations in Standard are Healthcare Support (7 | 5.1%), Food Preparation & Serving (6 | 4.4%), Personal Care & Service (2 | 1.5%), and Cleaning & Maintenance (1 | 0.7%).
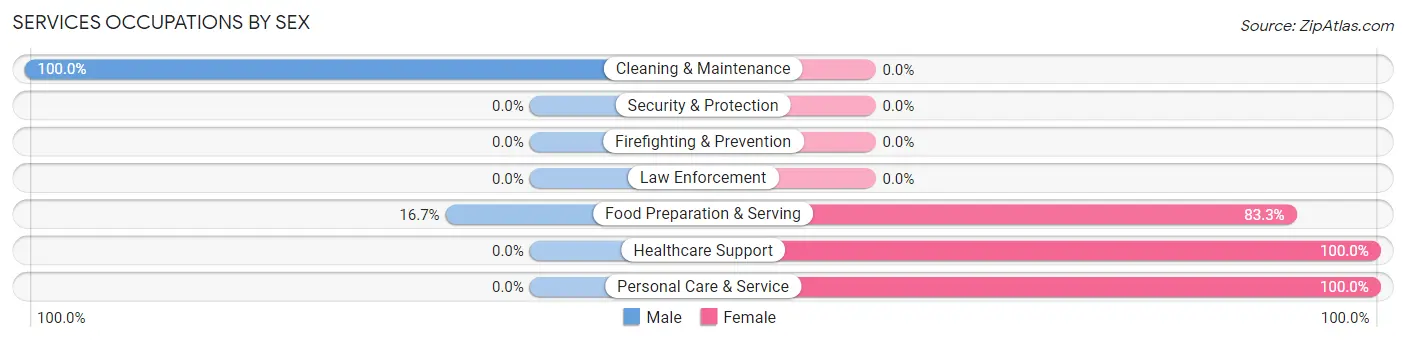
Services Occupations by Sex
Within the Services occupations in Standard, the most male-oriented occupations are Cleaning & Maintenance (100.0%), and Food Preparation & Serving (16.7%), while the most female-oriented occupations are Healthcare Support (100.0%), Personal Care & Service (100.0%), and Food Preparation & Serving (83.3%).
| Occupation | Male | Female |
| Healthcare Support | 0 (0.0%) | 7 (100.0%) |
| Security & Protection | 0 (0.0%) | 0 (0.0%) |
| Firefighting & Prevention | 0 (0.0%) | 0 (0.0%) |
| Law Enforcement | 0 (0.0%) | 0 (0.0%) |
| Food Preparation & Serving | 1 (16.7%) | 5 (83.3%) |
| Cleaning & Maintenance | 1 (100.0%) | 0 (0.0%) |
| Personal Care & Service | 0 (0.0%) | 2 (100.0%) |
| Total (Category) | 2 (12.5%) | 14 (87.5%) |
| Total (Overall) | 70 (51.5%) | 66 (48.5%) |
Sales and Office Occupations
The most common Sales and Office occupations in Standard are Office & Administration (20 | 14.7%), and Sales & Related (11 | 8.1%).
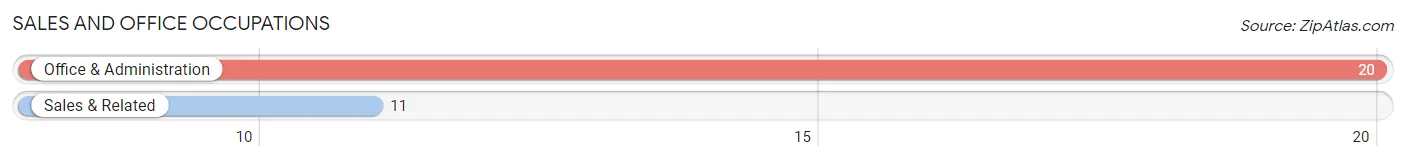
Sales and Office Occupations by Sex
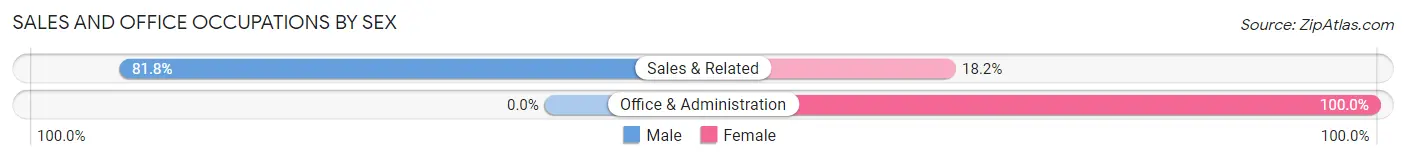
| Occupation | Male | Female |
| Sales & Related | 9 (81.8%) | 2 (18.2%) |
| Office & Administration | 0 (0.0%) | 20 (100.0%) |
| Total (Category) | 9 (29.0%) | 22 (71.0%) |
| Total (Overall) | 70 (51.5%) | 66 (48.5%) |
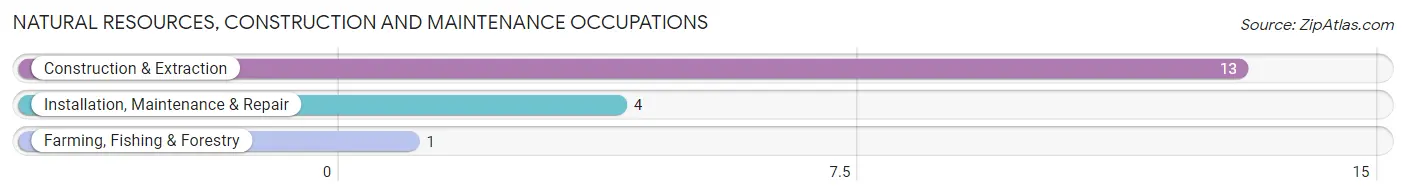
Natural Resources, Construction and Maintenance Occupations
The most common Natural Resources, Construction and Maintenance occupations in Standard are Construction & Extraction (13 | 9.6%), Installation, Maintenance & Repair (4 | 2.9%), and Farming, Fishing & Forestry (1 | 0.7%).
Natural Resources, Construction and Maintenance Occupations by Sex
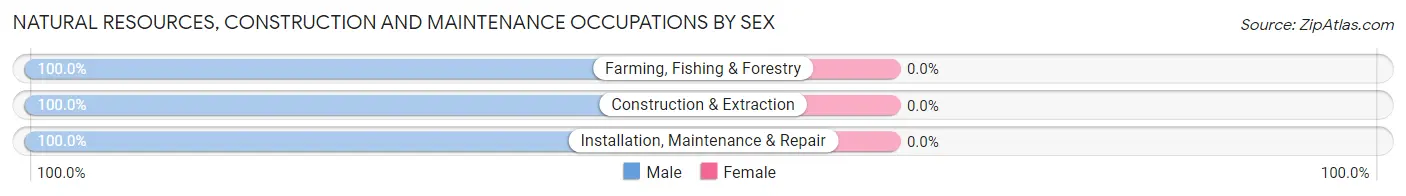
| Occupation | Male | Female |
| Farming, Fishing & Forestry | 1 (100.0%) | 0 (0.0%) |
| Construction & Extraction | 13 (100.0%) | 0 (0.0%) |
| Installation, Maintenance & Repair | 4 (100.0%) | 0 (0.0%) |
| Total (Category) | 18 (100.0%) | 0 (0.0%) |
| Total (Overall) | 70 (51.5%) | 66 (48.5%) |
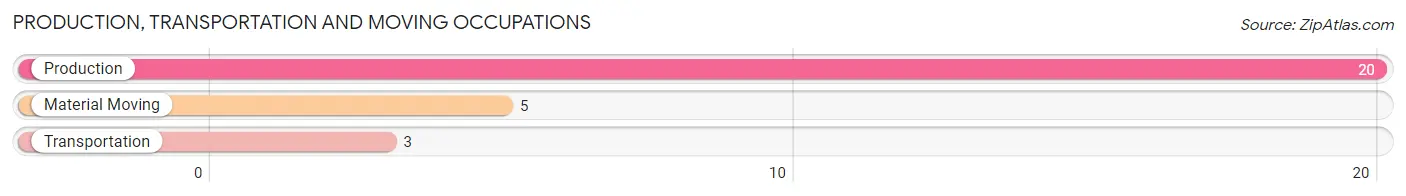
Production, Transportation and Moving Occupations
The most common Production, Transportation and Moving occupations in Standard are Production (20 | 14.7%), Material Moving (5 | 3.7%), and Transportation (3 | 2.2%).
Production, Transportation and Moving Occupations by Sex
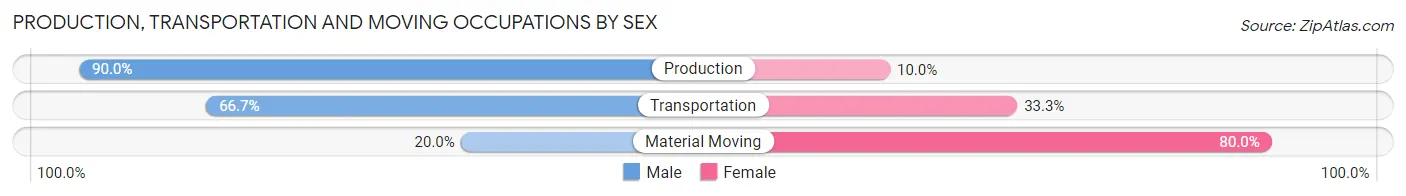
| Occupation | Male | Female |
| Production | 18 (90.0%) | 2 (10.0%) |
| Transportation | 2 (66.7%) | 1 (33.3%) |
| Material Moving | 1 (20.0%) | 4 (80.0%) |
| Total (Category) | 21 (75.0%) | 7 (25.0%) |
| Total (Overall) | 70 (51.5%) | 66 (48.5%) |
Employment Industries by Sex in Standard
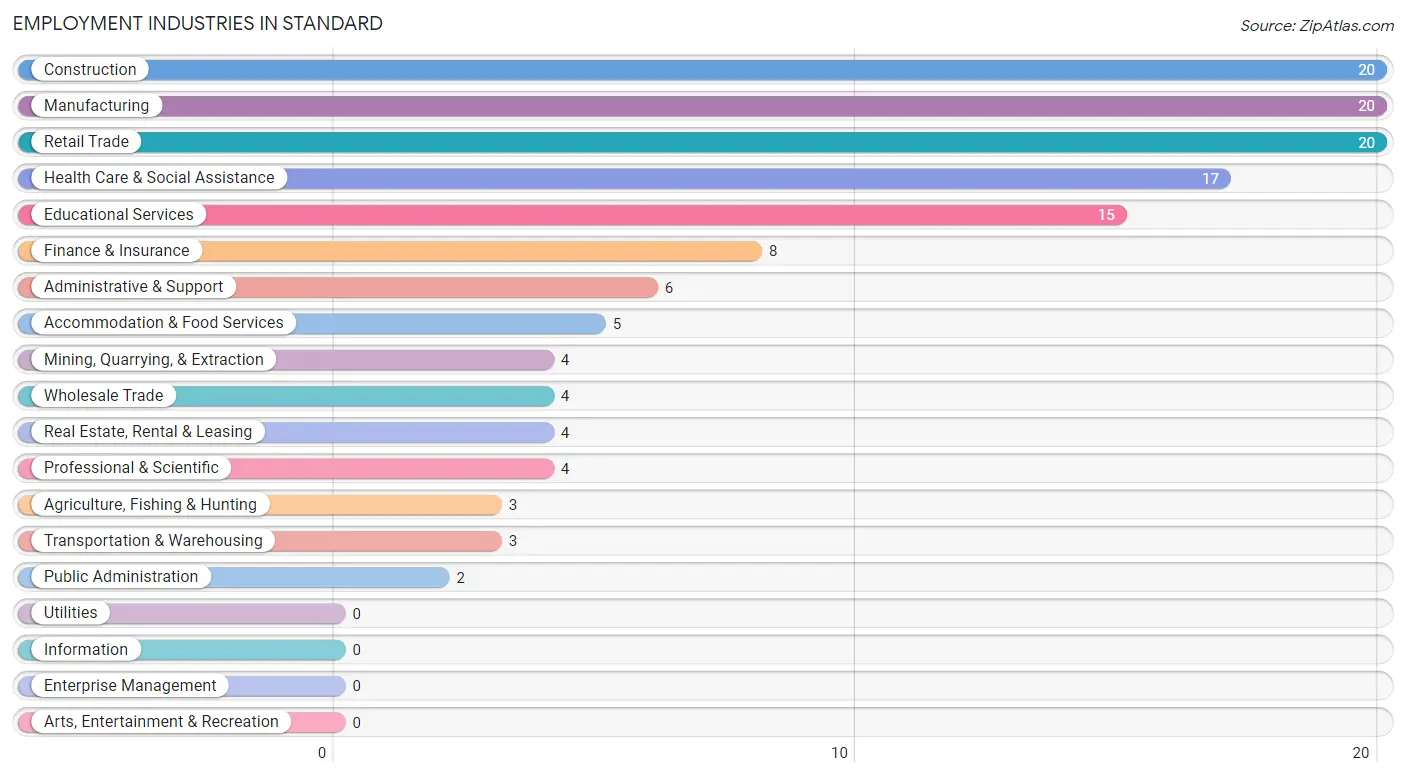
Employment Industries in Standard
The major employment industries in Standard include Construction (20 | 14.7%), Manufacturing (20 | 14.7%), Retail Trade (20 | 14.7%), Health Care & Social Assistance (17 | 12.5%), and Educational Services (15 | 11.0%).
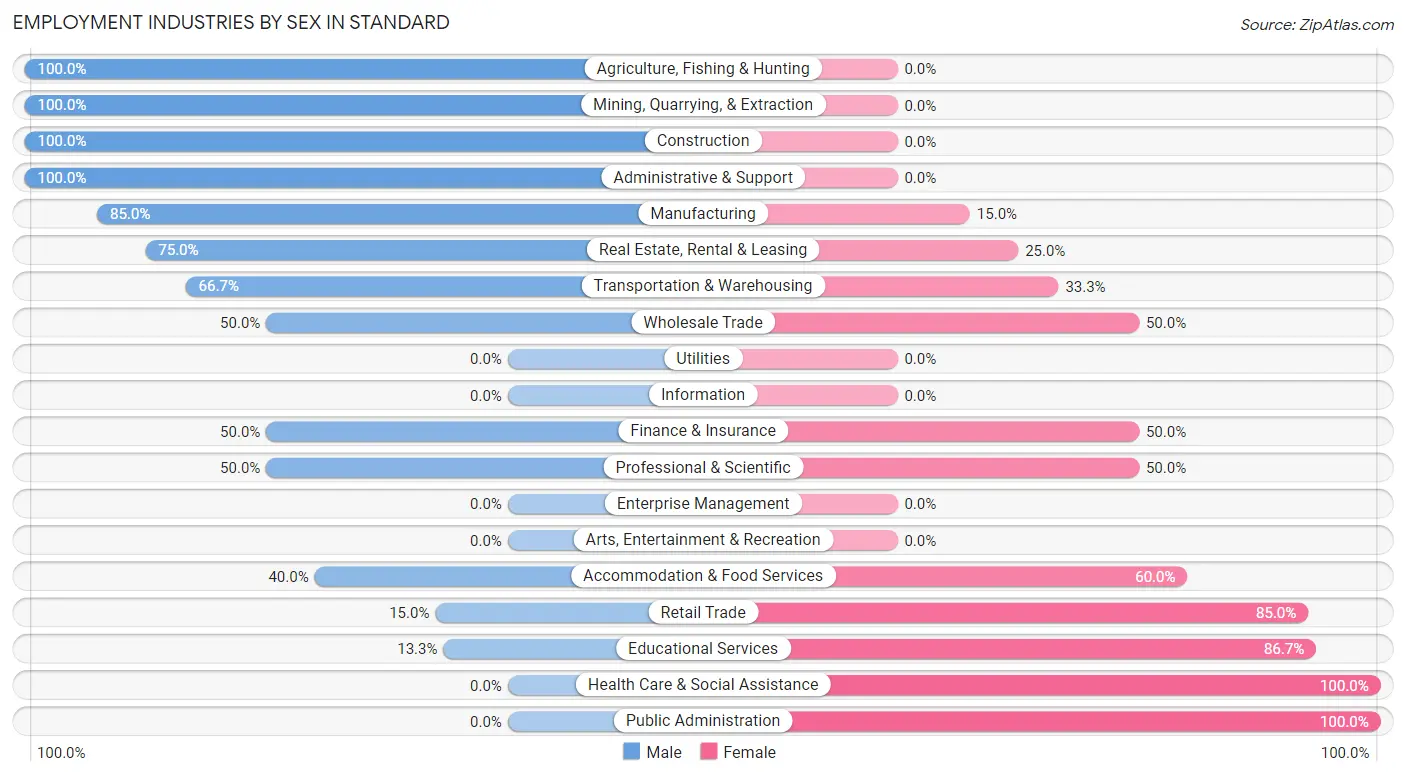
Employment Industries by Sex in Standard
The Standard industries that see more men than women are Agriculture, Fishing & Hunting (100.0%), Mining, Quarrying, & Extraction (100.0%), and Construction (100.0%), whereas the industries that tend to have a higher number of women are Health Care & Social Assistance (100.0%), Public Administration (100.0%), and Educational Services (86.7%).
| Industry | Male | Female |
| Agriculture, Fishing & Hunting | 3 (100.0%) | 0 (0.0%) |
| Mining, Quarrying, & Extraction | 4 (100.0%) | 0 (0.0%) |
| Construction | 20 (100.0%) | 0 (0.0%) |
| Manufacturing | 17 (85.0%) | 3 (15.0%) |
| Wholesale Trade | 2 (50.0%) | 2 (50.0%) |
| Retail Trade | 3 (15.0%) | 17 (85.0%) |
| Transportation & Warehousing | 2 (66.7%) | 1 (33.3%) |
| Utilities | 0 (0.0%) | 0 (0.0%) |
| Information | 0 (0.0%) | 0 (0.0%) |
| Finance & Insurance | 4 (50.0%) | 4 (50.0%) |
| Real Estate, Rental & Leasing | 3 (75.0%) | 1 (25.0%) |
| Professional & Scientific | 2 (50.0%) | 2 (50.0%) |
| Enterprise Management | 0 (0.0%) | 0 (0.0%) |
| Administrative & Support | 6 (100.0%) | 0 (0.0%) |
| Educational Services | 2 (13.3%) | 13 (86.7%) |
| Health Care & Social Assistance | 0 (0.0%) | 17 (100.0%) |
| Arts, Entertainment & Recreation | 0 (0.0%) | 0 (0.0%) |
| Accommodation & Food Services | 2 (40.0%) | 3 (60.0%) |
| Public Administration | 0 (0.0%) | 2 (100.0%) |
| Total | 70 (51.5%) | 66 (48.5%) |
Education in Standard
School Enrollment in Standard
The most common levels of schooling among the 56 students in Standard are nursery / preschool (19 | 33.9%), high school (11 | 19.6%), and middle school (10 | 17.9%).
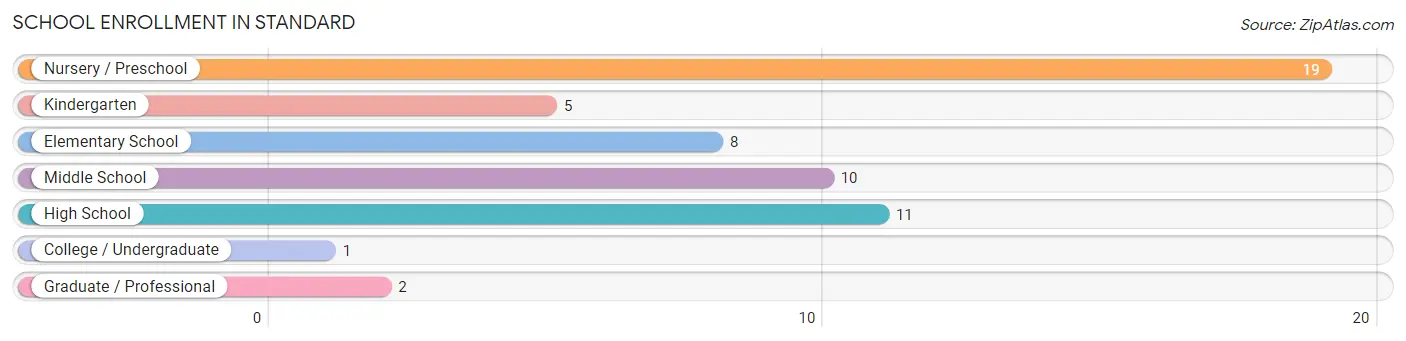
| School Level | # Students | % Students |
| Nursery / Preschool | 19 | 33.9% |
| Kindergarten | 5 | 8.9% |
| Elementary School | 8 | 14.3% |
| Middle School | 10 | 17.9% |
| High School | 11 | 19.6% |
| College / Undergraduate | 1 | 1.8% |
| Graduate / Professional | 2 | 3.6% |
| Total | 56 | 100.0% |
School Enrollment by Age by Funding Source in Standard
Out of a total of 56 students who are enrolled in schools in Standard, 2 (3.6%) attend a private institution, while the remaining 54 (96.4%) are enrolled in public schools. The age group of 5 to 9 year old has the highest likelihood of being enrolled in private schools, with 1 (8.3% in the age bracket) enrolled. Conversely, the age group of 3 to 4 year olds has the lowest likelihood of being enrolled in a private school, with 19 (100.0% in the age bracket) attending a public institution.
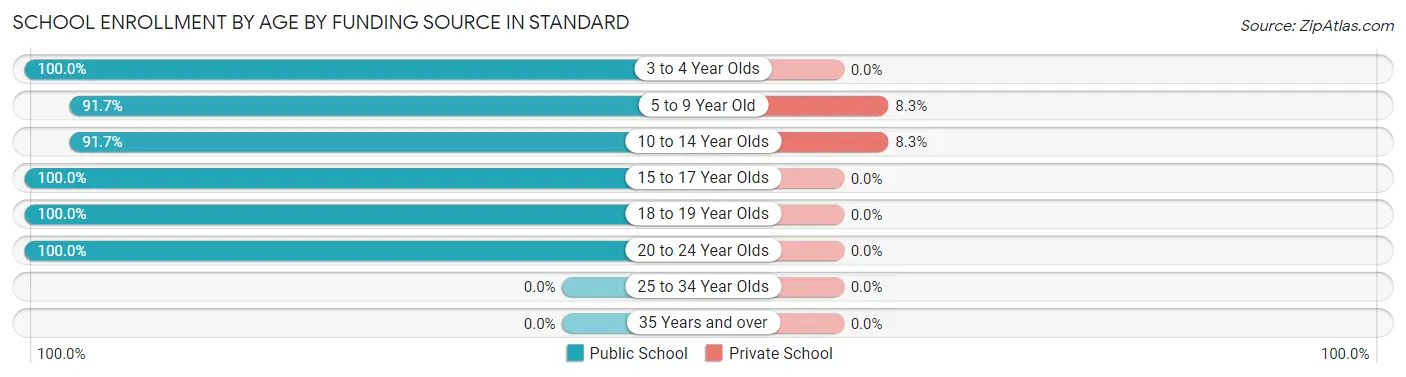
| Age Bracket | Public School | Private School |
| 3 to 4 Year Olds | 19 (100.0%) | 0 (0.0%) |
| 5 to 9 Year Old | 11 (91.7%) | 1 (8.3%) |
| 10 to 14 Year Olds | 11 (91.7%) | 1 (8.3%) |
| 15 to 17 Year Olds | 10 (100.0%) | 0 (0.0%) |
| 18 to 19 Year Olds | 1 (100.0%) | 0 (0.0%) |
| 20 to 24 Year Olds | 2 (100.0%) | 0 (0.0%) |
| 25 to 34 Year Olds | 0 (0.0%) | 0 (0.0%) |
| 35 Years and over | 0 (0.0%) | 0 (0.0%) |
| Total | 54 (96.4%) | 2 (3.6%) |
Educational Attainment by Field of Study in Standard
Science & technology (13 | 36.1%), bio, nature & agricultural (6 | 16.7%), business (6 | 16.7%), engineering (5 | 13.9%), and literature & languages (4 | 11.1%) are the most common fields of study among 36 individuals in Standard who have obtained a bachelor's degree or higher.
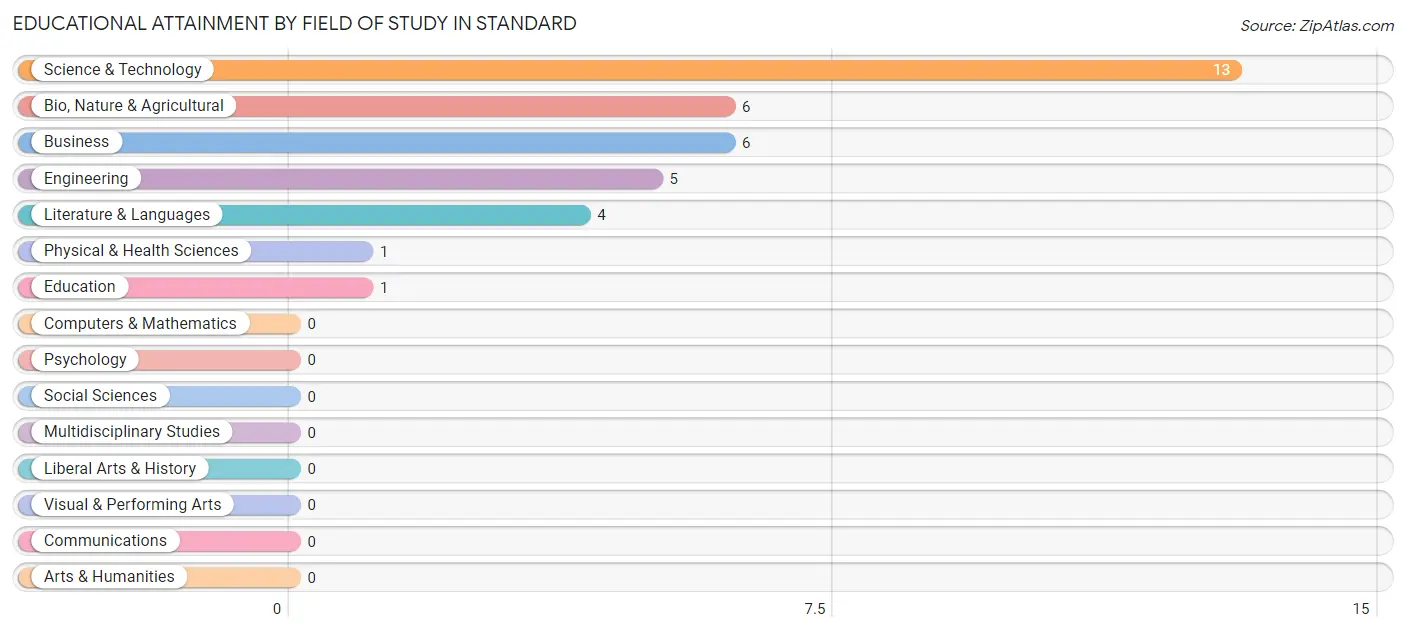
| Field of Study | # Graduates | % Graduates |
| Computers & Mathematics | 0 | 0.0% |
| Bio, Nature & Agricultural | 6 | 16.7% |
| Physical & Health Sciences | 1 | 2.8% |
| Psychology | 0 | 0.0% |
| Social Sciences | 0 | 0.0% |
| Engineering | 5 | 13.9% |
| Multidisciplinary Studies | 0 | 0.0% |
| Science & Technology | 13 | 36.1% |
| Business | 6 | 16.7% |
| Education | 1 | 2.8% |
| Literature & Languages | 4 | 11.1% |
| Liberal Arts & History | 0 | 0.0% |
| Visual & Performing Arts | 0 | 0.0% |
| Communications | 0 | 0.0% |
| Arts & Humanities | 0 | 0.0% |
| Total | 36 | 100.0% |
Transportation & Commute in Standard
Vehicle Availability by Sex in Standard
The most prevalent vehicle ownership categories in Standard are males with 2 vehicles (25, accounting for 35.7%) and females with 2 vehicles (21, making up 37.9%).
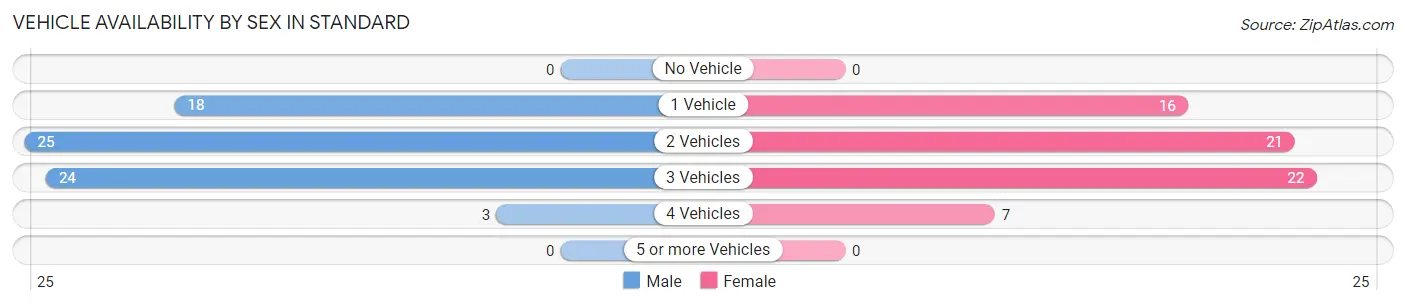
| Vehicles Available | Male | Female |
| No Vehicle | 0 (0.0%) | 0 (0.0%) |
| 1 Vehicle | 18 (25.7%) | 16 (24.2%) |
| 2 Vehicles | 25 (35.7%) | 21 (31.8%) |
| 3 Vehicles | 24 (34.3%) | 22 (33.3%) |
| 4 Vehicles | 3 (4.3%) | 7 (10.6%) |
| 5 or more Vehicles | 0 (0.0%) | 0 (0.0%) |
| Total | 70 (100.0%) | 66 (100.0%) |
Commute Time in Standard
The most frequently occuring commute durations in Standard are 15 to 19 minutes (35 commuters, 27.8%), 20 to 24 minutes (21 commuters, 16.7%), and 25 to 29 minutes (15 commuters, 11.9%).
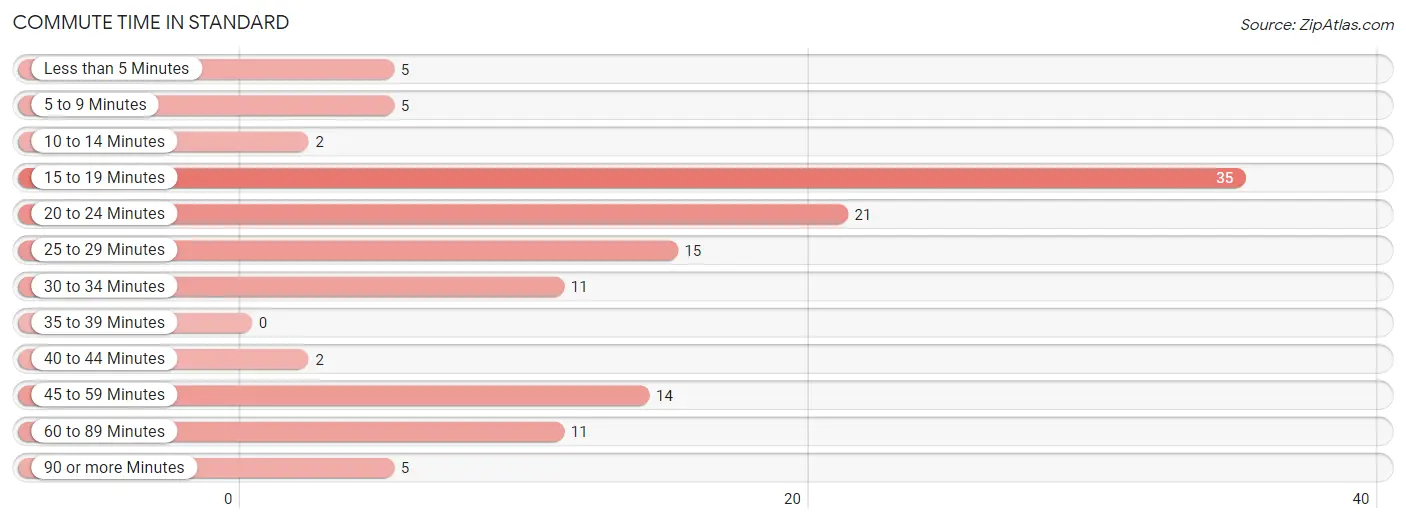
| Commute Time | # Commuters | % Commuters |
| Less than 5 Minutes | 5 | 4.0% |
| 5 to 9 Minutes | 5 | 4.0% |
| 10 to 14 Minutes | 2 | 1.6% |
| 15 to 19 Minutes | 35 | 27.8% |
| 20 to 24 Minutes | 21 | 16.7% |
| 25 to 29 Minutes | 15 | 11.9% |
| 30 to 34 Minutes | 11 | 8.7% |
| 35 to 39 Minutes | 0 | 0.0% |
| 40 to 44 Minutes | 2 | 1.6% |
| 45 to 59 Minutes | 14 | 11.1% |
| 60 to 89 Minutes | 11 | 8.7% |
| 90 or more Minutes | 5 | 4.0% |
Commute Time by Sex in Standard
The most common commute times in Standard are 15 to 19 minutes (26 commuters, 41.3%) for males and 20 to 24 minutes (14 commuters, 22.2%) for females.
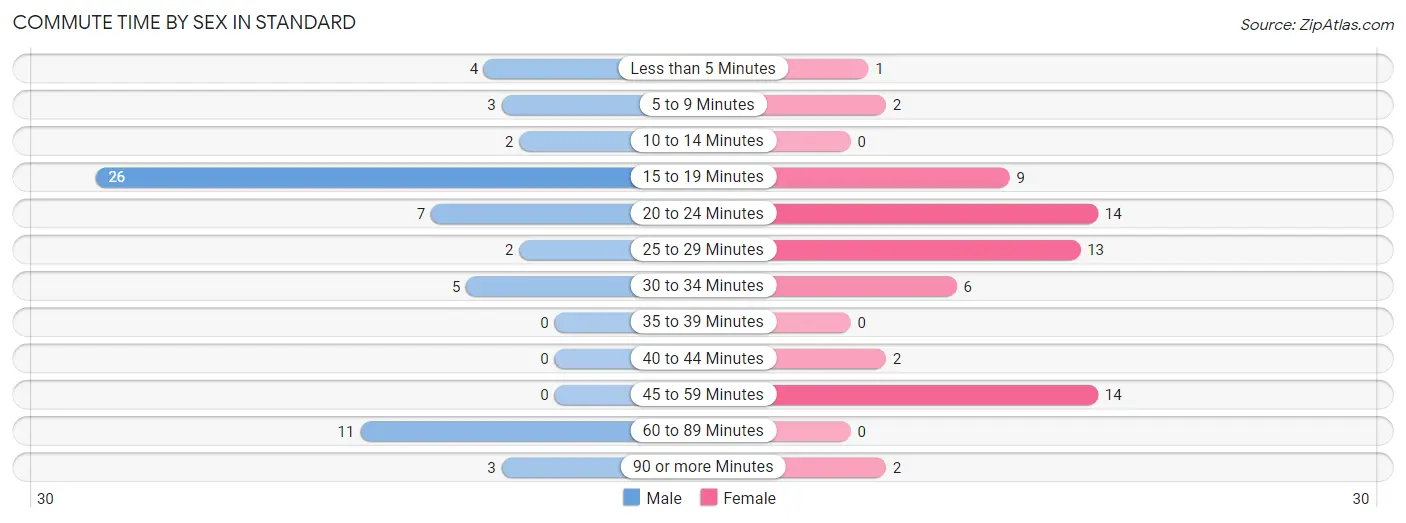
| Commute Time | Male | Female |
| Less than 5 Minutes | 4 (6.4%) | 1 (1.6%) |
| 5 to 9 Minutes | 3 (4.8%) | 2 (3.2%) |
| 10 to 14 Minutes | 2 (3.2%) | 0 (0.0%) |
| 15 to 19 Minutes | 26 (41.3%) | 9 (14.3%) |
| 20 to 24 Minutes | 7 (11.1%) | 14 (22.2%) |
| 25 to 29 Minutes | 2 (3.2%) | 13 (20.6%) |
| 30 to 34 Minutes | 5 (7.9%) | 6 (9.5%) |
| 35 to 39 Minutes | 0 (0.0%) | 0 (0.0%) |
| 40 to 44 Minutes | 0 (0.0%) | 2 (3.2%) |
| 45 to 59 Minutes | 0 (0.0%) | 14 (22.2%) |
| 60 to 89 Minutes | 11 (17.5%) | 0 (0.0%) |
| 90 or more Minutes | 3 (4.8%) | 2 (3.2%) |
Time of Departure to Work by Sex in Standard
The most frequent times of departure to work in Standard are 5:30 AM to 5:59 AM (15, 23.8%) for males and 7:00 AM to 7:29 AM (26, 41.3%) for females.
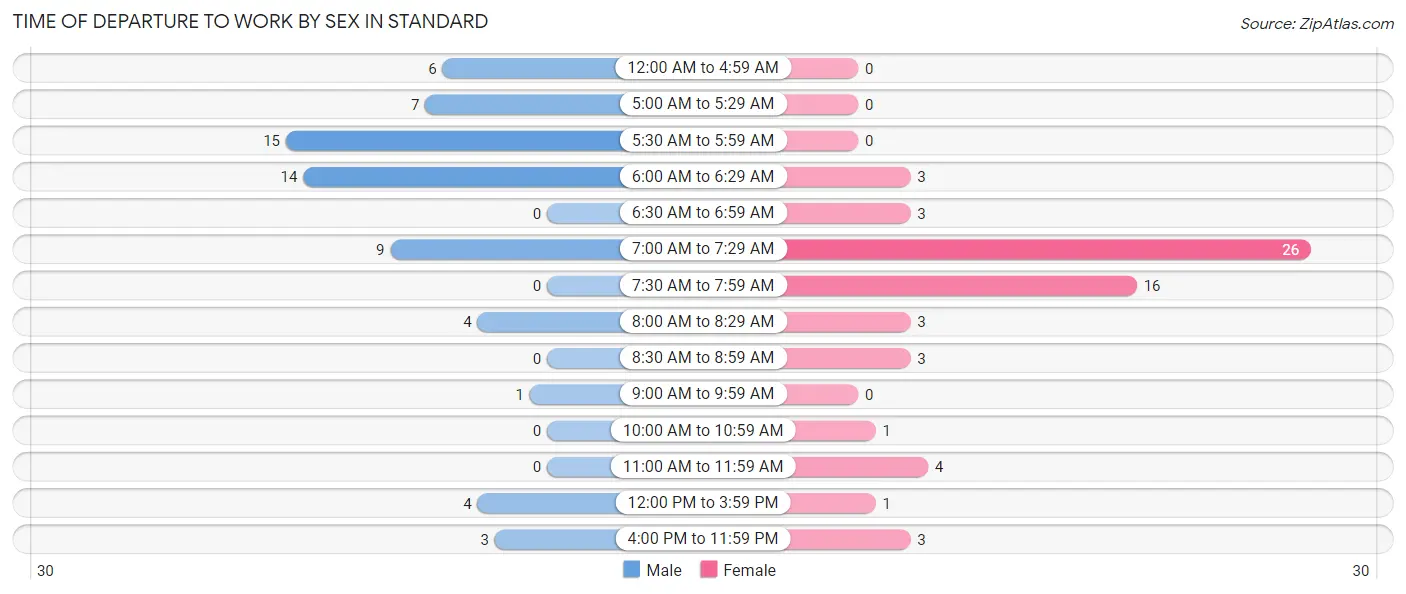
| Time of Departure | Male | Female |
| 12:00 AM to 4:59 AM | 6 (9.5%) | 0 (0.0%) |
| 5:00 AM to 5:29 AM | 7 (11.1%) | 0 (0.0%) |
| 5:30 AM to 5:59 AM | 15 (23.8%) | 0 (0.0%) |
| 6:00 AM to 6:29 AM | 14 (22.2%) | 3 (4.8%) |
| 6:30 AM to 6:59 AM | 0 (0.0%) | 3 (4.8%) |
| 7:00 AM to 7:29 AM | 9 (14.3%) | 26 (41.3%) |
| 7:30 AM to 7:59 AM | 0 (0.0%) | 16 (25.4%) |
| 8:00 AM to 8:29 AM | 4 (6.4%) | 3 (4.8%) |
| 8:30 AM to 8:59 AM | 0 (0.0%) | 3 (4.8%) |
| 9:00 AM to 9:59 AM | 1 (1.6%) | 0 (0.0%) |
| 10:00 AM to 10:59 AM | 0 (0.0%) | 1 (1.6%) |
| 11:00 AM to 11:59 AM | 0 (0.0%) | 4 (6.4%) |
| 12:00 PM to 3:59 PM | 4 (6.4%) | 1 (1.6%) |
| 4:00 PM to 11:59 PM | 3 (4.8%) | 3 (4.8%) |
| Total | 63 (100.0%) | 63 (100.0%) |
Housing Occupancy in Standard
Occupancy by Ownership in Standard
Of the total 153 dwellings in Standard, owner-occupied units account for 126 (82.4%), while renter-occupied units make up 27 (17.6%).
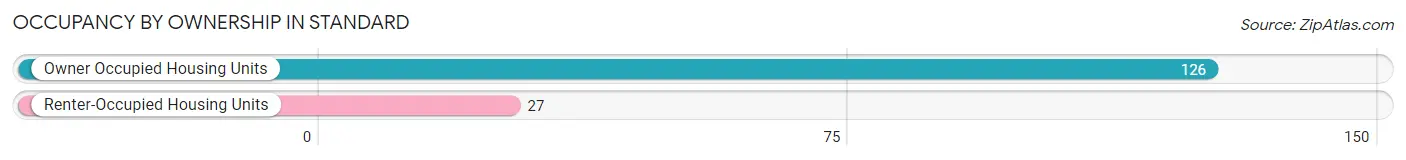
| Occupancy | # Housing Units | % Housing Units |
| Owner Occupied Housing Units | 126 | 82.4% |
| Renter-Occupied Housing Units | 27 | 17.6% |
| Total Occupied Housing Units | 153 | 100.0% |
Occupancy by Household Size in Standard
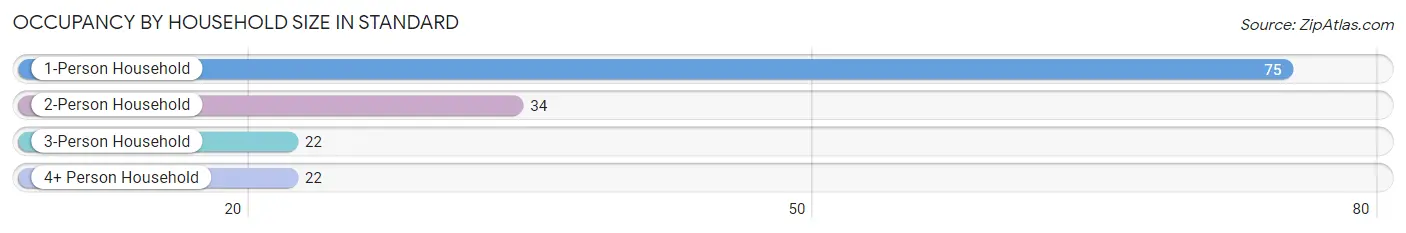
| Household Size | # Housing Units | % Housing Units |
| 1-Person Household | 75 | 49.0% |
| 2-Person Household | 34 | 22.2% |
| 3-Person Household | 22 | 14.4% |
| 4+ Person Household | 22 | 14.4% |
| Total Housing Units | 153 | 100.0% |
Occupancy by Ownership by Household Size in Standard
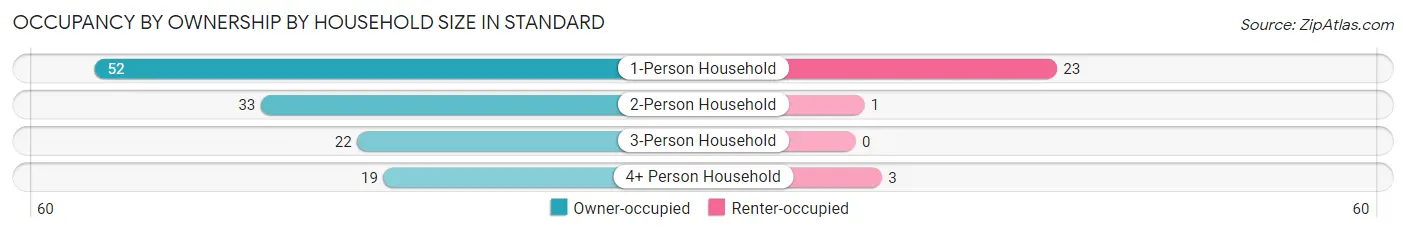
| Household Size | Owner-occupied | Renter-occupied |
| 1-Person Household | 52 (69.3%) | 23 (30.7%) |
| 2-Person Household | 33 (97.1%) | 1 (2.9%) |
| 3-Person Household | 22 (100.0%) | 0 (0.0%) |
| 4+ Person Household | 19 (86.4%) | 3 (13.6%) |
| Total Housing Units | 126 (82.4%) | 27 (17.6%) |
Occupancy by Educational Attainment in Standard
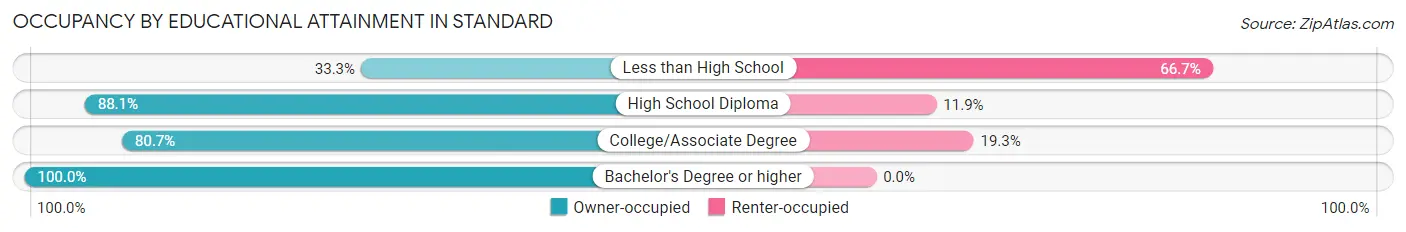
| Household Size | Owner-occupied | Renter-occupied |
| Less than High School | 4 (33.3%) | 8 (66.7%) |
| High School Diploma | 59 (88.1%) | 8 (11.9%) |
| College/Associate Degree | 46 (80.7%) | 11 (19.3%) |
| Bachelor's Degree or higher | 17 (100.0%) | 0 (0.0%) |
Occupancy by Age of Householder in Standard
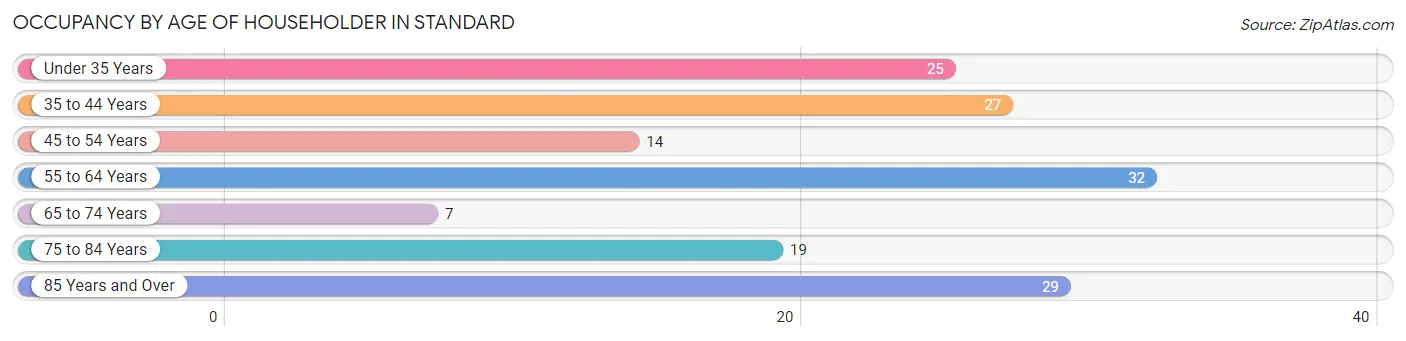
| Age Bracket | # Households | % Households |
| Under 35 Years | 25 | 16.3% |
| 35 to 44 Years | 27 | 17.6% |
| 45 to 54 Years | 14 | 9.1% |
| 55 to 64 Years | 32 | 20.9% |
| 65 to 74 Years | 7 | 4.6% |
| 75 to 84 Years | 19 | 12.4% |
| 85 Years and Over | 29 | 19.0% |
| Total | 153 | 100.0% |
Housing Finances in Standard
Median Income by Occupancy in Standard
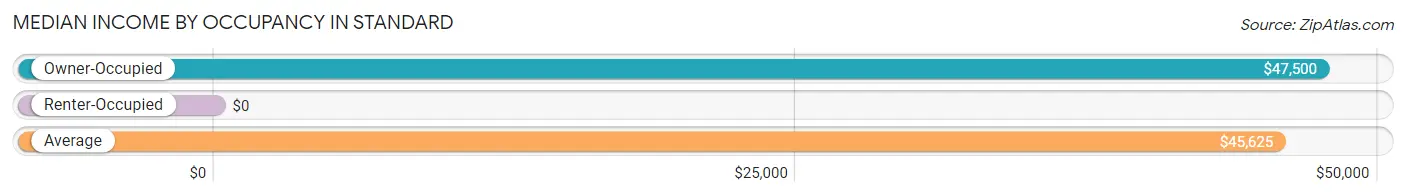
| Occupancy Type | # Households | Median Income |
| Owner-Occupied | 126 (82.4%) | $47,500 |
| Renter-Occupied | 27 (17.6%) | $0 |
| Average | 153 (100.0%) | $45,625 |
Occupancy by Householder Income Bracket in Standard
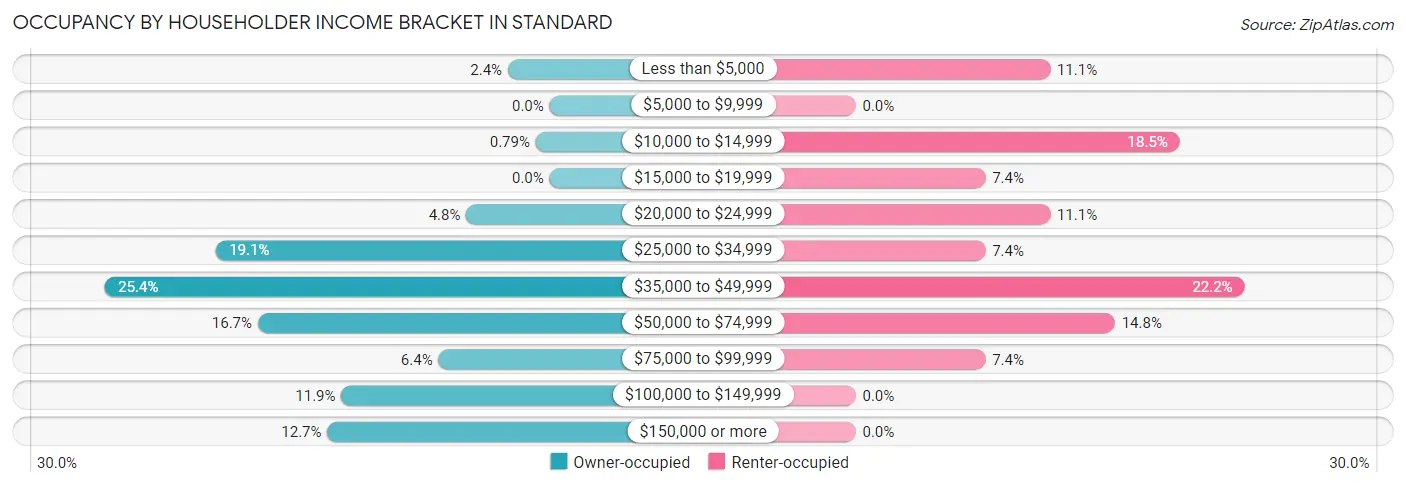
| Income Bracket | Owner-occupied | Renter-occupied |
| Less than $5,000 | 3 (2.4%) | 3 (11.1%) |
| $5,000 to $9,999 | 0 (0.0%) | 0 (0.0%) |
| $10,000 to $14,999 | 1 (0.8%) | 5 (18.5%) |
| $15,000 to $19,999 | 0 (0.0%) | 2 (7.4%) |
| $20,000 to $24,999 | 6 (4.8%) | 3 (11.1%) |
| $25,000 to $34,999 | 24 (19.1%) | 2 (7.4%) |
| $35,000 to $49,999 | 32 (25.4%) | 6 (22.2%) |
| $50,000 to $74,999 | 21 (16.7%) | 4 (14.8%) |
| $75,000 to $99,999 | 8 (6.4%) | 2 (7.4%) |
| $100,000 to $149,999 | 15 (11.9%) | 0 (0.0%) |
| $150,000 or more | 16 (12.7%) | 0 (0.0%) |
| Total | 126 (100.0%) | 27 (100.0%) |
Monthly Housing Cost Tiers in Standard
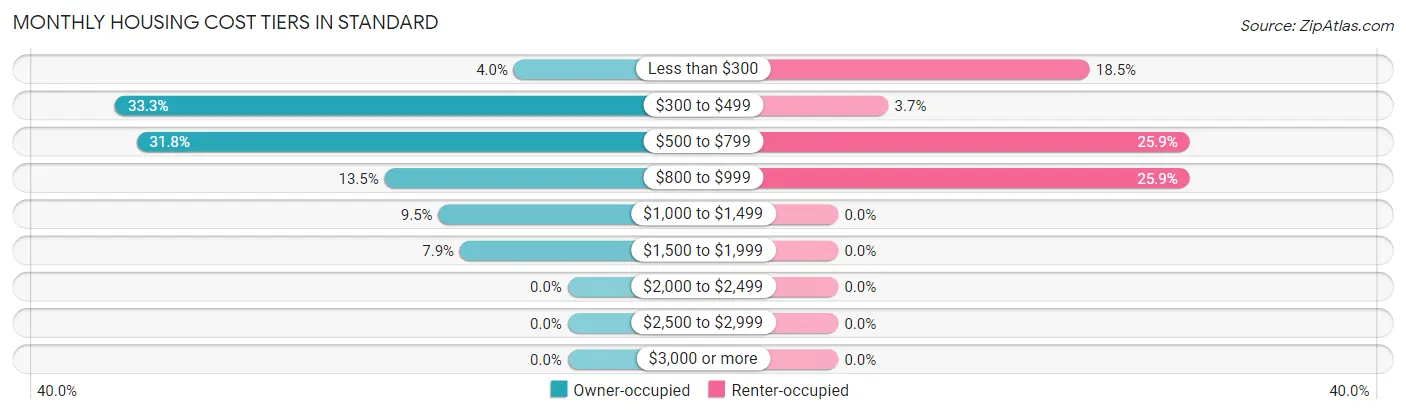
| Monthly Cost | Owner-occupied | Renter-occupied |
| Less than $300 | 5 (4.0%) | 5 (18.5%) |
| $300 to $499 | 42 (33.3%) | 1 (3.7%) |
| $500 to $799 | 40 (31.8%) | 7 (25.9%) |
| $800 to $999 | 17 (13.5%) | 7 (25.9%) |
| $1,000 to $1,499 | 12 (9.5%) | 0 (0.0%) |
| $1,500 to $1,999 | 10 (7.9%) | 0 (0.0%) |
| $2,000 to $2,499 | 0 (0.0%) | 0 (0.0%) |
| $2,500 to $2,999 | 0 (0.0%) | 0 (0.0%) |
| $3,000 or more | 0 (0.0%) | 0 (0.0%) |
| Total | 126 (100.0%) | 27 (100.0%) |
Physical Housing Characteristics in Standard
Housing Structures in Standard
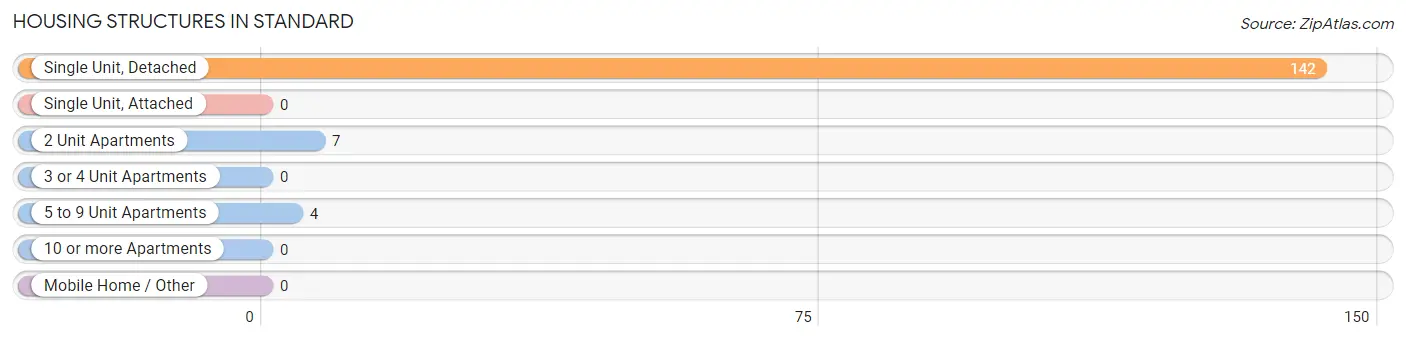
| Structure Type | # Housing Units | % Housing Units |
| Single Unit, Detached | 142 | 92.8% |
| Single Unit, Attached | 0 | 0.0% |
| 2 Unit Apartments | 7 | 4.6% |
| 3 or 4 Unit Apartments | 0 | 0.0% |
| 5 to 9 Unit Apartments | 4 | 2.6% |
| 10 or more Apartments | 0 | 0.0% |
| Mobile Home / Other | 0 | 0.0% |
| Total | 153 | 100.0% |
Housing Structures by Occupancy in Standard
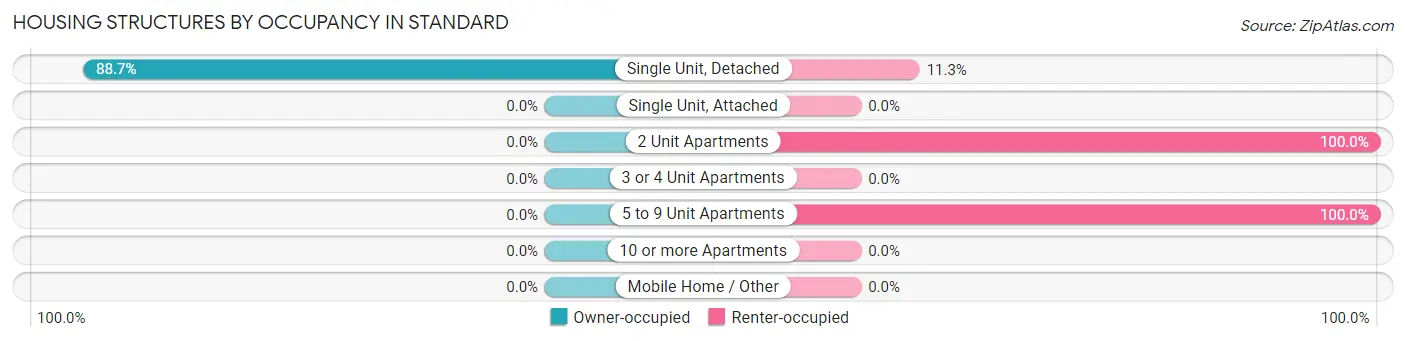
| Structure Type | Owner-occupied | Renter-occupied |
| Single Unit, Detached | 126 (88.7%) | 16 (11.3%) |
| Single Unit, Attached | 0 (0.0%) | 0 (0.0%) |
| 2 Unit Apartments | 0 (0.0%) | 7 (100.0%) |
| 3 or 4 Unit Apartments | 0 (0.0%) | 0 (0.0%) |
| 5 to 9 Unit Apartments | 0 (0.0%) | 4 (100.0%) |
| 10 or more Apartments | 0 (0.0%) | 0 (0.0%) |
| Mobile Home / Other | 0 (0.0%) | 0 (0.0%) |
| Total | 126 (82.4%) | 27 (17.6%) |
Housing Structures by Number of Rooms in Standard
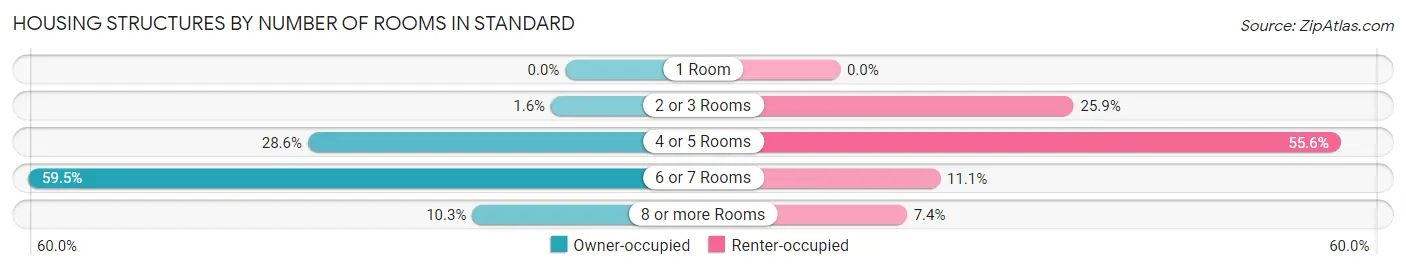
| Number of Rooms | Owner-occupied | Renter-occupied |
| 1 Room | 0 (0.0%) | 0 (0.0%) |
| 2 or 3 Rooms | 2 (1.6%) | 7 (25.9%) |
| 4 or 5 Rooms | 36 (28.6%) | 15 (55.6%) |
| 6 or 7 Rooms | 75 (59.5%) | 3 (11.1%) |
| 8 or more Rooms | 13 (10.3%) | 2 (7.4%) |
| Total | 126 (100.0%) | 27 (100.0%) |
Housing Structure by Heating Type in Standard
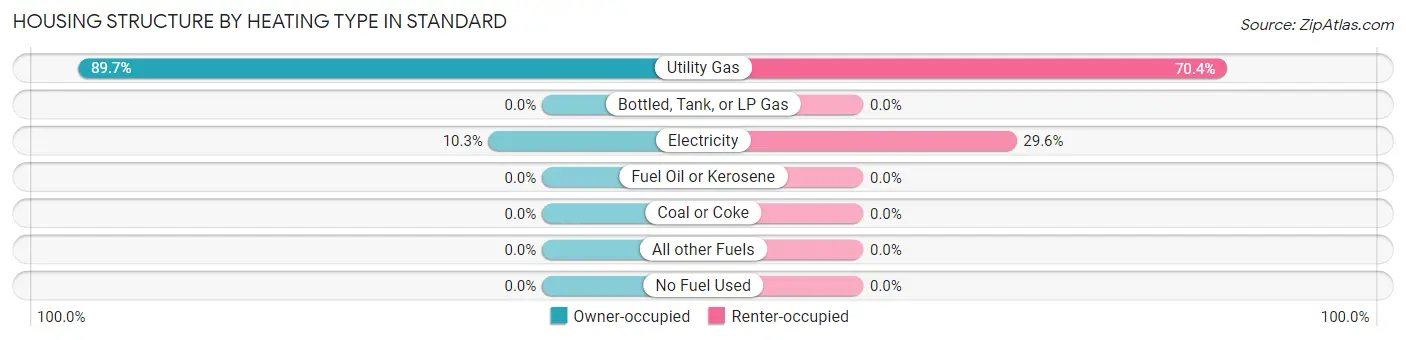
| Heating Type | Owner-occupied | Renter-occupied |
| Utility Gas | 113 (89.7%) | 19 (70.4%) |
| Bottled, Tank, or LP Gas | 0 (0.0%) | 0 (0.0%) |
| Electricity | 13 (10.3%) | 8 (29.6%) |
| Fuel Oil or Kerosene | 0 (0.0%) | 0 (0.0%) |
| Coal or Coke | 0 (0.0%) | 0 (0.0%) |
| All other Fuels | 0 (0.0%) | 0 (0.0%) |
| No Fuel Used | 0 (0.0%) | 0 (0.0%) |
| Total | 126 (100.0%) | 27 (100.0%) |
Household Vehicle Usage in Standard
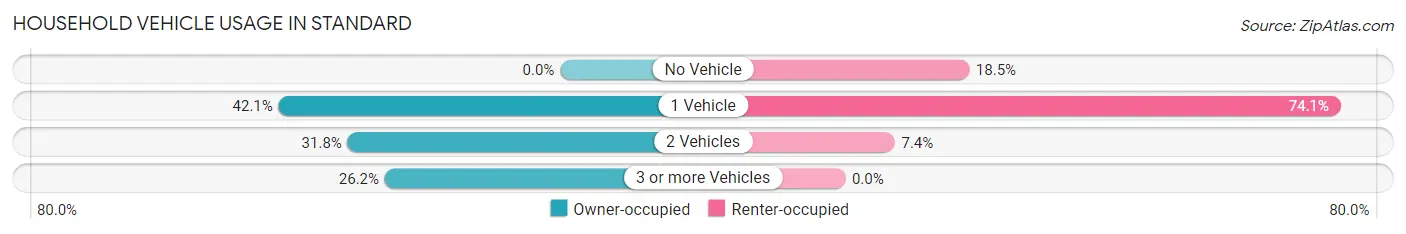
| Vehicles per Household | Owner-occupied | Renter-occupied |
| No Vehicle | 0 (0.0%) | 5 (18.5%) |
| 1 Vehicle | 53 (42.1%) | 20 (74.1%) |
| 2 Vehicles | 40 (31.8%) | 2 (7.4%) |
| 3 or more Vehicles | 33 (26.2%) | 0 (0.0%) |
| Total | 126 (100.0%) | 27 (100.0%) |
Real Estate & Mortgages in Standard
Real Estate and Mortgage Overview in Standard
| Characteristic | Without Mortgage | With Mortgage |
| Housing Units | 81 | 45 |
| Median Property Value | $102,700 | $97,500 |
| Median Household Income | $46,458 | $2 |
| Monthly Housing Costs | $482 | $0 |
| Real Estate Taxes | $1,383 | $1 |
Property Value by Mortgage Status in Standard
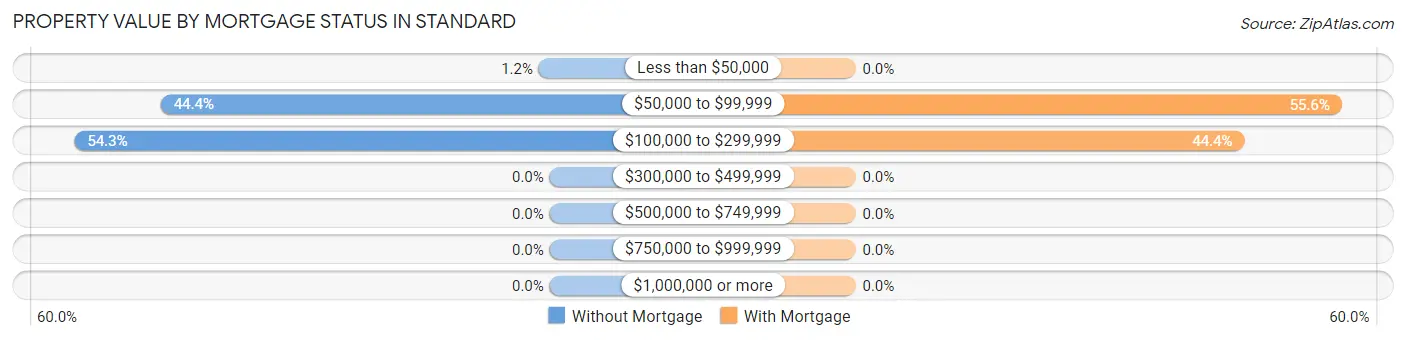
| Property Value | Without Mortgage | With Mortgage |
| Less than $50,000 | 1 (1.2%) | 0 (0.0%) |
| $50,000 to $99,999 | 36 (44.4%) | 25 (55.6%) |
| $100,000 to $299,999 | 44 (54.3%) | 20 (44.4%) |
| $300,000 to $499,999 | 0 (0.0%) | 0 (0.0%) |
| $500,000 to $749,999 | 0 (0.0%) | 0 (0.0%) |
| $750,000 to $999,999 | 0 (0.0%) | 0 (0.0%) |
| $1,000,000 or more | 0 (0.0%) | 0 (0.0%) |
| Total | 81 (100.0%) | 45 (100.0%) |
Household Income by Mortgage Status in Standard
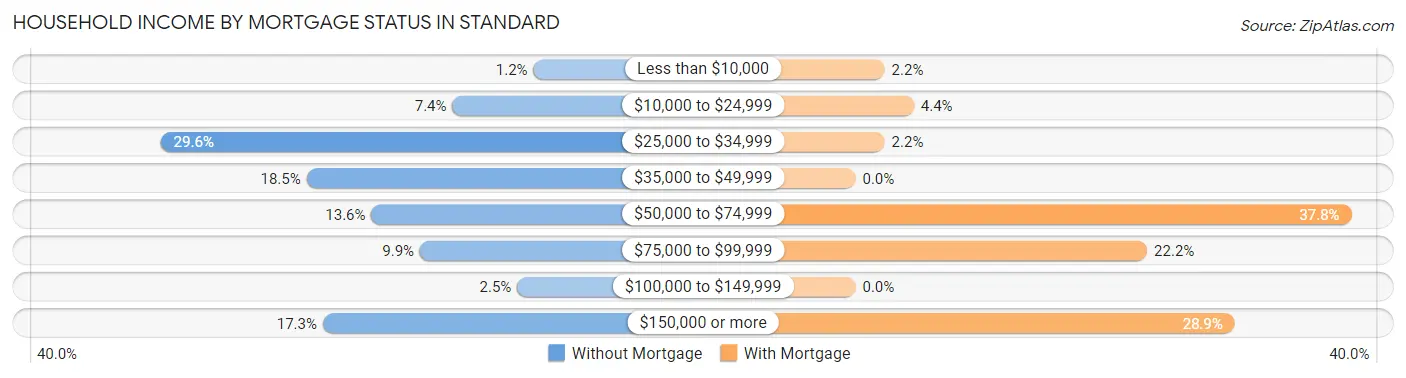
| Household Income | Without Mortgage | With Mortgage |
| Less than $10,000 | 1 (1.2%) | 1 (2.2%) |
| $10,000 to $24,999 | 6 (7.4%) | 2 (4.4%) |
| $25,000 to $34,999 | 24 (29.6%) | 1 (2.2%) |
| $35,000 to $49,999 | 15 (18.5%) | 0 (0.0%) |
| $50,000 to $74,999 | 11 (13.6%) | 17 (37.8%) |
| $75,000 to $99,999 | 8 (9.9%) | 10 (22.2%) |
| $100,000 to $149,999 | 2 (2.5%) | 0 (0.0%) |
| $150,000 or more | 14 (17.3%) | 13 (28.9%) |
| Total | 81 (100.0%) | 45 (100.0%) |
Property Value to Household Income Ratio in Standard
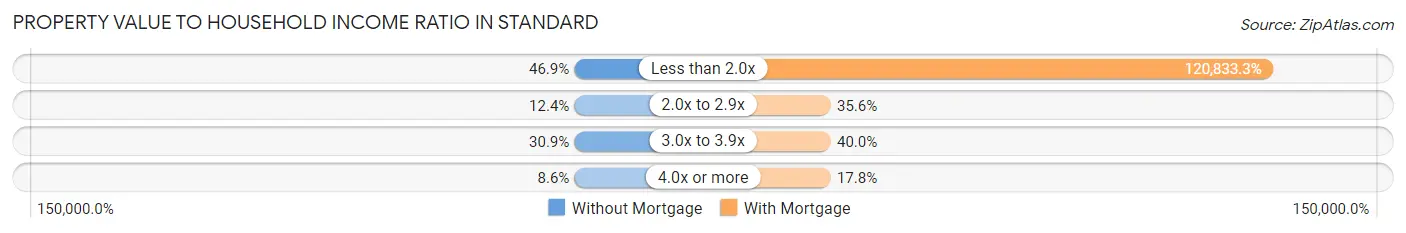
| Value-to-Income Ratio | Without Mortgage | With Mortgage |
| Less than 2.0x | 38 (46.9%) | 54,375 (120,833.3%) |
| 2.0x to 2.9x | 10 (12.3%) | 16 (35.6%) |
| 3.0x to 3.9x | 25 (30.9%) | 18 (40.0%) |
| 4.0x or more | 7 (8.6%) | 8 (17.8%) |
| Total | 81 (100.0%) | 45 (100.0%) |
Real Estate Taxes by Mortgage Status in Standard
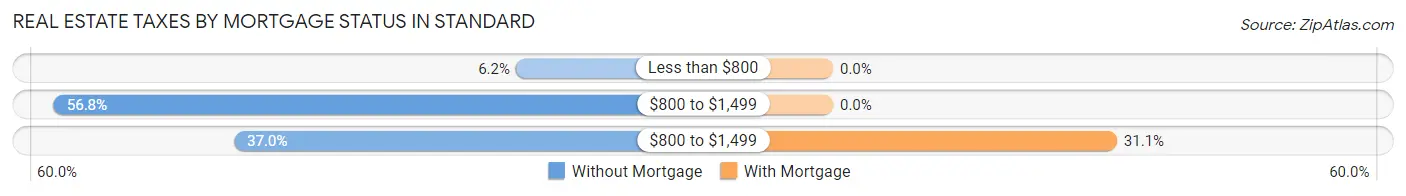
| Property Taxes | Without Mortgage | With Mortgage |
| Less than $800 | 5 (6.2%) | 0 (0.0%) |
| $800 to $1,499 | 46 (56.8%) | 0 (0.0%) |
| $800 to $1,499 | 30 (37.0%) | 14 (31.1%) |
| Total | 81 (100.0%) | 45 (100.0%) |
Health & Disability in Standard
Health Insurance Coverage by Age in Standard
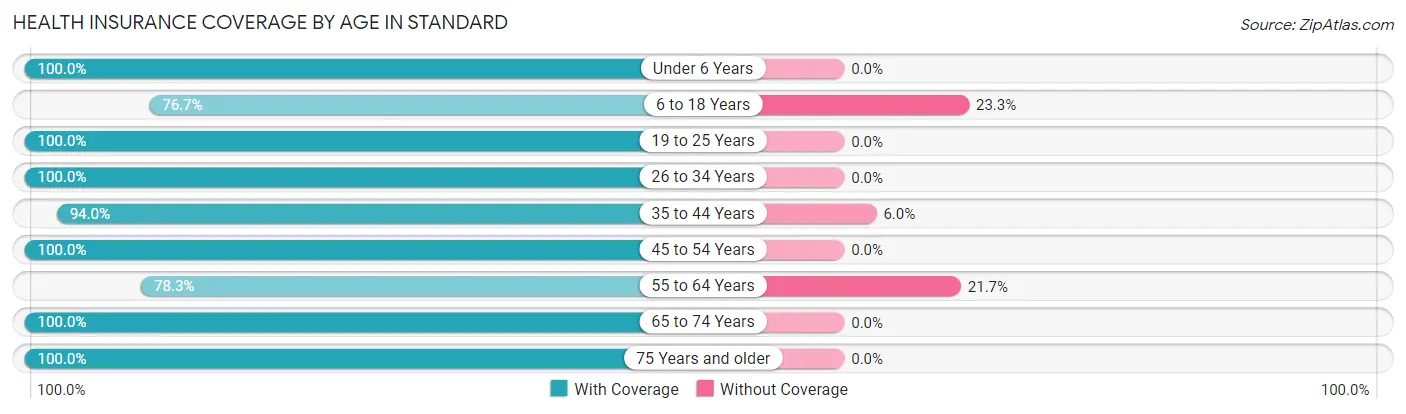
| Age Bracket | With Coverage | Without Coverage |
| Under 6 Years | 27 (100.0%) | 0 (0.0%) |
| 6 to 18 Years | 33 (76.7%) | 10 (23.3%) |
| 19 to 25 Years | 19 (100.0%) | 0 (0.0%) |
| 26 to 34 Years | 20 (100.0%) | 0 (0.0%) |
| 35 to 44 Years | 47 (94.0%) | 3 (6.0%) |
| 45 to 54 Years | 29 (100.0%) | 0 (0.0%) |
| 55 to 64 Years | 36 (78.3%) | 10 (21.7%) |
| 65 to 74 Years | 12 (100.0%) | 0 (0.0%) |
| 75 Years and older | 54 (100.0%) | 0 (0.0%) |
| Total | 277 (92.3%) | 23 (7.7%) |
Health Insurance Coverage by Citizenship Status in Standard
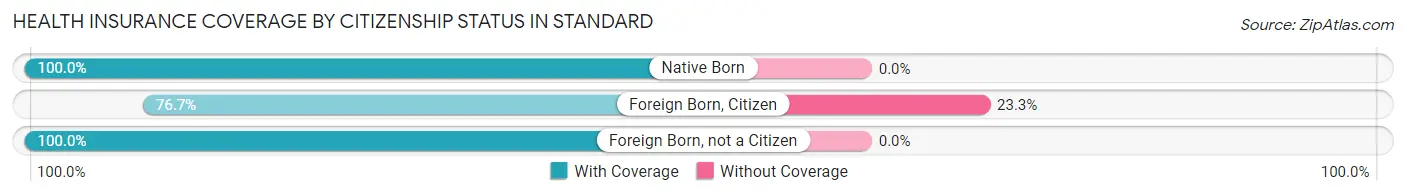
| Citizenship Status | With Coverage | Without Coverage |
| Native Born | 27 (100.0%) | 0 (0.0%) |
| Foreign Born, Citizen | 33 (76.7%) | 10 (23.3%) |
| Foreign Born, not a Citizen | 19 (100.0%) | 0 (0.0%) |
Health Insurance Coverage by Household Income in Standard
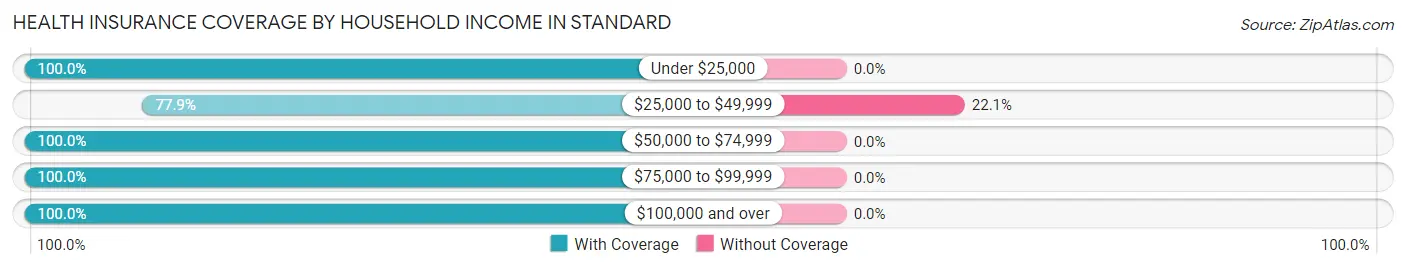
| Household Income | With Coverage | Without Coverage |
| Under $25,000 | 23 (100.0%) | 0 (0.0%) |
| $25,000 to $49,999 | 81 (77.9%) | 23 (22.1%) |
| $50,000 to $74,999 | 50 (100.0%) | 0 (0.0%) |
| $75,000 to $99,999 | 15 (100.0%) | 0 (0.0%) |
| $100,000 and over | 108 (100.0%) | 0 (0.0%) |
Public vs Private Health Insurance Coverage by Age in Standard
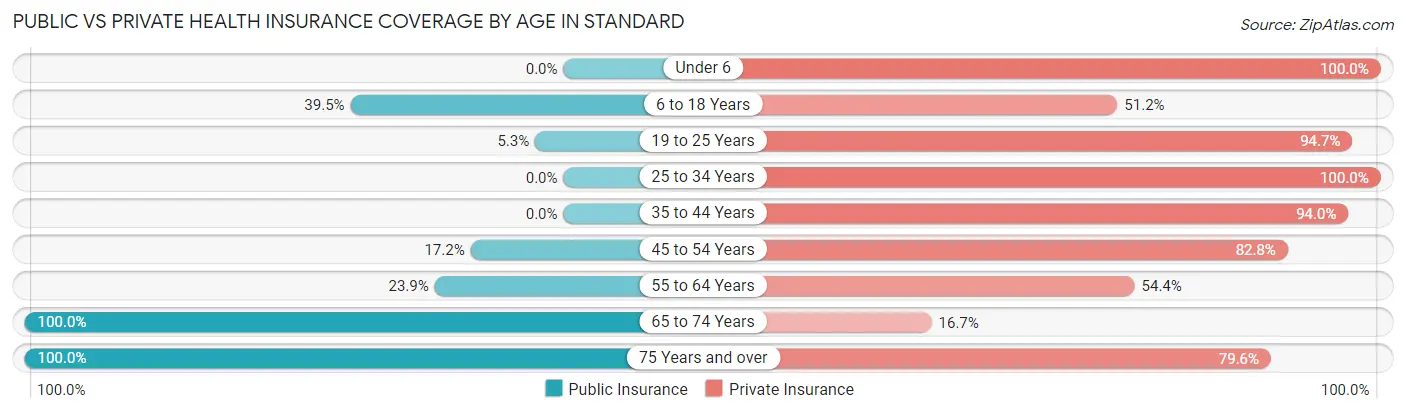
| Age Bracket | Public Insurance | Private Insurance |
| Under 6 | 0 (0.0%) | 27 (100.0%) |
| 6 to 18 Years | 17 (39.5%) | 22 (51.2%) |
| 19 to 25 Years | 1 (5.3%) | 18 (94.7%) |
| 25 to 34 Years | 0 (0.0%) | 20 (100.0%) |
| 35 to 44 Years | 0 (0.0%) | 47 (94.0%) |
| 45 to 54 Years | 5 (17.2%) | 24 (82.8%) |
| 55 to 64 Years | 11 (23.9%) | 25 (54.3%) |
| 65 to 74 Years | 12 (100.0%) | 2 (16.7%) |
| 75 Years and over | 54 (100.0%) | 43 (79.6%) |
| Total | 100 (33.3%) | 228 (76.0%) |
Disability Status by Sex by Age in Standard
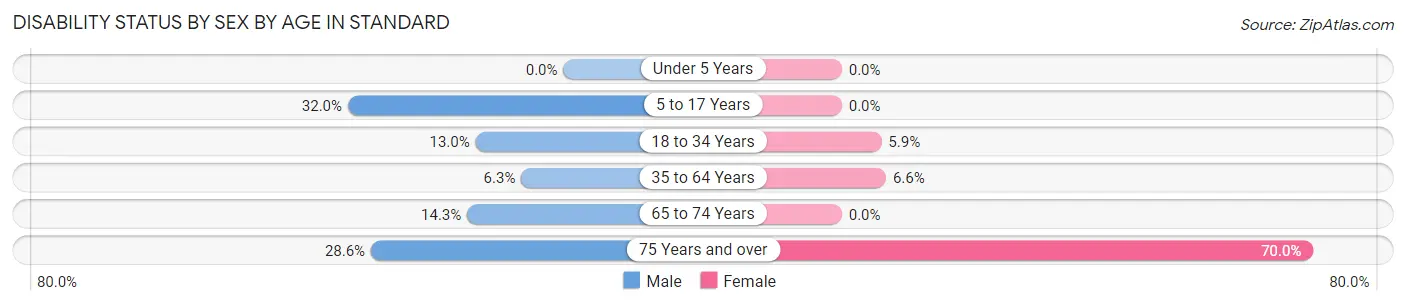
| Age Bracket | Male | Female |
| Under 5 Years | 0 (0.0%) | 0 (0.0%) |
| 5 to 17 Years | 8 (32.0%) | 0 (0.0%) |
| 18 to 34 Years | 3 (13.0%) | 1 (5.9%) |
| 35 to 64 Years | 4 (6.2%) | 4 (6.6%) |
| 65 to 74 Years | 1 (14.3%) | 0 (0.0%) |
| 75 Years and over | 4 (28.6%) | 28 (70.0%) |
Disability Class by Sex by Age in Standard
Disability Class: Hearing Difficulty
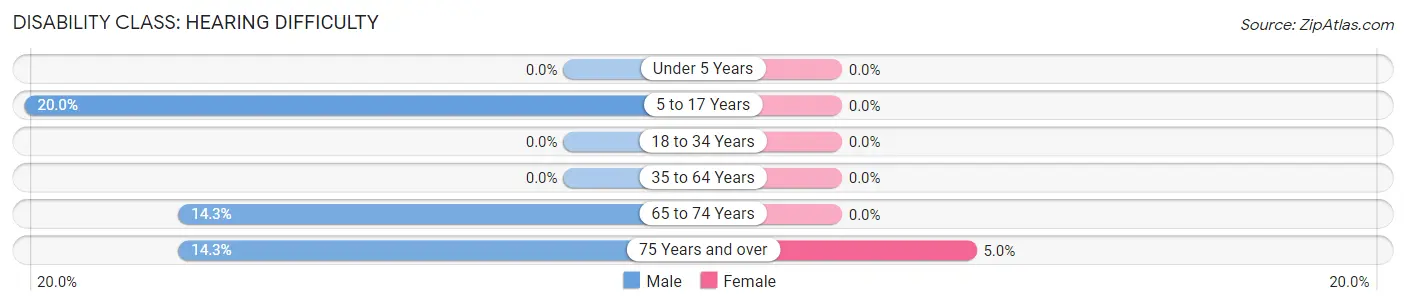
| Age Bracket | Male | Female |
| Under 5 Years | 0 (0.0%) | 0 (0.0%) |
| 5 to 17 Years | 5 (20.0%) | 0 (0.0%) |
| 18 to 34 Years | 0 (0.0%) | 0 (0.0%) |
| 35 to 64 Years | 0 (0.0%) | 0 (0.0%) |
| 65 to 74 Years | 1 (14.3%) | 0 (0.0%) |
| 75 Years and over | 2 (14.3%) | 2 (5.0%) |
Disability Class: Vision Difficulty
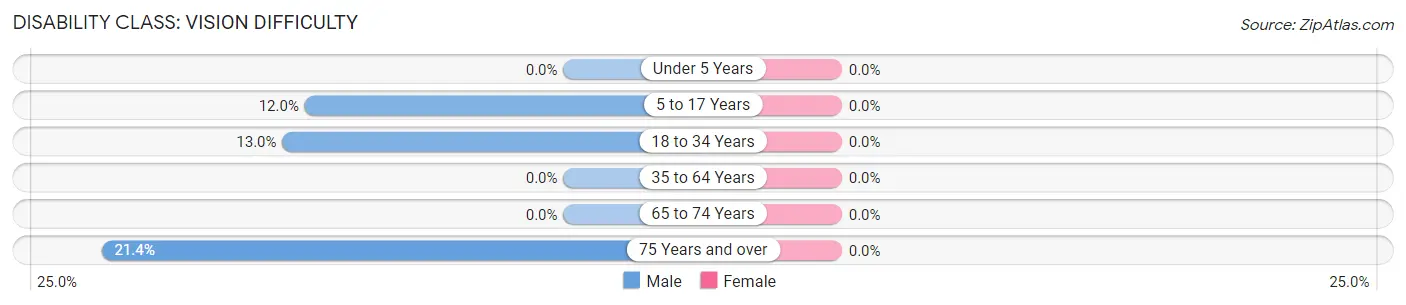
| Age Bracket | Male | Female |
| Under 5 Years | 0 (0.0%) | 0 (0.0%) |
| 5 to 17 Years | 3 (12.0%) | 0 (0.0%) |
| 18 to 34 Years | 3 (13.0%) | 0 (0.0%) |
| 35 to 64 Years | 0 (0.0%) | 0 (0.0%) |
| 65 to 74 Years | 0 (0.0%) | 0 (0.0%) |
| 75 Years and over | 3 (21.4%) | 0 (0.0%) |
Disability Class: Cognitive Difficulty
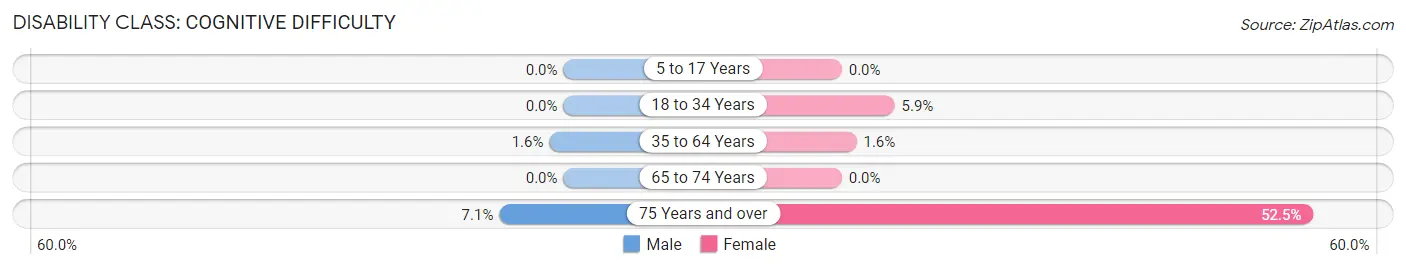
| Age Bracket | Male | Female |
| 5 to 17 Years | 0 (0.0%) | 0 (0.0%) |
| 18 to 34 Years | 0 (0.0%) | 1 (5.9%) |
| 35 to 64 Years | 1 (1.6%) | 1 (1.6%) |
| 65 to 74 Years | 0 (0.0%) | 0 (0.0%) |
| 75 Years and over | 1 (7.1%) | 21 (52.5%) |
Disability Class: Ambulatory Difficulty
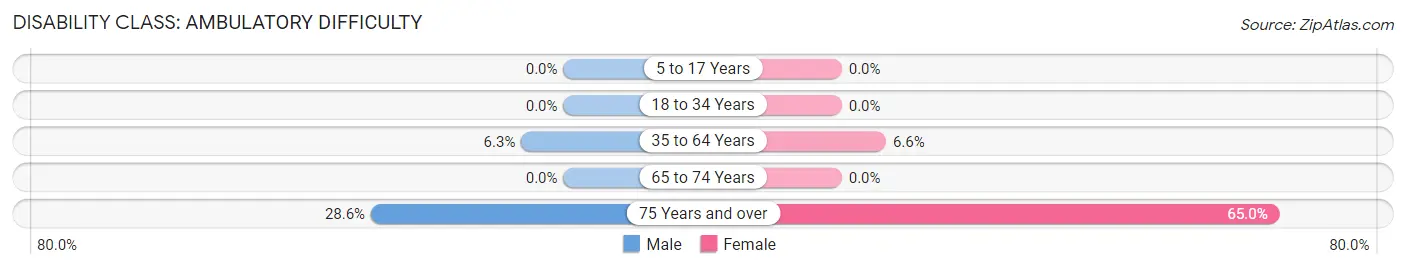
| Age Bracket | Male | Female |
| 5 to 17 Years | 0 (0.0%) | 0 (0.0%) |
| 18 to 34 Years | 0 (0.0%) | 0 (0.0%) |
| 35 to 64 Years | 4 (6.2%) | 4 (6.6%) |
| 65 to 74 Years | 0 (0.0%) | 0 (0.0%) |
| 75 Years and over | 4 (28.6%) | 26 (65.0%) |
Disability Class: Self-Care Difficulty
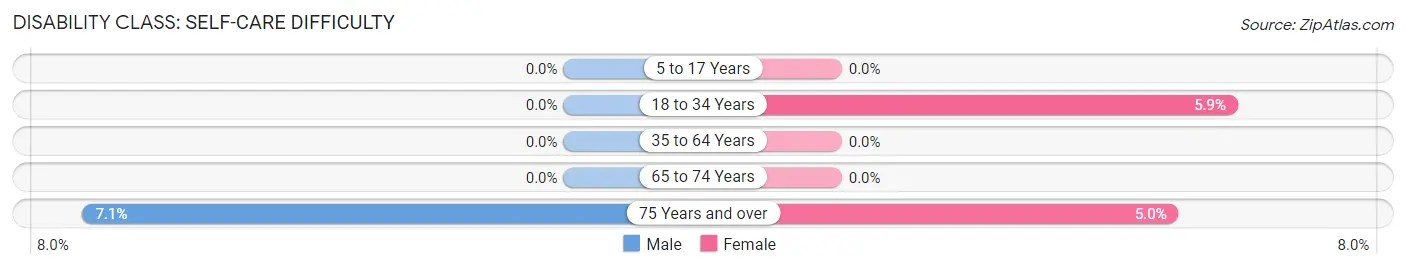
| Age Bracket | Male | Female |
| 5 to 17 Years | 0 (0.0%) | 0 (0.0%) |
| 18 to 34 Years | 0 (0.0%) | 1 (5.9%) |
| 35 to 64 Years | 0 (0.0%) | 0 (0.0%) |
| 65 to 74 Years | 0 (0.0%) | 0 (0.0%) |
| 75 Years and over | 1 (7.1%) | 2 (5.0%) |
Technology Access in Standard
Computing Device Access in Standard
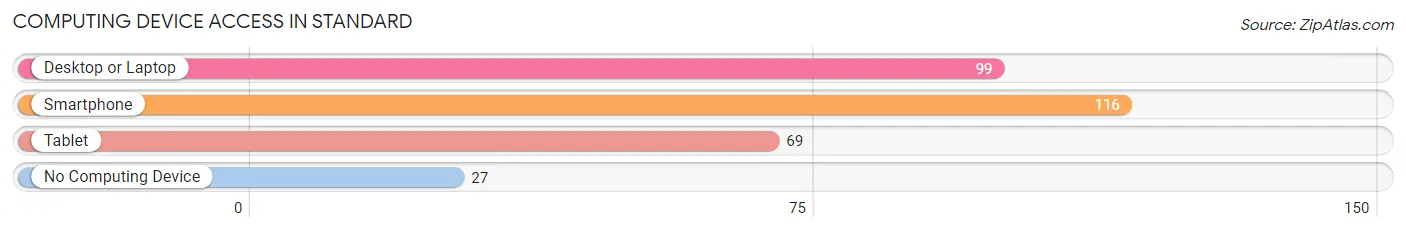
| Device Type | # Households | % Households |
| Desktop or Laptop | 99 | 64.7% |
| Smartphone | 116 | 75.8% |
| Tablet | 69 | 45.1% |
| No Computing Device | 27 | 17.6% |
| Total | 153 | 100.0% |
Internet Access in Standard
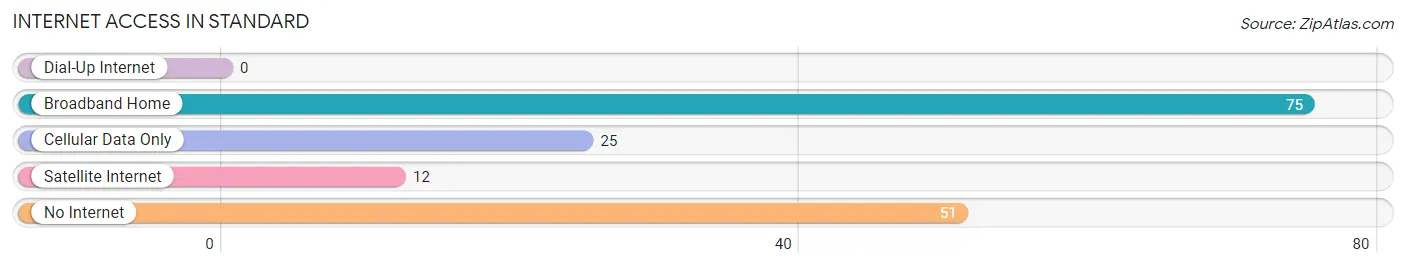
| Internet Type | # Households | % Households |
| Dial-Up Internet | 0 | 0.0% |
| Broadband Home | 75 | 49.0% |
| Cellular Data Only | 25 | 16.3% |
| Satellite Internet | 12 | 7.8% |
| No Internet | 51 | 33.3% |
| Total | 153 | 100.0% |
Standard Summary
IL History
Illinois is a state located in the Midwestern United States. It is the sixth most populous state in the country and the 25th largest state by area. The state was admitted to the Union on December 3, 1818, becoming the 21st state. The state was named after the Illinois Native American tribe, which was a part of the Miami and Illinois Confederation.
The first Europeans to explore the area were French explorers Jacques Marquette and Louis Jolliet in 1673. The French established a number of trading posts and forts in the area, and the area was part of the French colony of New France until 1763, when it was ceded to Great Britain after the French and Indian War. The British held the area until the American Revolutionary War, when it was ceded to the United States.
The state was initially part of the Northwest Territory, and then became part of the Indiana Territory in 1800. In 1809, the Illinois Territory was created, and in 1818, it was admitted to the Union as the 21st state.
During the 19th century, Illinois was a major center of immigration, with many immigrants coming from Germany, Ireland, and Scandinavia. The state also saw a large influx of African Americans from the South during the Great Migration.
The state was a major battleground during the Civil War, with several major battles taking place in the state. After the war, the state experienced a period of rapid industrialization and economic growth.
In the 20th century, the state was a major center of the labor movement, and was the site of several major labor strikes. The state also experienced a period of rapid population growth, with the population increasing from 5.3 million in 1950 to 12.4 million in 2010.
Geography
Illinois is located in the Midwestern United States, bordered by Wisconsin to the north, Iowa to the west, Missouri to the south, and Indiana to the east. The state is divided into 102 counties, and its capital is Springfield.
The state has a total area of 57,914 square miles, making it the 25th largest state in the country. The state is divided into three distinct geographic regions: the Central Plains, the Shawnee Hills, and the Mississippi River Valley.
The Central Plains region is located in the northern and central parts of the state, and is characterized by flat terrain and fertile soil. The Shawnee Hills region is located in the southern part of the state, and is characterized by rolling hills and forests. The Mississippi River Valley region is located in the western part of the state, and is characterized by bluffs and steep river valleys.
Economy
Illinois has a diverse and robust economy, with a gross state product of $739 billion in 2018. The state is a major center of manufacturing, finance, and transportation, and is home to several Fortune 500 companies, including Boeing, Caterpillar, and State Farm Insurance.
The state is also a major agricultural producer, with corn, soybeans, and hogs being the top three agricultural products. Other major industries in the state include tourism, technology, and energy.
Demographics
As of 2019, the population of Illinois was 12.7 million, making it the sixth most populous state in the country. The state is racially and ethnically diverse, with the largest racial group being white (63.7%), followed by African American (14.6%), Hispanic or Latino (14.5%), and Asian (5.2%).
The state is also home to a large immigrant population, with over 1 million foreign-born residents. The largest ancestry groups in the state are German (17.2%), Irish (13.2%), and Polish (7.2%).
The state has a median household income of $62,992, and a poverty rate of 11.3%. The largest cities in the state are Chicago, Aurora, Rockford, Joliet, and Naperville.
Common Questions
What is Per Capita Income in Standard?
Per Capita income in Standard is $39,834.
What is the Median Family Income in Standard?
Median Family Income in Standard is $93,750.
What is the Median Household income in Standard?
Median Household Income in Standard is $45,625.
What is Income or Wage Gap in Standard?
Income or Wage Gap in Standard is 25.4%.
Women in Standard earn 74.6 cents for every dollar earned by a man.
What is Inequality or Gini Index in Standard?
Inequality or Gini Index in Standard is 0.57.
What is the Total Population of Standard?
Total Population of Standard is 300.
What is the Total Male Population of Standard?
Total Male Population of Standard is 157.
What is the Total Female Population of Standard?
Total Female Population of Standard is 143.
What is the Ratio of Males per 100 Females in Standard?
There are 109.79 Males per 100 Females in Standard.
What is the Ratio of Females per 100 Males in Standard?
There are 91.08 Females per 100 Males in Standard.
What is the Median Population Age in Standard?
Median Population Age in Standard is 44.3 Years.
What is the Average Family Size in Standard
Average Family Size in Standard is 3.1 People.
What is the Average Household Size in Standard
Average Household Size in Standard is 2.0 People.
How Large is the Labor Force in Standard?
There are 143 People in the Labor Forcein in Standard.
What is the Percentage of People in the Labor Force in Standard?
60.1% of People are in the Labor Force in Standard.
What is the Unemployment Rate in Standard?
Unemployment Rate in Standard is 4.9%.