St Jacob, IL Map & Demographics
St Jacob Map
St Jacob Overview
$34,512
PER CAPITA INCOME
$108,523
AVG FAMILY INCOME
$94,531
AVG HOUSEHOLD INCOME
58.0%
WAGE / INCOME GAP [ % ]
42.0¢/ $1
WAGE / INCOME GAP [ $ ]
0.35
INEQUALITY / GINI INDEX
1,597
TOTAL POPULATION
758
MALE POPULATION
839
FEMALE POPULATION
90.35
MALES / 100 FEMALES
110.69
FEMALES / 100 MALES
33.5
MEDIAN AGE
3.5
AVG FAMILY SIZE
3.0
AVG HOUSEHOLD SIZE
775
LABOR FORCE [ PEOPLE ]
69.7%
PERCENT IN LABOR FORCE
1.8%
UNEMPLOYMENT RATE
Income in St Jacob
Income Overview in St Jacob
Per Capita Income in St Jacob is $34,512, while median incomes of families and households are $108,523 and $94,531 respectively.
| Characteristic | Number | Measure |
| Per Capita Income | 1,597 | $34,512 |
| Median Family Income | 401 | $108,523 |
| Mean Family Income | 401 | $106,815 |
| Median Household Income | 540 | $94,531 |
| Mean Household Income | 540 | $100,126 |
| Income Deficit | 401 | $0 |
| Wage / Income Gap (%) | 1,597 | 58.04% |
| Wage / Income Gap ($) | 1,597 | 41.96¢ per $1 |
| Gini / Inequality Index | 1,597 | 0.35 |
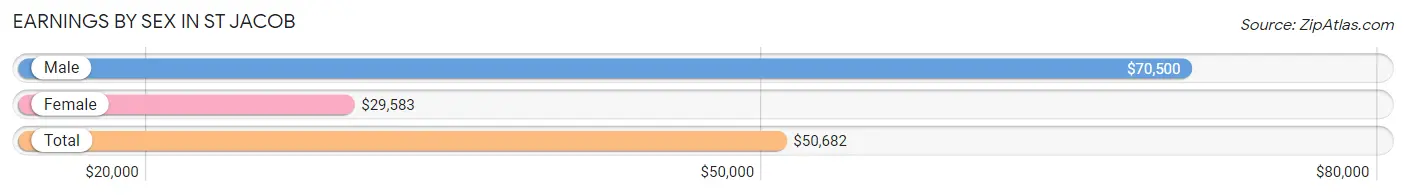
Earnings by Sex in St Jacob
Average Earnings in St Jacob are $50,682, $70,500 for men and $29,583 for women, a difference of 58.0%.
| Sex | Number | Average Earnings |
| Male | 406 (51.3%) | $70,500 |
| Female | 386 (48.7%) | $29,583 |
| Total | 792 (100.0%) | $50,682 |
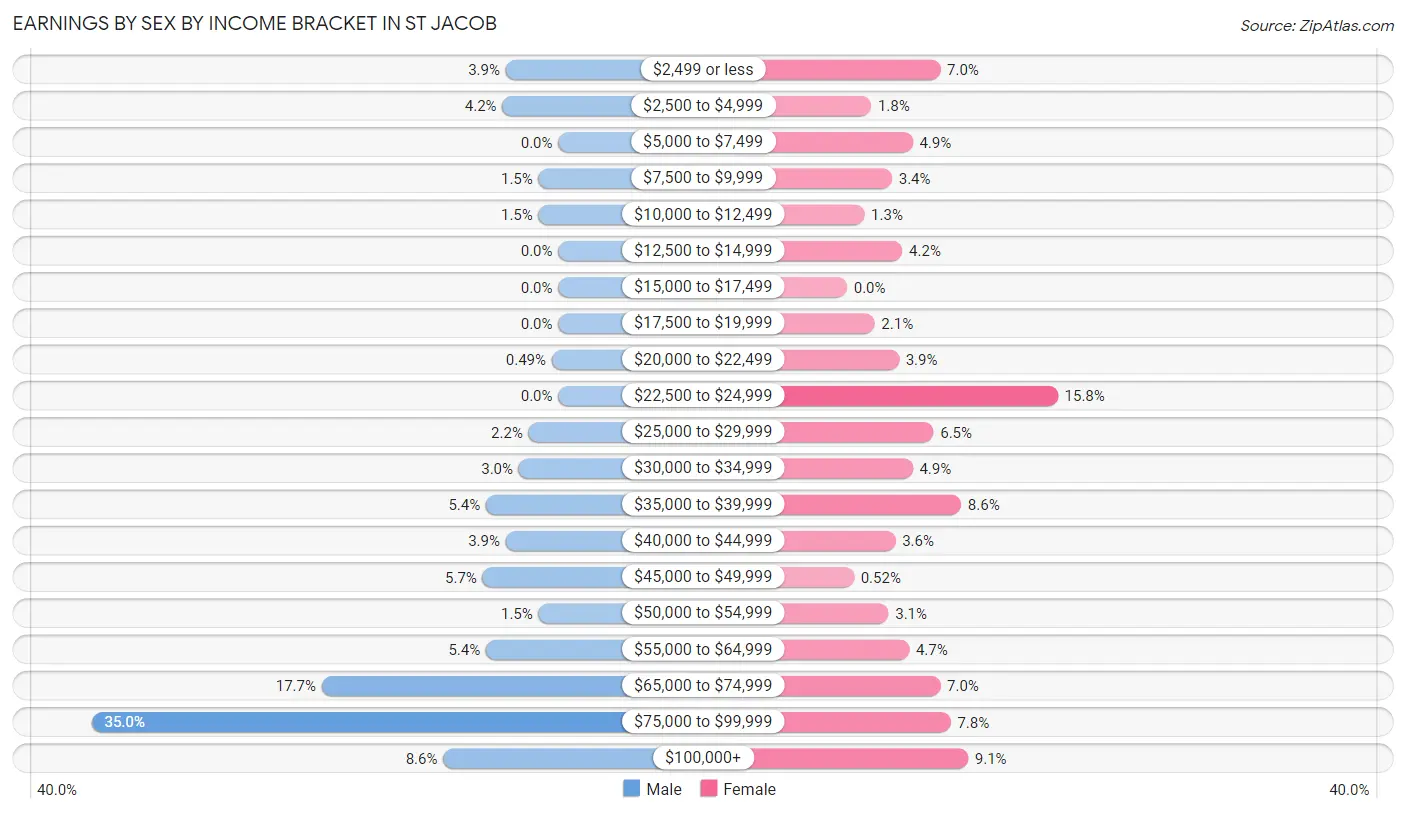
Earnings by Sex by Income Bracket in St Jacob
The most common earnings brackets in St Jacob are $75,000 to $99,999 for men (142 | 35.0%) and $22,500 to $24,999 for women (61 | 15.8%).
| Income | Male | Female |
| $2,499 or less | 16 (3.9%) | 27 (7.0%) |
| $2,500 to $4,999 | 17 (4.2%) | 7 (1.8%) |
| $5,000 to $7,499 | 0 (0.0%) | 19 (4.9%) |
| $7,500 to $9,999 | 6 (1.5%) | 13 (3.4%) |
| $10,000 to $12,499 | 6 (1.5%) | 5 (1.3%) |
| $12,500 to $14,999 | 0 (0.0%) | 16 (4.2%) |
| $15,000 to $17,499 | 0 (0.0%) | 0 (0.0%) |
| $17,500 to $19,999 | 0 (0.0%) | 8 (2.1%) |
| $20,000 to $22,499 | 2 (0.5%) | 15 (3.9%) |
| $22,500 to $24,999 | 0 (0.0%) | 61 (15.8%) |
| $25,000 to $29,999 | 9 (2.2%) | 25 (6.5%) |
| $30,000 to $34,999 | 12 (3.0%) | 19 (4.9%) |
| $35,000 to $39,999 | 22 (5.4%) | 33 (8.6%) |
| $40,000 to $44,999 | 16 (3.9%) | 14 (3.6%) |
| $45,000 to $49,999 | 23 (5.7%) | 2 (0.5%) |
| $50,000 to $54,999 | 6 (1.5%) | 12 (3.1%) |
| $55,000 to $64,999 | 22 (5.4%) | 18 (4.7%) |
| $65,000 to $74,999 | 72 (17.7%) | 27 (7.0%) |
| $75,000 to $99,999 | 142 (35.0%) | 30 (7.8%) |
| $100,000+ | 35 (8.6%) | 35 (9.1%) |
| Total | 406 (100.0%) | 386 (100.0%) |
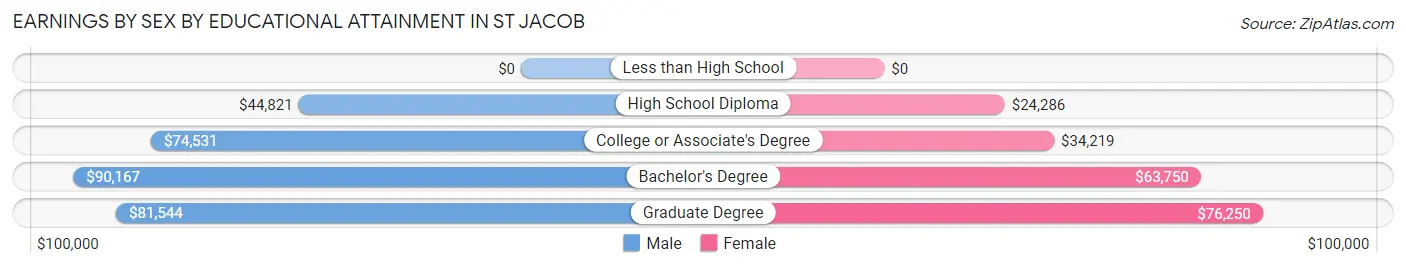
Earnings by Sex by Educational Attainment in St Jacob
Average earnings in St Jacob are $73,375 for men and $36,302 for women, a difference of 50.5%. Men with an educational attainment of bachelor's degree enjoy the highest average annual earnings of $90,167, while those with high school diploma education earn the least with $44,821. Women with an educational attainment of graduate degree earn the most with the average annual earnings of $76,250, while those with high school diploma education have the smallest earnings of $24,286.
| Educational Attainment | Male Income | Female Income |
| Less than High School | - | - |
| High School Diploma | $44,821 | $24,286 |
| College or Associate's Degree | $74,531 | $34,219 |
| Bachelor's Degree | $90,167 | $63,750 |
| Graduate Degree | $81,544 | $76,250 |
| Total | $73,375 | $36,302 |
Family Income in St Jacob
Family Income Brackets in St Jacob
According to the St Jacob family income data, there are 160 families falling into the $100,000 to $149,999 income range, which is the most common income bracket and makes up 39.9% of all families.
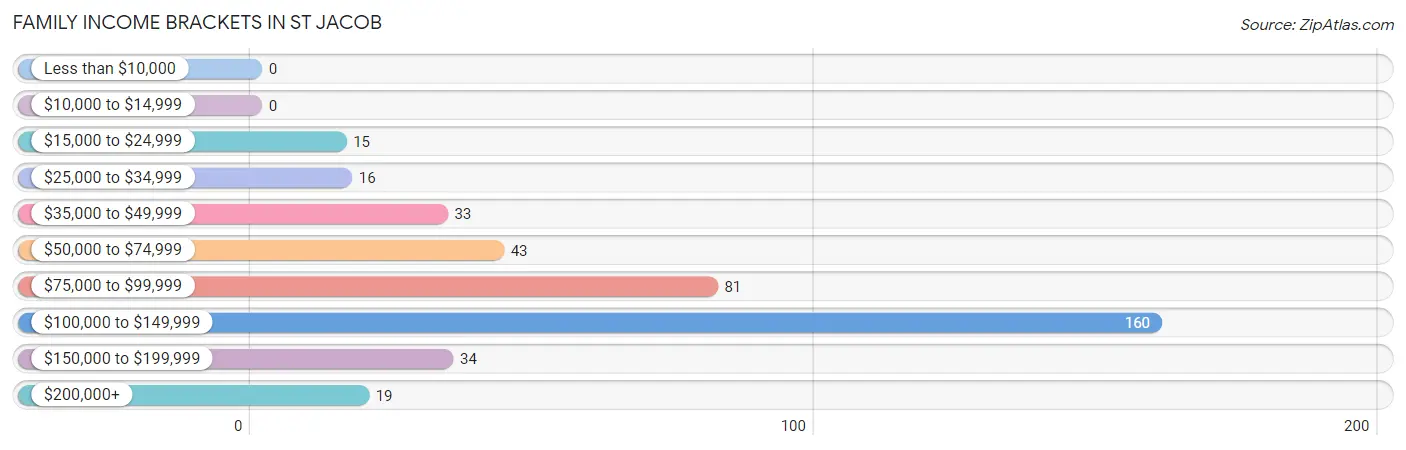
| Income Bracket | # Families | % Families |
| Less than $10,000 | 0 | 0.0% |
| $10,000 to $14,999 | 0 | 0.0% |
| $15,000 to $24,999 | 15 | 3.7% |
| $25,000 to $34,999 | 16 | 4.0% |
| $35,000 to $49,999 | 33 | 8.2% |
| $50,000 to $74,999 | 43 | 10.7% |
| $75,000 to $99,999 | 81 | 20.2% |
| $100,000 to $149,999 | 160 | 39.9% |
| $150,000 to $199,999 | 34 | 8.5% |
| $200,000+ | 19 | 4.7% |
Family Income by Famaliy Size in St Jacob
4-person families (131 | 32.7%) account for the highest median family income in St Jacob with $114,917 per family, while 2-person families (118 | 29.4%) have the highest median income of $32,125 per family member.
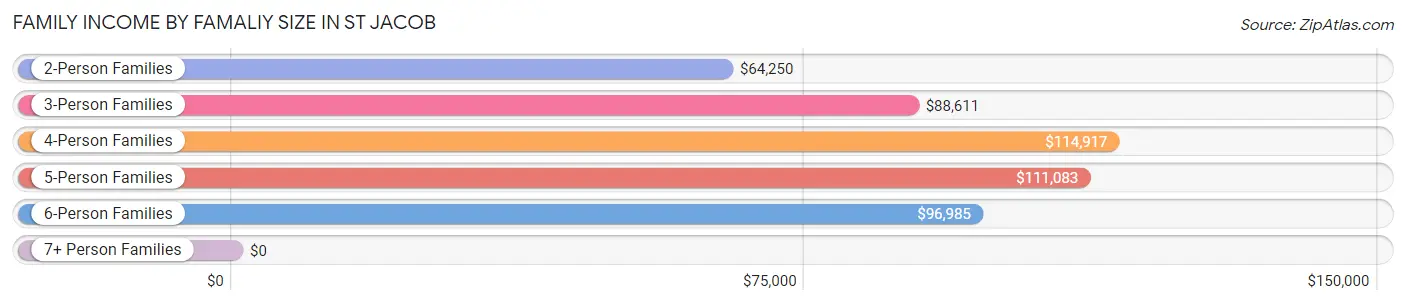
| Income Bracket | # Families | Median Income |
| 2-Person Families | 118 (29.4%) | $64,250 |
| 3-Person Families | 46 (11.5%) | $88,611 |
| 4-Person Families | 131 (32.7%) | $114,917 |
| 5-Person Families | 73 (18.2%) | $111,083 |
| 6-Person Families | 33 (8.2%) | $96,985 |
| 7+ Person Families | 0 (0.0%) | $0 |
| Total | 401 (100.0%) | $108,523 |
Family Income by Number of Earners in St Jacob
The median family income in St Jacob is $108,523, with families comprising 3+ earners (53) having the highest median family income of $127,917, while families with no earners (17) have the lowest median family income of $43,125, accounting for 13.2% and 4.2% of families, respectively.
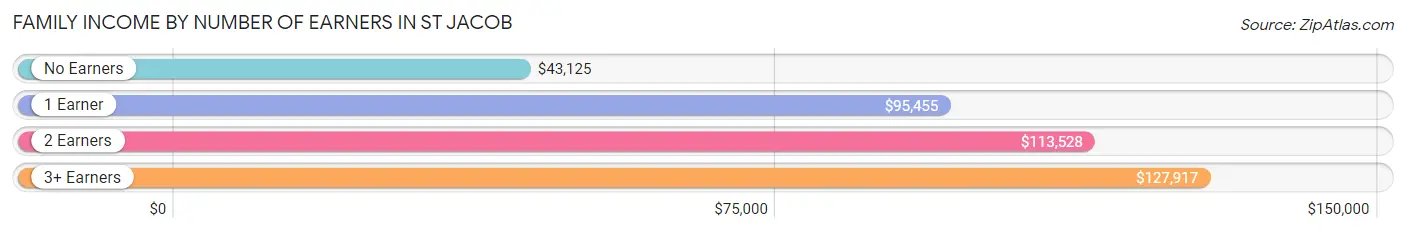
| Number of Earners | # Families | Median Income |
| No Earners | 17 (4.2%) | $43,125 |
| 1 Earner | 140 (34.9%) | $95,455 |
| 2 Earners | 191 (47.6%) | $113,528 |
| 3+ Earners | 53 (13.2%) | $127,917 |
| Total | 401 (100.0%) | $108,523 |
Household Income in St Jacob
Household Income Brackets in St Jacob
With 166 households falling in the category, the $100,000 to $149,999 income range is the most frequent in St Jacob, accounting for 30.7% of all households. In contrast, only 8 households (1.5%) fall into the $10,000 to $14,999 income bracket, making it the least populous group.
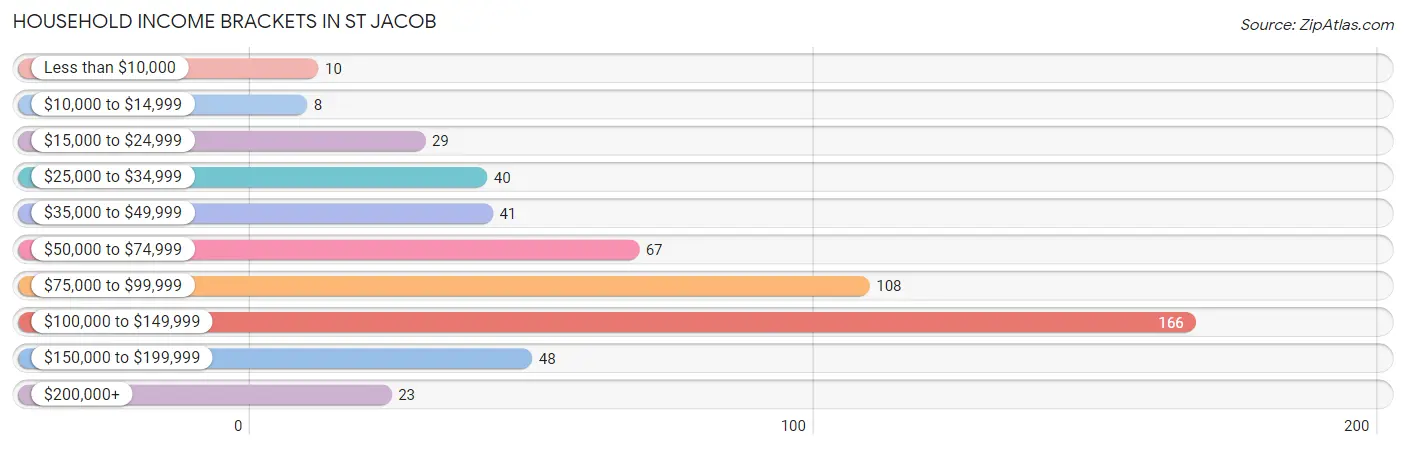
| Income Bracket | # Households | % Households |
| Less than $10,000 | 10 | 1.9% |
| $10,000 to $14,999 | 8 | 1.5% |
| $15,000 to $24,999 | 29 | 5.4% |
| $25,000 to $34,999 | 40 | 7.4% |
| $35,000 to $49,999 | 41 | 7.6% |
| $50,000 to $74,999 | 67 | 12.4% |
| $75,000 to $99,999 | 108 | 20.0% |
| $100,000 to $149,999 | 166 | 30.7% |
| $150,000 to $199,999 | 48 | 8.9% |
| $200,000+ | 23 | 4.3% |
Household Income by Householder Age in St Jacob
The median household income in St Jacob is $94,531, with the highest median household income of $112,806 found in the 25 to 44 years age bracket for the primary householder. A total of 263 households (48.7%) fall into this category. Meanwhile, the 15 to 24 years age bracket for the primary householder has the lowest median household income of $0, with 9 households (1.7%) in this group.
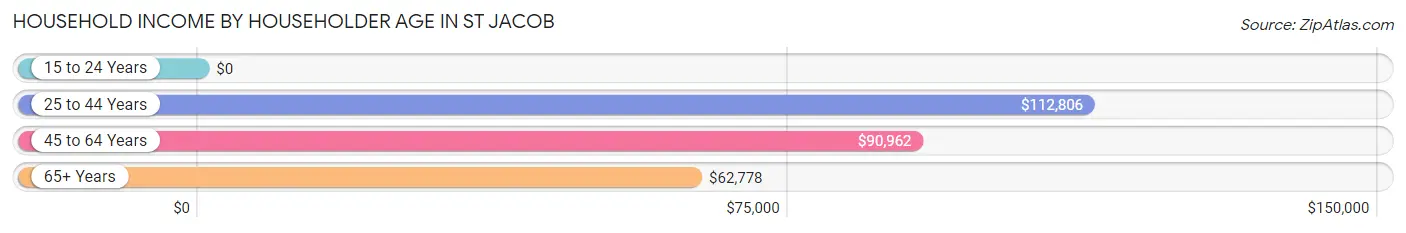
| Income Bracket | # Households | Median Income |
| 15 to 24 Years | 9 (1.7%) | $0 |
| 25 to 44 Years | 263 (48.7%) | $112,806 |
| 45 to 64 Years | 170 (31.5%) | $90,962 |
| 65+ Years | 98 (18.1%) | $62,778 |
| Total | 540 (100.0%) | $94,531 |
Poverty in St Jacob
Income Below Poverty by Sex and Age in St Jacob
With 2.0% poverty level for males and 4.9% for females among the residents of St Jacob, 65 to 74 year old males and 75 year old and over females are the most vulnerable to poverty, with 4 males (12.5%) and 5 females (26.3%) in their respective age groups living below the poverty level.
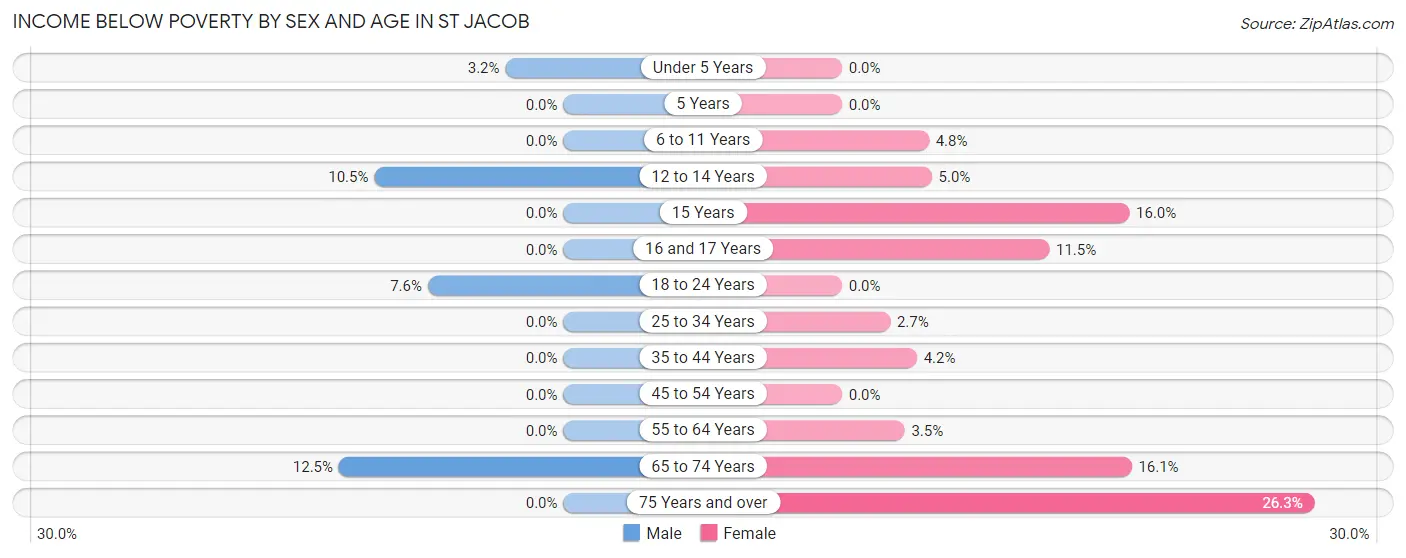
| Age Bracket | Male | Female |
| Under 5 Years | 3 (3.2%) | 0 (0.0%) |
| 5 Years | 0 (0.0%) | 0 (0.0%) |
| 6 to 11 Years | 0 (0.0%) | 3 (4.8%) |
| 12 to 14 Years | 4 (10.5%) | 4 (5.0%) |
| 15 Years | 0 (0.0%) | 4 (16.0%) |
| 16 and 17 Years | 0 (0.0%) | 3 (11.5%) |
| 18 to 24 Years | 4 (7.5%) | 0 (0.0%) |
| 25 to 34 Years | 0 (0.0%) | 3 (2.7%) |
| 35 to 44 Years | 0 (0.0%) | 6 (4.2%) |
| 45 to 54 Years | 0 (0.0%) | 0 (0.0%) |
| 55 to 64 Years | 0 (0.0%) | 3 (3.5%) |
| 65 to 74 Years | 4 (12.5%) | 10 (16.1%) |
| 75 Years and over | 0 (0.0%) | 5 (26.3%) |
| Total | 15 (2.0%) | 41 (4.9%) |
Income Above Poverty by Sex and Age in St Jacob
According to the poverty statistics in St Jacob, males aged 5 years and females aged under 5 years are the age groups that are most secure financially, with 100.0% of males and 100.0% of females in these age groups living above the poverty line.
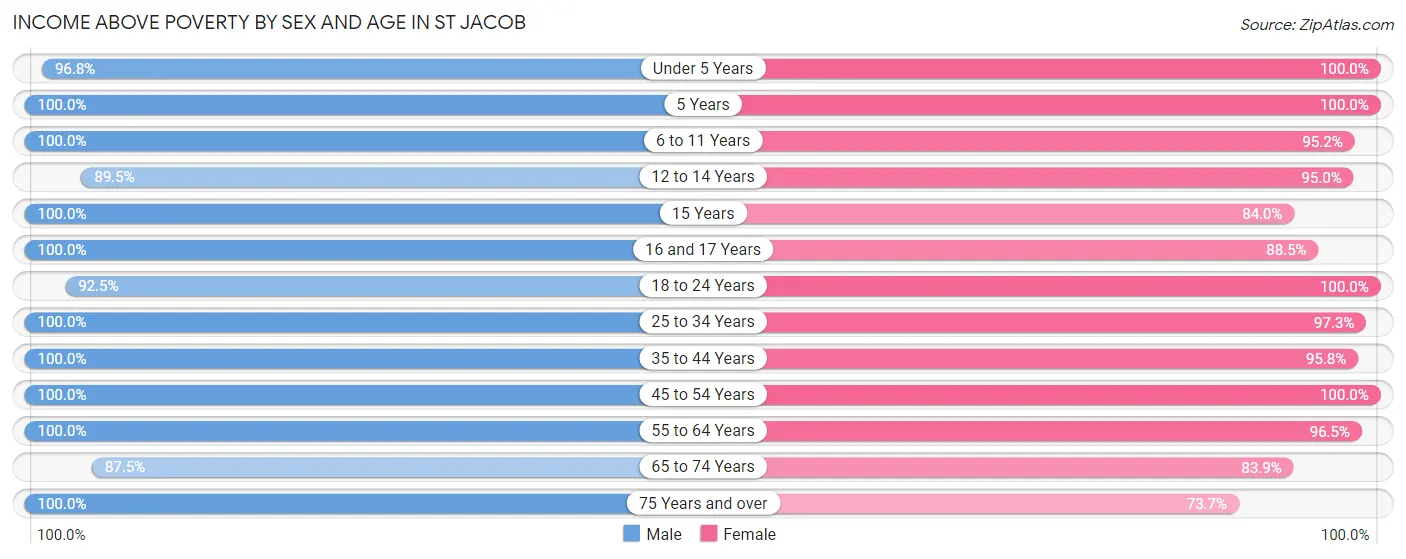
| Age Bracket | Male | Female |
| Under 5 Years | 90 (96.8%) | 79 (100.0%) |
| 5 Years | 19 (100.0%) | 16 (100.0%) |
| 6 to 11 Years | 63 (100.0%) | 59 (95.2%) |
| 12 to 14 Years | 34 (89.5%) | 76 (95.0%) |
| 15 Years | 5 (100.0%) | 21 (84.0%) |
| 16 and 17 Years | 25 (100.0%) | 23 (88.5%) |
| 18 to 24 Years | 49 (92.4%) | 60 (100.0%) |
| 25 to 34 Years | 166 (100.0%) | 109 (97.3%) |
| 35 to 44 Years | 115 (100.0%) | 138 (95.8%) |
| 45 to 54 Years | 64 (100.0%) | 68 (100.0%) |
| 55 to 64 Years | 60 (100.0%) | 83 (96.5%) |
| 65 to 74 Years | 28 (87.5%) | 52 (83.9%) |
| 75 Years and over | 20 (100.0%) | 14 (73.7%) |
| Total | 738 (98.0%) | 798 (95.1%) |
Income Below Poverty Among Married-Couple Families in St Jacob
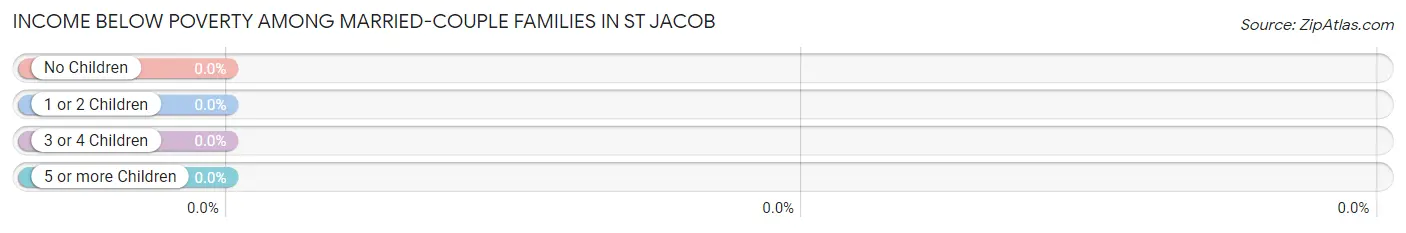
| Children | Above Poverty | Below Poverty |
| No Children | 106 (100.0%) | 0 (0.0%) |
| 1 or 2 Children | 168 (100.0%) | 0 (0.0%) |
| 3 or 4 Children | 75 (100.0%) | 0 (0.0%) |
| 5 or more Children | 0 (0.0%) | 0 (0.0%) |
| Total | 349 (100.0%) | 0 (0.0%) |
Income Below Poverty Among Single-Parent Households in St Jacob
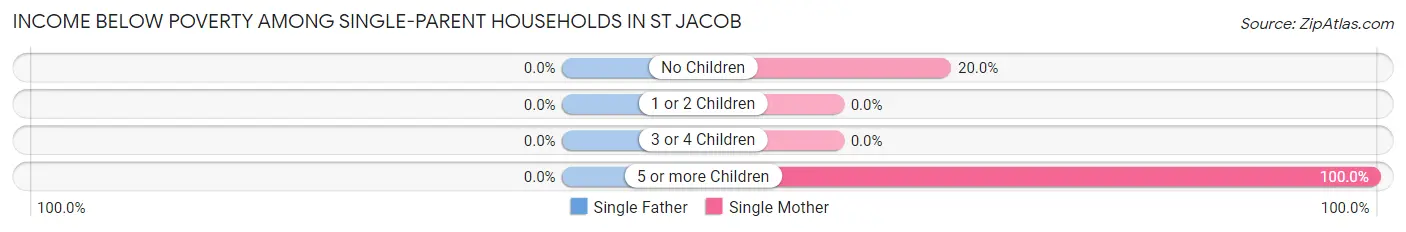
| Children | Single Father | Single Mother |
| No Children | 0 (0.0%) | 2 (20.0%) |
| 1 or 2 Children | 0 (0.0%) | 0 (0.0%) |
| 3 or 4 Children | 0 (0.0%) | 0 (0.0%) |
| 5 or more Children | 0 (0.0%) | 3 (100.0%) |
| Total | 0 (0.0%) | 5 (10.6%) |
Income Below Poverty Among Married-Couple vs Single-Parent Households in St Jacob
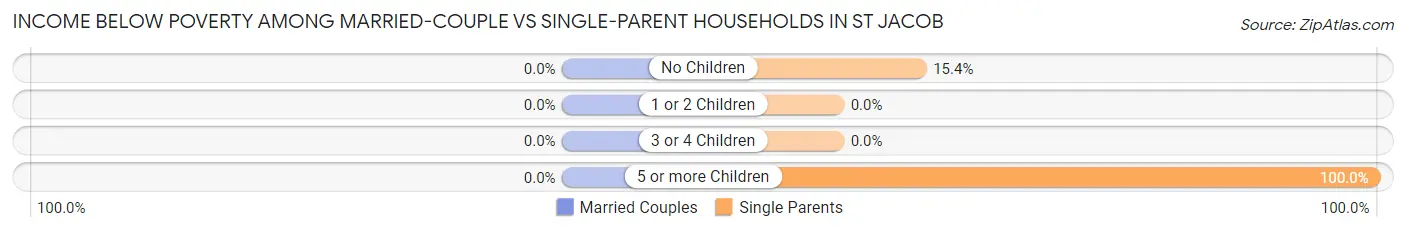
| Children | Married-Couple Families | Single-Parent Households |
| No Children | 0 (0.0%) | 2 (15.4%) |
| 1 or 2 Children | 0 (0.0%) | 0 (0.0%) |
| 3 or 4 Children | 0 (0.0%) | 0 (0.0%) |
| 5 or more Children | 0 (0.0%) | 3 (100.0%) |
| Total | 0 (0.0%) | 5 (9.6%) |
Race in St Jacob
The most populous races in St Jacob are White / Caucasian (1,545 | 96.7%), Two or more Races (44 | 2.8%), and Hispanic or Latino (31 | 1.9%).
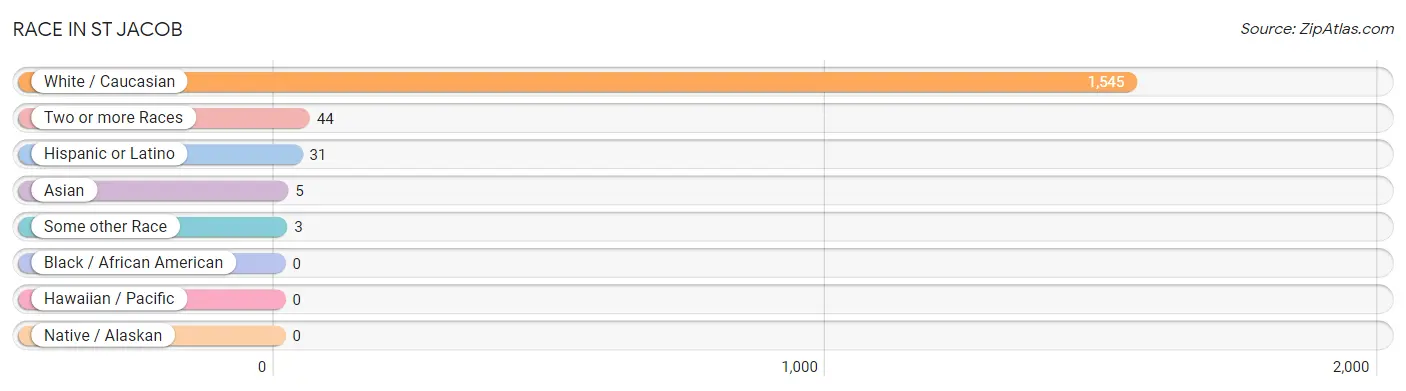
| Race | # Population | % Population |
| Asian | 5 | 0.3% |
| Black / African American | 0 | 0.0% |
| Hawaiian / Pacific | 0 | 0.0% |
| Hispanic or Latino | 31 | 1.9% |
| Native / Alaskan | 0 | 0.0% |
| White / Caucasian | 1,545 | 96.7% |
| Two or more Races | 44 | 2.8% |
| Some other Race | 3 | 0.2% |
| Total | 1,597 | 100.0% |
Ancestry in St Jacob
The most populous ancestries reported in St Jacob are German (559 | 35.0%), English (247 | 15.5%), Irish (233 | 14.6%), Scottish (119 | 7.4%), and Dutch (71 | 4.4%), together accounting for 77.0% of all St Jacob residents.
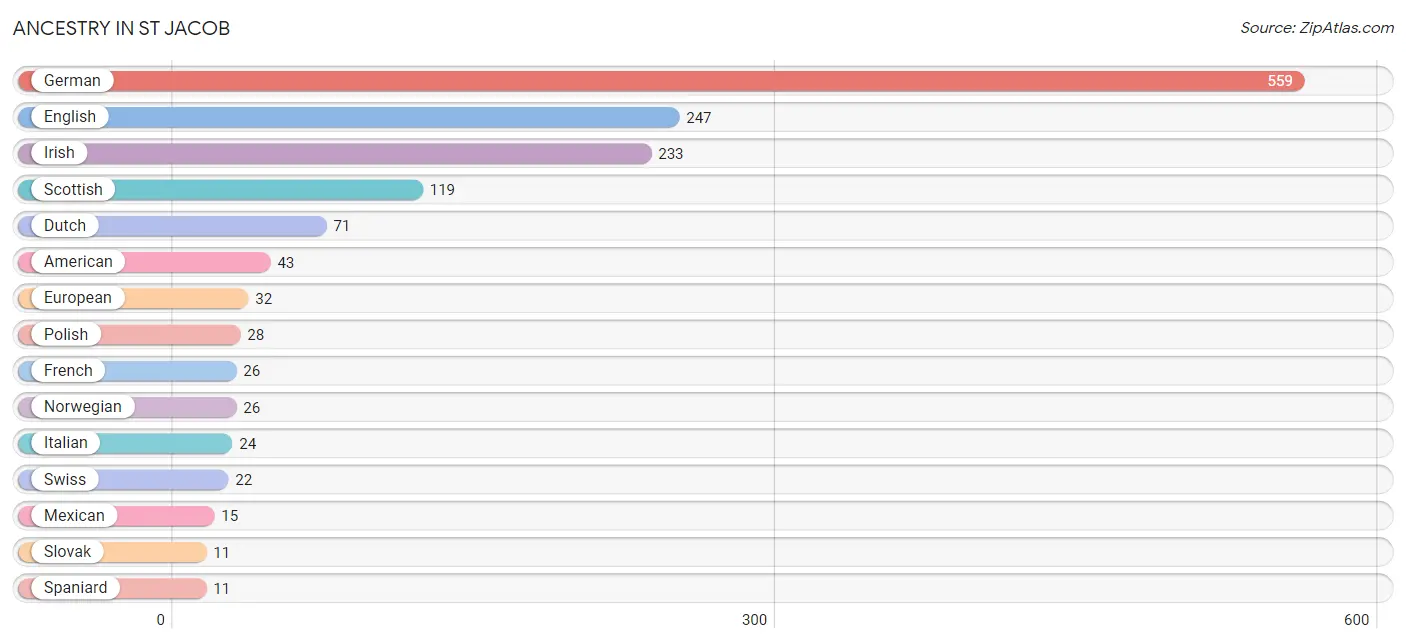
| Ancestry | # Population | % Population |
| American | 43 | 2.7% |
| Bulgarian | 6 | 0.4% |
| Burmese | 10 | 0.6% |
| Cherokee | 2 | 0.1% |
| Croatian | 8 | 0.5% |
| Dutch | 71 | 4.4% |
| English | 247 | 15.5% |
| European | 32 | 2.0% |
| French | 26 | 1.6% |
| German | 559 | 35.0% |
| Irish | 233 | 14.6% |
| Italian | 24 | 1.5% |
| Lithuanian | 2 | 0.1% |
| Mexican | 15 | 0.9% |
| Norwegian | 26 | 1.6% |
| Polish | 28 | 1.8% |
| Russian | 4 | 0.3% |
| Scottish | 119 | 7.4% |
| Sioux | 2 | 0.1% |
| Slovak | 11 | 0.7% |
| Spaniard | 11 | 0.7% |
| Swedish | 2 | 0.1% |
| Swiss | 22 | 1.4% |
| Welsh | 5 | 0.3% |
| Yugoslavian | 2 | 0.1% | View All 25 Rows |
Immigrants in St Jacob
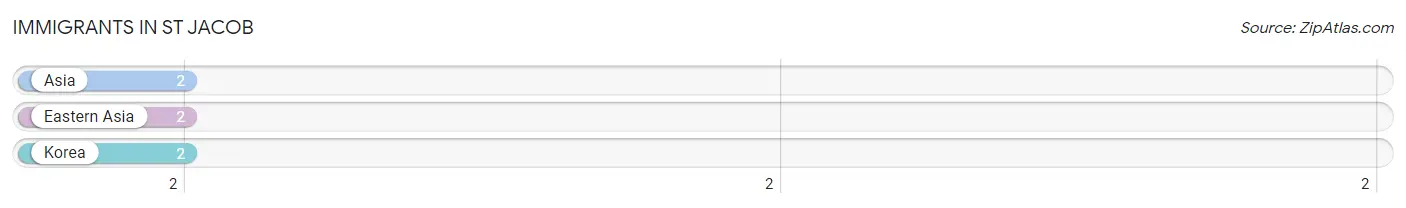
The most numerous immigrant groups reported in St Jacob came from Asia (2 | 0.1%), Eastern Asia (2 | 0.1%), and Korea (2 | 0.1%), together accounting for 0.4% of all St Jacob residents.
| Immigration Origin | # Population | % Population |
| Asia | 2 | 0.1% |
| Eastern Asia | 2 | 0.1% |
| Korea | 2 | 0.1% | View All 3 Rows |
Sex and Age in St Jacob
Sex and Age in St Jacob
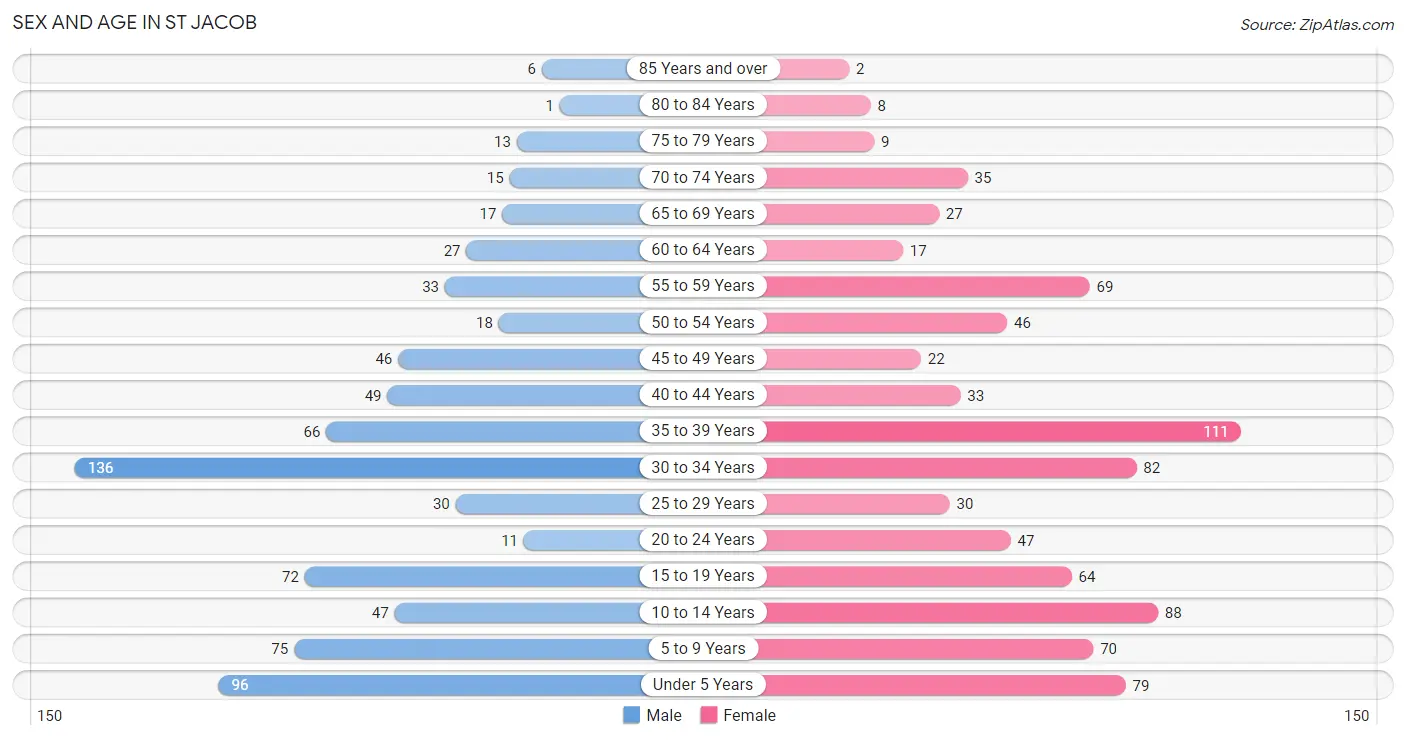
The most populous age groups in St Jacob are 30 to 34 Years (136 | 17.9%) for men and 35 to 39 Years (111 | 13.2%) for women.
| Age Bracket | Male | Female |
| Under 5 Years | 96 (12.7%) | 79 (9.4%) |
| 5 to 9 Years | 75 (9.9%) | 70 (8.3%) |
| 10 to 14 Years | 47 (6.2%) | 88 (10.5%) |
| 15 to 19 Years | 72 (9.5%) | 64 (7.6%) |
| 20 to 24 Years | 11 (1.5%) | 47 (5.6%) |
| 25 to 29 Years | 30 (4.0%) | 30 (3.6%) |
| 30 to 34 Years | 136 (17.9%) | 82 (9.8%) |
| 35 to 39 Years | 66 (8.7%) | 111 (13.2%) |
| 40 to 44 Years | 49 (6.5%) | 33 (3.9%) |
| 45 to 49 Years | 46 (6.1%) | 22 (2.6%) |
| 50 to 54 Years | 18 (2.4%) | 46 (5.5%) |
| 55 to 59 Years | 33 (4.3%) | 69 (8.2%) |
| 60 to 64 Years | 27 (3.6%) | 17 (2.0%) |
| 65 to 69 Years | 17 (2.2%) | 27 (3.2%) |
| 70 to 74 Years | 15 (2.0%) | 35 (4.2%) |
| 75 to 79 Years | 13 (1.7%) | 9 (1.1%) |
| 80 to 84 Years | 1 (0.1%) | 8 (0.9%) |
| 85 Years and over | 6 (0.8%) | 2 (0.2%) |
| Total | 758 (100.0%) | 839 (100.0%) |
Families and Households in St Jacob
Median Family Size in St Jacob
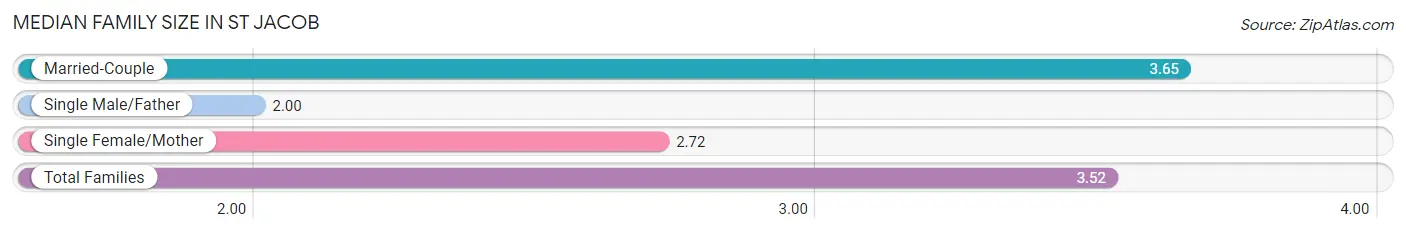
The median family size in St Jacob is 3.52 persons per family, with married-couple families (349 | 87.0%) accounting for the largest median family size of 3.65 persons per family. On the other hand, single male/father families (5 | 1.3%) represent the smallest median family size with 2.00 persons per family.
| Family Type | # Families | Family Size |
| Married-Couple | 349 (87.0%) | 3.65 |
| Single Male/Father | 5 (1.3%) | 2.00 |
| Single Female/Mother | 47 (11.7%) | 2.72 |
| Total Families | 401 (100.0%) | 3.52 |
Median Household Size in St Jacob
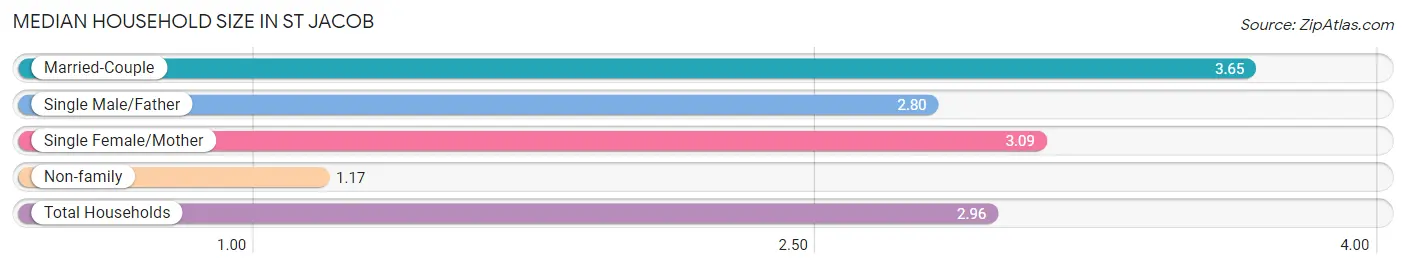
The median household size in St Jacob is 2.96 persons per household, with married-couple households (349 | 64.6%) accounting for the largest median household size of 3.65 persons per household. non-family households (139 | 25.7%) represent the smallest median household size with 1.17 persons per household.
| Household Type | # Households | Household Size |
| Married-Couple | 349 (64.6%) | 3.65 |
| Single Male/Father | 5 (0.9%) | 2.80 |
| Single Female/Mother | 47 (8.7%) | 3.09 |
| Non-family | 139 (25.7%) | 1.17 |
| Total Households | 540 (100.0%) | 2.96 |
Household Size by Marriage Status in St Jacob
Out of a total of 540 households in St Jacob, 401 (74.3%) are family households, while 139 (25.7%) are nonfamily households. The most numerous type of family households are 4-person households, comprising 133, and the most common type of nonfamily households are 1-person households, comprising 121.
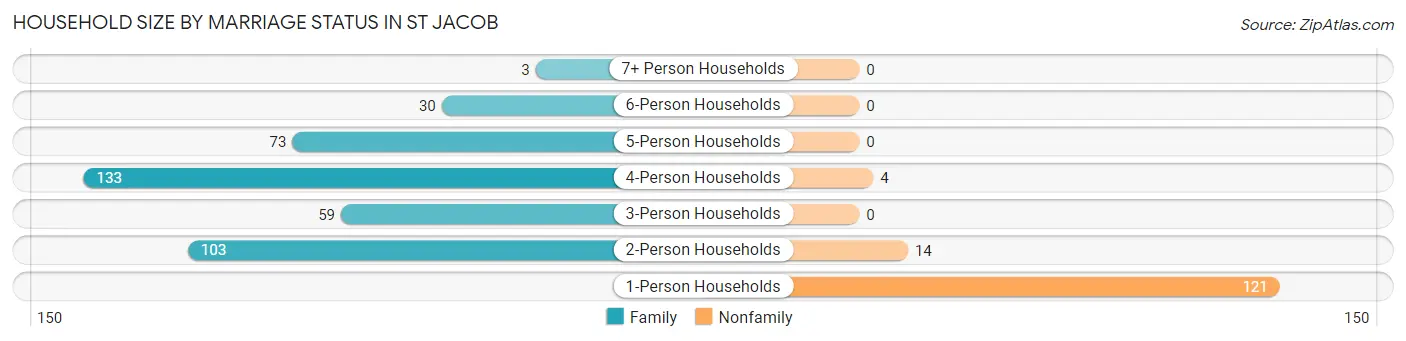
| Household Size | Family Households | Nonfamily Households |
| 1-Person Households | - | 121 (22.4%) |
| 2-Person Households | 103 (19.1%) | 14 (2.6%) |
| 3-Person Households | 59 (10.9%) | 0 (0.0%) |
| 4-Person Households | 133 (24.6%) | 4 (0.7%) |
| 5-Person Households | 73 (13.5%) | 0 (0.0%) |
| 6-Person Households | 30 (5.6%) | 0 (0.0%) |
| 7+ Person Households | 3 (0.6%) | 0 (0.0%) |
| Total | 401 (74.3%) | 139 (25.7%) |
Female Fertility in St Jacob
Fertility by Age in St Jacob
Average fertility rate in St Jacob is 117.0 births per 1,000 women. Women in the age bracket of 20 to 34 years have the highest fertility rate with 239.0 births per 1,000 women. Women in the age bracket of 20 to 34 years acount for 82.6% of all women with births.
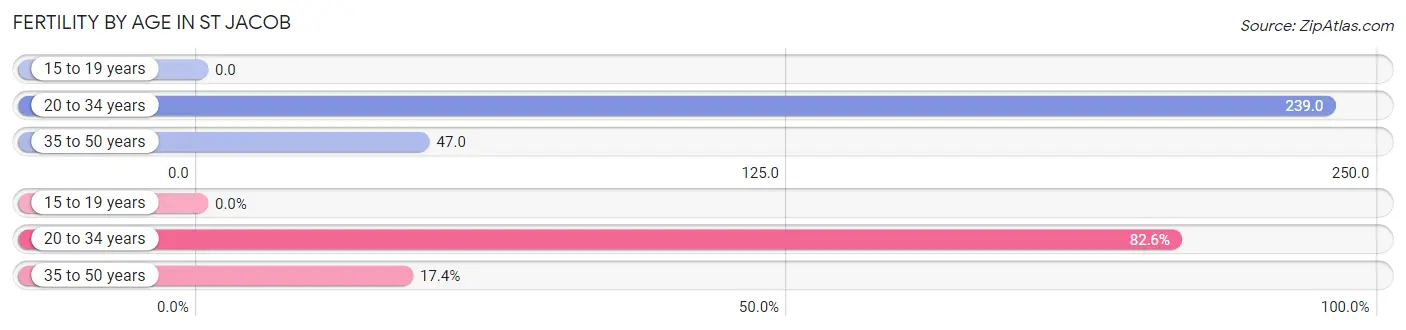
| Age Bracket | Women with Births | Births / 1,000 Women |
| 15 to 19 years | 0 (0.0%) | 0.0 |
| 20 to 34 years | 38 (82.6%) | 239.0 |
| 35 to 50 years | 8 (17.4%) | 47.0 |
| Total | 46 (100.0%) | 117.0 |
Fertility by Age by Marriage Status in St Jacob
91.3% of women with births (46) in St Jacob are married. The highest percentage of unmarried women with births falls into 20 to 34 years age bracket with 10.5% of them unmarried at the time of birth, while the lowest percentage of unmarried women with births belong to 35 to 50 years age bracket with 0.0% of them unmarried.
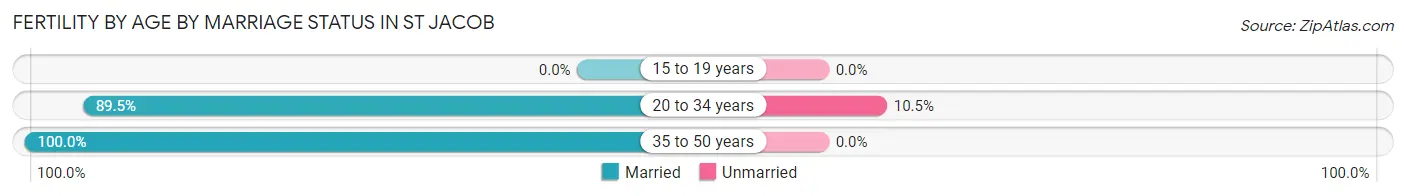
| Age Bracket | Married | Unmarried |
| 15 to 19 years | 0 (0.0%) | 0 (0.0%) |
| 20 to 34 years | 34 (89.5%) | 4 (10.5%) |
| 35 to 50 years | 8 (100.0%) | 0 (0.0%) |
| Total | 42 (91.3%) | 4 (8.7%) |
Fertility by Education in St Jacob
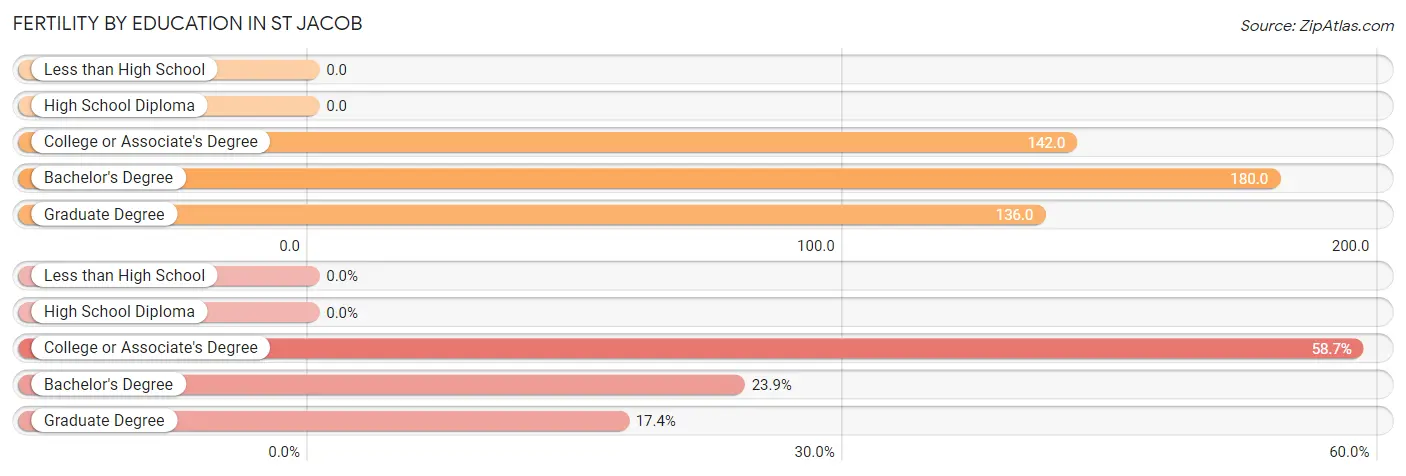
| Educational Attainment | Women with Births | Births / 1,000 Women |
| Less than High School | 0 (0.0%) | 0.0 |
| High School Diploma | 0 (0.0%) | 0.0 |
| College or Associate's Degree | 27 (58.7%) | 142.0 |
| Bachelor's Degree | 11 (23.9%) | 180.0 |
| Graduate Degree | 8 (17.4%) | 136.0 |
| Total | 46 (100.0%) | 117.0 |
Fertility by Education by Marriage Status in St Jacob
8.7% of women with births in St Jacob are unmarried. Women with the educational attainment of bachelor's degree are most likely to be married with 100.0% of them married at childbirth, while women with the educational attainment of college or associate's degree are least likely to be married with 14.8% of them unmarried at childbirth.
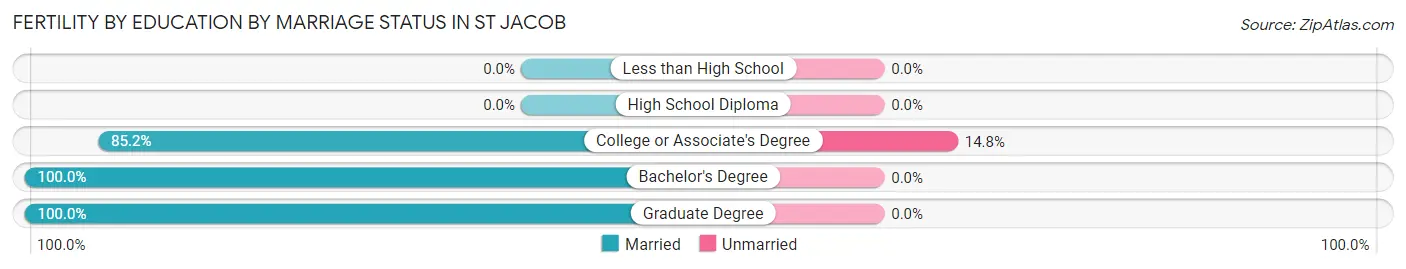
| Educational Attainment | Married | Unmarried |
| Less than High School | 0 (0.0%) | 0 (0.0%) |
| High School Diploma | 0 (0.0%) | 0 (0.0%) |
| College or Associate's Degree | 23 (85.2%) | 4 (14.8%) |
| Bachelor's Degree | 11 (100.0%) | 0 (0.0%) |
| Graduate Degree | 8 (100.0%) | 0 (0.0%) |
| Total | 42 (91.3%) | 4 (8.7%) |
Employment Characteristics in St Jacob
Employment by Class of Employer in St Jacob
Among the 749 employed individuals in St Jacob, private company employees (539 | 72.0%), not-for-profit organizations (80 | 10.7%), and local government employees (68 | 9.1%) make up the most common classes of employment.
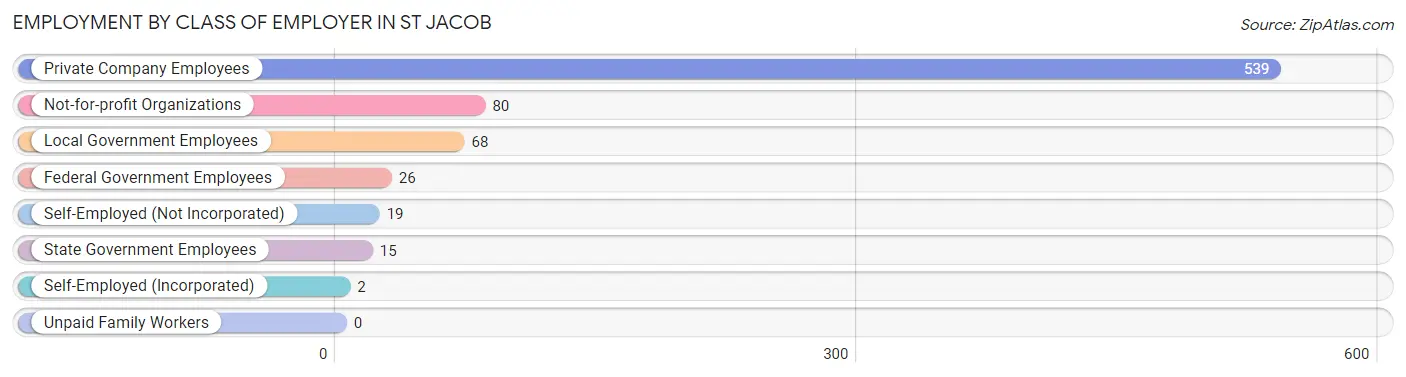
| Employer Class | # Employees | % Employees |
| Private Company Employees | 539 | 72.0% |
| Self-Employed (Incorporated) | 2 | 0.3% |
| Self-Employed (Not Incorporated) | 19 | 2.5% |
| Not-for-profit Organizations | 80 | 10.7% |
| Local Government Employees | 68 | 9.1% |
| State Government Employees | 15 | 2.0% |
| Federal Government Employees | 26 | 3.5% |
| Unpaid Family Workers | 0 | 0.0% |
| Total | 749 | 100.0% |
Employment Status by Age in St Jacob
According to the labor force statistics for St Jacob, out of the total population over 16 years of age (1,112), 69.7% or 775 individuals are in the labor force, with 1.8% or 14 of them unemployed. The age group with the highest labor force participation rate is 25 to 29 years, with 96.7% or 58 individuals in the labor force. Within the labor force, the 20 to 24 years age range has the highest percentage of unemployed individuals, with 5.5% or 3 of them being unemployed.
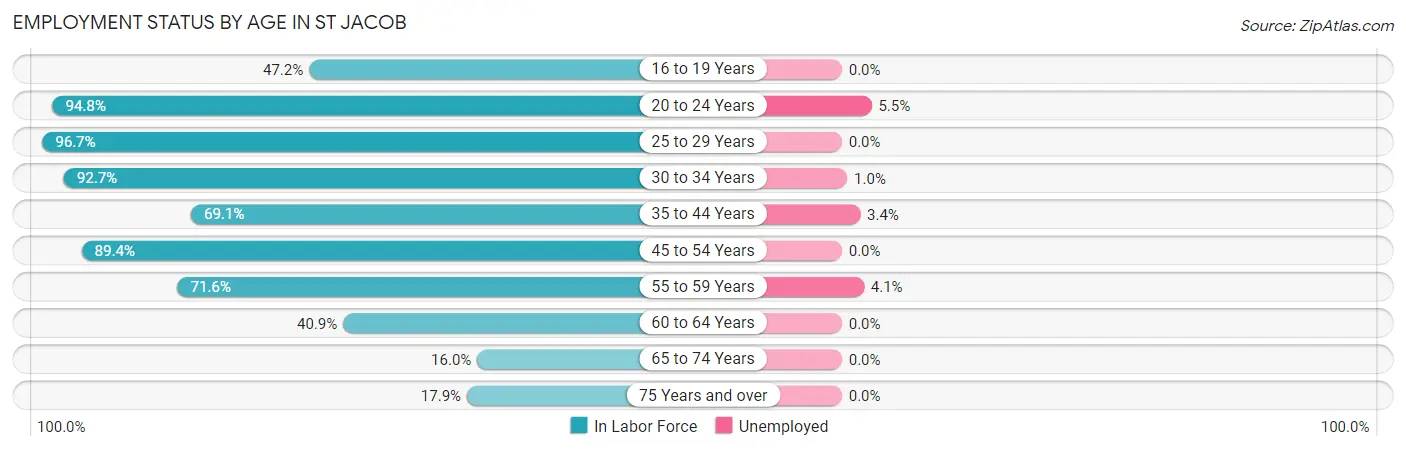
| Age Bracket | In Labor Force | Unemployed |
| 16 to 19 Years | 50 (47.2%) | 0 (0.0%) |
| 20 to 24 Years | 55 (94.8%) | 3 (5.5%) |
| 25 to 29 Years | 58 (96.7%) | 0 (0.0%) |
| 30 to 34 Years | 202 (92.7%) | 2 (1.0%) |
| 35 to 44 Years | 179 (69.1%) | 6 (3.4%) |
| 45 to 54 Years | 118 (89.4%) | 0 (0.0%) |
| 55 to 59 Years | 73 (71.6%) | 3 (4.1%) |
| 60 to 64 Years | 18 (40.9%) | 0 (0.0%) |
| 65 to 74 Years | 15 (16.0%) | 0 (0.0%) |
| 75 Years and over | 7 (17.9%) | 0 (0.0%) |
| Total | 775 (69.7%) | 14 (1.8%) |
Employment Status by Educational Attainment in St Jacob
According to labor force statistics for St Jacob, 79.5% of individuals (648) out of the total population between 25 and 64 years of age (815) are in the labor force, with 1.7% or 11 of them being unemployed. The group with the highest labor force participation rate are those with the educational attainment of college / associate degree, with 83.2% or 322 individuals in the labor force. Within the labor force, individuals with less than high school education have the highest percentage of unemployment, with 15.8% or 3 of them being unemployed.
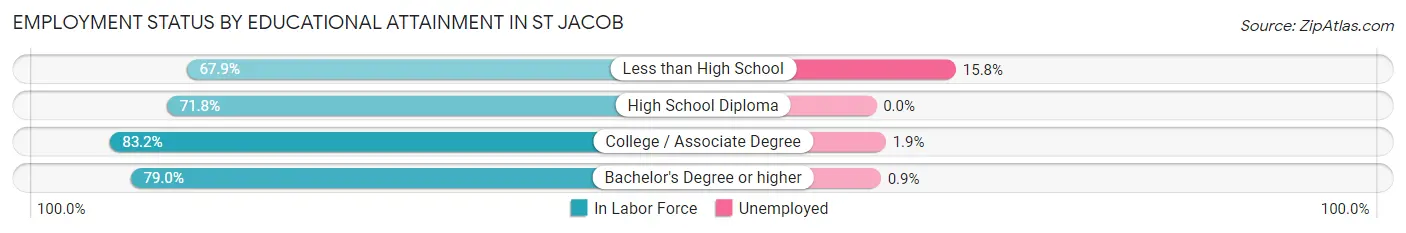
| Educational Attainment | In Labor Force | Unemployed |
| Less than High School | 19 (67.9%) | 4 (15.8%) |
| High School Diploma | 89 (71.8%) | 0 (0.0%) |
| College / Associate Degree | 322 (83.2%) | 7 (1.9%) |
| Bachelor's Degree or higher | 218 (79.0%) | 2 (0.9%) |
| Total | 648 (79.5%) | 14 (1.7%) |
Employment Occupations by Sex in St Jacob
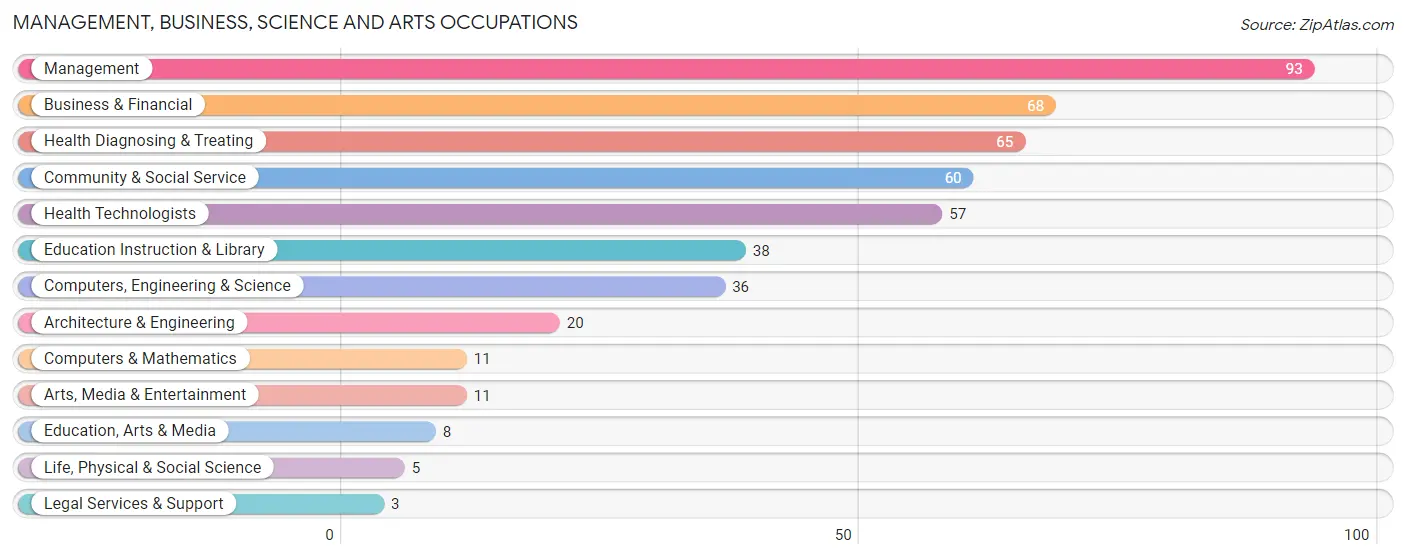
Management, Business, Science and Arts Occupations
The most common Management, Business, Science and Arts occupations in St Jacob are Management (93 | 12.3%), Business & Financial (68 | 9.0%), Health Diagnosing & Treating (65 | 8.6%), Community & Social Service (60 | 8.0%), and Health Technologists (57 | 7.6%).
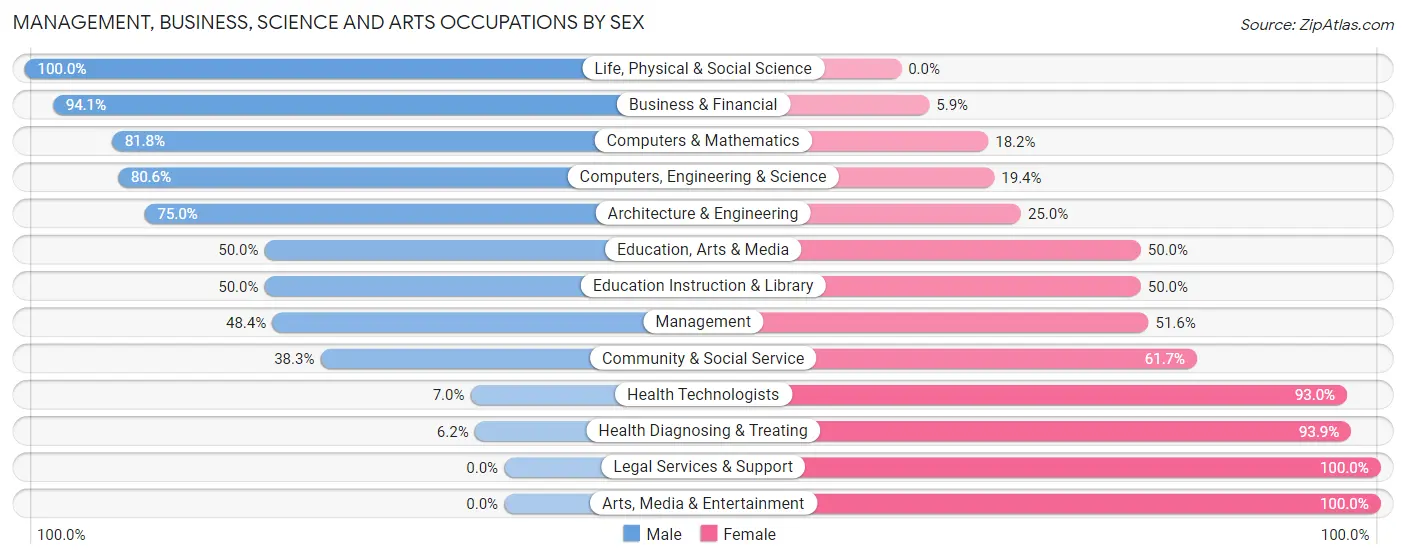
Management, Business, Science and Arts Occupations by Sex
Within the Management, Business, Science and Arts occupations in St Jacob, the most male-oriented occupations are Life, Physical & Social Science (100.0%), Business & Financial (94.1%), and Computers & Mathematics (81.8%), while the most female-oriented occupations are Legal Services & Support (100.0%), Arts, Media & Entertainment (100.0%), and Health Diagnosing & Treating (93.9%).
| Occupation | Male | Female |
| Management | 45 (48.4%) | 48 (51.6%) |
| Business & Financial | 64 (94.1%) | 4 (5.9%) |
| Computers, Engineering & Science | 29 (80.6%) | 7 (19.4%) |
| Computers & Mathematics | 9 (81.8%) | 2 (18.2%) |
| Architecture & Engineering | 15 (75.0%) | 5 (25.0%) |
| Life, Physical & Social Science | 5 (100.0%) | 0 (0.0%) |
| Community & Social Service | 23 (38.3%) | 37 (61.7%) |
| Education, Arts & Media | 4 (50.0%) | 4 (50.0%) |
| Legal Services & Support | 0 (0.0%) | 3 (100.0%) |
| Education Instruction & Library | 19 (50.0%) | 19 (50.0%) |
| Arts, Media & Entertainment | 0 (0.0%) | 11 (100.0%) |
| Health Diagnosing & Treating | 4 (6.1%) | 61 (93.9%) |
| Health Technologists | 4 (7.0%) | 53 (93.0%) |
| Total (Category) | 165 (51.2%) | 157 (48.8%) |
| Total (Overall) | 396 (52.5%) | 358 (47.5%) |
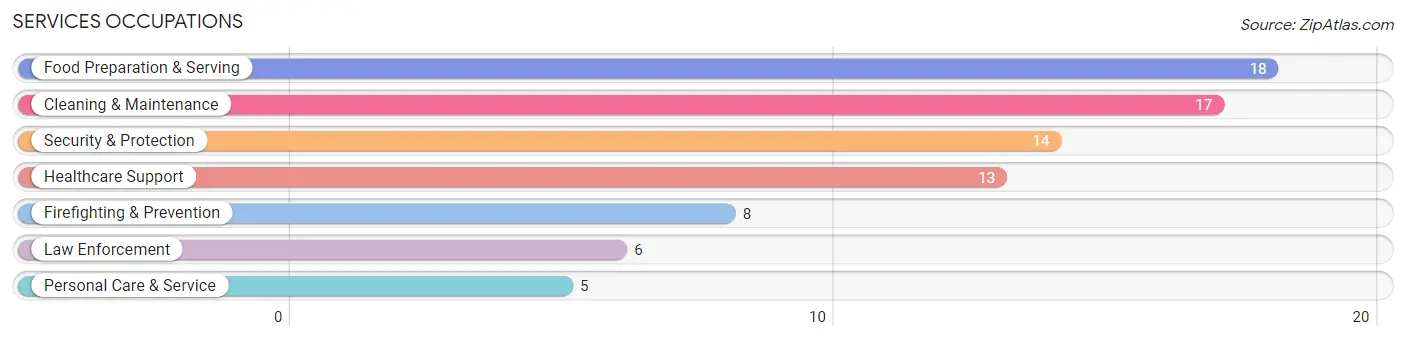
Services Occupations
The most common Services occupations in St Jacob are Food Preparation & Serving (18 | 2.4%), Cleaning & Maintenance (17 | 2.2%), Security & Protection (14 | 1.9%), Healthcare Support (13 | 1.7%), and Firefighting & Prevention (8 | 1.1%).
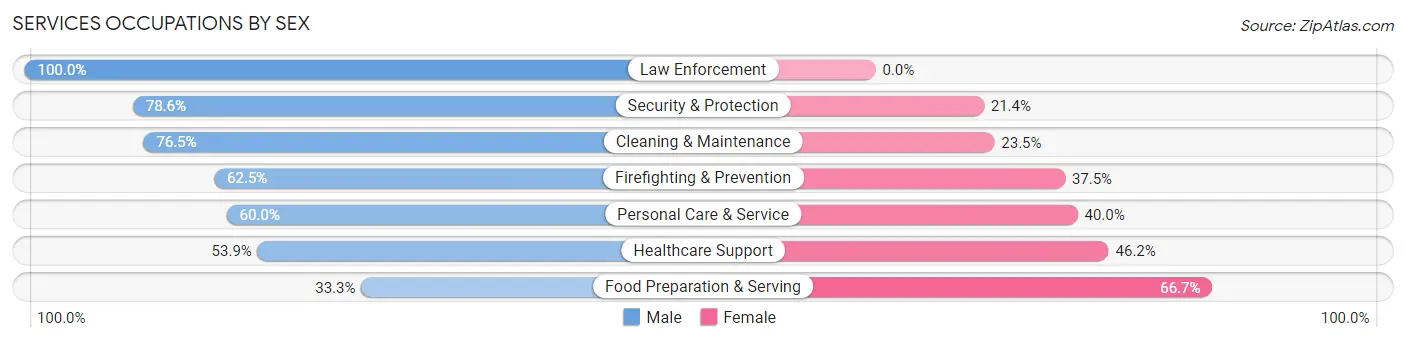
Services Occupations by Sex
Within the Services occupations in St Jacob, the most male-oriented occupations are Law Enforcement (100.0%), Security & Protection (78.6%), and Cleaning & Maintenance (76.5%), while the most female-oriented occupations are Food Preparation & Serving (66.7%), Healthcare Support (46.2%), and Personal Care & Service (40.0%).
| Occupation | Male | Female |
| Healthcare Support | 7 (53.8%) | 6 (46.2%) |
| Security & Protection | 11 (78.6%) | 3 (21.4%) |
| Firefighting & Prevention | 5 (62.5%) | 3 (37.5%) |
| Law Enforcement | 6 (100.0%) | 0 (0.0%) |
| Food Preparation & Serving | 6 (33.3%) | 12 (66.7%) |
| Cleaning & Maintenance | 13 (76.5%) | 4 (23.5%) |
| Personal Care & Service | 3 (60.0%) | 2 (40.0%) |
| Total (Category) | 40 (59.7%) | 27 (40.3%) |
| Total (Overall) | 396 (52.5%) | 358 (47.5%) |
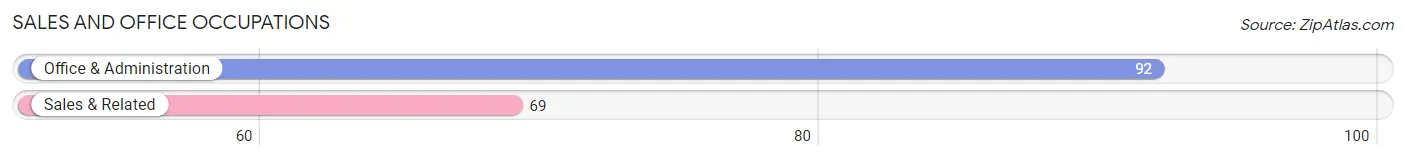
Sales and Office Occupations
The most common Sales and Office occupations in St Jacob are Office & Administration (92 | 12.2%), and Sales & Related (69 | 9.1%).
Sales and Office Occupations by Sex
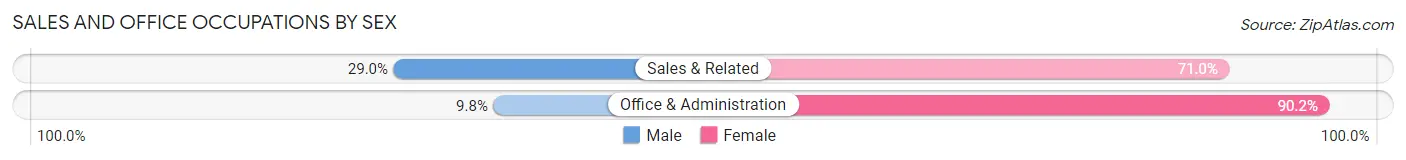
| Occupation | Male | Female |
| Sales & Related | 20 (29.0%) | 49 (71.0%) |
| Office & Administration | 9 (9.8%) | 83 (90.2%) |
| Total (Category) | 29 (18.0%) | 132 (82.0%) |
| Total (Overall) | 396 (52.5%) | 358 (47.5%) |
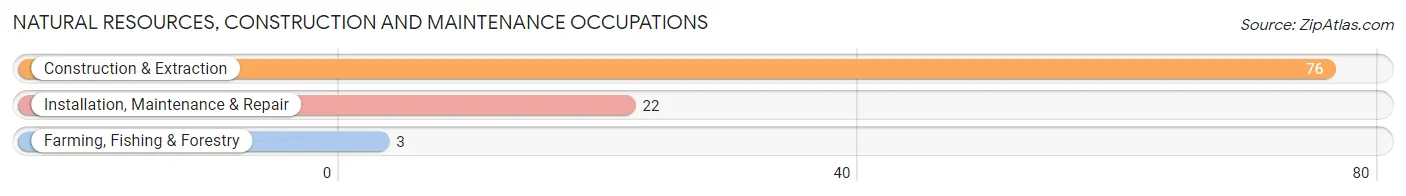
Natural Resources, Construction and Maintenance Occupations
The most common Natural Resources, Construction and Maintenance occupations in St Jacob are Construction & Extraction (76 | 10.1%), Installation, Maintenance & Repair (22 | 2.9%), and Farming, Fishing & Forestry (3 | 0.4%).
Natural Resources, Construction and Maintenance Occupations by Sex
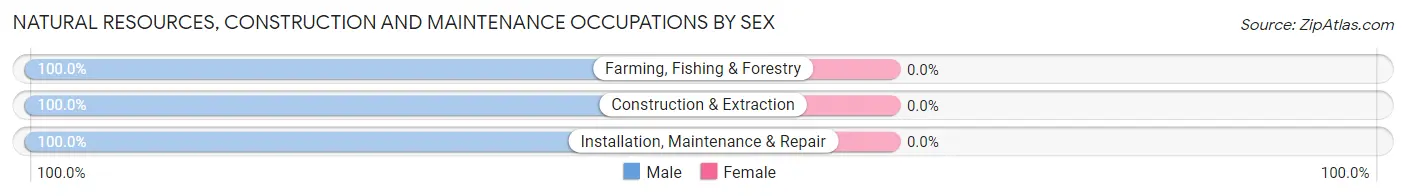
| Occupation | Male | Female |
| Farming, Fishing & Forestry | 3 (100.0%) | 0 (0.0%) |
| Construction & Extraction | 76 (100.0%) | 0 (0.0%) |
| Installation, Maintenance & Repair | 22 (100.0%) | 0 (0.0%) |
| Total (Category) | 101 (100.0%) | 0 (0.0%) |
| Total (Overall) | 396 (52.5%) | 358 (47.5%) |
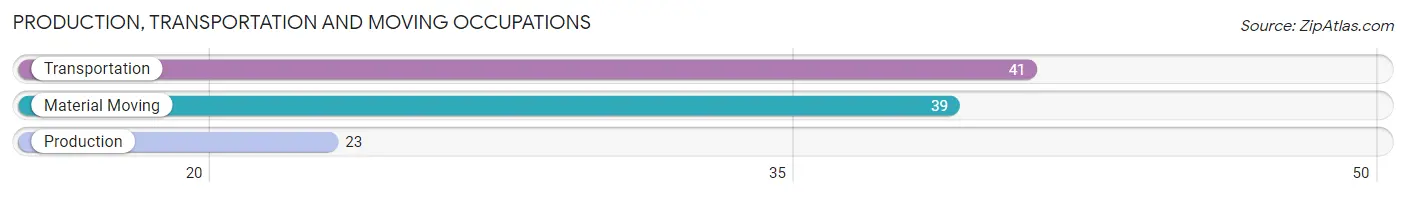
Production, Transportation and Moving Occupations
The most common Production, Transportation and Moving occupations in St Jacob are Transportation (41 | 5.4%), Material Moving (39 | 5.2%), and Production (23 | 3.0%).
Production, Transportation and Moving Occupations by Sex
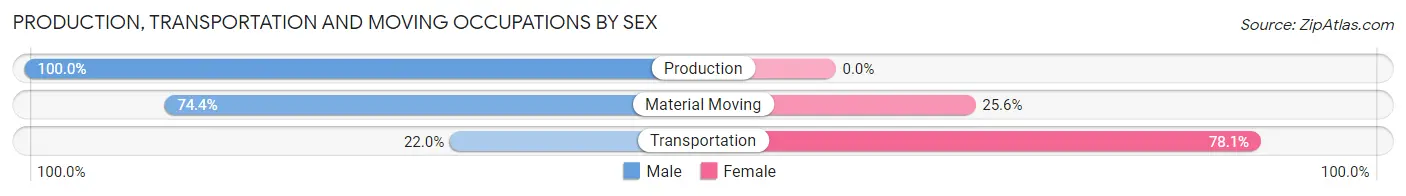
| Occupation | Male | Female |
| Production | 23 (100.0%) | 0 (0.0%) |
| Transportation | 9 (22.0%) | 32 (78.0%) |
| Material Moving | 29 (74.4%) | 10 (25.6%) |
| Total (Category) | 61 (59.2%) | 42 (40.8%) |
| Total (Overall) | 396 (52.5%) | 358 (47.5%) |
Employment Industries by Sex in St Jacob
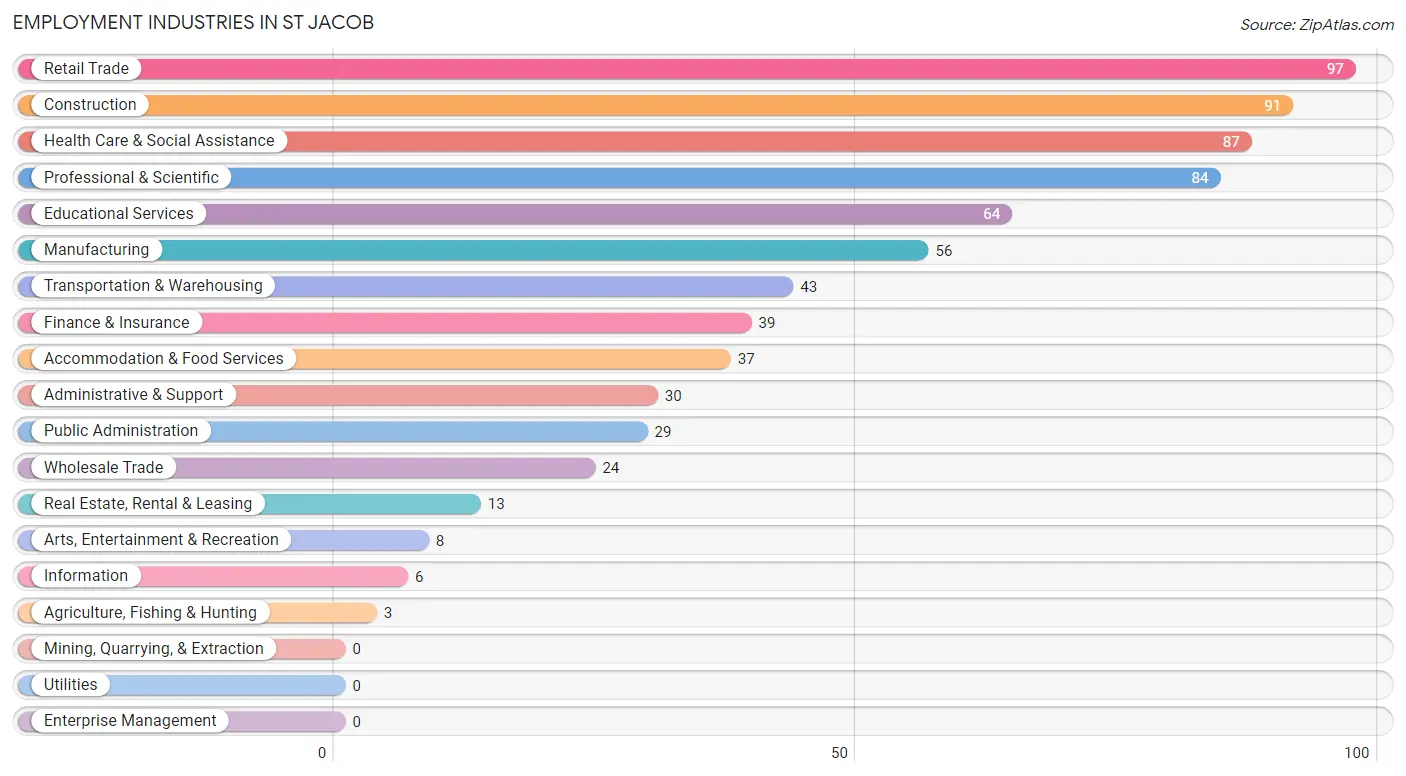
Employment Industries in St Jacob
The major employment industries in St Jacob include Retail Trade (97 | 12.9%), Construction (91 | 12.1%), Health Care & Social Assistance (87 | 11.5%), Professional & Scientific (84 | 11.1%), and Educational Services (64 | 8.5%).
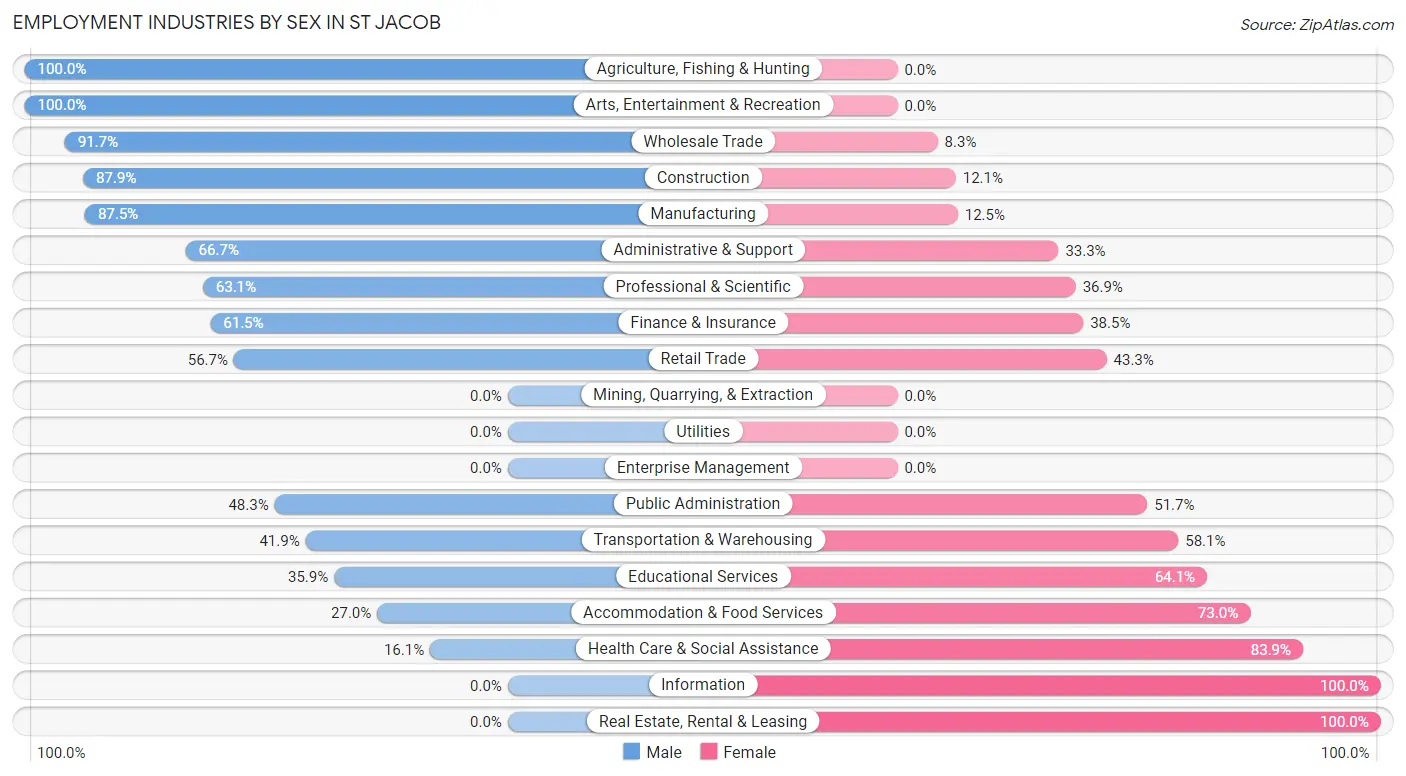
Employment Industries by Sex in St Jacob
The St Jacob industries that see more men than women are Agriculture, Fishing & Hunting (100.0%), Arts, Entertainment & Recreation (100.0%), and Wholesale Trade (91.7%), whereas the industries that tend to have a higher number of women are Information (100.0%), Real Estate, Rental & Leasing (100.0%), and Health Care & Social Assistance (83.9%).
| Industry | Male | Female |
| Agriculture, Fishing & Hunting | 3 (100.0%) | 0 (0.0%) |
| Mining, Quarrying, & Extraction | 0 (0.0%) | 0 (0.0%) |
| Construction | 80 (87.9%) | 11 (12.1%) |
| Manufacturing | 49 (87.5%) | 7 (12.5%) |
| Wholesale Trade | 22 (91.7%) | 2 (8.3%) |
| Retail Trade | 55 (56.7%) | 42 (43.3%) |
| Transportation & Warehousing | 18 (41.9%) | 25 (58.1%) |
| Utilities | 0 (0.0%) | 0 (0.0%) |
| Information | 0 (0.0%) | 6 (100.0%) |
| Finance & Insurance | 24 (61.5%) | 15 (38.5%) |
| Real Estate, Rental & Leasing | 0 (0.0%) | 13 (100.0%) |
| Professional & Scientific | 53 (63.1%) | 31 (36.9%) |
| Enterprise Management | 0 (0.0%) | 0 (0.0%) |
| Administrative & Support | 20 (66.7%) | 10 (33.3%) |
| Educational Services | 23 (35.9%) | 41 (64.1%) |
| Health Care & Social Assistance | 14 (16.1%) | 73 (83.9%) |
| Arts, Entertainment & Recreation | 8 (100.0%) | 0 (0.0%) |
| Accommodation & Food Services | 10 (27.0%) | 27 (73.0%) |
| Public Administration | 14 (48.3%) | 15 (51.7%) |
| Total | 396 (52.5%) | 358 (47.5%) |
Education in St Jacob
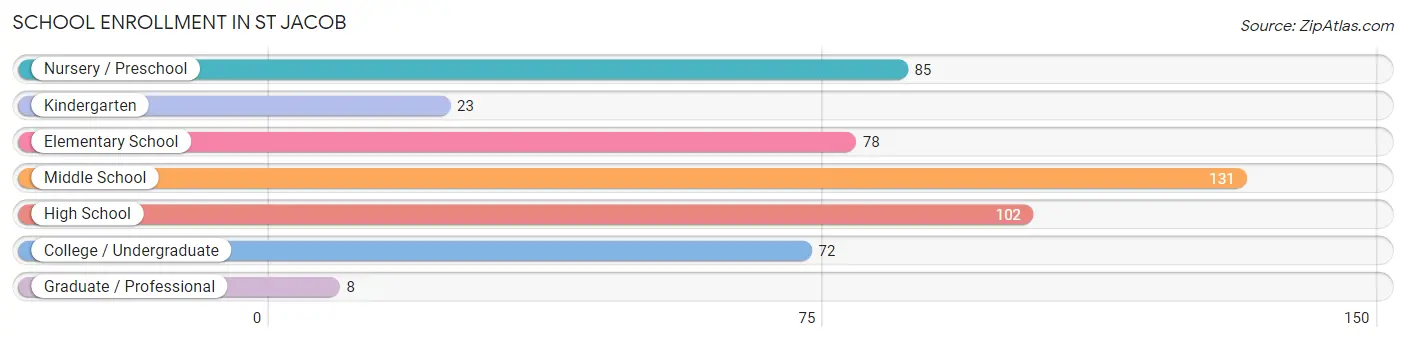
School Enrollment in St Jacob
The most common levels of schooling among the 499 students in St Jacob are middle school (131 | 26.3%), high school (102 | 20.4%), and nursery / preschool (85 | 17.0%).
| School Level | # Students | % Students |
| Nursery / Preschool | 85 | 17.0% |
| Kindergarten | 23 | 4.6% |
| Elementary School | 78 | 15.6% |
| Middle School | 131 | 26.3% |
| High School | 102 | 20.4% |
| College / Undergraduate | 72 | 14.4% |
| Graduate / Professional | 8 | 1.6% |
| Total | 499 | 100.0% |
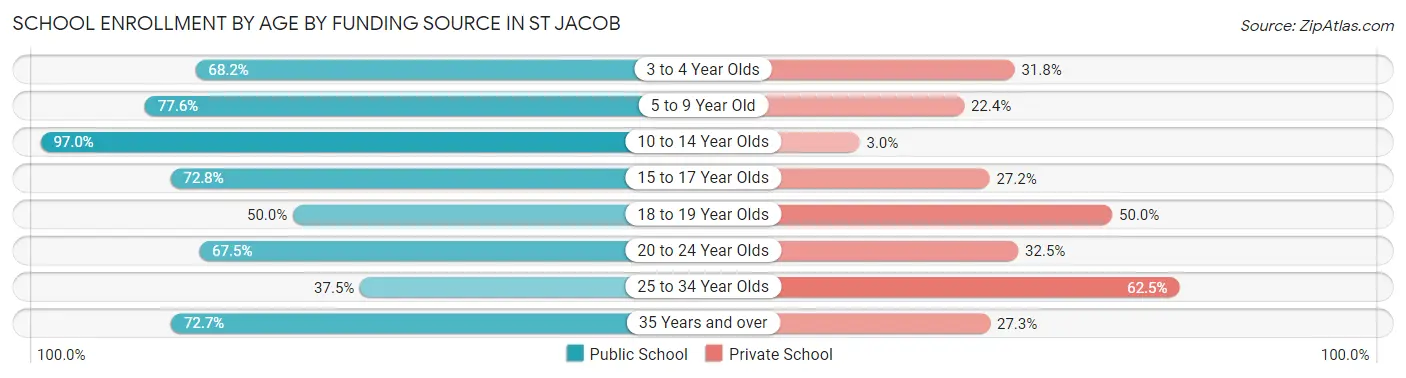
School Enrollment by Age by Funding Source in St Jacob
Out of a total of 499 students who are enrolled in schools in St Jacob, 115 (23.0%) attend a private institution, while the remaining 384 (77.0%) are enrolled in public schools. The age group of 25 to 34 year olds has the highest likelihood of being enrolled in private schools, with 5 (62.5% in the age bracket) enrolled. Conversely, the age group of 10 to 14 year olds has the lowest likelihood of being enrolled in a private school, with 131 (97.0% in the age bracket) attending a public institution.
| Age Bracket | Public School | Private School |
| 3 to 4 Year Olds | 45 (68.2%) | 21 (31.8%) |
| 5 to 9 Year Old | 90 (77.6%) | 26 (22.4%) |
| 10 to 14 Year Olds | 131 (97.0%) | 4 (3.0%) |
| 15 to 17 Year Olds | 59 (72.8%) | 22 (27.2%) |
| 18 to 19 Year Olds | 21 (50.0%) | 21 (50.0%) |
| 20 to 24 Year Olds | 27 (67.5%) | 13 (32.5%) |
| 25 to 34 Year Olds | 3 (37.5%) | 5 (62.5%) |
| 35 Years and over | 8 (72.7%) | 3 (27.3%) |
| Total | 384 (77.0%) | 115 (23.0%) |
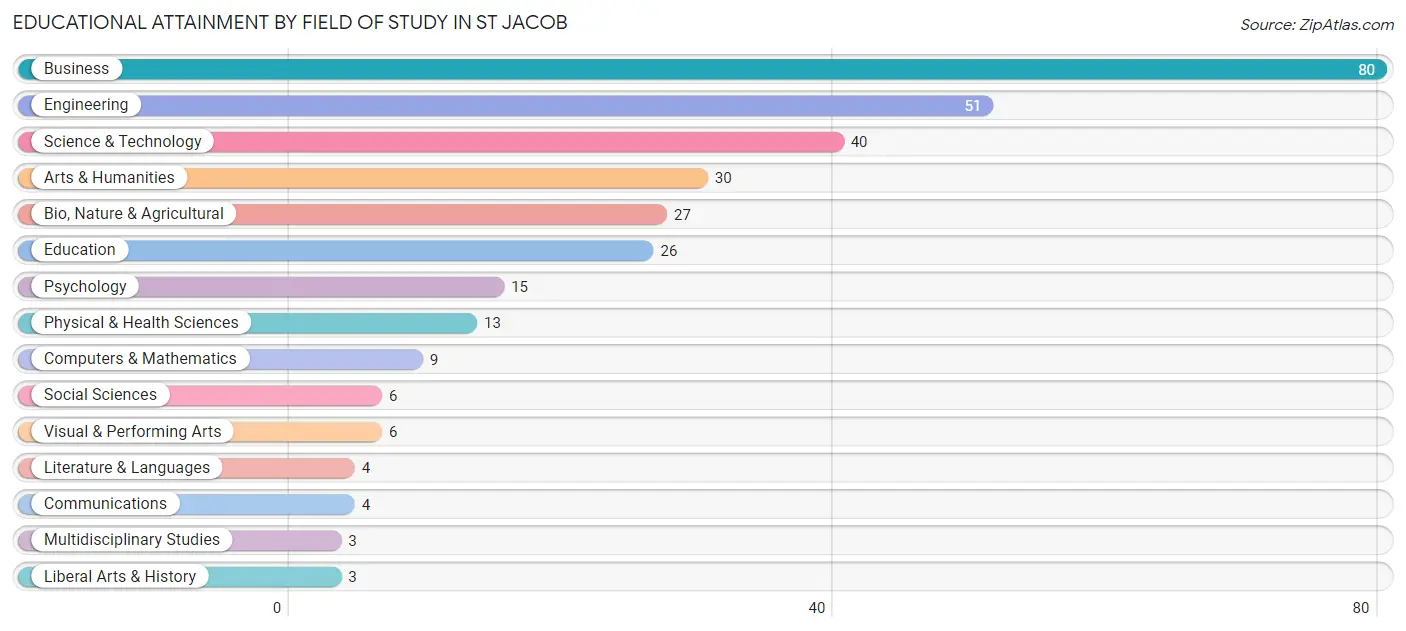
Educational Attainment by Field of Study in St Jacob
Business (80 | 25.2%), engineering (51 | 16.1%), science & technology (40 | 12.6%), arts & humanities (30 | 9.5%), and bio, nature & agricultural (27 | 8.5%) are the most common fields of study among 317 individuals in St Jacob who have obtained a bachelor's degree or higher.
| Field of Study | # Graduates | % Graduates |
| Computers & Mathematics | 9 | 2.8% |
| Bio, Nature & Agricultural | 27 | 8.5% |
| Physical & Health Sciences | 13 | 4.1% |
| Psychology | 15 | 4.7% |
| Social Sciences | 6 | 1.9% |
| Engineering | 51 | 16.1% |
| Multidisciplinary Studies | 3 | 0.9% |
| Science & Technology | 40 | 12.6% |
| Business | 80 | 25.2% |
| Education | 26 | 8.2% |
| Literature & Languages | 4 | 1.3% |
| Liberal Arts & History | 3 | 0.9% |
| Visual & Performing Arts | 6 | 1.9% |
| Communications | 4 | 1.3% |
| Arts & Humanities | 30 | 9.5% |
| Total | 317 | 100.0% |
Transportation & Commute in St Jacob
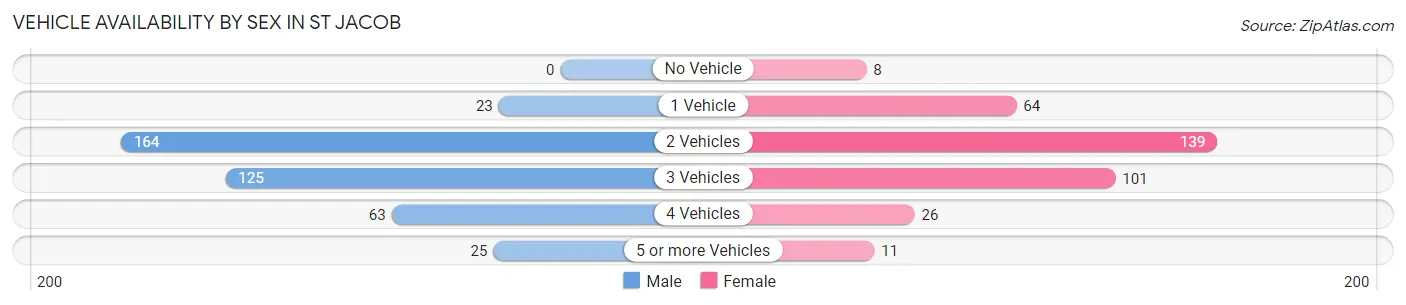
Vehicle Availability by Sex in St Jacob
The most prevalent vehicle ownership categories in St Jacob are males with 2 vehicles (164, accounting for 41.0%) and females with 2 vehicles (139, making up 47.0%).
| Vehicles Available | Male | Female |
| No Vehicle | 0 (0.0%) | 8 (2.3%) |
| 1 Vehicle | 23 (5.8%) | 64 (18.3%) |
| 2 Vehicles | 164 (41.0%) | 139 (39.8%) |
| 3 Vehicles | 125 (31.2%) | 101 (28.9%) |
| 4 Vehicles | 63 (15.8%) | 26 (7.4%) |
| 5 or more Vehicles | 25 (6.2%) | 11 (3.2%) |
| Total | 400 (100.0%) | 349 (100.0%) |
Commute Time in St Jacob
The most frequently occuring commute durations in St Jacob are 30 to 34 minutes (150 commuters, 21.6%), 40 to 44 minutes (119 commuters, 17.1%), and 20 to 24 minutes (113 commuters, 16.3%).
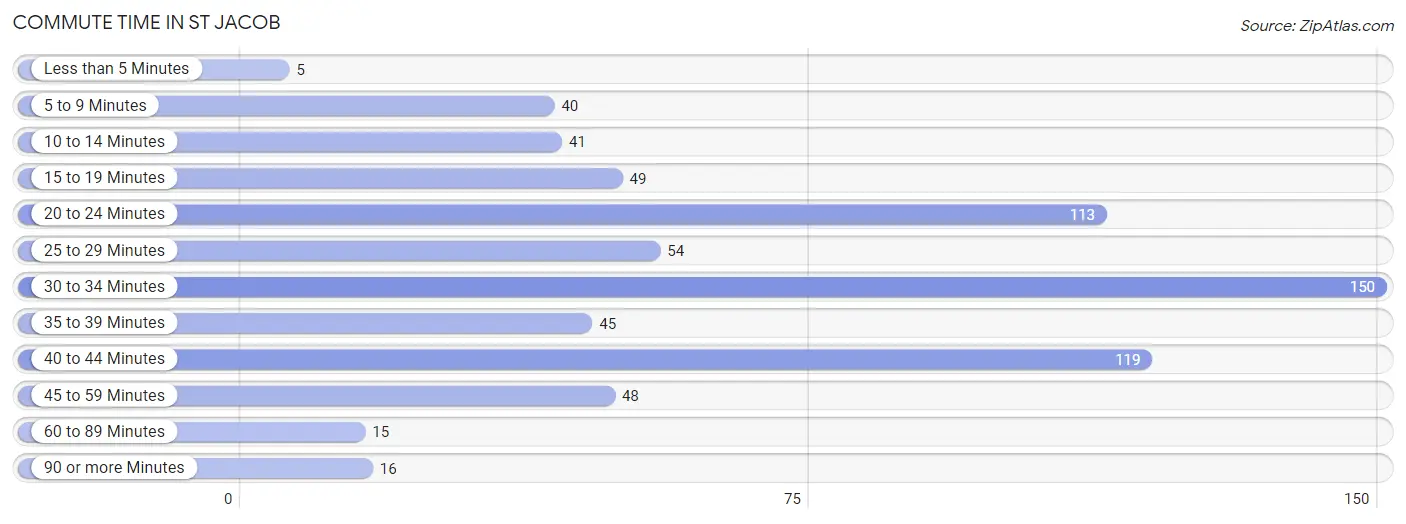
| Commute Time | # Commuters | % Commuters |
| Less than 5 Minutes | 5 | 0.7% |
| 5 to 9 Minutes | 40 | 5.8% |
| 10 to 14 Minutes | 41 | 5.9% |
| 15 to 19 Minutes | 49 | 7.0% |
| 20 to 24 Minutes | 113 | 16.3% |
| 25 to 29 Minutes | 54 | 7.8% |
| 30 to 34 Minutes | 150 | 21.6% |
| 35 to 39 Minutes | 45 | 6.5% |
| 40 to 44 Minutes | 119 | 17.1% |
| 45 to 59 Minutes | 48 | 6.9% |
| 60 to 89 Minutes | 15 | 2.2% |
| 90 or more Minutes | 16 | 2.3% |
Commute Time by Sex in St Jacob
The most common commute times in St Jacob are 40 to 44 minutes (97 commuters, 25.0%) for males and 30 to 34 minutes (54 commuters, 17.6%) for females.
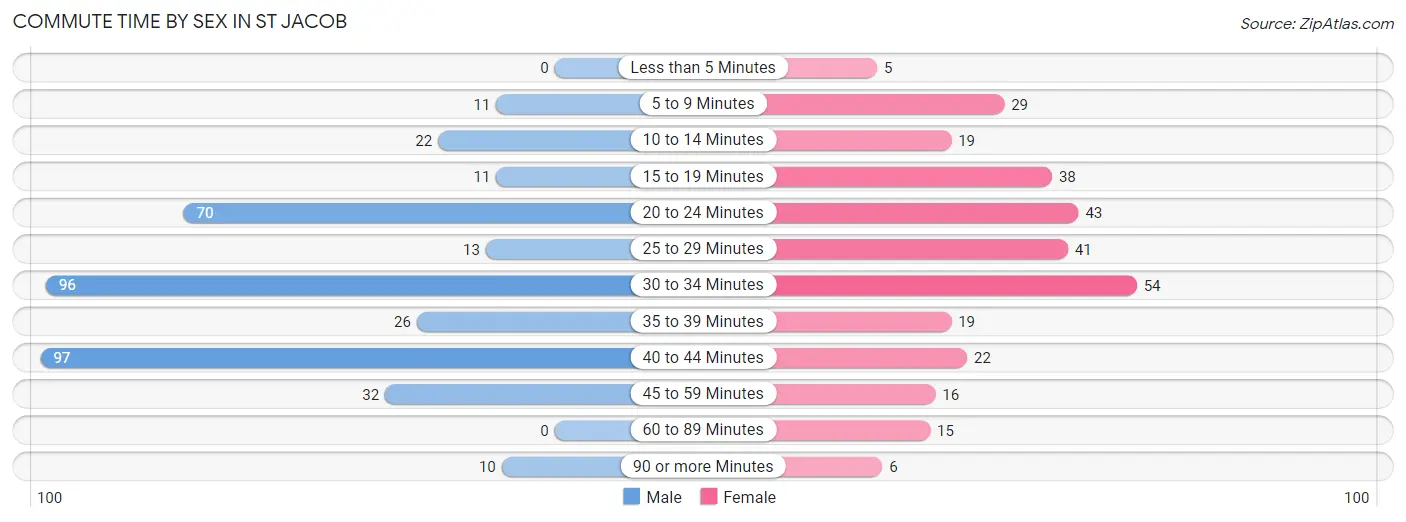
| Commute Time | Male | Female |
| Less than 5 Minutes | 0 (0.0%) | 5 (1.6%) |
| 5 to 9 Minutes | 11 (2.8%) | 29 (9.5%) |
| 10 to 14 Minutes | 22 (5.7%) | 19 (6.2%) |
| 15 to 19 Minutes | 11 (2.8%) | 38 (12.4%) |
| 20 to 24 Minutes | 70 (18.0%) | 43 (14.0%) |
| 25 to 29 Minutes | 13 (3.4%) | 41 (13.4%) |
| 30 to 34 Minutes | 96 (24.7%) | 54 (17.6%) |
| 35 to 39 Minutes | 26 (6.7%) | 19 (6.2%) |
| 40 to 44 Minutes | 97 (25.0%) | 22 (7.2%) |
| 45 to 59 Minutes | 32 (8.3%) | 16 (5.2%) |
| 60 to 89 Minutes | 0 (0.0%) | 15 (4.9%) |
| 90 or more Minutes | 10 (2.6%) | 6 (1.9%) |
Time of Departure to Work by Sex in St Jacob
The most frequent times of departure to work in St Jacob are 6:30 AM to 6:59 AM (108, 27.8%) for males and 7:00 AM to 7:29 AM (121, 39.4%) for females.
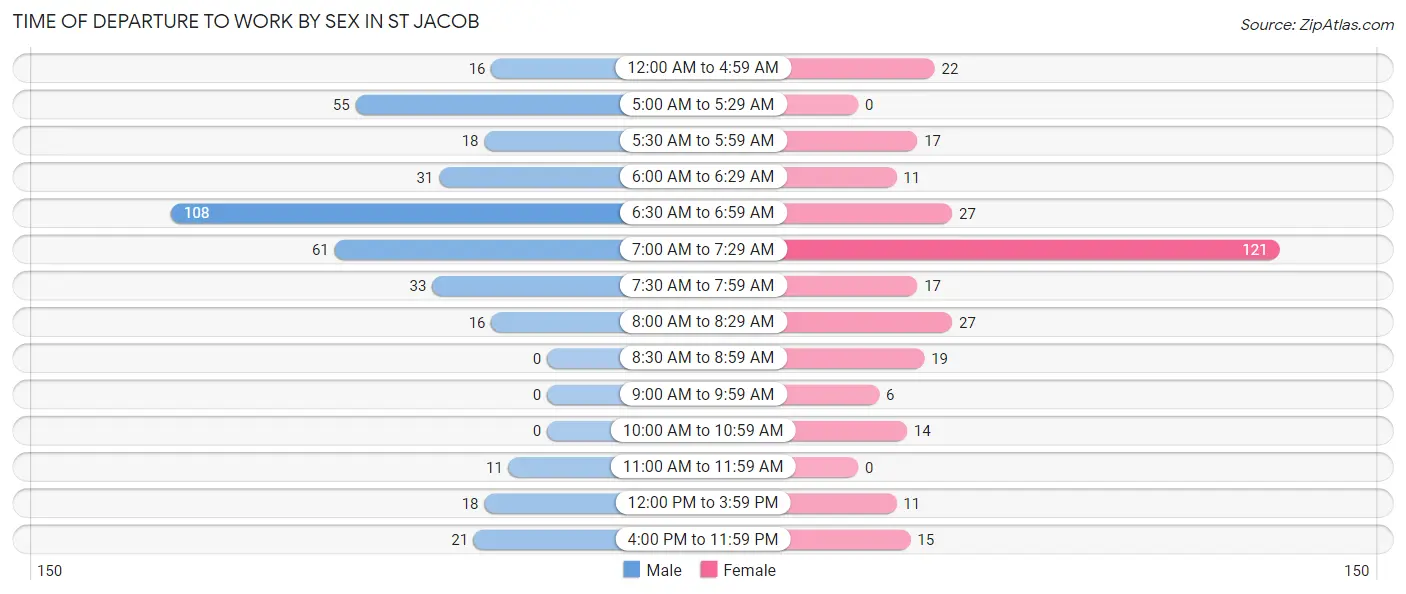
| Time of Departure | Male | Female |
| 12:00 AM to 4:59 AM | 16 (4.1%) | 22 (7.2%) |
| 5:00 AM to 5:29 AM | 55 (14.2%) | 0 (0.0%) |
| 5:30 AM to 5:59 AM | 18 (4.6%) | 17 (5.5%) |
| 6:00 AM to 6:29 AM | 31 (8.0%) | 11 (3.6%) |
| 6:30 AM to 6:59 AM | 108 (27.8%) | 27 (8.8%) |
| 7:00 AM to 7:29 AM | 61 (15.7%) | 121 (39.4%) |
| 7:30 AM to 7:59 AM | 33 (8.5%) | 17 (5.5%) |
| 8:00 AM to 8:29 AM | 16 (4.1%) | 27 (8.8%) |
| 8:30 AM to 8:59 AM | 0 (0.0%) | 19 (6.2%) |
| 9:00 AM to 9:59 AM | 0 (0.0%) | 6 (1.9%) |
| 10:00 AM to 10:59 AM | 0 (0.0%) | 14 (4.6%) |
| 11:00 AM to 11:59 AM | 11 (2.8%) | 0 (0.0%) |
| 12:00 PM to 3:59 PM | 18 (4.6%) | 11 (3.6%) |
| 4:00 PM to 11:59 PM | 21 (5.4%) | 15 (4.9%) |
| Total | 388 (100.0%) | 307 (100.0%) |
Housing Occupancy in St Jacob
Occupancy by Ownership in St Jacob
Of the total 540 dwellings in St Jacob, owner-occupied units account for 468 (86.7%), while renter-occupied units make up 72 (13.3%).
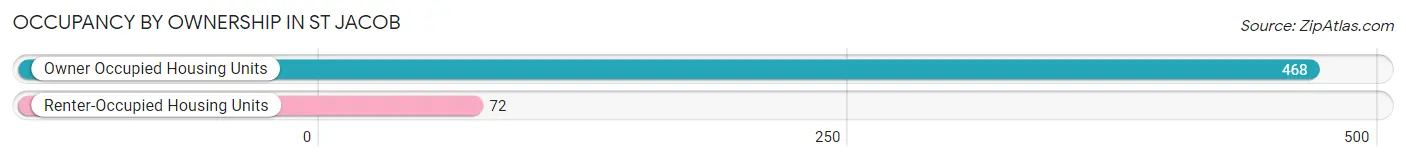
| Occupancy | # Housing Units | % Housing Units |
| Owner Occupied Housing Units | 468 | 86.7% |
| Renter-Occupied Housing Units | 72 | 13.3% |
| Total Occupied Housing Units | 540 | 100.0% |
Occupancy by Household Size in St Jacob
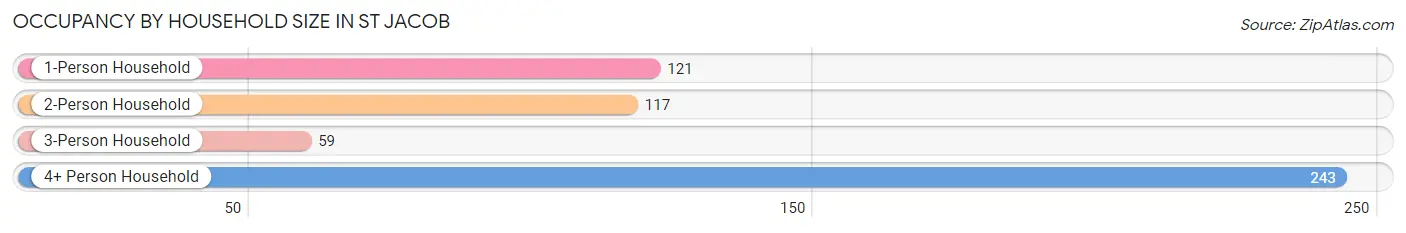
| Household Size | # Housing Units | % Housing Units |
| 1-Person Household | 121 | 22.4% |
| 2-Person Household | 117 | 21.7% |
| 3-Person Household | 59 | 10.9% |
| 4+ Person Household | 243 | 45.0% |
| Total Housing Units | 540 | 100.0% |
Occupancy by Ownership by Household Size in St Jacob
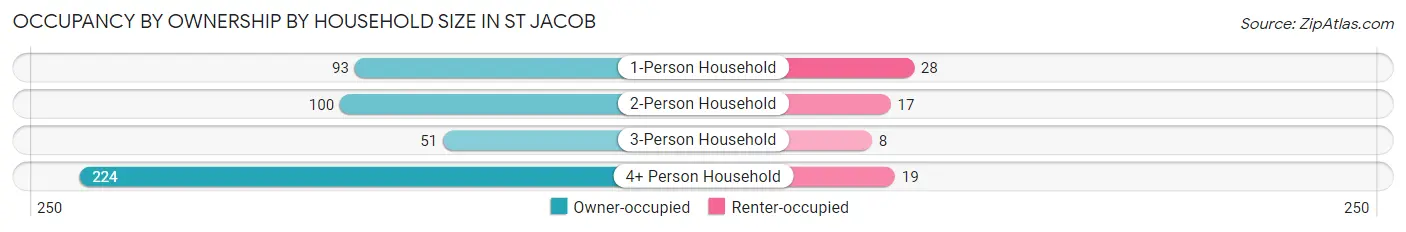
| Household Size | Owner-occupied | Renter-occupied |
| 1-Person Household | 93 (76.9%) | 28 (23.1%) |
| 2-Person Household | 100 (85.5%) | 17 (14.5%) |
| 3-Person Household | 51 (86.4%) | 8 (13.6%) |
| 4+ Person Household | 224 (92.2%) | 19 (7.8%) |
| Total Housing Units | 468 (86.7%) | 72 (13.3%) |
Occupancy by Educational Attainment in St Jacob
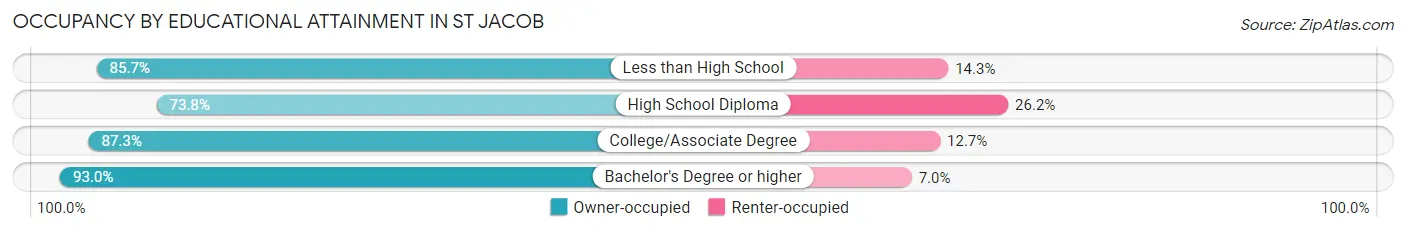
| Household Size | Owner-occupied | Renter-occupied |
| Less than High School | 18 (85.7%) | 3 (14.3%) |
| High School Diploma | 79 (73.8%) | 28 (26.2%) |
| College/Associate Degree | 186 (87.3%) | 27 (12.7%) |
| Bachelor's Degree or higher | 185 (93.0%) | 14 (7.0%) |
Occupancy by Age of Householder in St Jacob
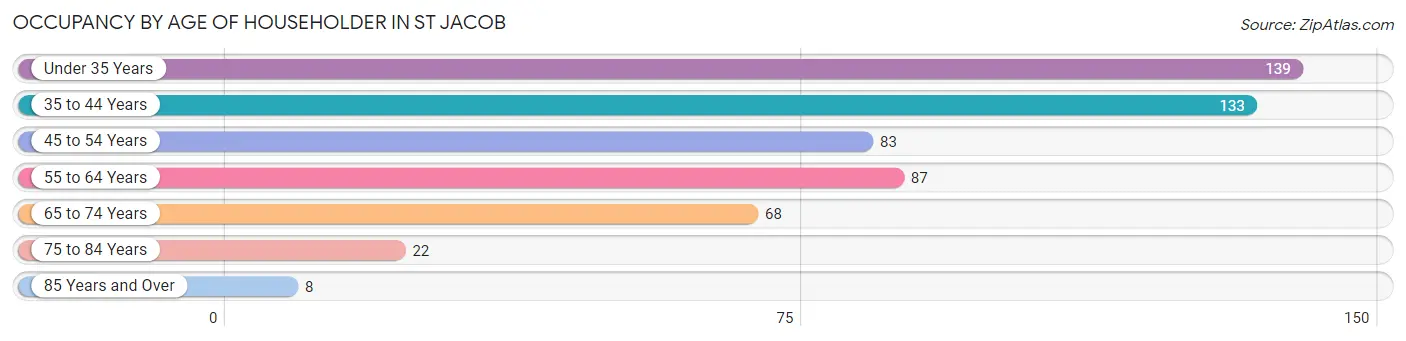
| Age Bracket | # Households | % Households |
| Under 35 Years | 139 | 25.7% |
| 35 to 44 Years | 133 | 24.6% |
| 45 to 54 Years | 83 | 15.4% |
| 55 to 64 Years | 87 | 16.1% |
| 65 to 74 Years | 68 | 12.6% |
| 75 to 84 Years | 22 | 4.1% |
| 85 Years and Over | 8 | 1.5% |
| Total | 540 | 100.0% |
Housing Finances in St Jacob
Median Income by Occupancy in St Jacob
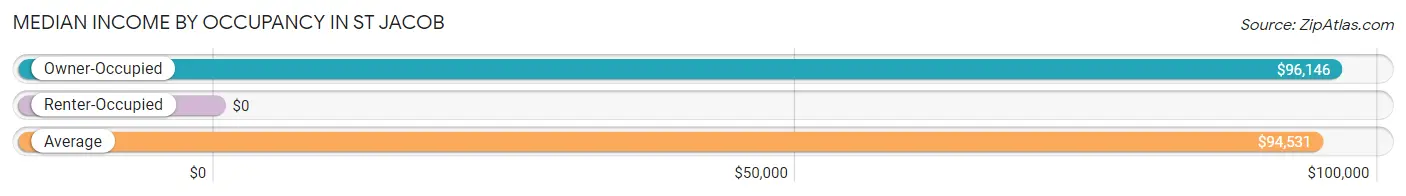
| Occupancy Type | # Households | Median Income |
| Owner-Occupied | 468 (86.7%) | $96,146 |
| Renter-Occupied | 72 (13.3%) | $0 |
| Average | 540 (100.0%) | $94,531 |
Occupancy by Householder Income Bracket in St Jacob
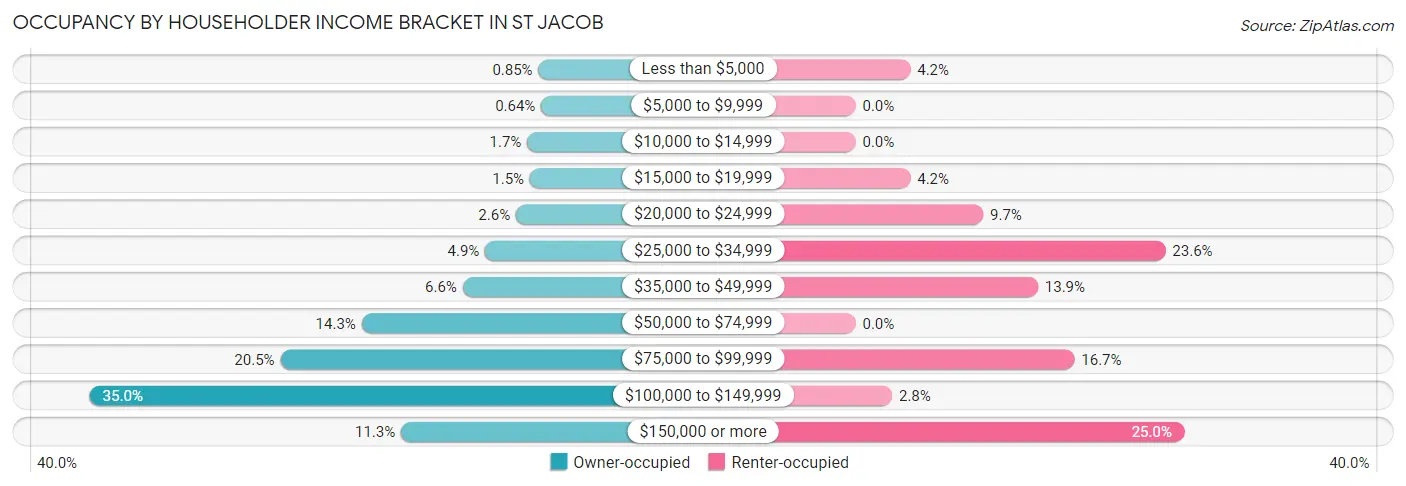
| Income Bracket | Owner-occupied | Renter-occupied |
| Less than $5,000 | 4 (0.9%) | 3 (4.2%) |
| $5,000 to $9,999 | 3 (0.6%) | 0 (0.0%) |
| $10,000 to $14,999 | 8 (1.7%) | 0 (0.0%) |
| $15,000 to $19,999 | 7 (1.5%) | 3 (4.2%) |
| $20,000 to $24,999 | 12 (2.6%) | 7 (9.7%) |
| $25,000 to $34,999 | 23 (4.9%) | 17 (23.6%) |
| $35,000 to $49,999 | 31 (6.6%) | 10 (13.9%) |
| $50,000 to $74,999 | 67 (14.3%) | 0 (0.0%) |
| $75,000 to $99,999 | 96 (20.5%) | 12 (16.7%) |
| $100,000 to $149,999 | 164 (35.0%) | 2 (2.8%) |
| $150,000 or more | 53 (11.3%) | 18 (25.0%) |
| Total | 468 (100.0%) | 72 (100.0%) |
Monthly Housing Cost Tiers in St Jacob
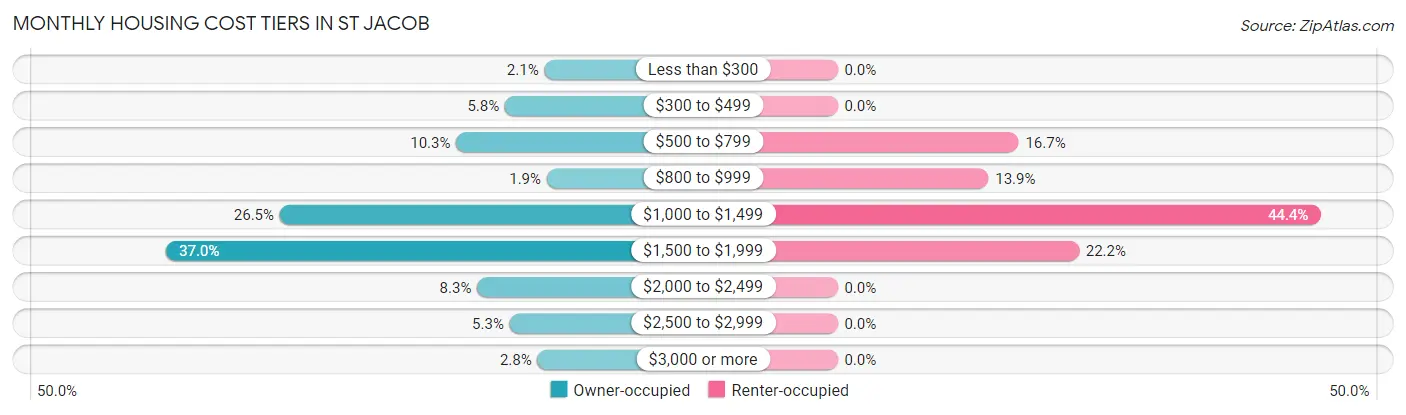
| Monthly Cost | Owner-occupied | Renter-occupied |
| Less than $300 | 10 (2.1%) | 0 (0.0%) |
| $300 to $499 | 27 (5.8%) | 0 (0.0%) |
| $500 to $799 | 48 (10.3%) | 12 (16.7%) |
| $800 to $999 | 9 (1.9%) | 10 (13.9%) |
| $1,000 to $1,499 | 124 (26.5%) | 32 (44.4%) |
| $1,500 to $1,999 | 173 (37.0%) | 16 (22.2%) |
| $2,000 to $2,499 | 39 (8.3%) | 0 (0.0%) |
| $2,500 to $2,999 | 25 (5.3%) | 0 (0.0%) |
| $3,000 or more | 13 (2.8%) | 0 (0.0%) |
| Total | 468 (100.0%) | 72 (100.0%) |
Physical Housing Characteristics in St Jacob
Housing Structures in St Jacob
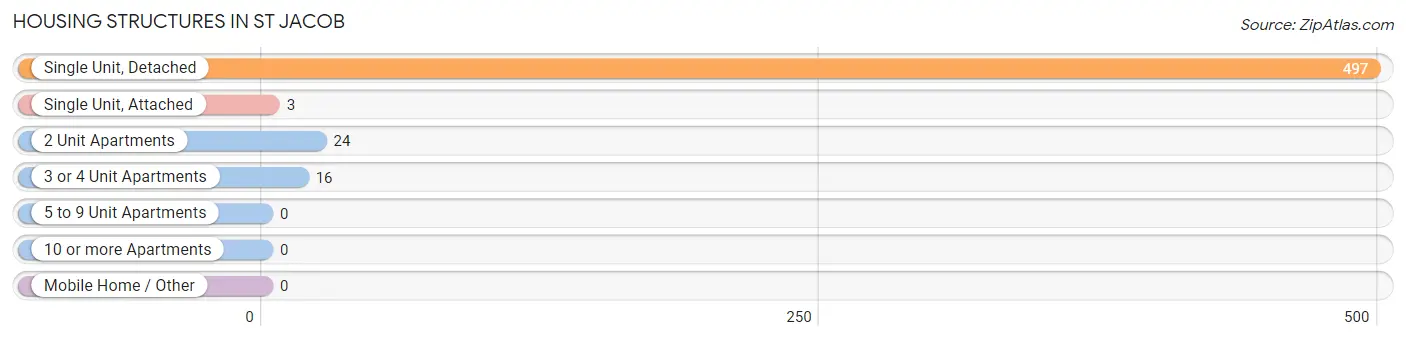
| Structure Type | # Housing Units | % Housing Units |
| Single Unit, Detached | 497 | 92.0% |
| Single Unit, Attached | 3 | 0.6% |
| 2 Unit Apartments | 24 | 4.4% |
| 3 or 4 Unit Apartments | 16 | 3.0% |
| 5 to 9 Unit Apartments | 0 | 0.0% |
| 10 or more Apartments | 0 | 0.0% |
| Mobile Home / Other | 0 | 0.0% |
| Total | 540 | 100.0% |
Housing Structures by Occupancy in St Jacob
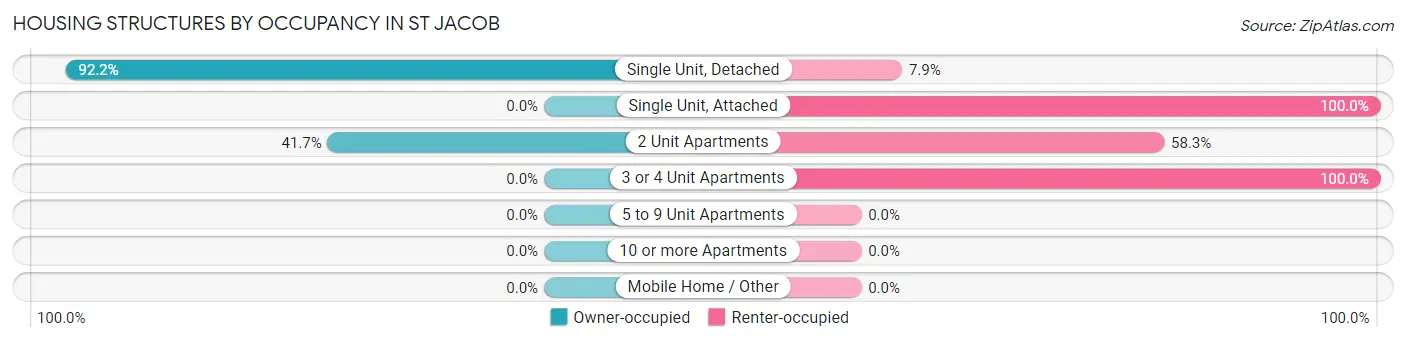
| Structure Type | Owner-occupied | Renter-occupied |
| Single Unit, Detached | 458 (92.1%) | 39 (7.9%) |
| Single Unit, Attached | 0 (0.0%) | 3 (100.0%) |
| 2 Unit Apartments | 10 (41.7%) | 14 (58.3%) |
| 3 or 4 Unit Apartments | 0 (0.0%) | 16 (100.0%) |
| 5 to 9 Unit Apartments | 0 (0.0%) | 0 (0.0%) |
| 10 or more Apartments | 0 (0.0%) | 0 (0.0%) |
| Mobile Home / Other | 0 (0.0%) | 0 (0.0%) |
| Total | 468 (86.7%) | 72 (13.3%) |
Housing Structures by Number of Rooms in St Jacob
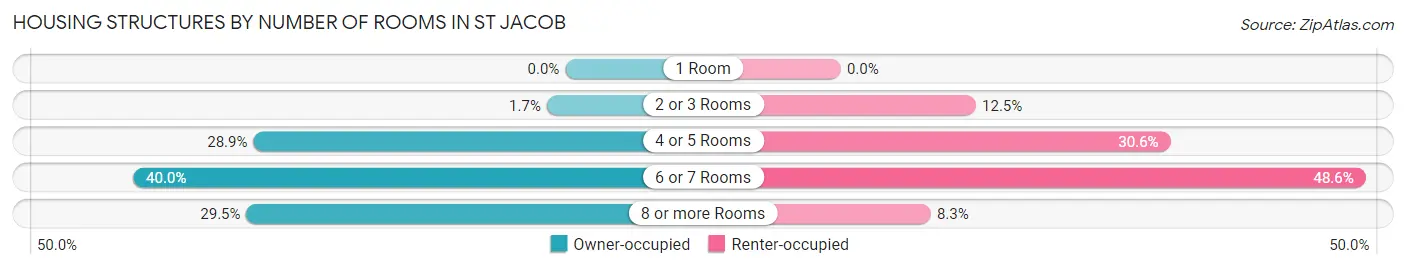
| Number of Rooms | Owner-occupied | Renter-occupied |
| 1 Room | 0 (0.0%) | 0 (0.0%) |
| 2 or 3 Rooms | 8 (1.7%) | 9 (12.5%) |
| 4 or 5 Rooms | 135 (28.8%) | 22 (30.6%) |
| 6 or 7 Rooms | 187 (40.0%) | 35 (48.6%) |
| 8 or more Rooms | 138 (29.5%) | 6 (8.3%) |
| Total | 468 (100.0%) | 72 (100.0%) |
Housing Structure by Heating Type in St Jacob
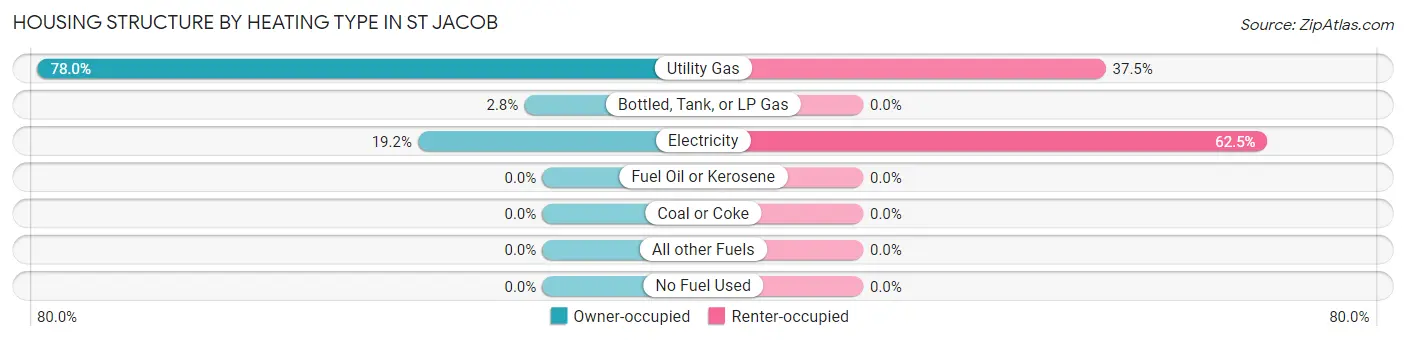
| Heating Type | Owner-occupied | Renter-occupied |
| Utility Gas | 365 (78.0%) | 27 (37.5%) |
| Bottled, Tank, or LP Gas | 13 (2.8%) | 0 (0.0%) |
| Electricity | 90 (19.2%) | 45 (62.5%) |
| Fuel Oil or Kerosene | 0 (0.0%) | 0 (0.0%) |
| Coal or Coke | 0 (0.0%) | 0 (0.0%) |
| All other Fuels | 0 (0.0%) | 0 (0.0%) |
| No Fuel Used | 0 (0.0%) | 0 (0.0%) |
| Total | 468 (100.0%) | 72 (100.0%) |
Household Vehicle Usage in St Jacob
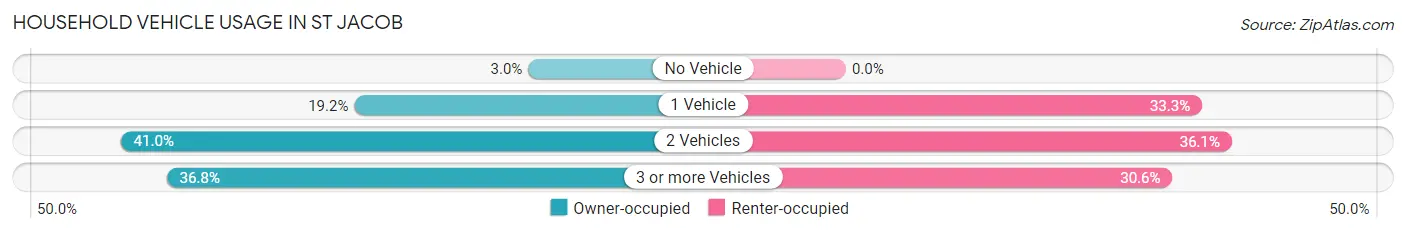
| Vehicles per Household | Owner-occupied | Renter-occupied |
| No Vehicle | 14 (3.0%) | 0 (0.0%) |
| 1 Vehicle | 90 (19.2%) | 24 (33.3%) |
| 2 Vehicles | 192 (41.0%) | 26 (36.1%) |
| 3 or more Vehicles | 172 (36.7%) | 22 (30.6%) |
| Total | 468 (100.0%) | 72 (100.0%) |
Real Estate & Mortgages in St Jacob
Real Estate and Mortgage Overview in St Jacob
| Characteristic | Without Mortgage | With Mortgage |
| Housing Units | 91 | 377 |
| Median Property Value | $133,800 | $201,400 |
| Median Household Income | $35,625 | $47 |
| Monthly Housing Costs | $572 | $13 |
| Real Estate Taxes | $2,800 | $0 |
Property Value by Mortgage Status in St Jacob
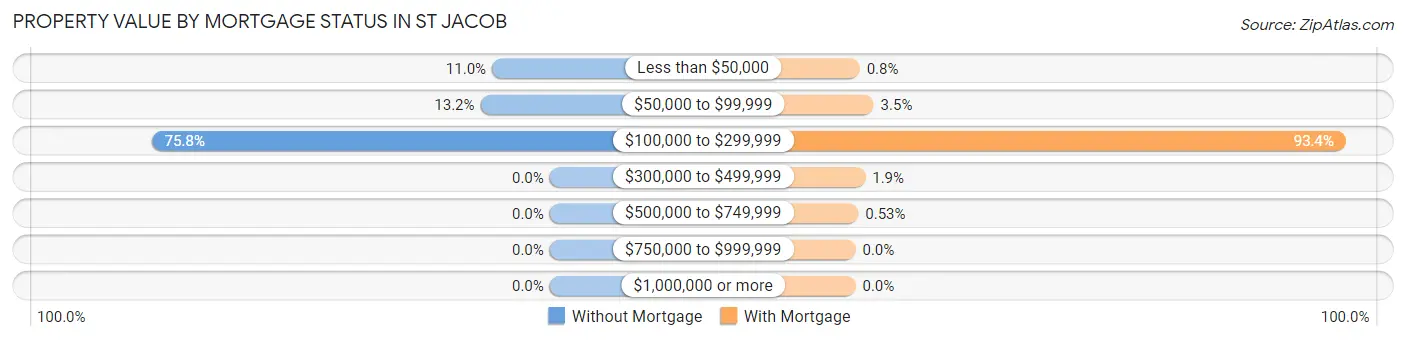
| Property Value | Without Mortgage | With Mortgage |
| Less than $50,000 | 10 (11.0%) | 3 (0.8%) |
| $50,000 to $99,999 | 12 (13.2%) | 13 (3.5%) |
| $100,000 to $299,999 | 69 (75.8%) | 352 (93.4%) |
| $300,000 to $499,999 | 0 (0.0%) | 7 (1.9%) |
| $500,000 to $749,999 | 0 (0.0%) | 2 (0.5%) |
| $750,000 to $999,999 | 0 (0.0%) | 0 (0.0%) |
| $1,000,000 or more | 0 (0.0%) | 0 (0.0%) |
| Total | 91 (100.0%) | 377 (100.0%) |
Household Income by Mortgage Status in St Jacob
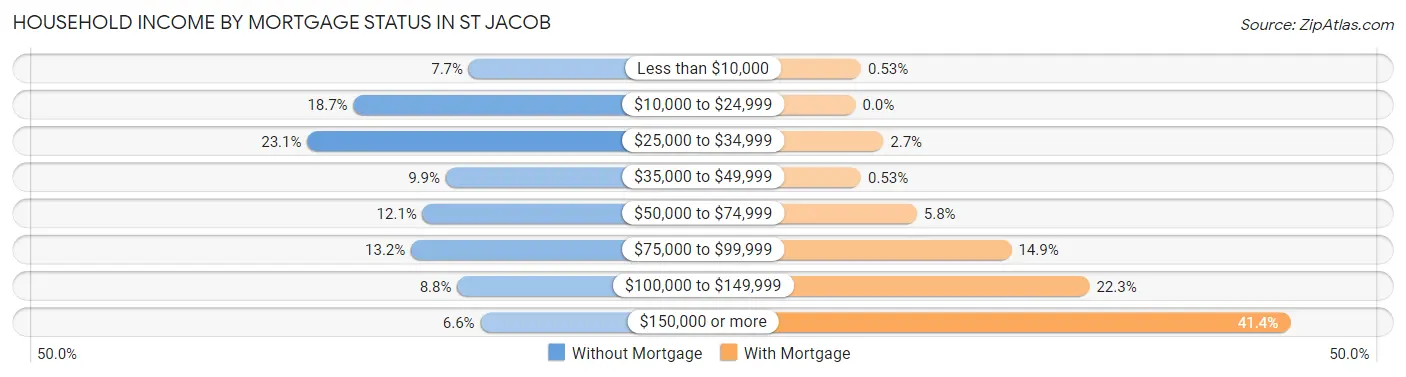
| Household Income | Without Mortgage | With Mortgage |
| Less than $10,000 | 7 (7.7%) | 2 (0.5%) |
| $10,000 to $24,999 | 17 (18.7%) | 0 (0.0%) |
| $25,000 to $34,999 | 21 (23.1%) | 10 (2.6%) |
| $35,000 to $49,999 | 9 (9.9%) | 2 (0.5%) |
| $50,000 to $74,999 | 11 (12.1%) | 22 (5.8%) |
| $75,000 to $99,999 | 12 (13.2%) | 56 (14.8%) |
| $100,000 to $149,999 | 8 (8.8%) | 84 (22.3%) |
| $150,000 or more | 6 (6.6%) | 156 (41.4%) |
| Total | 91 (100.0%) | 377 (100.0%) |
Property Value to Household Income Ratio in St Jacob
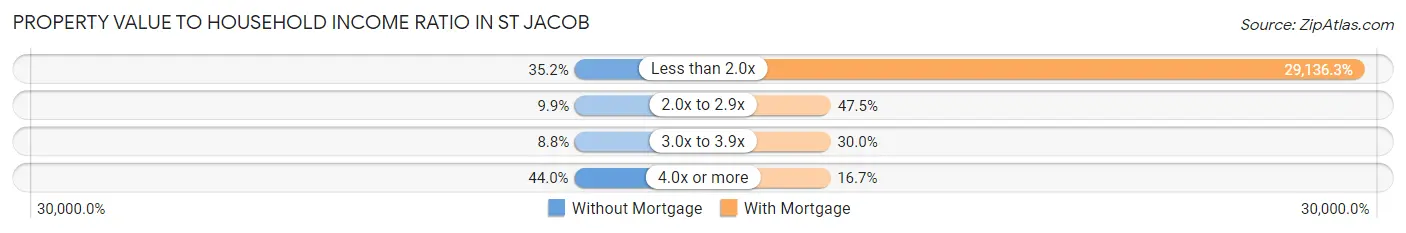
| Value-to-Income Ratio | Without Mortgage | With Mortgage |
| Less than 2.0x | 32 (35.2%) | 109,844 (29,136.3%) |
| 2.0x to 2.9x | 9 (9.9%) | 179 (47.5%) |
| 3.0x to 3.9x | 8 (8.8%) | 113 (30.0%) |
| 4.0x or more | 40 (44.0%) | 63 (16.7%) |
| Total | 91 (100.0%) | 377 (100.0%) |
Real Estate Taxes by Mortgage Status in St Jacob
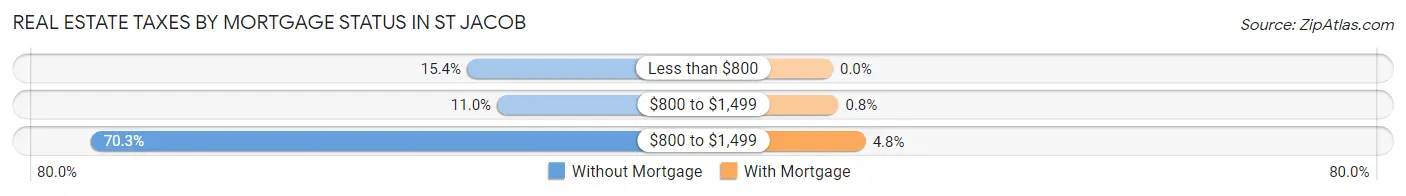
| Property Taxes | Without Mortgage | With Mortgage |
| Less than $800 | 14 (15.4%) | 0 (0.0%) |
| $800 to $1,499 | 10 (11.0%) | 3 (0.8%) |
| $800 to $1,499 | 64 (70.3%) | 18 (4.8%) |
| Total | 91 (100.0%) | 377 (100.0%) |
Health & Disability in St Jacob
Health Insurance Coverage by Age in St Jacob
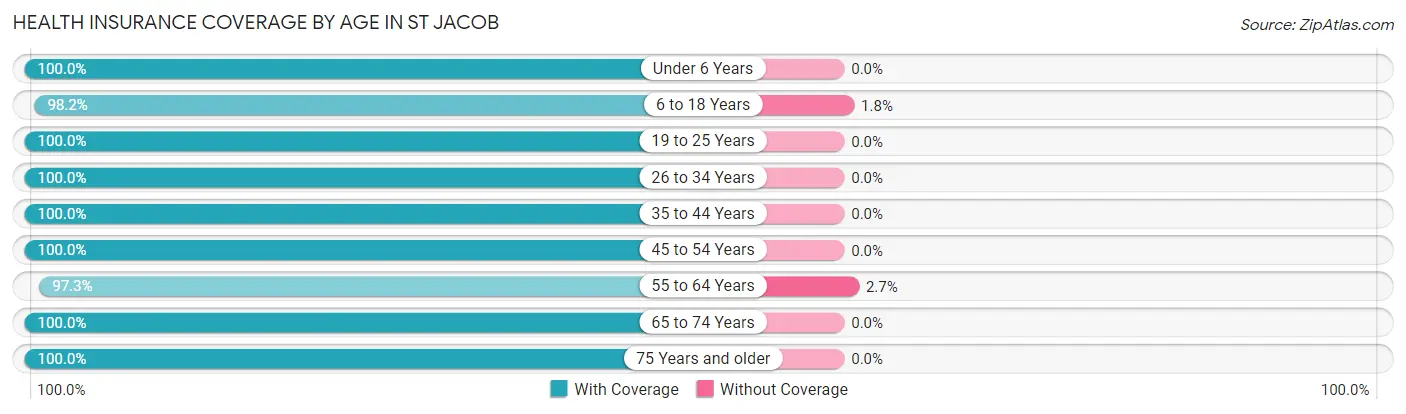
| Age Bracket | With Coverage | Without Coverage |
| Under 6 Years | 210 (100.0%) | 0 (0.0%) |
| 6 to 18 Years | 374 (98.2%) | 7 (1.8%) |
| 19 to 25 Years | 58 (100.0%) | 0 (0.0%) |
| 26 to 34 Years | 275 (100.0%) | 0 (0.0%) |
| 35 to 44 Years | 255 (100.0%) | 0 (0.0%) |
| 45 to 54 Years | 132 (100.0%) | 0 (0.0%) |
| 55 to 64 Years | 142 (97.3%) | 4 (2.7%) |
| 65 to 74 Years | 94 (100.0%) | 0 (0.0%) |
| 75 Years and older | 39 (100.0%) | 0 (0.0%) |
| Total | 1,579 (99.3%) | 11 (0.7%) |
Health Insurance Coverage by Citizenship Status in St Jacob
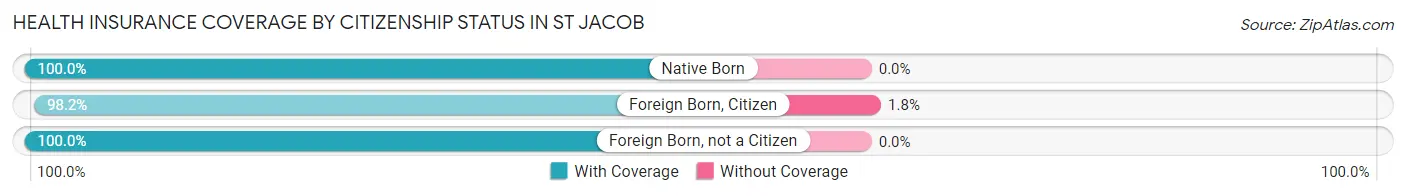
| Citizenship Status | With Coverage | Without Coverage |
| Native Born | 210 (100.0%) | 0 (0.0%) |
| Foreign Born, Citizen | 374 (98.2%) | 7 (1.8%) |
| Foreign Born, not a Citizen | 58 (100.0%) | 0 (0.0%) |
Health Insurance Coverage by Household Income in St Jacob
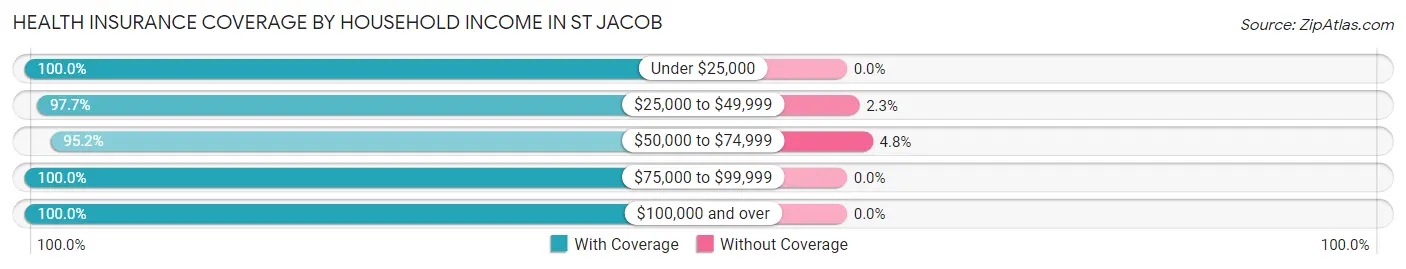
| Household Income | With Coverage | Without Coverage |
| Under $25,000 | 63 (100.0%) | 0 (0.0%) |
| $25,000 to $49,999 | 168 (97.7%) | 4 (2.3%) |
| $50,000 to $74,999 | 138 (95.2%) | 7 (4.8%) |
| $75,000 to $99,999 | 367 (100.0%) | 0 (0.0%) |
| $100,000 and over | 843 (100.0%) | 0 (0.0%) |
Public vs Private Health Insurance Coverage by Age in St Jacob
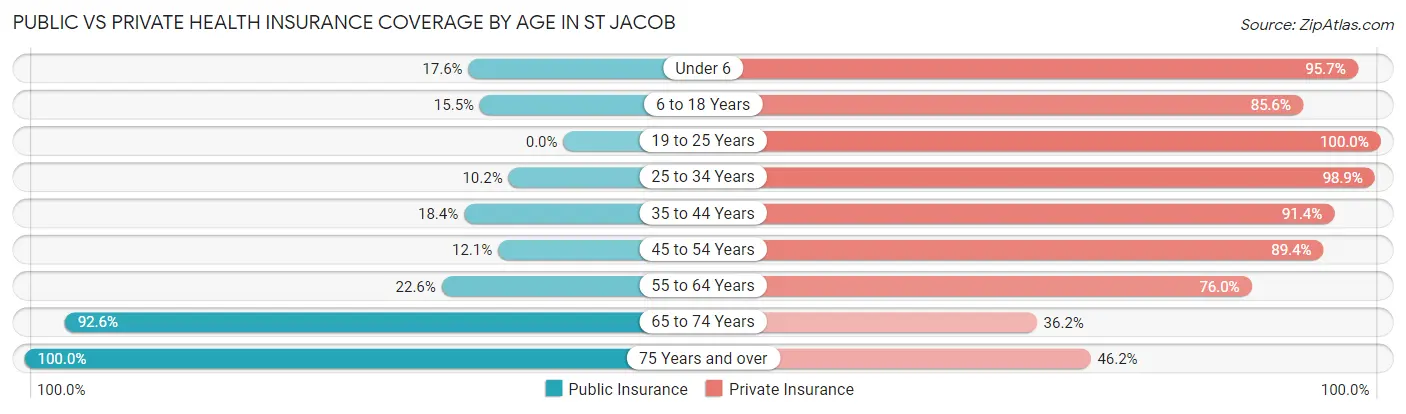
| Age Bracket | Public Insurance | Private Insurance |
| Under 6 | 37 (17.6%) | 201 (95.7%) |
| 6 to 18 Years | 59 (15.5%) | 326 (85.6%) |
| 19 to 25 Years | 0 (0.0%) | 58 (100.0%) |
| 25 to 34 Years | 28 (10.2%) | 272 (98.9%) |
| 35 to 44 Years | 47 (18.4%) | 233 (91.4%) |
| 45 to 54 Years | 16 (12.1%) | 118 (89.4%) |
| 55 to 64 Years | 33 (22.6%) | 111 (76.0%) |
| 65 to 74 Years | 87 (92.5%) | 34 (36.2%) |
| 75 Years and over | 39 (100.0%) | 18 (46.2%) |
| Total | 346 (21.8%) | 1,371 (86.2%) |
Disability Status by Sex by Age in St Jacob
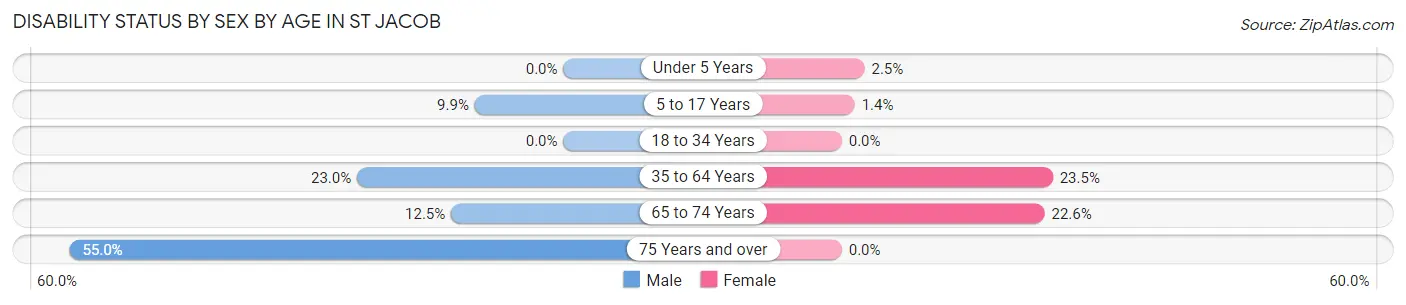
| Age Bracket | Male | Female |
| Under 5 Years | 0 (0.0%) | 2 (2.5%) |
| 5 to 17 Years | 15 (9.9%) | 3 (1.4%) |
| 18 to 34 Years | 0 (0.0%) | 0 (0.0%) |
| 35 to 64 Years | 54 (23.0%) | 70 (23.5%) |
| 65 to 74 Years | 4 (12.5%) | 14 (22.6%) |
| 75 Years and over | 11 (55.0%) | 0 (0.0%) |
Disability Class by Sex by Age in St Jacob
Disability Class: Hearing Difficulty
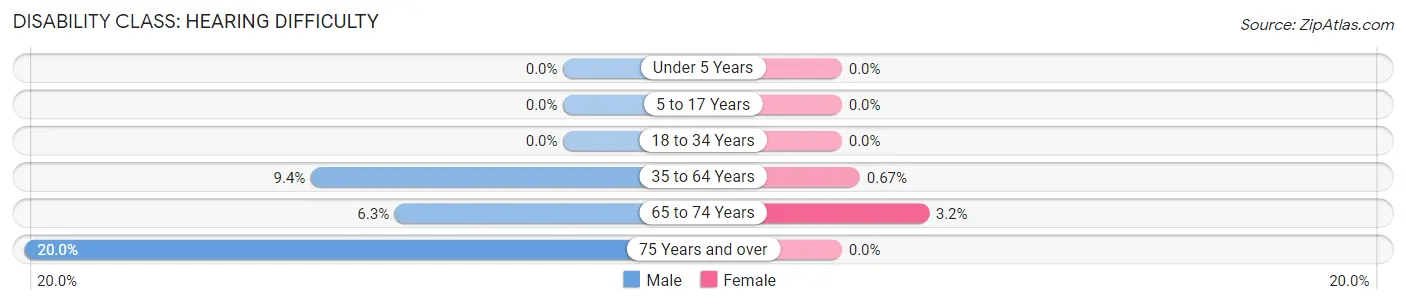
| Age Bracket | Male | Female |
| Under 5 Years | 0 (0.0%) | 0 (0.0%) |
| 5 to 17 Years | 0 (0.0%) | 0 (0.0%) |
| 18 to 34 Years | 0 (0.0%) | 0 (0.0%) |
| 35 to 64 Years | 22 (9.4%) | 2 (0.7%) |
| 65 to 74 Years | 2 (6.2%) | 2 (3.2%) |
| 75 Years and over | 4 (20.0%) | 0 (0.0%) |
Disability Class: Vision Difficulty
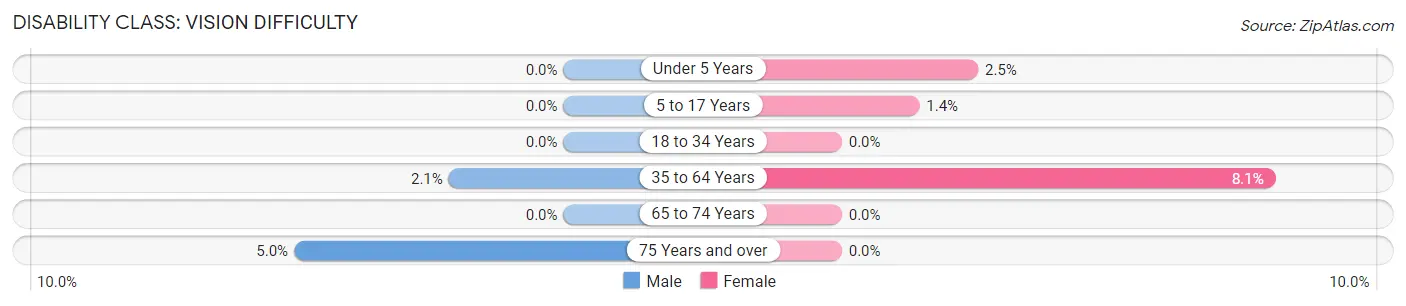
| Age Bracket | Male | Female |
| Under 5 Years | 0 (0.0%) | 2 (2.5%) |
| 5 to 17 Years | 0 (0.0%) | 3 (1.4%) |
| 18 to 34 Years | 0 (0.0%) | 0 (0.0%) |
| 35 to 64 Years | 5 (2.1%) | 24 (8.1%) |
| 65 to 74 Years | 0 (0.0%) | 0 (0.0%) |
| 75 Years and over | 1 (5.0%) | 0 (0.0%) |
Disability Class: Cognitive Difficulty
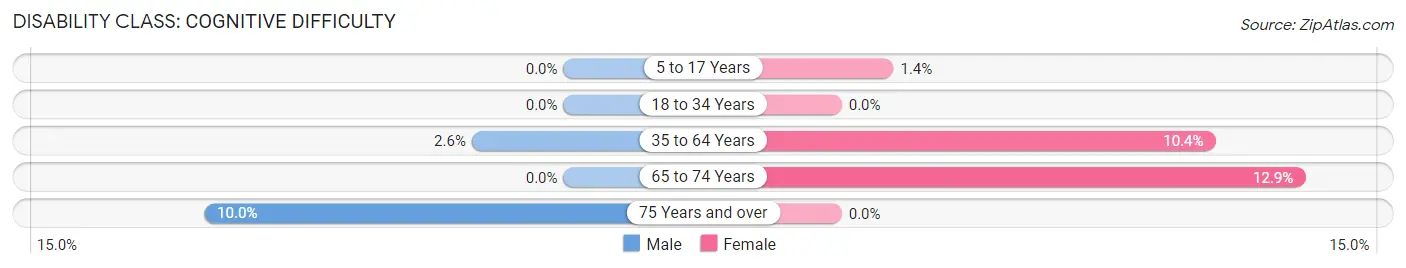
| Age Bracket | Male | Female |
| 5 to 17 Years | 0 (0.0%) | 3 (1.4%) |
| 18 to 34 Years | 0 (0.0%) | 0 (0.0%) |
| 35 to 64 Years | 6 (2.5%) | 31 (10.4%) |
| 65 to 74 Years | 0 (0.0%) | 8 (12.9%) |
| 75 Years and over | 2 (10.0%) | 0 (0.0%) |
Disability Class: Ambulatory Difficulty
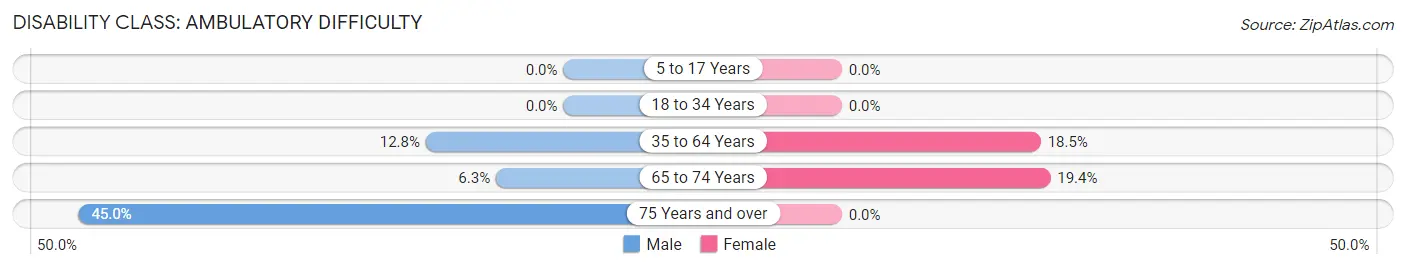
| Age Bracket | Male | Female |
| 5 to 17 Years | 0 (0.0%) | 0 (0.0%) |
| 18 to 34 Years | 0 (0.0%) | 0 (0.0%) |
| 35 to 64 Years | 30 (12.8%) | 55 (18.5%) |
| 65 to 74 Years | 2 (6.2%) | 12 (19.4%) |
| 75 Years and over | 9 (45.0%) | 0 (0.0%) |
Disability Class: Self-Care Difficulty
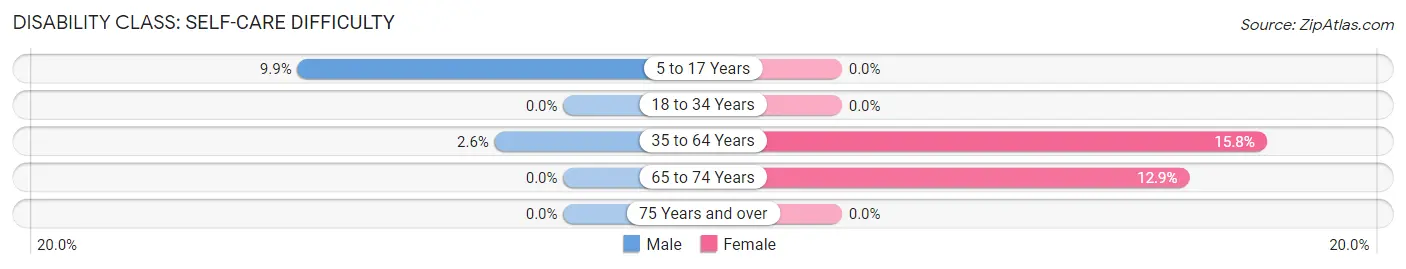
| Age Bracket | Male | Female |
| 5 to 17 Years | 15 (9.9%) | 0 (0.0%) |
| 18 to 34 Years | 0 (0.0%) | 0 (0.0%) |
| 35 to 64 Years | 6 (2.5%) | 47 (15.8%) |
| 65 to 74 Years | 0 (0.0%) | 8 (12.9%) |
| 75 Years and over | 0 (0.0%) | 0 (0.0%) |
Technology Access in St Jacob
Computing Device Access in St Jacob
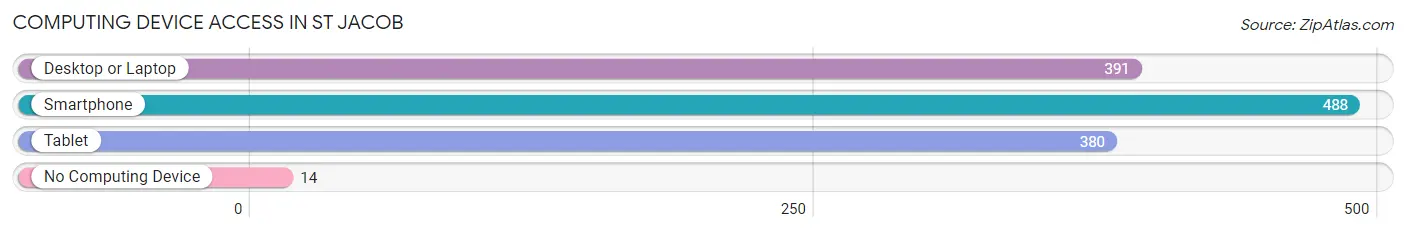
| Device Type | # Households | % Households |
| Desktop or Laptop | 391 | 72.4% |
| Smartphone | 488 | 90.4% |
| Tablet | 380 | 70.4% |
| No Computing Device | 14 | 2.6% |
| Total | 540 | 100.0% |
Internet Access in St Jacob
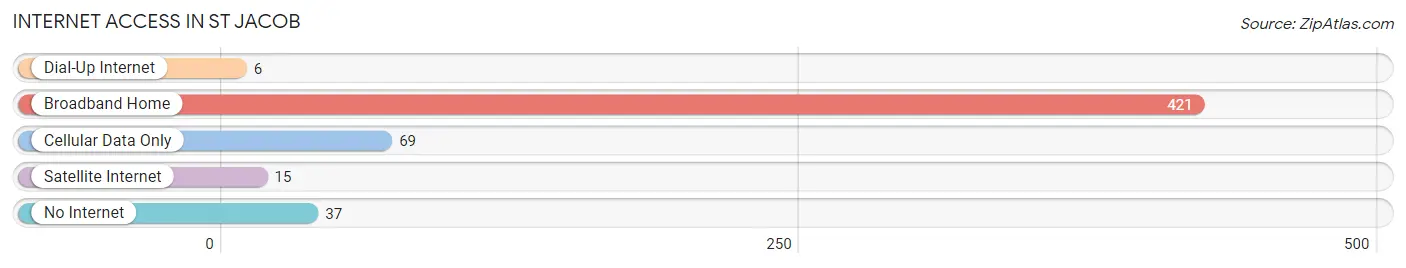
| Internet Type | # Households | % Households |
| Dial-Up Internet | 6 | 1.1% |
| Broadband Home | 421 | 78.0% |
| Cellular Data Only | 69 | 12.8% |
| Satellite Internet | 15 | 2.8% |
| No Internet | 37 | 6.9% |
| Total | 540 | 100.0% |
St Jacob Summary
St. Jacob is a small village located in Madison County, Illinois, United States. It is situated about 10 miles east of the city of Edwardsville and about 25 miles northeast of St. Louis, Missouri. The village has a population of 1,093 as of the 2010 census.
History
St. Jacob was founded in 1837 by a group of German immigrants led by Jacob Stolle. The village was named after Stolle, who was a prominent local landowner and businessman. The village was incorporated in 1867.
In the late 19th century, St. Jacob was a thriving agricultural community. The village was home to several businesses, including a flour mill, a sawmill, a blacksmith shop, and a general store.
Geography
St. Jacob is located at 38°45'25"N 89°45'45"W (38.756944, -89.762500). The village is situated in the southwestern part of Madison County, about 10 miles east of the city of Edwardsville and about 25 miles northeast of St. Louis, Missouri.
The village has a total area of 0.7 square miles, all of which is land. The village is located in the American Bottom region of the Illinois River Valley.
Economy
St. Jacob is a small, rural community with a primarily agricultural economy. The village is home to several small businesses, including a grocery store, a hardware store, and a restaurant.
The village is also home to several manufacturing companies, including a plastics manufacturer and a metal fabrication company.
Demographics
As of the 2010 census, St. Jacob had a population of 1,093. The racial makeup of the village was 97.3% White, 0.7% African American, 0.2% Native American, 0.2% Asian, 0.2% from other races, and 1.6% from two or more races. Hispanic or Latino of any race were 1.2% of the population.
The median household income in St. Jacob was $50,000, and the median family income was $54,000. The per capita income for the village was $20,000. About 8.3% of families and 10.2% of the population were below the poverty line, including 13.2% of those under age 18 and 8.3% of those age 65 or over.
Common Questions
What is Per Capita Income in St Jacob?
Per Capita income in St Jacob is $34,512.
What is the Median Family Income in St Jacob?
Median Family Income in St Jacob is $108,523.
What is the Median Household income in St Jacob?
Median Household Income in St Jacob is $94,531.
What is Income or Wage Gap in St Jacob?
Income or Wage Gap in St Jacob is 58.0%.
Women in St Jacob earn 42.0 cents for every dollar earned by a man.
What is Inequality or Gini Index in St Jacob?
Inequality or Gini Index in St Jacob is 0.35.
What is the Total Population of St Jacob?
Total Population of St Jacob is 1,597.
What is the Total Male Population of St Jacob?
Total Male Population of St Jacob is 758.
What is the Total Female Population of St Jacob?
Total Female Population of St Jacob is 839.
What is the Ratio of Males per 100 Females in St Jacob?
There are 90.35 Males per 100 Females in St Jacob.
What is the Ratio of Females per 100 Males in St Jacob?
There are 110.69 Females per 100 Males in St Jacob.
What is the Median Population Age in St Jacob?
Median Population Age in St Jacob is 33.5 Years.
What is the Average Family Size in St Jacob
Average Family Size in St Jacob is 3.5 People.
What is the Average Household Size in St Jacob
Average Household Size in St Jacob is 3.0 People.
How Large is the Labor Force in St Jacob?
There are 775 People in the Labor Forcein in St Jacob.
What is the Percentage of People in the Labor Force in St Jacob?
69.7% of People are in the Labor Force in St Jacob.
What is the Unemployment Rate in St Jacob?
Unemployment Rate in St Jacob is 1.8%.