Zip Codes with the Highest Percentage of Population with a Degree in Liberal Arts and History in Decatur, IL
RELATED REPORTS & OPTIONS
Liberal Arts and History
Decatur
Compare Zip Codes
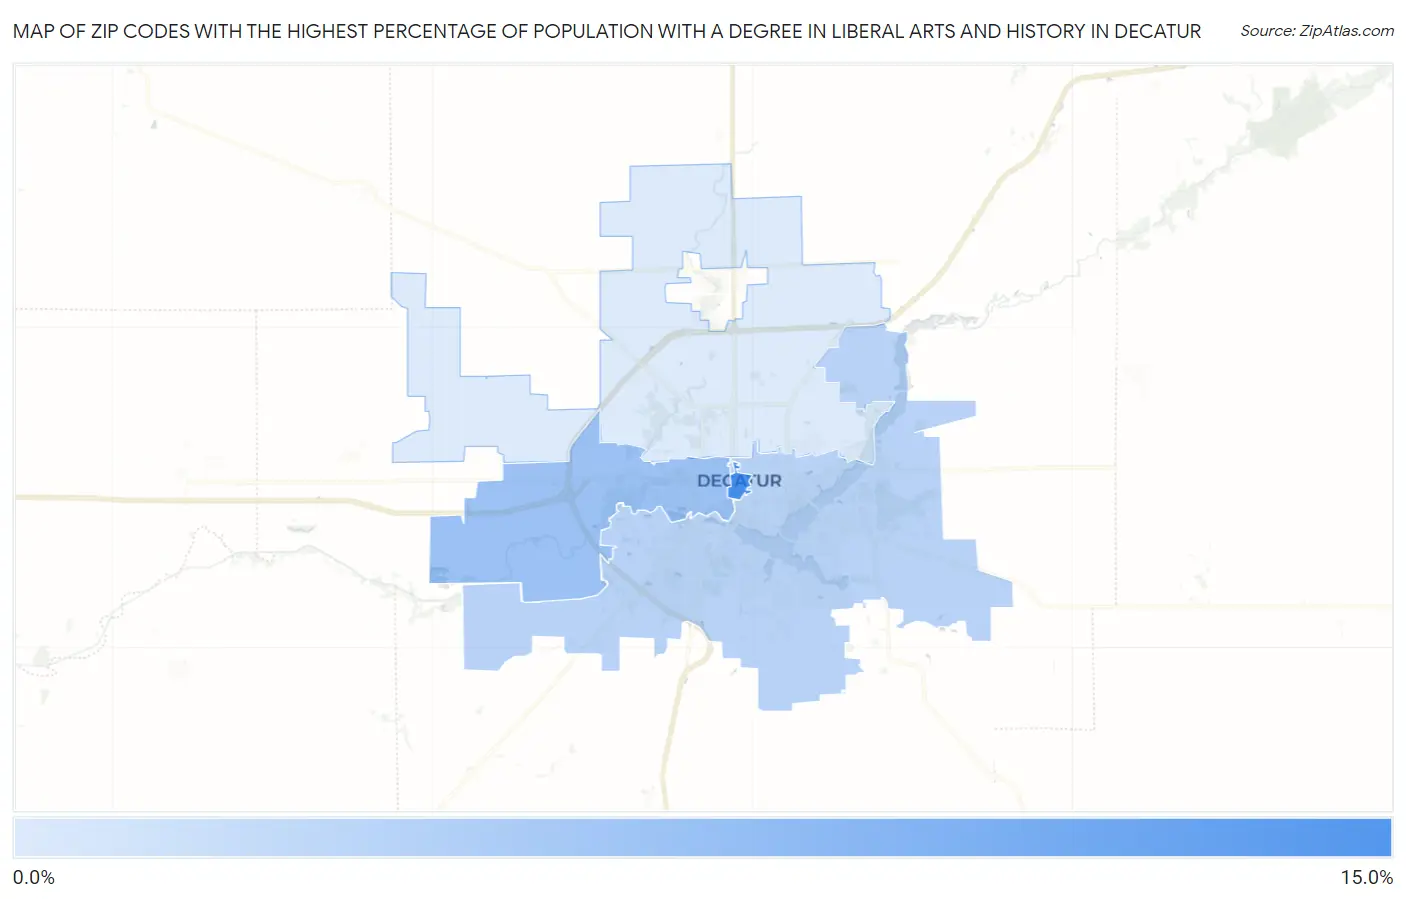
Map of Zip Codes with the Highest Percentage of Population with a Degree in Liberal Arts and History in Decatur
1.3%
12.3%
Zip Codes with the Highest Percentage of Population with a Degree in Liberal Arts and History in Decatur, IL
| Zip Code | % Graduates | vs State | vs National | |
| 1. | 62523 | 12.3% | 4.7%(+7.57)#69 | 4.9%(+7.41)#2,112 |
| 2. | 62522 | 5.9% | 4.7%(+1.22)#336 | 4.9%(+1.06)#8,689 |
| 3. | 62521 | 4.0% | 4.7%(-0.735)#584 | 4.9%(-0.894)#14,876 |
| 4. | 62526 | 1.3% | 4.7%(-3.38)#949 | 4.9%(-3.54)#22,808 |
1
Common Questions
What are the Top 3 Zip Codes with the Highest Percentage of Population with a Degree in Liberal Arts and History in Decatur, IL?
Top 3 Zip Codes with the Highest Percentage of Population with a Degree in Liberal Arts and History in Decatur, IL are:
What zip code has the Highest Percentage of Population with a Degree in Liberal Arts and History in Decatur, IL?
62523 has the Highest Percentage of Population with a Degree in Liberal Arts and History in Decatur, IL with 12.3%.
What is the Percentage of Population with a Degree in Liberal Arts and History in Decatur, IL?
Percentage of Population with a Degree in Liberal Arts and History in Decatur is 3.4%.
What is the Percentage of Population with a Degree in Liberal Arts and History in Illinois?
Percentage of Population with a Degree in Liberal Arts and History in Illinois is 4.7%.
What is the Percentage of Population with a Degree in Liberal Arts and History in the United States?
Percentage of Population with a Degree in Liberal Arts and History in the United States is 4.9%.