Zip Codes with the Highest Percentage of Population with a Degree in Liberal Arts and History in Crystal Lake, IL
RELATED REPORTS & OPTIONS
Liberal Arts and History
Crystal Lake
Compare Zip Codes
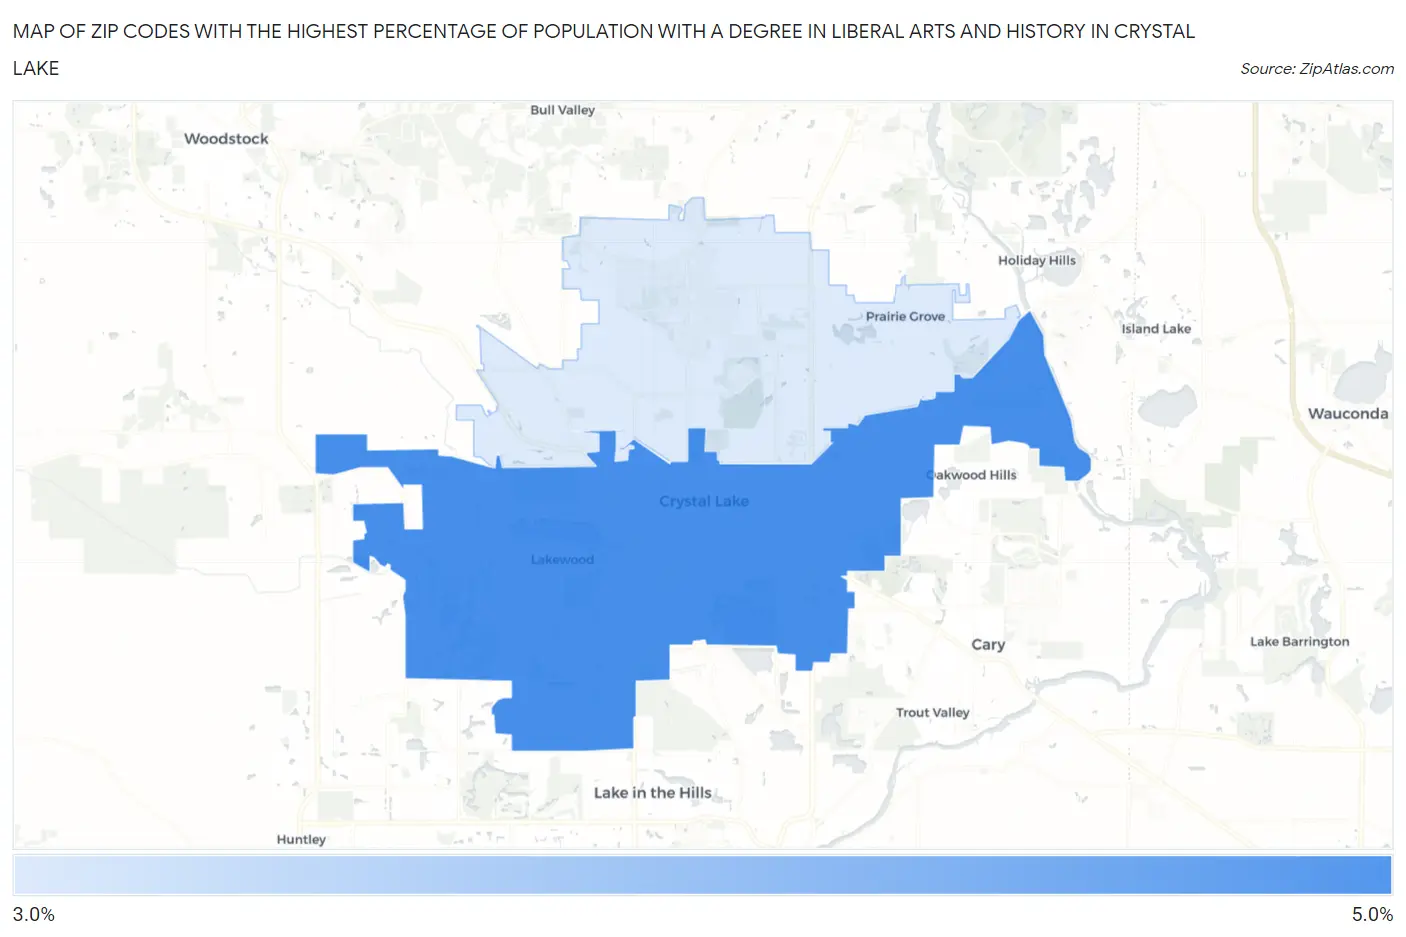
Map of Zip Codes with the Highest Percentage of Population with a Degree in Liberal Arts and History in Crystal Lake
3.4%
4.8%
Zip Codes with the Highest Percentage of Population with a Degree in Liberal Arts and History in Crystal Lake, IL
| Zip Code | % Graduates | vs State | vs National | |
| 1. | 60014 | 4.8% | 4.7%(+0.064)#475 | 4.9%(-0.096)#12,042 |
| 2. | 60012 | 3.4% | 4.7%(-1.35)#665 | 4.9%(-1.51)#17,096 |
1
Common Questions
What are the Top Zip Codes with the Highest Percentage of Population with a Degree in Liberal Arts and History in Crystal Lake, IL?
Top Zip Codes with the Highest Percentage of Population with a Degree in Liberal Arts and History in Crystal Lake, IL are:
What zip code has the Highest Percentage of Population with a Degree in Liberal Arts and History in Crystal Lake, IL?
60014 has the Highest Percentage of Population with a Degree in Liberal Arts and History in Crystal Lake, IL with 4.8%.
What is the Percentage of Population with a Degree in Liberal Arts and History in Crystal Lake, IL?
Percentage of Population with a Degree in Liberal Arts and History in Crystal Lake is 4.8%.
What is the Percentage of Population with a Degree in Liberal Arts and History in Illinois?
Percentage of Population with a Degree in Liberal Arts and History in Illinois is 4.7%.
What is the Percentage of Population with a Degree in Liberal Arts and History in the United States?
Percentage of Population with a Degree in Liberal Arts and History in the United States is 4.9%.