Zip Codes with the Highest Percentage of Population with a Degree in Liberal Arts and History in Orland Park, IL
RELATED REPORTS & OPTIONS
Liberal Arts and History
Orland Park
Compare Zip Codes
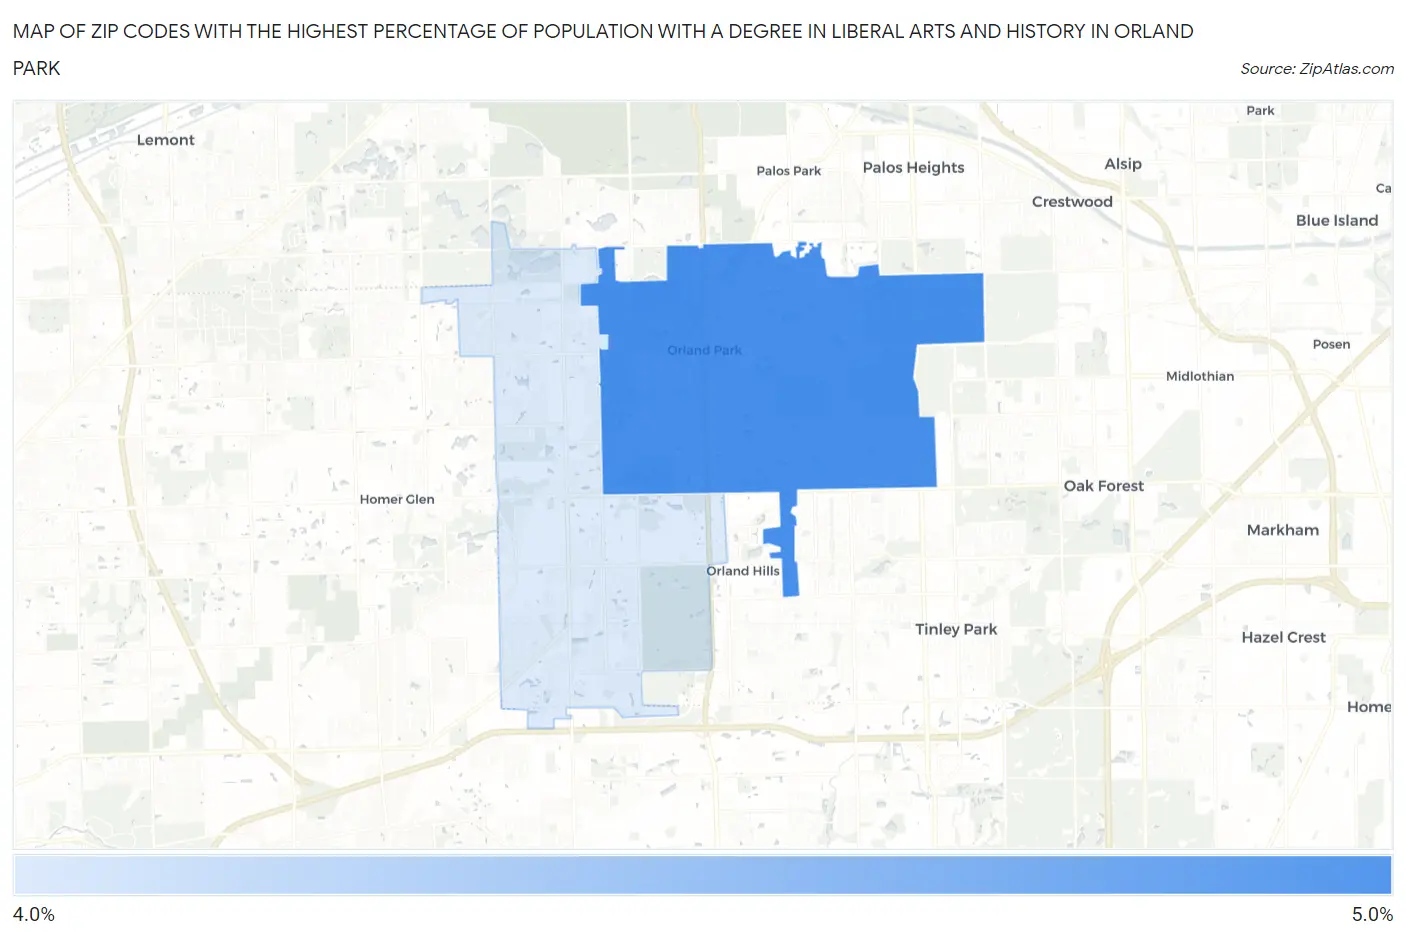
Map of Zip Codes with the Highest Percentage of Population with a Degree in Liberal Arts and History in Orland Park
4.4%
4.6%
Zip Codes with the Highest Percentage of Population with a Degree in Liberal Arts and History in Orland Park, IL
| Zip Code | % Graduates | vs State | vs National | |
| 1. | 60462 | 4.6% | 4.7%(-0.150)#494 | 4.9%(-0.309)#12,755 |
| 2. | 60467 | 4.4% | 4.7%(-0.341)#517 | 4.9%(-0.500)#13,388 |
1
Common Questions
What are the Top Zip Codes with the Highest Percentage of Population with a Degree in Liberal Arts and History in Orland Park, IL?
Top Zip Codes with the Highest Percentage of Population with a Degree in Liberal Arts and History in Orland Park, IL are:
What zip code has the Highest Percentage of Population with a Degree in Liberal Arts and History in Orland Park, IL?
60462 has the Highest Percentage of Population with a Degree in Liberal Arts and History in Orland Park, IL with 4.6%.
What is the Percentage of Population with a Degree in Liberal Arts and History in Orland Park, IL?
Percentage of Population with a Degree in Liberal Arts and History in Orland Park is 4.8%.
What is the Percentage of Population with a Degree in Liberal Arts and History in Illinois?
Percentage of Population with a Degree in Liberal Arts and History in Illinois is 4.7%.
What is the Percentage of Population with a Degree in Liberal Arts and History in the United States?
Percentage of Population with a Degree in Liberal Arts and History in the United States is 4.9%.