Zip Codes with the Highest Percentage of Population with a Degree in Liberal Arts and History in Champaign, IL
RELATED REPORTS & OPTIONS
Liberal Arts and History
Champaign
Compare Zip Codes
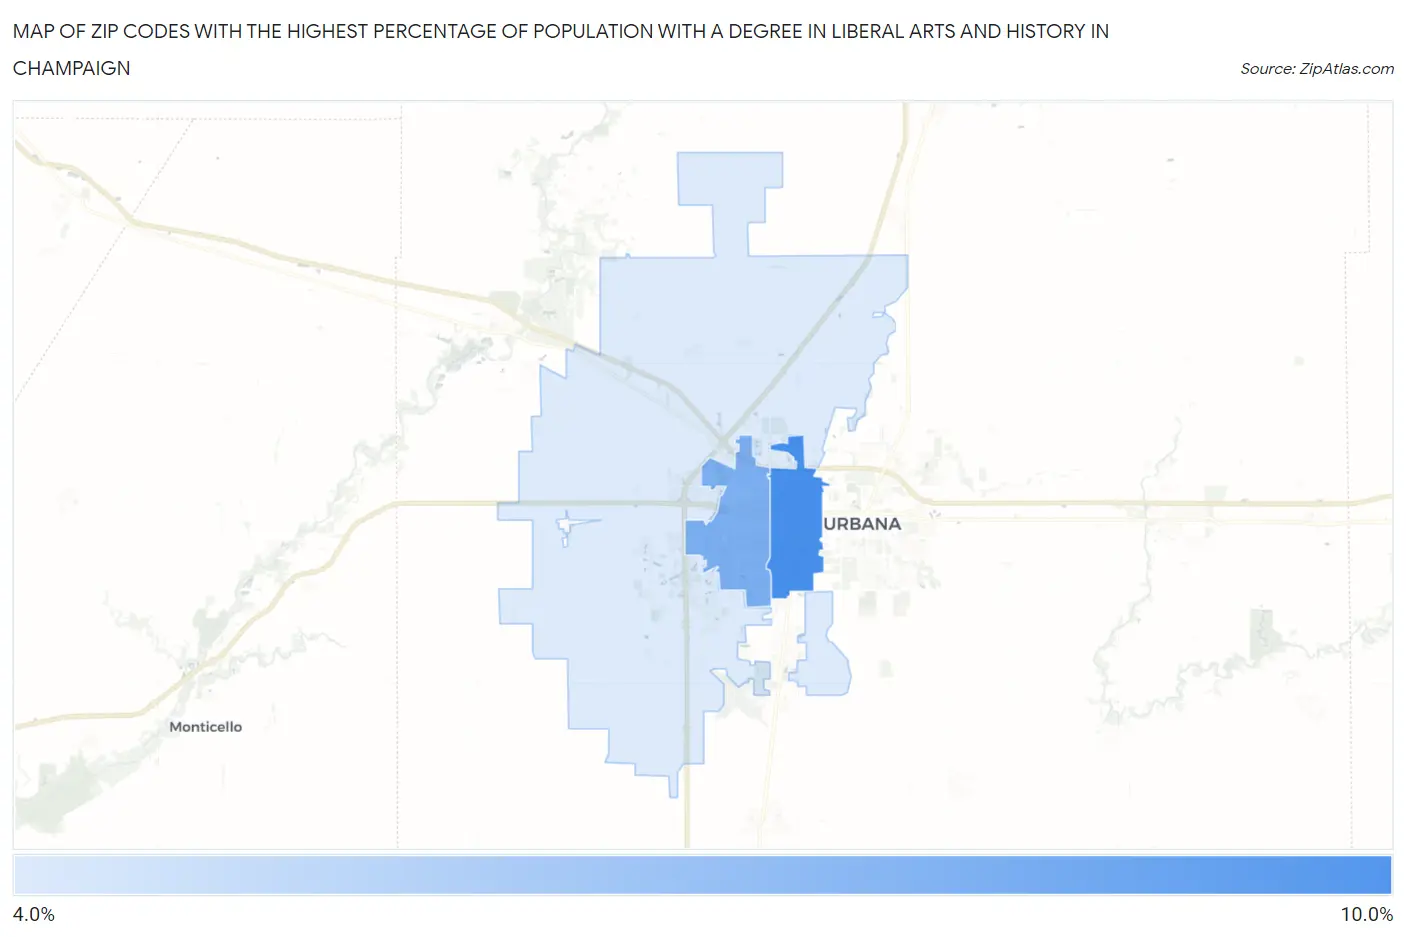
Map of Zip Codes with the Highest Percentage of Population with a Degree in Liberal Arts and History in Champaign
4.7%
9.2%
Zip Codes with the Highest Percentage of Population with a Degree in Liberal Arts and History in Champaign, IL
| Zip Code | % Graduates | vs State | vs National | |
| 1. | 61820 | 9.2% | 4.7%(+4.54)#135 | 4.9%(+4.38)#3,648 |
| 2. | 61821 | 7.6% | 4.7%(+2.92)#200 | 4.9%(+2.76)#5,390 |
| 3. | 61822 | 4.7% | 4.7%(+0.020)#480 | 4.9%(-0.140)#12,217 |
1
Common Questions
What are the Top Zip Codes with the Highest Percentage of Population with a Degree in Liberal Arts and History in Champaign, IL?
Top Zip Codes with the Highest Percentage of Population with a Degree in Liberal Arts and History in Champaign, IL are:
What zip code has the Highest Percentage of Population with a Degree in Liberal Arts and History in Champaign, IL?
61820 has the Highest Percentage of Population with a Degree in Liberal Arts and History in Champaign, IL with 9.2%.
What is the Percentage of Population with a Degree in Liberal Arts and History in Champaign, IL?
Percentage of Population with a Degree in Liberal Arts and History in Champaign is 7.1%.
What is the Percentage of Population with a Degree in Liberal Arts and History in Illinois?
Percentage of Population with a Degree in Liberal Arts and History in Illinois is 4.7%.
What is the Percentage of Population with a Degree in Liberal Arts and History in the United States?
Percentage of Population with a Degree in Liberal Arts and History in the United States is 4.9%.