Zip Codes with the Highest Percentage of Population with a Degree in Liberal Arts and History in Waukegan, IL
RELATED REPORTS & OPTIONS
Liberal Arts and History
Waukegan
Compare Zip Codes
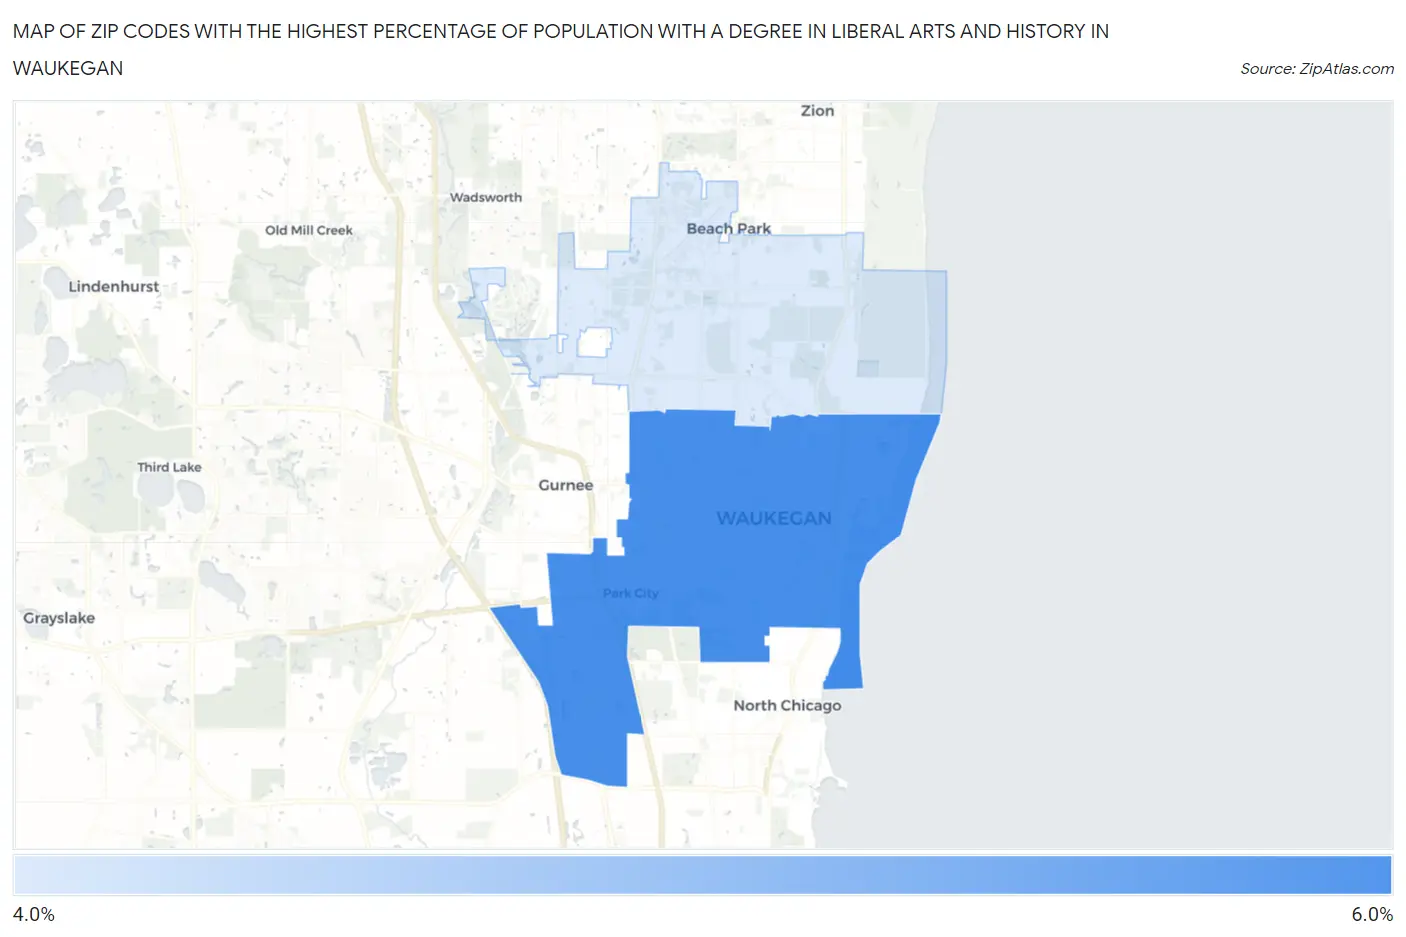
Map of Zip Codes with the Highest Percentage of Population with a Degree in Liberal Arts and History in Waukegan
4.8%
5.5%
Zip Codes with the Highest Percentage of Population with a Degree in Liberal Arts and History in Waukegan, IL
| Zip Code | % Graduates | vs State | vs National | |
| 1. | 60085 | 5.5% | 4.7%(+0.808)#379 | 4.9%(+0.648)#9,813 |
| 2. | 60087 | 4.8% | 4.7%(+0.110)#461 | 4.9%(-0.049)#11,911 |
1
Common Questions
What are the Top Zip Codes with the Highest Percentage of Population with a Degree in Liberal Arts and History in Waukegan, IL?
Top Zip Codes with the Highest Percentage of Population with a Degree in Liberal Arts and History in Waukegan, IL are:
What zip code has the Highest Percentage of Population with a Degree in Liberal Arts and History in Waukegan, IL?
60085 has the Highest Percentage of Population with a Degree in Liberal Arts and History in Waukegan, IL with 5.5%.
What is the Percentage of Population with a Degree in Liberal Arts and History in Waukegan, IL?
Percentage of Population with a Degree in Liberal Arts and History in Waukegan is 5.3%.
What is the Percentage of Population with a Degree in Liberal Arts and History in Illinois?
Percentage of Population with a Degree in Liberal Arts and History in Illinois is 4.7%.
What is the Percentage of Population with a Degree in Liberal Arts and History in the United States?
Percentage of Population with a Degree in Liberal Arts and History in the United States is 4.9%.