Zip Codes with the Highest Percentage of Population with a Degree in Liberal Arts and History in Schaumburg, IL
RELATED REPORTS & OPTIONS
Liberal Arts and History
Schaumburg
Compare Zip Codes
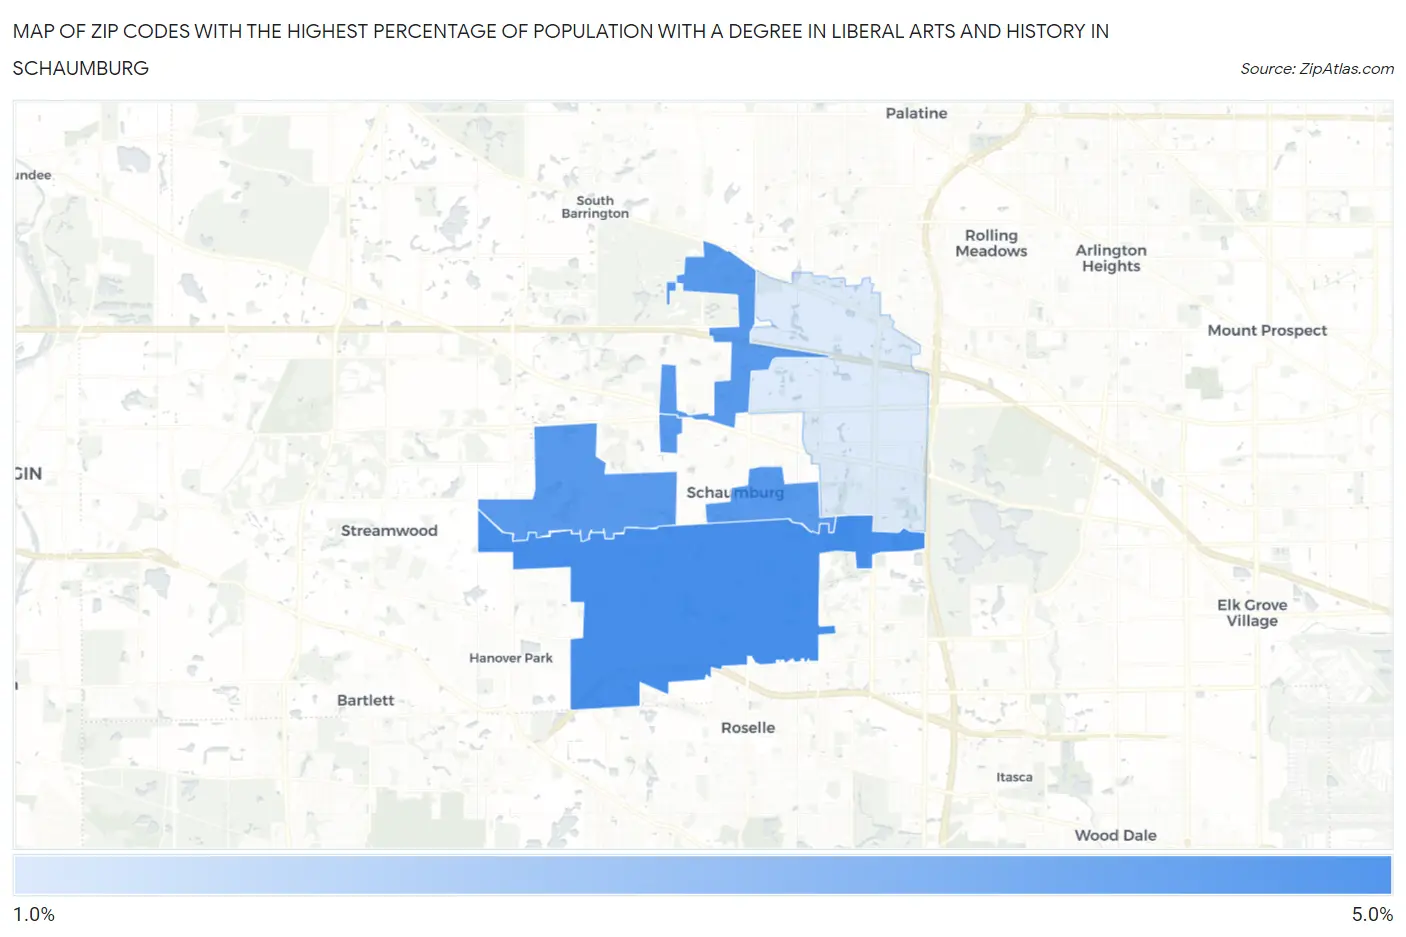
Map of Zip Codes with the Highest Percentage of Population with a Degree in Liberal Arts and History in Schaumburg
1.7%
4.0%
Zip Codes with the Highest Percentage of Population with a Degree in Liberal Arts and History in Schaumburg, IL
| Zip Code | % Graduates | vs State | vs National | |
| 1. | 60193 | 4.0% | 4.7%(-0.665)#571 | 4.9%(-0.825)#14,597 |
| 2. | 60195 | 3.8% | 4.7%(-0.913)#609 | 4.9%(-1.07)#15,529 |
| 3. | 60194 | 3.8% | 4.7%(-0.922)#610 | 4.9%(-1.08)#15,555 |
| 4. | 60173 | 1.7% | 4.7%(-3.02)#905 | 4.9%(-3.18)#22,098 |
1
Common Questions
What are the Top 3 Zip Codes with the Highest Percentage of Population with a Degree in Liberal Arts and History in Schaumburg, IL?
Top 3 Zip Codes with the Highest Percentage of Population with a Degree in Liberal Arts and History in Schaumburg, IL are:
What zip code has the Highest Percentage of Population with a Degree in Liberal Arts and History in Schaumburg, IL?
60193 has the Highest Percentage of Population with a Degree in Liberal Arts and History in Schaumburg, IL with 4.0%.
What is the Percentage of Population with a Degree in Liberal Arts and History in Schaumburg, IL?
Percentage of Population with a Degree in Liberal Arts and History in Schaumburg is 3.4%.
What is the Percentage of Population with a Degree in Liberal Arts and History in Illinois?
Percentage of Population with a Degree in Liberal Arts and History in Illinois is 4.7%.
What is the Percentage of Population with a Degree in Liberal Arts and History in the United States?
Percentage of Population with a Degree in Liberal Arts and History in the United States is 4.9%.