Zip Codes with the Highest Percentage of Population with a Degree in Liberal Arts and History in Tinley Park, IL
RELATED REPORTS & OPTIONS
Liberal Arts and History
Tinley Park
Compare Zip Codes
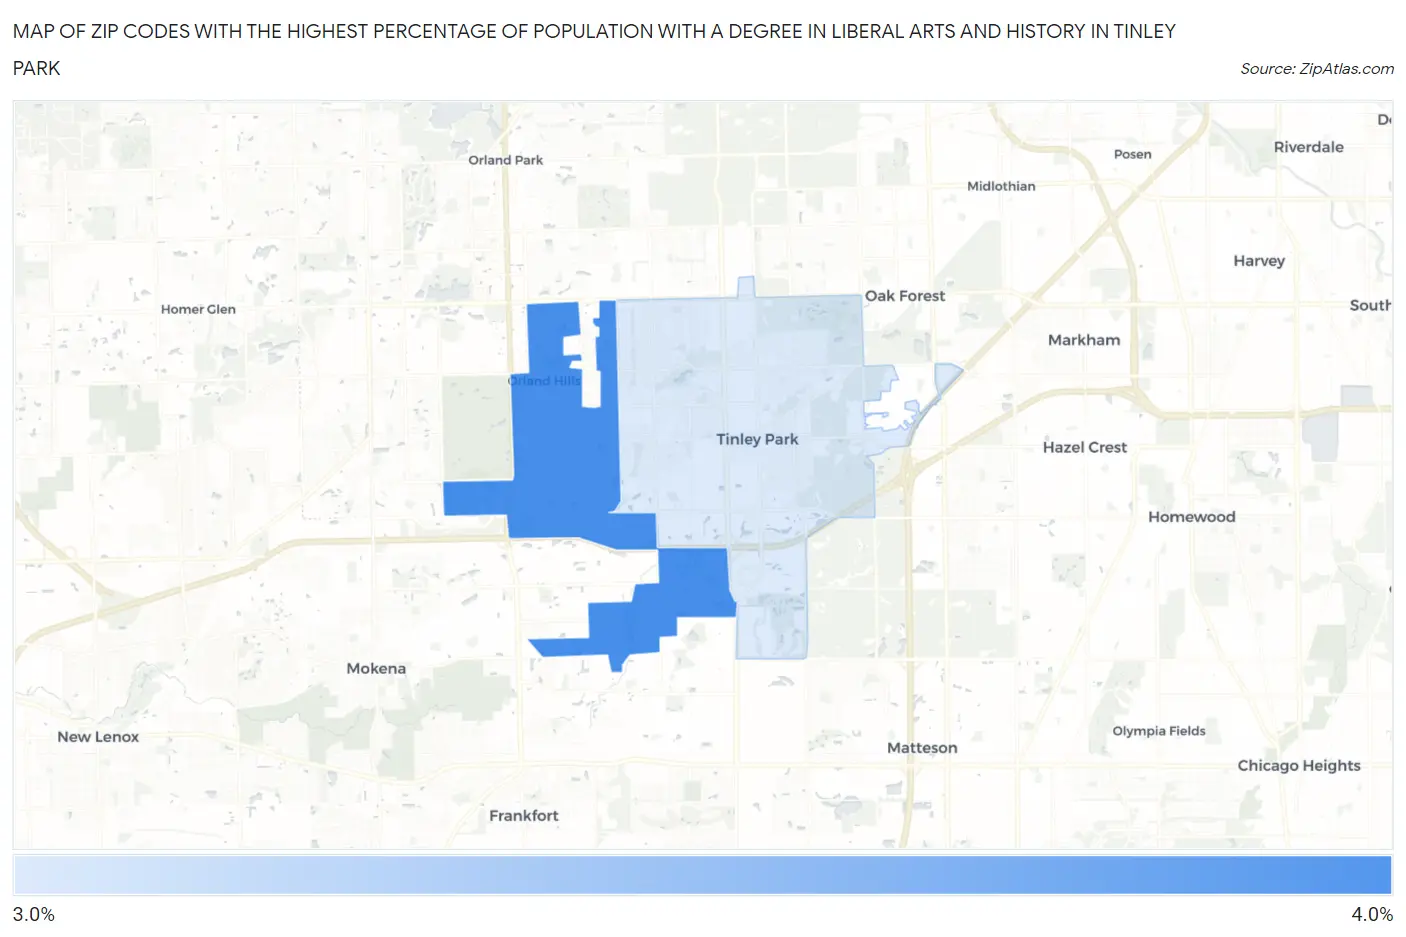
Map of Zip Codes with the Highest Percentage of Population with a Degree in Liberal Arts and History in Tinley Park
3.0%
3.5%
Zip Codes with the Highest Percentage of Population with a Degree in Liberal Arts and History in Tinley Park, IL
| Zip Code | % Graduates | vs State | vs National | |
| 1. | 60487 | 3.5% | 4.7%(-1.18)#638 | 4.9%(-1.34)#16,491 |
| 2. | 60477 | 3.0% | 4.7%(-1.71)#716 | 4.9%(-1.87)#18,354 |
1
Common Questions
What are the Top Zip Codes with the Highest Percentage of Population with a Degree in Liberal Arts and History in Tinley Park, IL?
Top Zip Codes with the Highest Percentage of Population with a Degree in Liberal Arts and History in Tinley Park, IL are:
What zip code has the Highest Percentage of Population with a Degree in Liberal Arts and History in Tinley Park, IL?
60487 has the Highest Percentage of Population with a Degree in Liberal Arts and History in Tinley Park, IL with 3.5%.
What is the Percentage of Population with a Degree in Liberal Arts and History in Tinley Park, IL?
Percentage of Population with a Degree in Liberal Arts and History in Tinley Park is 2.7%.
What is the Percentage of Population with a Degree in Liberal Arts and History in Illinois?
Percentage of Population with a Degree in Liberal Arts and History in Illinois is 4.7%.
What is the Percentage of Population with a Degree in Liberal Arts and History in the United States?
Percentage of Population with a Degree in Liberal Arts and History in the United States is 4.9%.