Zip Codes with the Highest Percentage of Population with a Degree in Liberal Arts and History in Bolingbrook, IL
RELATED REPORTS & OPTIONS
Liberal Arts and History
Bolingbrook
Compare Zip Codes
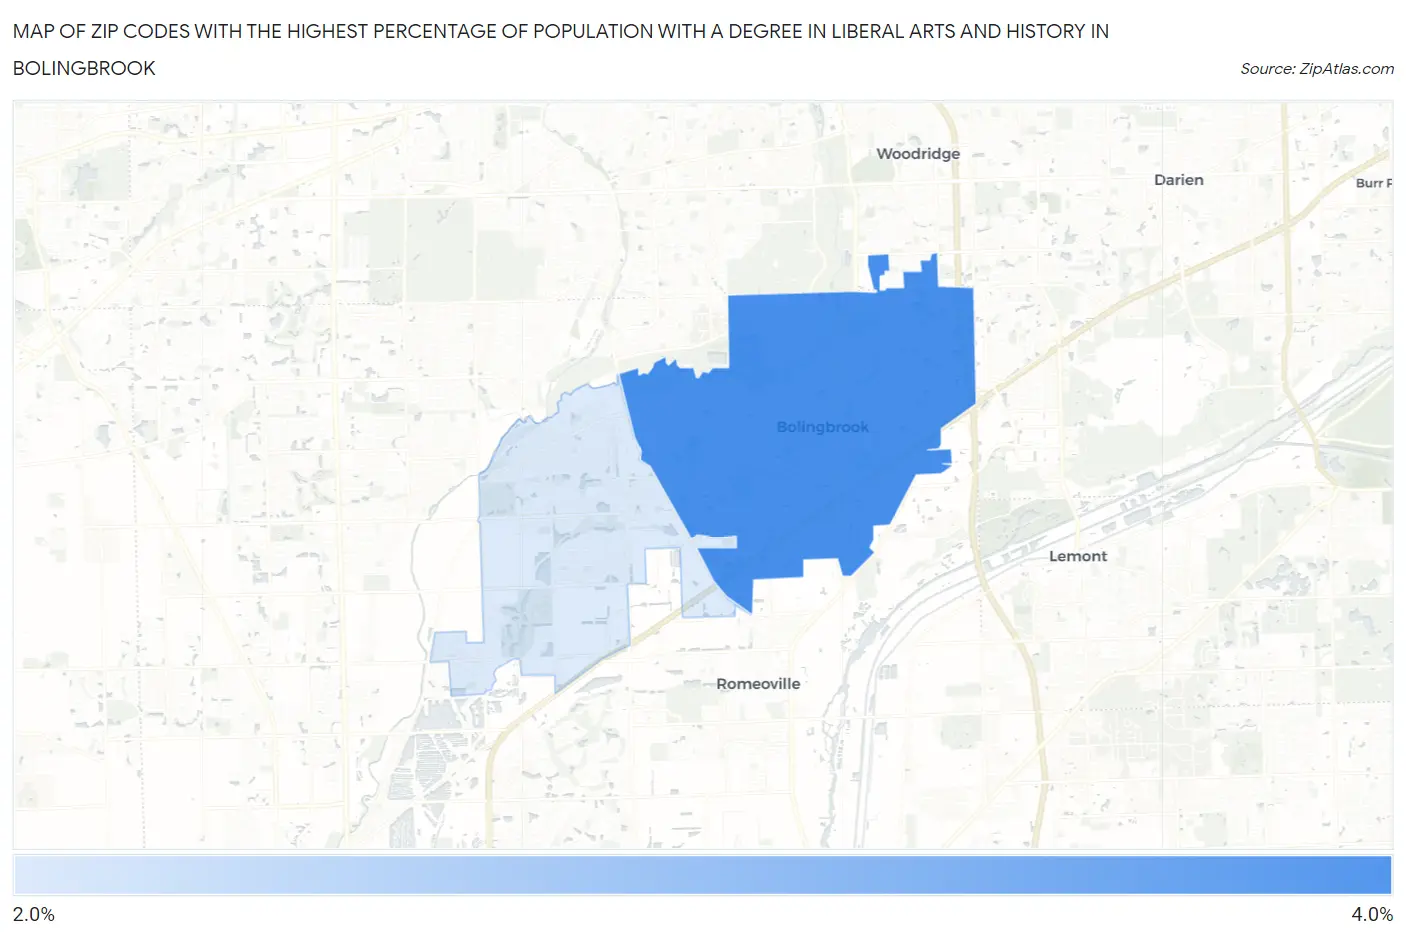
Map of Zip Codes with the Highest Percentage of Population with a Degree in Liberal Arts and History in Bolingbrook
2.9%
3.2%
Zip Codes with the Highest Percentage of Population with a Degree in Liberal Arts and History in Bolingbrook, IL
| Zip Code | % Graduates | vs State | vs National | |
| 1. | 60440 | 3.2% | 4.7%(-1.54)#684 | 4.9%(-1.70)#17,755 |
| 2. | 60490 | 2.9% | 4.7%(-1.83)#740 | 4.9%(-1.99)#18,728 |
1
Common Questions
What are the Top Zip Codes with the Highest Percentage of Population with a Degree in Liberal Arts and History in Bolingbrook, IL?
Top Zip Codes with the Highest Percentage of Population with a Degree in Liberal Arts and History in Bolingbrook, IL are:
What zip code has the Highest Percentage of Population with a Degree in Liberal Arts and History in Bolingbrook, IL?
60440 has the Highest Percentage of Population with a Degree in Liberal Arts and History in Bolingbrook, IL with 3.2%.
What is the Percentage of Population with a Degree in Liberal Arts and History in Bolingbrook, IL?
Percentage of Population with a Degree in Liberal Arts and History in Bolingbrook is 3.1%.
What is the Percentage of Population with a Degree in Liberal Arts and History in Illinois?
Percentage of Population with a Degree in Liberal Arts and History in Illinois is 4.7%.
What is the Percentage of Population with a Degree in Liberal Arts and History in the United States?
Percentage of Population with a Degree in Liberal Arts and History in the United States is 4.9%.