Zip Codes with the Highest Percentage of Population with a Degree in Liberal Arts and History in Evanston, IL
RELATED REPORTS & OPTIONS
Liberal Arts and History
Evanston
Compare Zip Codes
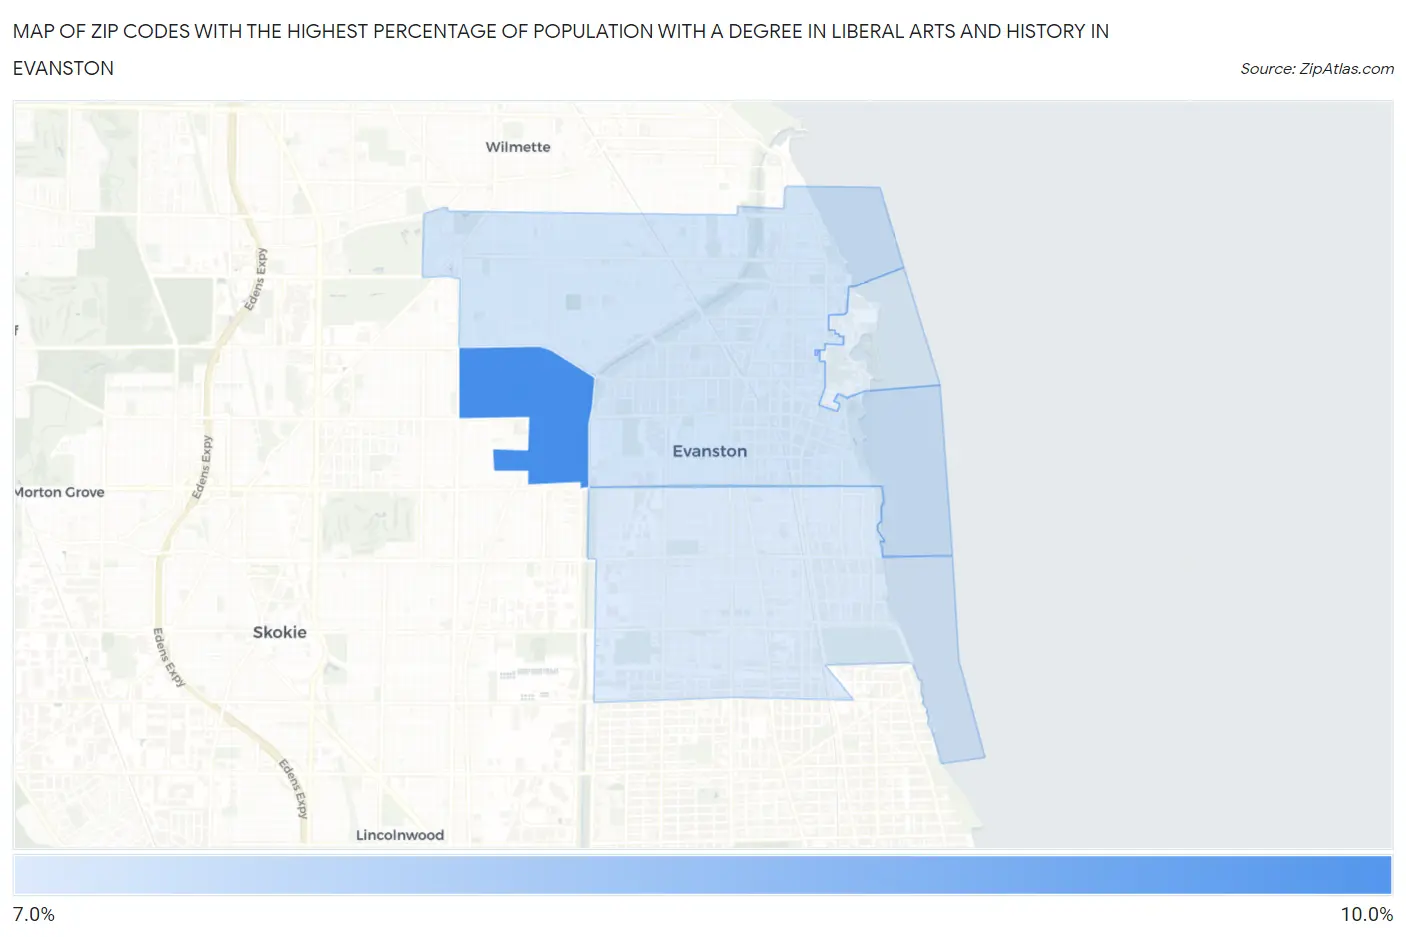
Map of Zip Codes with the Highest Percentage of Population with a Degree in Liberal Arts and History in Evanston
8.0%
8.9%
Zip Codes with the Highest Percentage of Population with a Degree in Liberal Arts and History in Evanston, IL
| Zip Code | % Graduates | vs State | vs National | |
| 1. | 60203 | 8.9% | 4.7%(+4.19)#144 | 4.9%(+4.03)#3,934 |
| 2. | 60201 | 8.0% | 4.7%(+3.32)#175 | 4.9%(+3.16)#4,863 |
| 3. | 60202 | 8.0% | 4.7%(+3.26)#178 | 4.9%(+3.10)#4,921 |
1
Common Questions
What are the Top 3 Zip Codes with the Highest Percentage of Population with a Degree in Liberal Arts and History in Evanston, IL?
Top 3 Zip Codes with the Highest Percentage of Population with a Degree in Liberal Arts and History in Evanston, IL are:
What zip code has the Highest Percentage of Population with a Degree in Liberal Arts and History in Evanston, IL?
60203 has the Highest Percentage of Population with a Degree in Liberal Arts and History in Evanston, IL with 8.9%.
What is the Percentage of Population with a Degree in Liberal Arts and History in Evanston, IL?
Percentage of Population with a Degree in Liberal Arts and History in Evanston is 8.0%.
What is the Percentage of Population with a Degree in Liberal Arts and History in Illinois?
Percentage of Population with a Degree in Liberal Arts and History in Illinois is 4.7%.
What is the Percentage of Population with a Degree in Liberal Arts and History in the United States?
Percentage of Population with a Degree in Liberal Arts and History in the United States is 4.9%.