Zip Codes with the Highest Percentage of Population with a Degree in Liberal Arts and History in Peoria, IL
RELATED REPORTS & OPTIONS
Liberal Arts and History
Peoria
Compare Zip Codes
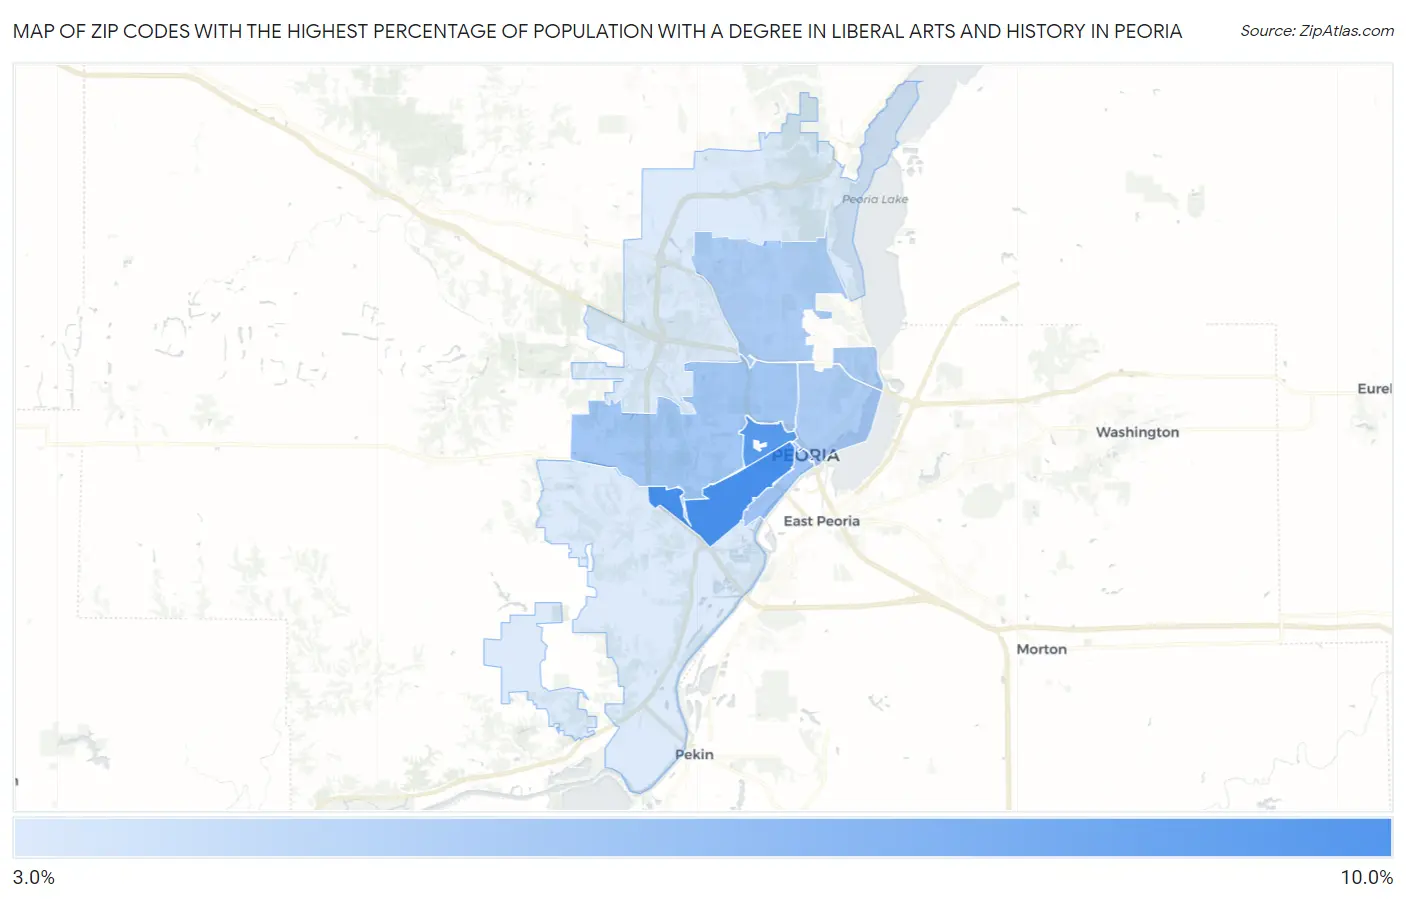
Map of Zip Codes with the Highest Percentage of Population with a Degree in Liberal Arts and History in Peoria
3.9%
8.2%
Zip Codes with the Highest Percentage of Population with a Degree in Liberal Arts and History in Peoria, IL
| Zip Code | % Graduates | vs State | vs National | |
| 1. | 61605 | 8.2% | 4.7%(+3.47)#168 | 4.9%(+3.31)#4,682 |
| 2. | 61606 | 7.7% | 4.7%(+2.99)#196 | 4.9%(+2.84)#5,286 |
| 3. | 61602 | 5.6% | 4.7%(+0.874)#370 | 4.9%(+0.714)#9,605 |
| 4. | 61604 | 5.6% | 4.7%(+0.844)#373 | 4.9%(+0.685)#9,676 |
| 5. | 61614 | 5.3% | 4.7%(+0.587)#409 | 4.9%(+0.428)#10,444 |
| 6. | 61603 | 5.3% | 4.7%(+0.538)#416 | 4.9%(+0.379)#10,597 |
| 7. | 61615 | 3.9% | 4.7%(-0.792)#591 | 4.9%(-0.951)#15,108 |
| 8. | 61607 | 3.9% | 4.7%(-0.794)#592 | 4.9%(-0.953)#15,112 |
1
Common Questions
What are the Top 5 Zip Codes with the Highest Percentage of Population with a Degree in Liberal Arts and History in Peoria, IL?
Top 5 Zip Codes with the Highest Percentage of Population with a Degree in Liberal Arts and History in Peoria, IL are:
What zip code has the Highest Percentage of Population with a Degree in Liberal Arts and History in Peoria, IL?
61605 has the Highest Percentage of Population with a Degree in Liberal Arts and History in Peoria, IL with 8.2%.
What is the Percentage of Population with a Degree in Liberal Arts and History in Peoria, IL?
Percentage of Population with a Degree in Liberal Arts and History in Peoria is 4.9%.
What is the Percentage of Population with a Degree in Liberal Arts and History in Illinois?
Percentage of Population with a Degree in Liberal Arts and History in Illinois is 4.7%.
What is the Percentage of Population with a Degree in Liberal Arts and History in the United States?
Percentage of Population with a Degree in Liberal Arts and History in the United States is 4.9%.