Southern View, IL Map & Demographics
Southern View Map
Southern View Overview
$31,456
PER CAPITA INCOME
$75,977
AVG FAMILY INCOME
$51,311
AVG HOUSEHOLD INCOME
35.9%
WAGE / INCOME GAP [ % ]
64.1¢/ $1
WAGE / INCOME GAP [ $ ]
0.41
INEQUALITY / GINI INDEX
1,784
TOTAL POPULATION
818
MALE POPULATION
966
FEMALE POPULATION
84.68
MALES / 100 FEMALES
118.09
FEMALES / 100 MALES
45.0
MEDIAN AGE
2.8
AVG FAMILY SIZE
2.0
AVG HOUSEHOLD SIZE
993
LABOR FORCE [ PEOPLE ]
64.4%
PERCENT IN LABOR FORCE
9.0%
UNEMPLOYMENT RATE
Southern View Area Codes
Income in Southern View
Income Overview in Southern View
Per Capita Income in Southern View is $31,456, while median incomes of families and households are $75,977 and $51,311 respectively.
| Characteristic | Number | Measure |
| Per Capita Income | 1,784 | $31,456 |
| Median Family Income | 397 | $75,977 |
| Mean Family Income | 397 | $77,815 |
| Median Household Income | 823 | $51,311 |
| Mean Household Income | 823 | $62,248 |
| Income Deficit | 397 | $0 |
| Wage / Income Gap (%) | 1,784 | 35.90% |
| Wage / Income Gap ($) | 1,784 | 64.10¢ per $1 |
| Gini / Inequality Index | 1,784 | 0.41 |
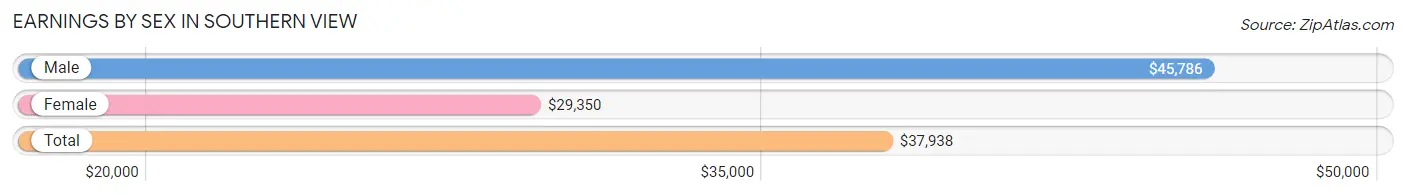
Earnings by Sex in Southern View
Average Earnings in Southern View are $37,938, $45,786 for men and $29,350 for women, a difference of 35.9%.
| Sex | Number | Average Earnings |
| Male | 472 (47.7%) | $45,786 |
| Female | 517 (52.3%) | $29,350 |
| Total | 989 (100.0%) | $37,938 |
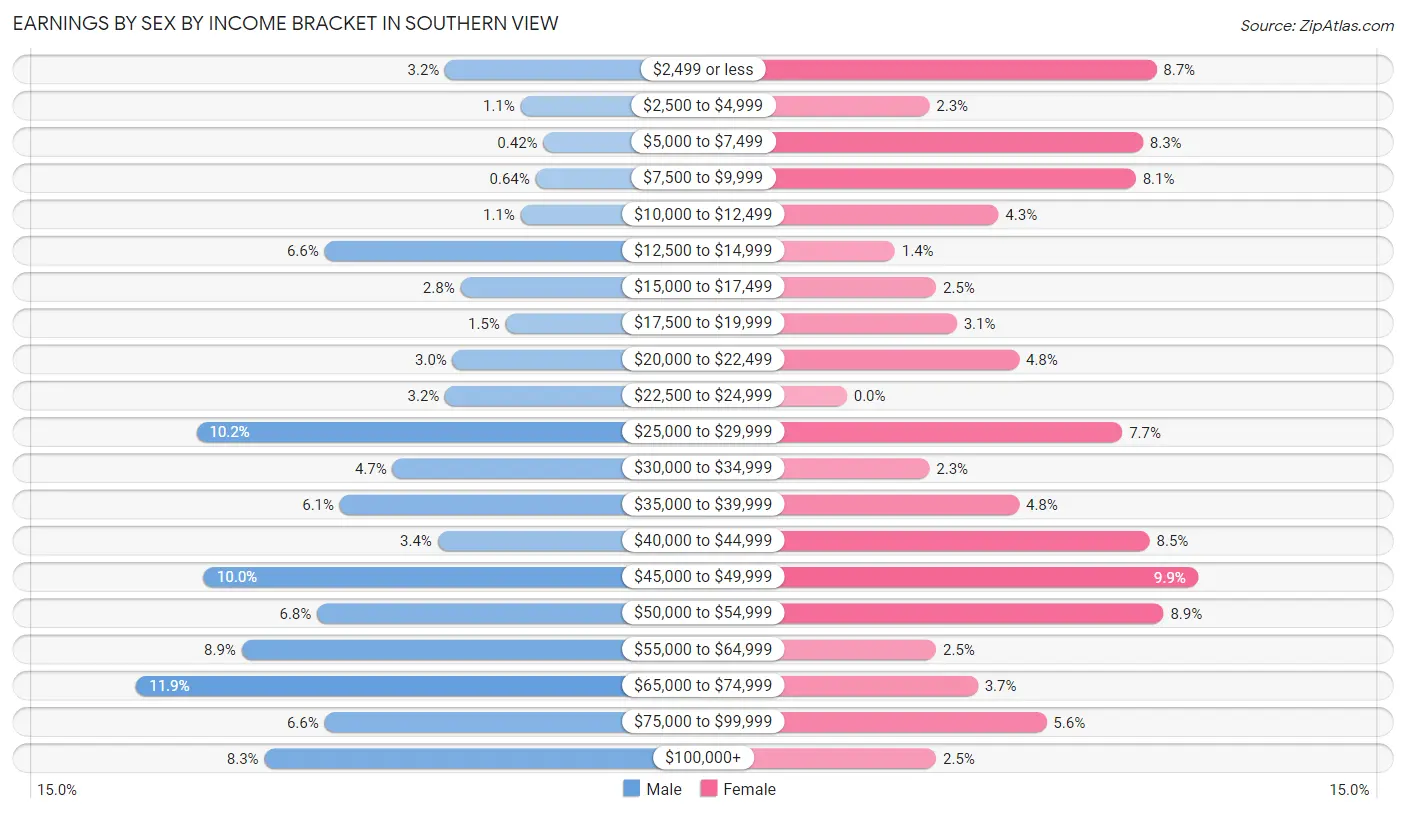
Earnings by Sex by Income Bracket in Southern View
The most common earnings brackets in Southern View are $65,000 to $74,999 for men (56 | 11.9%) and $45,000 to $49,999 for women (51 | 9.9%).
| Income | Male | Female |
| $2,499 or less | 15 (3.2%) | 45 (8.7%) |
| $2,500 to $4,999 | 5 (1.1%) | 12 (2.3%) |
| $5,000 to $7,499 | 2 (0.4%) | 43 (8.3%) |
| $7,500 to $9,999 | 3 (0.6%) | 42 (8.1%) |
| $10,000 to $12,499 | 5 (1.1%) | 22 (4.3%) |
| $12,500 to $14,999 | 31 (6.6%) | 7 (1.3%) |
| $15,000 to $17,499 | 13 (2.8%) | 13 (2.5%) |
| $17,500 to $19,999 | 7 (1.5%) | 16 (3.1%) |
| $20,000 to $22,499 | 14 (3.0%) | 25 (4.8%) |
| $22,500 to $24,999 | 15 (3.2%) | 0 (0.0%) |
| $25,000 to $29,999 | 48 (10.2%) | 40 (7.7%) |
| $30,000 to $34,999 | 22 (4.7%) | 12 (2.3%) |
| $35,000 to $39,999 | 29 (6.1%) | 25 (4.8%) |
| $40,000 to $44,999 | 16 (3.4%) | 44 (8.5%) |
| $45,000 to $49,999 | 47 (10.0%) | 51 (9.9%) |
| $50,000 to $54,999 | 32 (6.8%) | 46 (8.9%) |
| $55,000 to $64,999 | 42 (8.9%) | 13 (2.5%) |
| $65,000 to $74,999 | 56 (11.9%) | 19 (3.7%) |
| $75,000 to $99,999 | 31 (6.6%) | 29 (5.6%) |
| $100,000+ | 39 (8.3%) | 13 (2.5%) |
| Total | 472 (100.0%) | 517 (100.0%) |
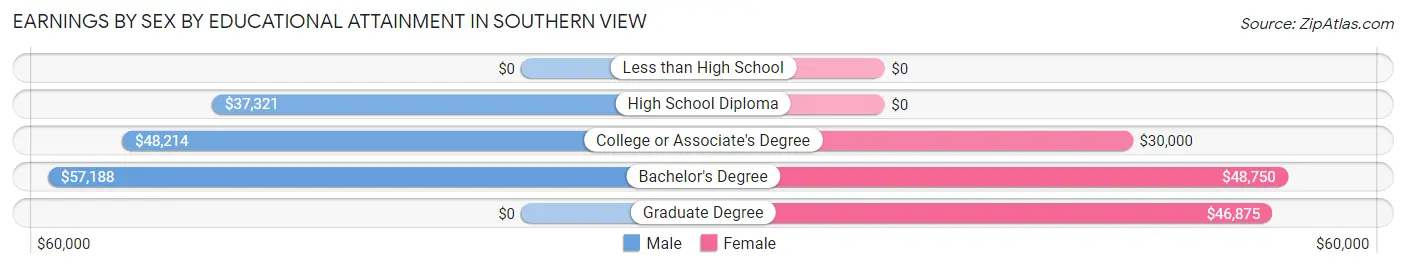
Earnings by Sex by Educational Attainment in Southern View
Average earnings in Southern View are $48,542 for men and $31,429 for women, a difference of 35.2%. Men with an educational attainment of bachelor's degree enjoy the highest average annual earnings of $57,188, while those with high school diploma education earn the least with $37,321. Women with an educational attainment of bachelor's degree earn the most with the average annual earnings of $48,750, while those with college or associate's degree education have the smallest earnings of $30,000.
| Educational Attainment | Male Income | Female Income |
| Less than High School | - | - |
| High School Diploma | $37,321 | $0 |
| College or Associate's Degree | $48,214 | $30,000 |
| Bachelor's Degree | $57,188 | $48,750 |
| Graduate Degree | - | - |
| Total | $48,542 | $31,429 |
Family Income in Southern View
Family Income Brackets in Southern View
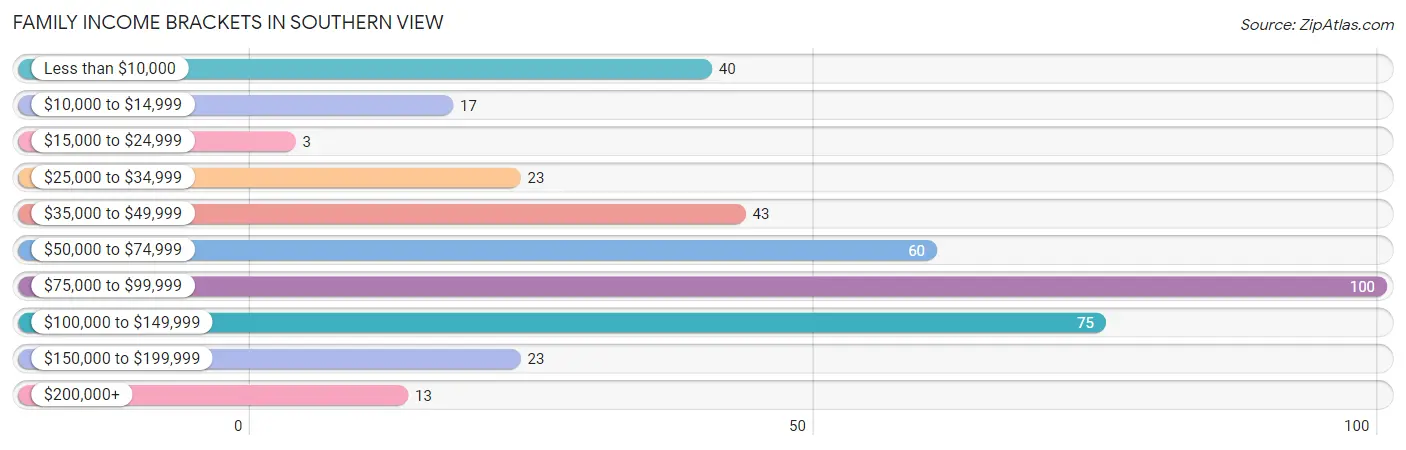
According to the Southern View family income data, there are 100 families falling into the $75,000 to $99,999 income range, which is the most common income bracket and makes up 25.2% of all families. Conversely, the $15,000 to $24,999 income bracket is the least frequent group with only 3 families (0.8%) belonging to this category.
| Income Bracket | # Families | % Families |
| Less than $10,000 | 40 | 10.1% |
| $10,000 to $14,999 | 17 | 4.3% |
| $15,000 to $24,999 | 3 | 0.8% |
| $25,000 to $34,999 | 23 | 5.8% |
| $35,000 to $49,999 | 43 | 10.8% |
| $50,000 to $74,999 | 60 | 15.1% |
| $75,000 to $99,999 | 100 | 25.2% |
| $100,000 to $149,999 | 75 | 18.9% |
| $150,000 to $199,999 | 23 | 5.8% |
| $200,000+ | 13 | 3.3% |
Family Income by Famaliy Size in Southern View
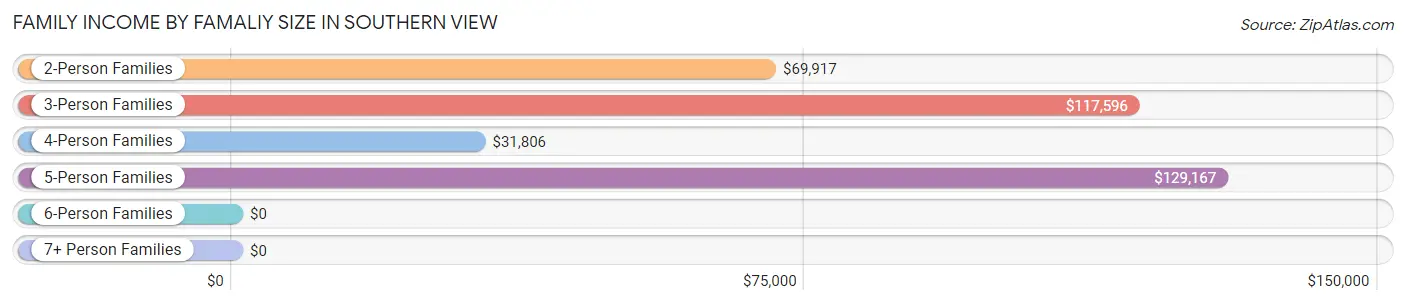
5-person families (16 | 4.0%) account for the highest median family income in Southern View with $129,167 per family, while 3-person families (99 | 24.9%) have the highest median income of $39,199 per family member.
| Income Bracket | # Families | Median Income |
| 2-Person Families | 253 (63.7%) | $69,917 |
| 3-Person Families | 99 (24.9%) | $117,596 |
| 4-Person Families | 13 (3.3%) | $31,806 |
| 5-Person Families | 16 (4.0%) | $129,167 |
| 6-Person Families | 16 (4.0%) | $0 |
| 7+ Person Families | 0 (0.0%) | $0 |
| Total | 397 (100.0%) | $75,977 |
Family Income by Number of Earners in Southern View
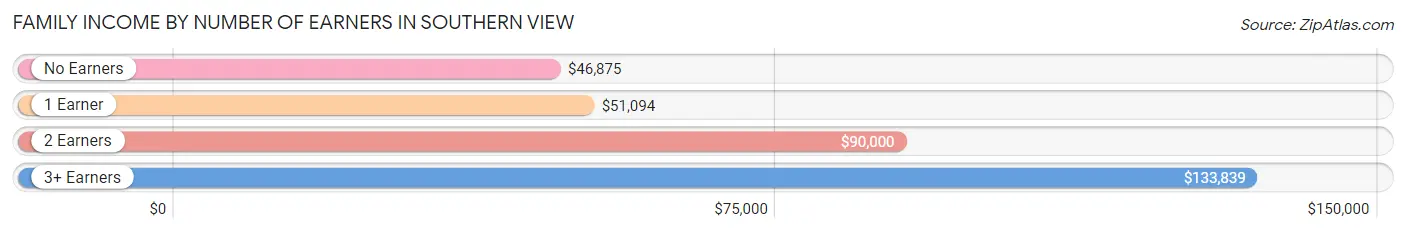
The median family income in Southern View is $75,977, with families comprising 3+ earners (53) having the highest median family income of $133,839, while families with no earners (64) have the lowest median family income of $46,875, accounting for 13.4% and 16.1% of families, respectively.
| Number of Earners | # Families | Median Income |
| No Earners | 64 (16.1%) | $46,875 |
| 1 Earner | 166 (41.8%) | $51,094 |
| 2 Earners | 114 (28.7%) | $90,000 |
| 3+ Earners | 53 (13.4%) | $133,839 |
| Total | 397 (100.0%) | $75,977 |
Household Income in Southern View
Household Income Brackets in Southern View
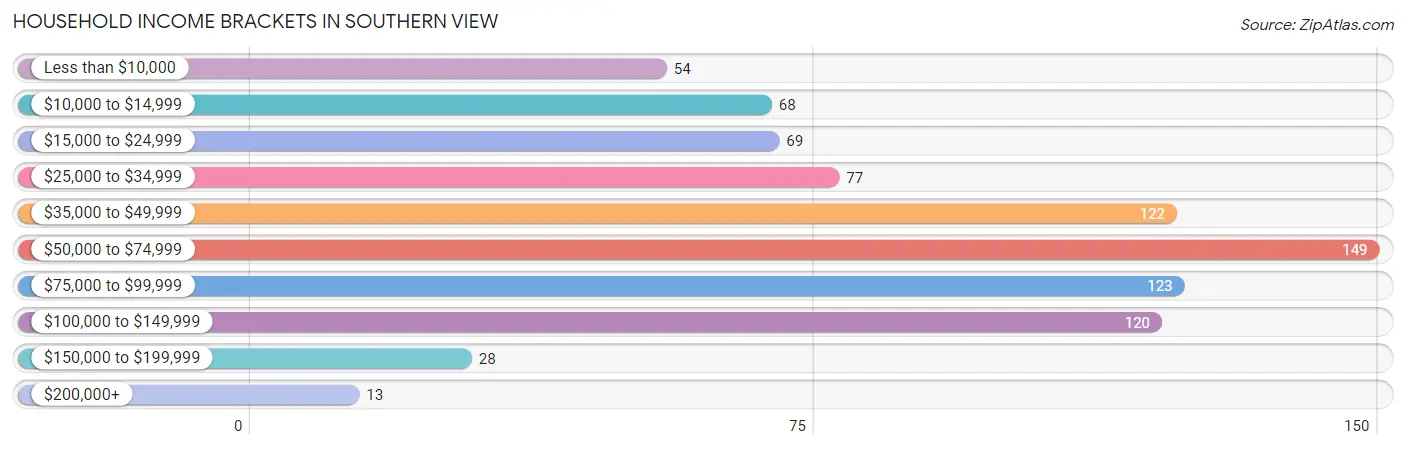
With 149 households falling in the category, the $50,000 to $74,999 income range is the most frequent in Southern View, accounting for 18.1% of all households. In contrast, only 13 households (1.6%) fall into the $200,000+ income bracket, making it the least populous group.
| Income Bracket | # Households | % Households |
| Less than $10,000 | 54 | 6.6% |
| $10,000 to $14,999 | 68 | 8.3% |
| $15,000 to $24,999 | 69 | 8.4% |
| $25,000 to $34,999 | 77 | 9.4% |
| $35,000 to $49,999 | 122 | 14.8% |
| $50,000 to $74,999 | 149 | 18.1% |
| $75,000 to $99,999 | 123 | 14.9% |
| $100,000 to $149,999 | 120 | 14.6% |
| $150,000 to $199,999 | 28 | 3.4% |
| $200,000+ | 13 | 1.6% |
Household Income by Householder Age in Southern View
The median household income in Southern View is $51,311, with the highest median household income of $75,833 found in the 45 to 64 years age bracket for the primary householder. A total of 302 households (36.7%) fall into this category. Meanwhile, the 65+ years age bracket for the primary householder has the lowest median household income of $39,286, with 248 households (30.1%) in this group.
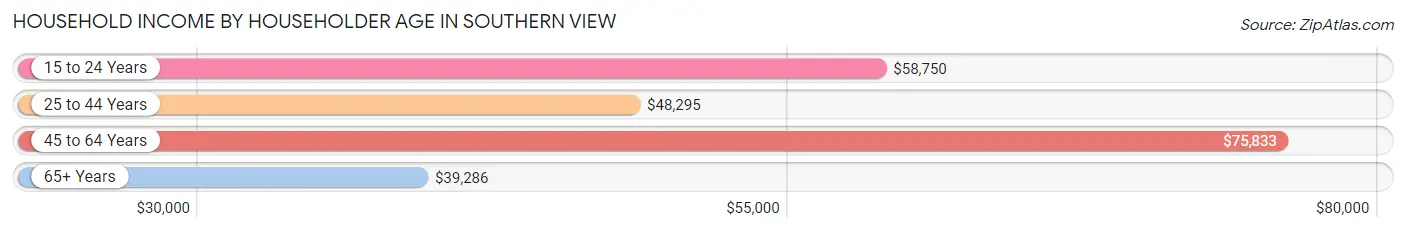
| Income Bracket | # Households | Median Income |
| 15 to 24 Years | 14 (1.7%) | $58,750 |
| 25 to 44 Years | 259 (31.5%) | $48,295 |
| 45 to 64 Years | 302 (36.7%) | $75,833 |
| 65+ Years | 248 (30.1%) | $39,286 |
| Total | 823 (100.0%) | $51,311 |
Poverty in Southern View
Income Below Poverty by Sex and Age in Southern View
With 13.6% poverty level for males and 22.6% for females among the residents of Southern View, 5 year old males and 15 year old females are the most vulnerable to poverty, with 4 males (100.0%) and 35 females (89.7%) in their respective age groups living below the poverty level.
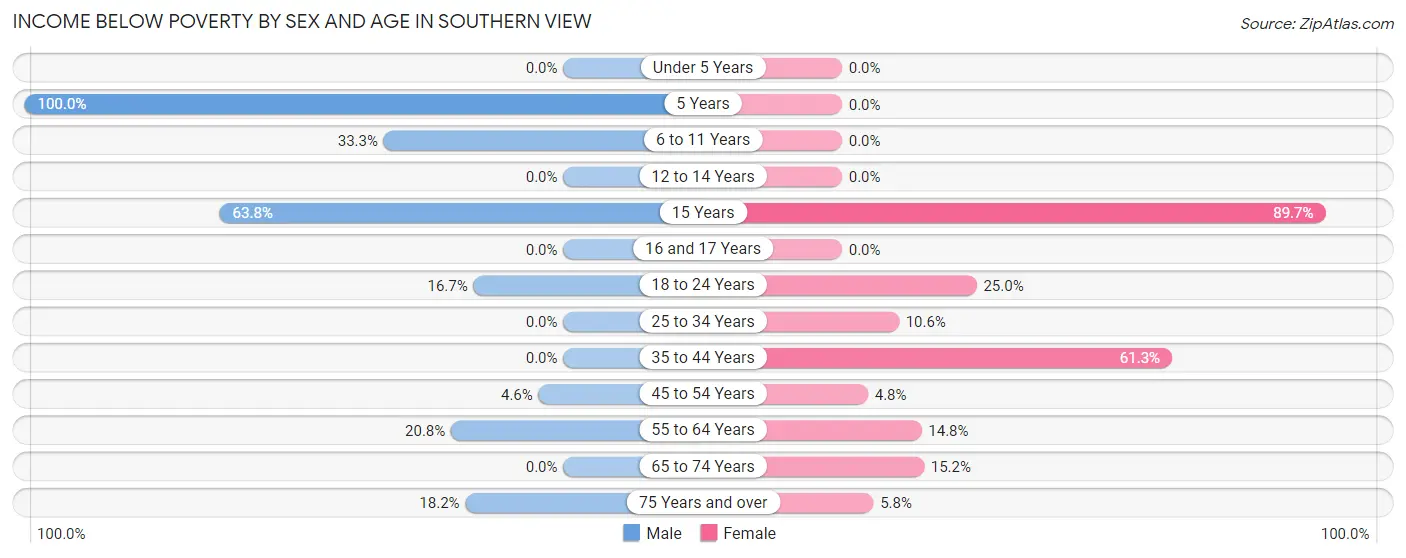
| Age Bracket | Male | Female |
| Under 5 Years | 0 (0.0%) | 0 (0.0%) |
| 5 Years | 4 (100.0%) | 0 (0.0%) |
| 6 to 11 Years | 14 (33.3%) | 0 (0.0%) |
| 12 to 14 Years | 0 (0.0%) | 0 (0.0%) |
| 15 Years | 37 (63.8%) | 35 (89.7%) |
| 16 and 17 Years | 0 (0.0%) | 0 (0.0%) |
| 18 to 24 Years | 11 (16.7%) | 17 (25.0%) |
| 25 to 34 Years | 0 (0.0%) | 17 (10.6%) |
| 35 to 44 Years | 0 (0.0%) | 87 (61.3%) |
| 45 to 54 Years | 5 (4.6%) | 4 (4.8%) |
| 55 to 64 Years | 30 (20.8%) | 26 (14.8%) |
| 65 to 74 Years | 0 (0.0%) | 14 (15.2%) |
| 75 Years and over | 8 (18.2%) | 6 (5.8%) |
| Total | 109 (13.6%) | 206 (22.6%) |
Income Above Poverty by Sex and Age in Southern View
According to the poverty statistics in Southern View, males aged under 5 years and females aged 5 years are the age groups that are most secure financially, with 100.0% of males and 100.0% of females in these age groups living above the poverty line.
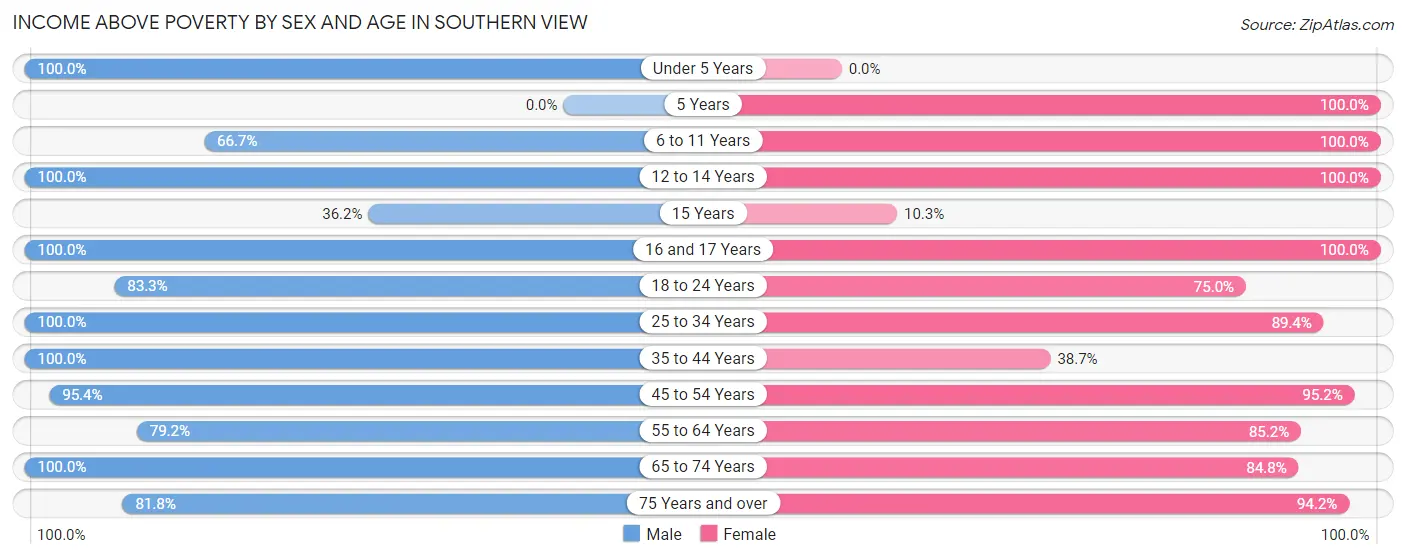
| Age Bracket | Male | Female |
| Under 5 Years | 12 (100.0%) | 0 (0.0%) |
| 5 Years | 0 (0.0%) | 3 (100.0%) |
| 6 to 11 Years | 28 (66.7%) | 25 (100.0%) |
| 12 to 14 Years | 50 (100.0%) | 9 (100.0%) |
| 15 Years | 21 (36.2%) | 4 (10.3%) |
| 16 and 17 Years | 8 (100.0%) | 12 (100.0%) |
| 18 to 24 Years | 55 (83.3%) | 51 (75.0%) |
| 25 to 34 Years | 109 (100.0%) | 144 (89.4%) |
| 35 to 44 Years | 83 (100.0%) | 55 (38.7%) |
| 45 to 54 Years | 104 (95.4%) | 79 (95.2%) |
| 55 to 64 Years | 114 (79.2%) | 150 (85.2%) |
| 65 to 74 Years | 72 (100.0%) | 78 (84.8%) |
| 75 Years and over | 36 (81.8%) | 97 (94.2%) |
| Total | 692 (86.4%) | 707 (77.4%) |
Income Below Poverty Among Married-Couple Families in Southern View
The poverty statistics for married-couple families in Southern View show that 2.9% or 8 of the total 278 families live below the poverty line. Families with no children have the highest poverty rate of 3.6%, comprising of 8 families. On the other hand, families with 1 or 2 children have the lowest poverty rate of 0.0%, which includes 0 families.
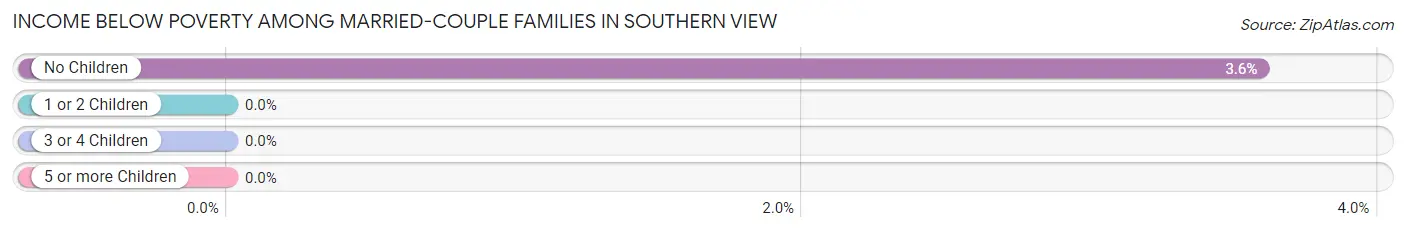
| Children | Above Poverty | Below Poverty |
| No Children | 215 (96.4%) | 8 (3.6%) |
| 1 or 2 Children | 39 (100.0%) | 0 (0.0%) |
| 3 or 4 Children | 16 (100.0%) | 0 (0.0%) |
| 5 or more Children | 0 (0.0%) | 0 (0.0%) |
| Total | 270 (97.1%) | 8 (2.9%) |
Income Below Poverty Among Single-Parent Households in Southern View
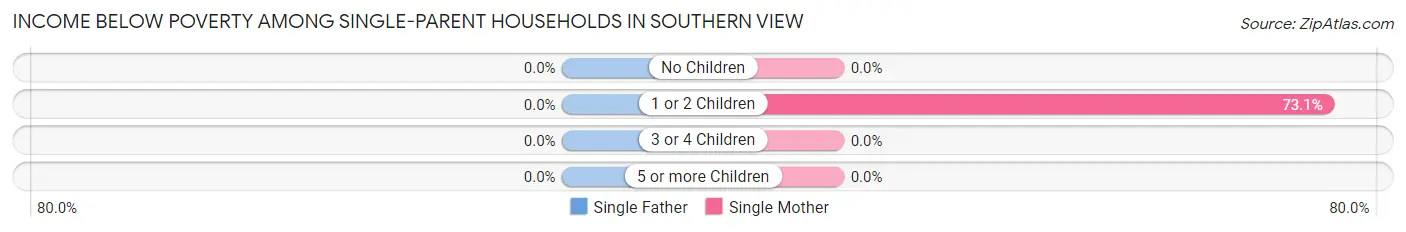
| Children | Single Father | Single Mother |
| No Children | 0 (0.0%) | 0 (0.0%) |
| 1 or 2 Children | 0 (0.0%) | 49 (73.1%) |
| 3 or 4 Children | 0 (0.0%) | 0 (0.0%) |
| 5 or more Children | 0 (0.0%) | 0 (0.0%) |
| Total | 0 (0.0%) | 49 (46.2%) |
Income Below Poverty Among Married-Couple vs Single-Parent Households in Southern View
The poverty data for Southern View shows that 8 of the married-couple family households (2.9%) and 49 of the single-parent households (41.2%) are living below the poverty level. Within the married-couple family households, those with no children have the highest poverty rate, with 8 households (3.6%) falling below the poverty line. Among the single-parent households, those with 1 or 2 children have the highest poverty rate, with 49 household (70.0%) living below poverty.
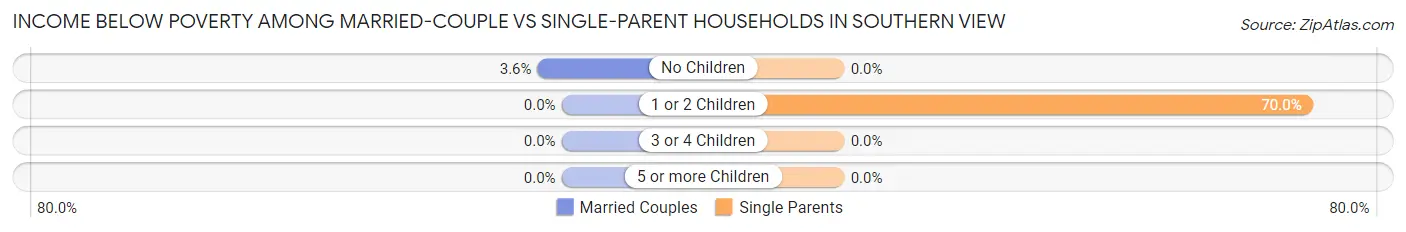
| Children | Married-Couple Families | Single-Parent Households |
| No Children | 8 (3.6%) | 0 (0.0%) |
| 1 or 2 Children | 0 (0.0%) | 49 (70.0%) |
| 3 or 4 Children | 0 (0.0%) | 0 (0.0%) |
| 5 or more Children | 0 (0.0%) | 0 (0.0%) |
| Total | 8 (2.9%) | 49 (41.2%) |
Race in Southern View
The most populous races in Southern View are White / Caucasian (1,532 | 85.9%), Black / African American (129 | 7.2%), and Hispanic or Latino (103 | 5.8%).
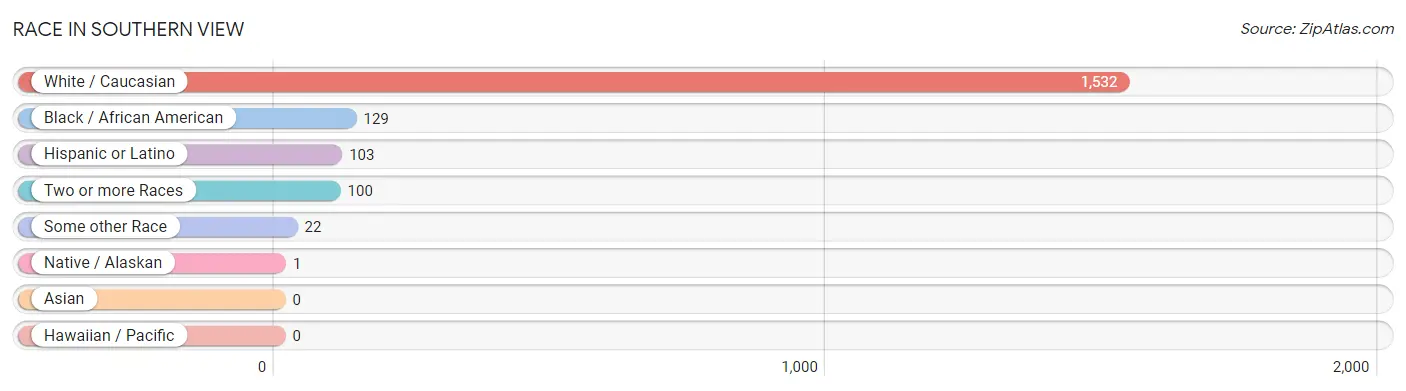
| Race | # Population | % Population |
| Asian | 0 | 0.0% |
| Black / African American | 129 | 7.2% |
| Hawaiian / Pacific | 0 | 0.0% |
| Hispanic or Latino | 103 | 5.8% |
| Native / Alaskan | 1 | 0.1% |
| White / Caucasian | 1,532 | 85.9% |
| Two or more Races | 100 | 5.6% |
| Some other Race | 22 | 1.2% |
| Total | 1,784 | 100.0% |
Ancestry in Southern View
The most populous ancestries reported in Southern View are German (305 | 17.1%), Irish (283 | 15.9%), English (126 | 7.1%), Italian (109 | 6.1%), and Mexican (89 | 5.0%), together accounting for 51.1% of all Southern View residents.
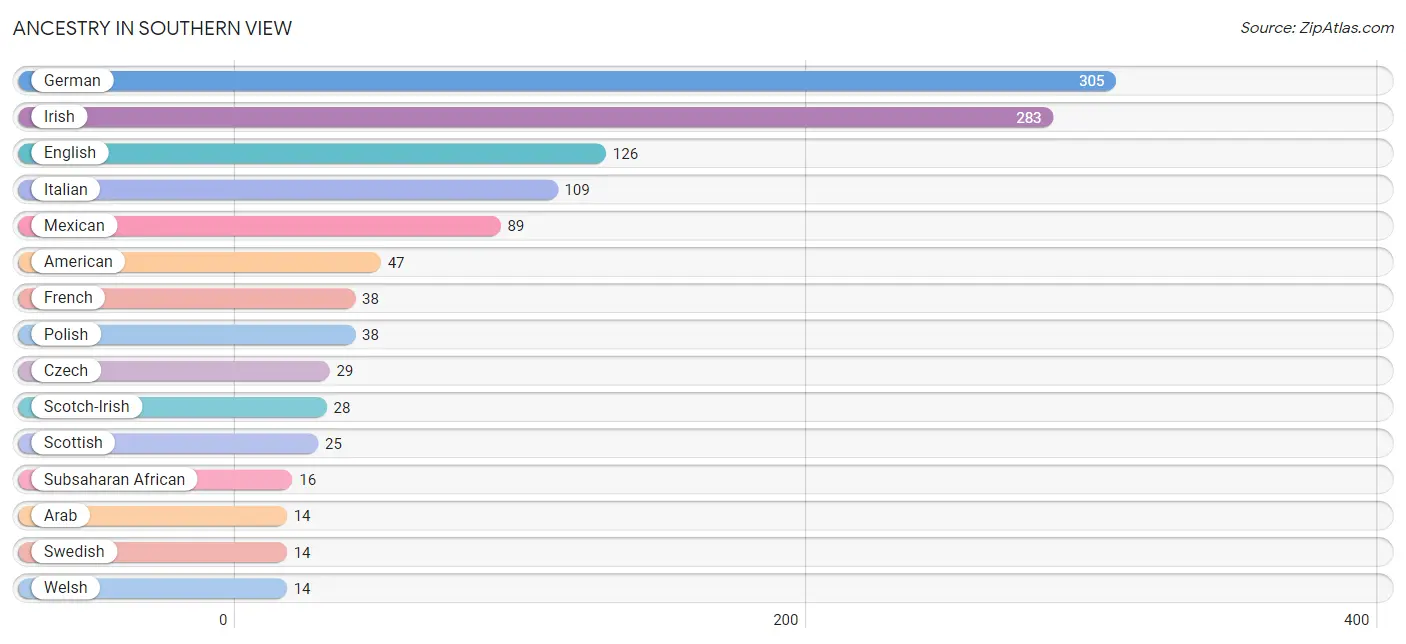
| Ancestry | # Population | % Population |
| African | 4 | 0.2% |
| American | 47 | 2.6% |
| Arab | 14 | 0.8% |
| Austrian | 11 | 0.6% |
| British | 12 | 0.7% |
| Central American | 5 | 0.3% |
| Cherokee | 8 | 0.4% |
| Costa Rican | 5 | 0.3% |
| Czech | 29 | 1.6% |
| Danish | 4 | 0.2% |
| Dutch | 11 | 0.6% |
| Eastern European | 4 | 0.2% |
| English | 126 | 7.1% |
| European | 7 | 0.4% |
| Finnish | 5 | 0.3% |
| French | 38 | 2.1% |
| French Canadian | 12 | 0.7% |
| German | 305 | 17.1% |
| Greek | 11 | 0.6% |
| Indian (Asian) | 9 | 0.5% |
| Iranian | 7 | 0.4% |
| Irish | 283 | 15.9% |
| Italian | 109 | 6.1% |
| Korean | 9 | 0.5% |
| Lithuanian | 7 | 0.4% |
| Mexican | 89 | 5.0% |
| Nigerian | 12 | 0.7% |
| Norwegian | 1 | 0.1% |
| Polish | 38 | 2.1% |
| Portuguese | 3 | 0.2% |
| Russian | 3 | 0.2% |
| Samoan | 9 | 0.5% |
| Scandinavian | 7 | 0.4% |
| Scotch-Irish | 28 | 1.6% |
| Scottish | 25 | 1.4% |
| Serbian | 10 | 0.6% |
| Spaniard | 9 | 0.5% |
| Subsaharan African | 16 | 0.9% |
| Swedish | 14 | 0.8% |
| Welsh | 14 | 0.8% | View All 40 Rows |
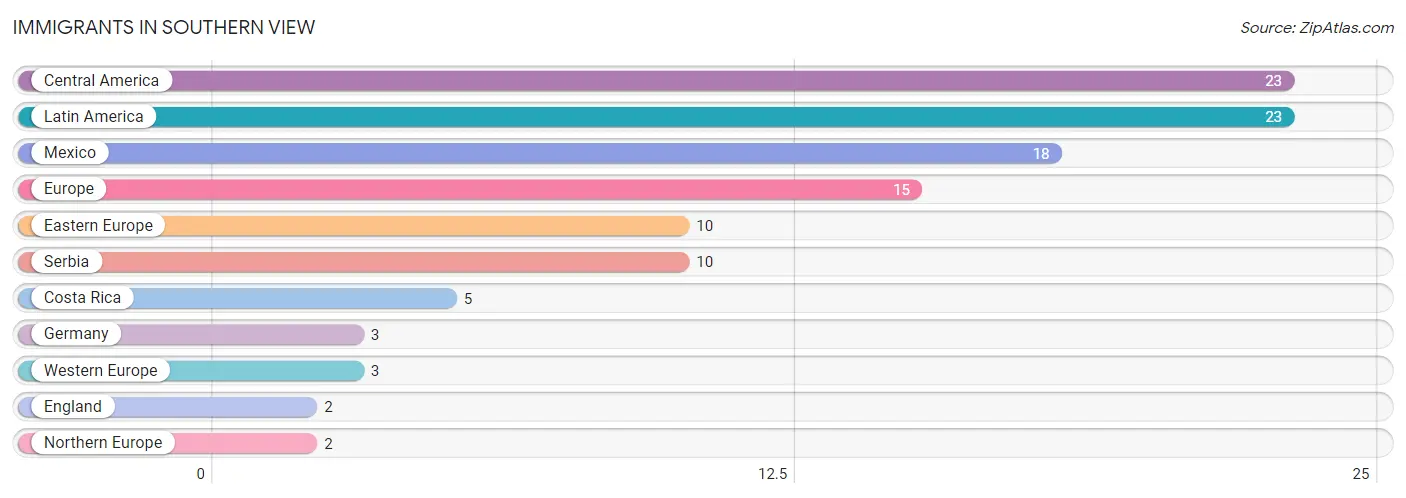
Immigrants in Southern View
The most numerous immigrant groups reported in Southern View came from Central America (23 | 1.3%), Latin America (23 | 1.3%), Mexico (18 | 1.0%), Europe (15 | 0.8%), and Eastern Europe (10 | 0.6%), together accounting for 5.0% of all Southern View residents.
| Immigration Origin | # Population | % Population |
| Central America | 23 | 1.3% |
| Costa Rica | 5 | 0.3% |
| Eastern Europe | 10 | 0.6% |
| England | 2 | 0.1% |
| Europe | 15 | 0.8% |
| Germany | 3 | 0.2% |
| Latin America | 23 | 1.3% |
| Mexico | 18 | 1.0% |
| Northern Europe | 2 | 0.1% |
| Serbia | 10 | 0.6% |
| Western Europe | 3 | 0.2% | View All 11 Rows |
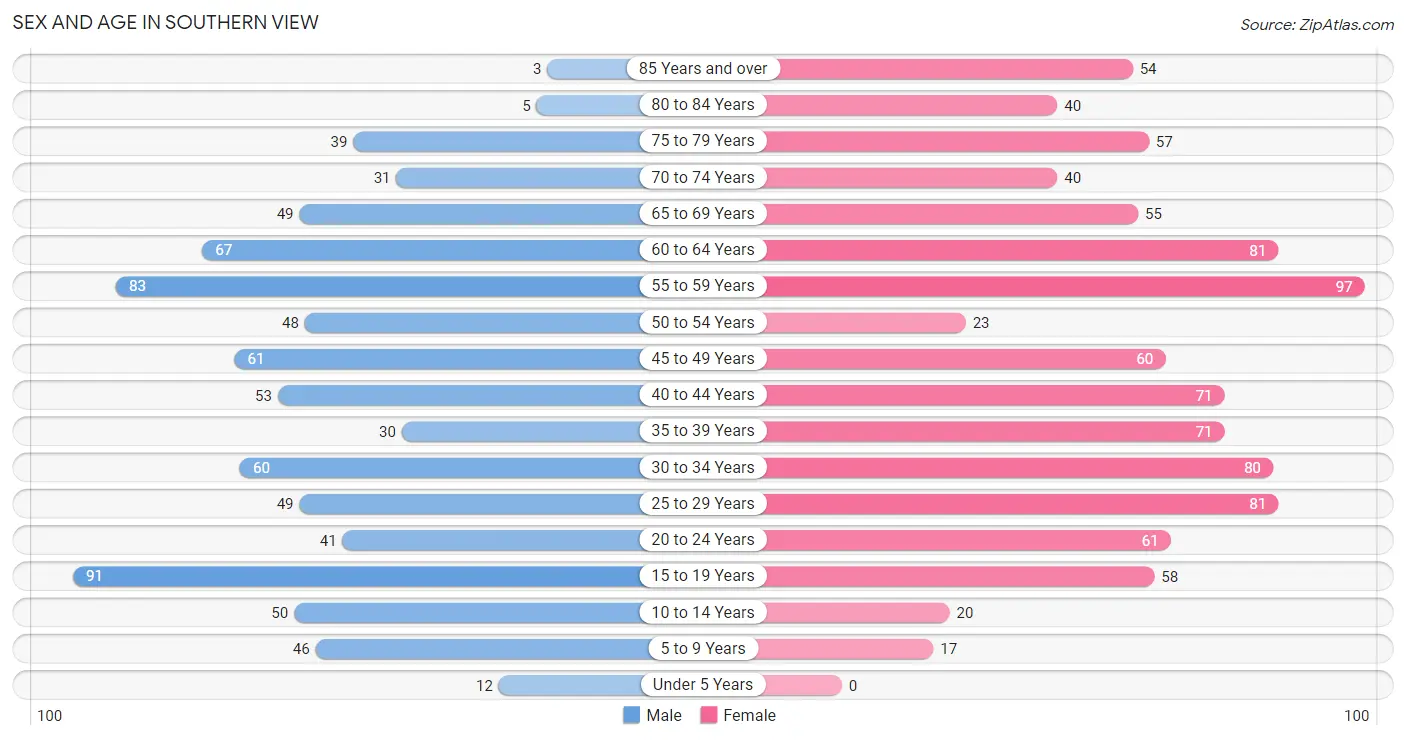
Sex and Age in Southern View
Sex and Age in Southern View
The most populous age groups in Southern View are 15 to 19 Years (91 | 11.1%) for men and 55 to 59 Years (97 | 10.0%) for women.
| Age Bracket | Male | Female |
| Under 5 Years | 12 (1.5%) | 0 (0.0%) |
| 5 to 9 Years | 46 (5.6%) | 17 (1.8%) |
| 10 to 14 Years | 50 (6.1%) | 20 (2.1%) |
| 15 to 19 Years | 91 (11.1%) | 58 (6.0%) |
| 20 to 24 Years | 41 (5.0%) | 61 (6.3%) |
| 25 to 29 Years | 49 (6.0%) | 81 (8.4%) |
| 30 to 34 Years | 60 (7.3%) | 80 (8.3%) |
| 35 to 39 Years | 30 (3.7%) | 71 (7.3%) |
| 40 to 44 Years | 53 (6.5%) | 71 (7.3%) |
| 45 to 49 Years | 61 (7.5%) | 60 (6.2%) |
| 50 to 54 Years | 48 (5.9%) | 23 (2.4%) |
| 55 to 59 Years | 83 (10.2%) | 97 (10.0%) |
| 60 to 64 Years | 67 (8.2%) | 81 (8.4%) |
| 65 to 69 Years | 49 (6.0%) | 55 (5.7%) |
| 70 to 74 Years | 31 (3.8%) | 40 (4.1%) |
| 75 to 79 Years | 39 (4.8%) | 57 (5.9%) |
| 80 to 84 Years | 5 (0.6%) | 40 (4.1%) |
| 85 Years and over | 3 (0.4%) | 54 (5.6%) |
| Total | 818 (100.0%) | 966 (100.0%) |
Families and Households in Southern View
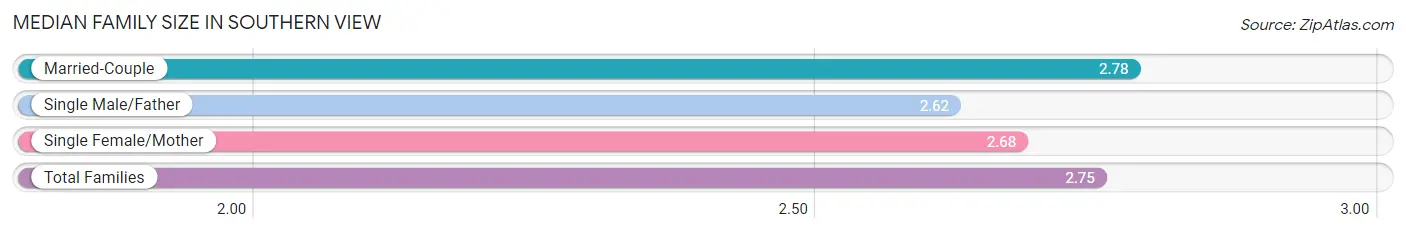
Median Family Size in Southern View
The median family size in Southern View is 2.75 persons per family, with married-couple families (278 | 70.0%) accounting for the largest median family size of 2.78 persons per family. On the other hand, single male/father families (13 | 3.3%) represent the smallest median family size with 2.62 persons per family.
| Family Type | # Families | Family Size |
| Married-Couple | 278 (70.0%) | 2.78 |
| Single Male/Father | 13 (3.3%) | 2.62 |
| Single Female/Mother | 106 (26.7%) | 2.68 |
| Total Families | 397 (100.0%) | 2.75 |
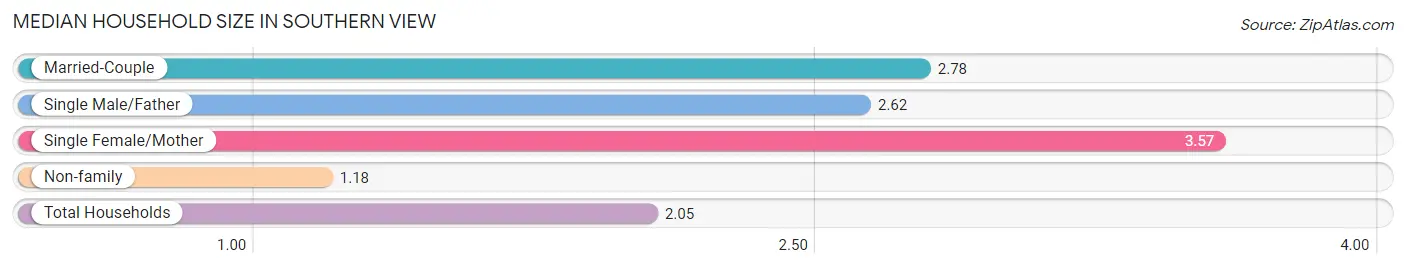
Median Household Size in Southern View
The median household size in Southern View is 2.05 persons per household, with single female/mother households (106 | 12.9%) accounting for the largest median household size of 3.57 persons per household. non-family households (426 | 51.8%) represent the smallest median household size with 1.18 persons per household.
| Household Type | # Households | Household Size |
| Married-Couple | 278 (33.8%) | 2.78 |
| Single Male/Father | 13 (1.6%) | 2.62 |
| Single Female/Mother | 106 (12.9%) | 3.57 |
| Non-family | 426 (51.8%) | 1.18 |
| Total Households | 823 (100.0%) | 2.05 |
Household Size by Marriage Status in Southern View
Out of a total of 823 households in Southern View, 397 (48.2%) are family households, while 426 (51.8%) are nonfamily households. The most numerous type of family households are 2-person households, comprising 205, and the most common type of nonfamily households are 1-person households, comprising 378.
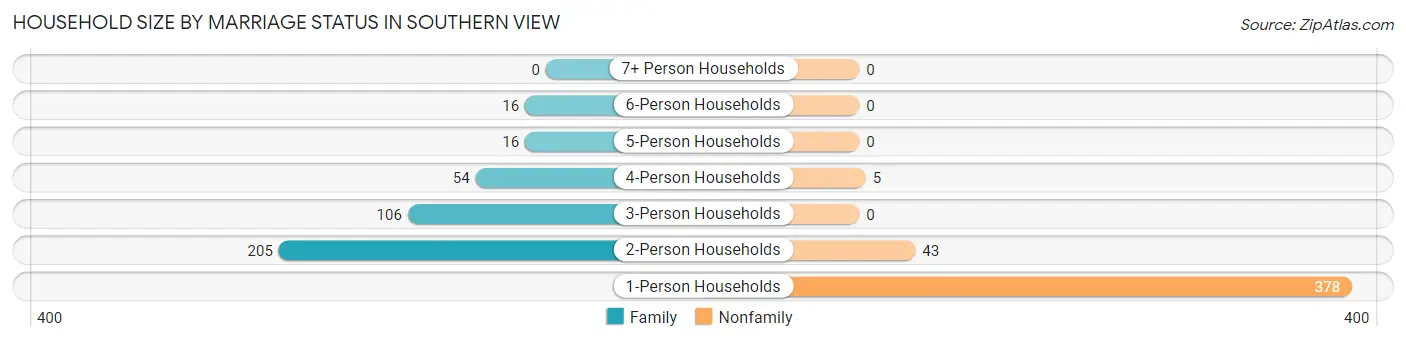
| Household Size | Family Households | Nonfamily Households |
| 1-Person Households | - | 378 (45.9%) |
| 2-Person Households | 205 (24.9%) | 43 (5.2%) |
| 3-Person Households | 106 (12.9%) | 0 (0.0%) |
| 4-Person Households | 54 (6.6%) | 5 (0.6%) |
| 5-Person Households | 16 (1.9%) | 0 (0.0%) |
| 6-Person Households | 16 (1.9%) | 0 (0.0%) |
| 7+ Person Households | 0 (0.0%) | 0 (0.0%) |
| Total | 397 (48.2%) | 426 (51.8%) |
Female Fertility in Southern View
Fertility by Age in Southern View
Average fertility rate in Southern View is 24.0 births per 1,000 women. Women in the age bracket of 35 to 50 years have the highest fertility rate with 56.0 births per 1,000 women. Women in the age bracket of 35 to 50 years acount for 100.0% of all women with births.
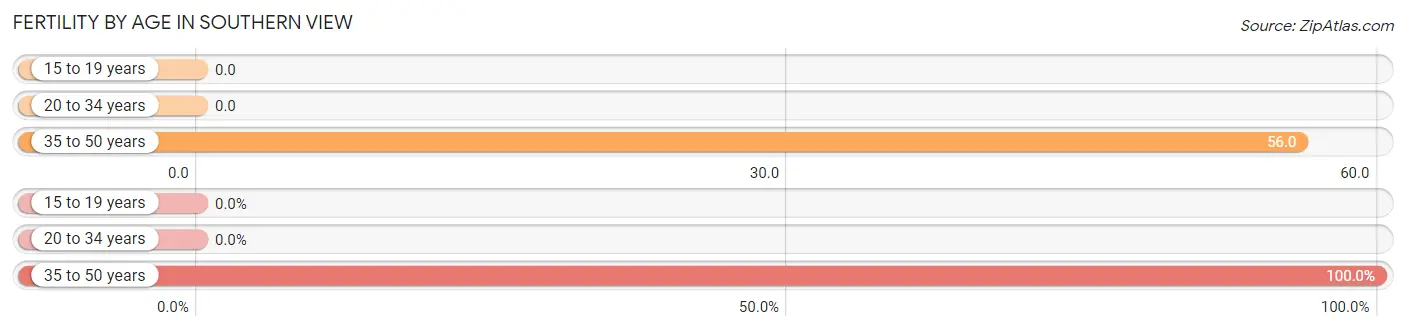
| Age Bracket | Women with Births | Births / 1,000 Women |
| 15 to 19 years | 0 (0.0%) | 0.0 |
| 20 to 34 years | 0 (0.0%) | 0.0 |
| 35 to 50 years | 12 (100.0%) | 56.0 |
| Total | 12 (100.0%) | 24.0 |
Fertility by Age by Marriage Status in Southern View
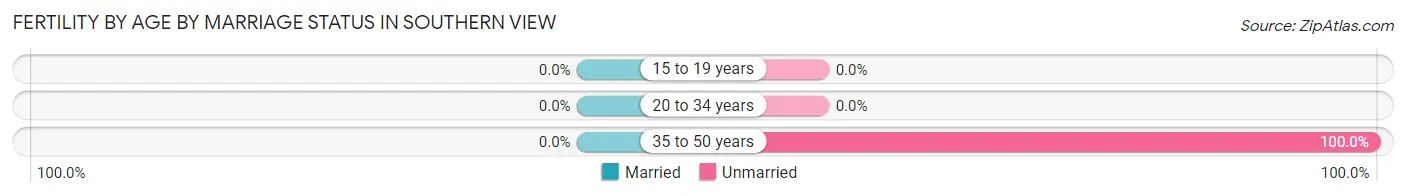
| Age Bracket | Married | Unmarried |
| 15 to 19 years | 0 (0.0%) | 0 (0.0%) |
| 20 to 34 years | 0 (0.0%) | 0 (0.0%) |
| 35 to 50 years | 0 (0.0%) | 12 (100.0%) |
| Total | 0 (0.0%) | 12 (100.0%) |
Fertility by Education in Southern View
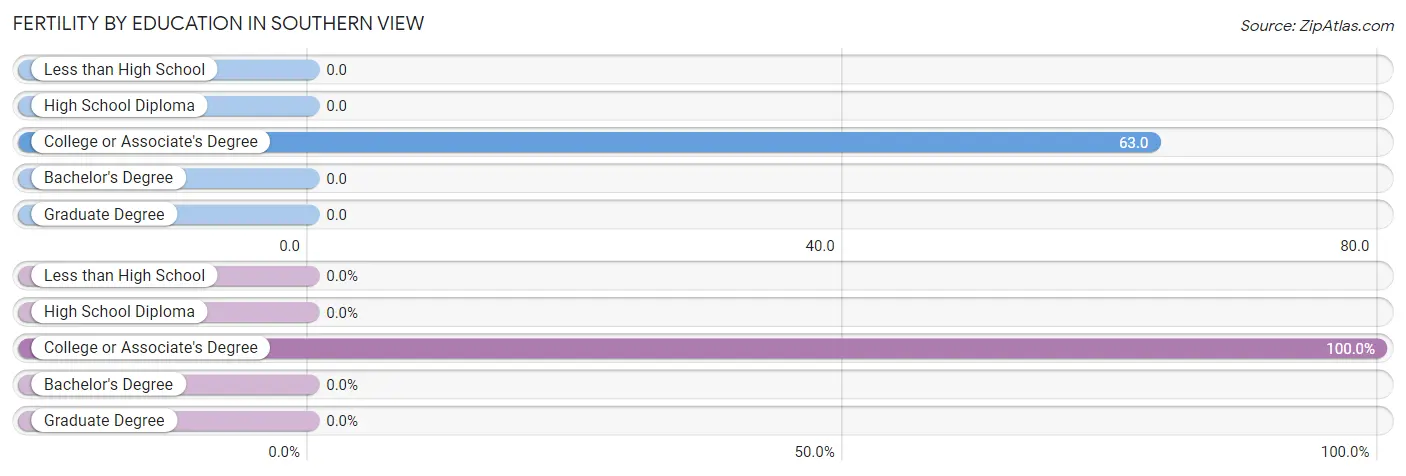
| Educational Attainment | Women with Births | Births / 1,000 Women |
| Less than High School | 0 (0.0%) | 0.0 |
| High School Diploma | 0 (0.0%) | 0.0 |
| College or Associate's Degree | 12 (100.0%) | 63.0 |
| Bachelor's Degree | 0 (0.0%) | 0.0 |
| Graduate Degree | 0 (0.0%) | 0.0 |
| Total | 12 (100.0%) | 24.0 |
Fertility by Education by Marriage Status in Southern View
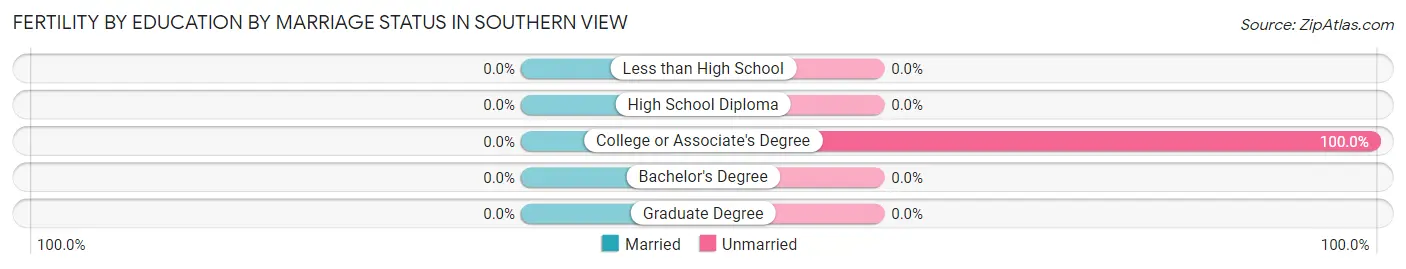
| Educational Attainment | Married | Unmarried |
| Less than High School | 0 (0.0%) | 0 (0.0%) |
| High School Diploma | 0 (0.0%) | 0 (0.0%) |
| College or Associate's Degree | 0 (0.0%) | 12 (100.0%) |
| Bachelor's Degree | 0 (0.0%) | 0 (0.0%) |
| Graduate Degree | 0 (0.0%) | 0 (0.0%) |
| Total | 0 (0.0%) | 12 (100.0%) |
Employment Characteristics in Southern View
Employment by Class of Employer in Southern View
Among the 888 employed individuals in Southern View, private company employees (575 | 64.7%), not-for-profit organizations (97 | 10.9%), and state government employees (84 | 9.5%) make up the most common classes of employment.
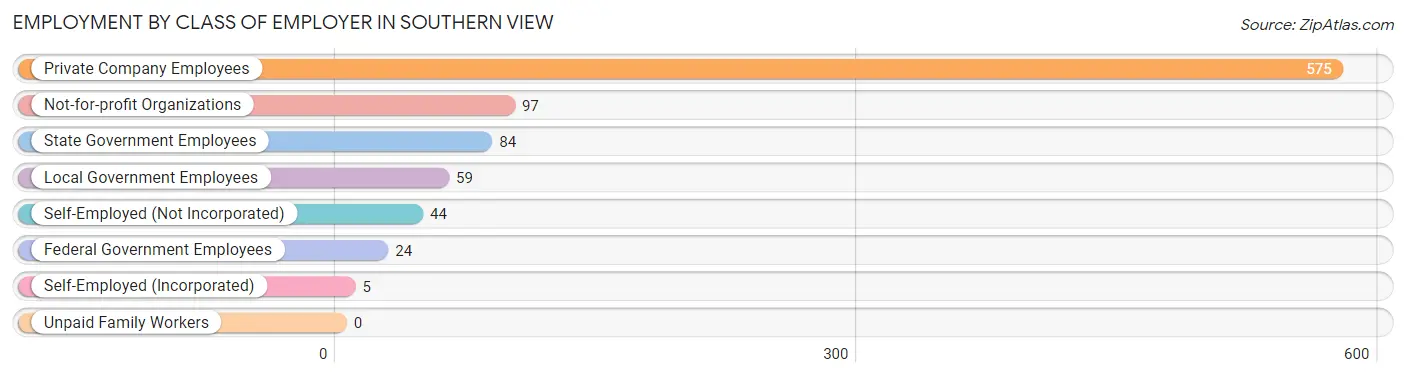
| Employer Class | # Employees | % Employees |
| Private Company Employees | 575 | 64.7% |
| Self-Employed (Incorporated) | 5 | 0.6% |
| Self-Employed (Not Incorporated) | 44 | 5.0% |
| Not-for-profit Organizations | 97 | 10.9% |
| Local Government Employees | 59 | 6.6% |
| State Government Employees | 84 | 9.5% |
| Federal Government Employees | 24 | 2.7% |
| Unpaid Family Workers | 0 | 0.0% |
| Total | 888 | 100.0% |
Employment Status by Age in Southern View
According to the labor force statistics for Southern View, out of the total population over 16 years of age (1,542), 64.4% or 993 individuals are in the labor force, with 9.0% or 89 of them unemployed. The age group with the highest labor force participation rate is 30 to 34 years, with 100.0% or 140 individuals in the labor force. Within the labor force, the 16 to 19 years age range has the highest percentage of unemployed individuals, with 34.6% or 9 of them being unemployed.
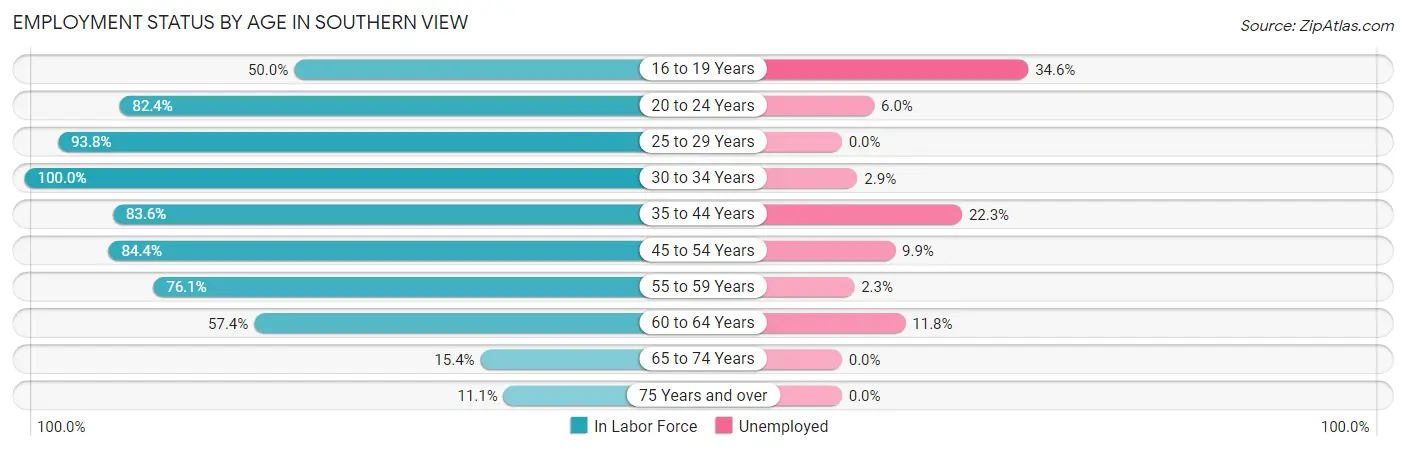
| Age Bracket | In Labor Force | Unemployed |
| 16 to 19 Years | 26 (50.0%) | 9 (34.6%) |
| 20 to 24 Years | 84 (82.4%) | 5 (6.0%) |
| 25 to 29 Years | 122 (93.8%) | 0 (0.0%) |
| 30 to 34 Years | 140 (100.0%) | 4 (2.9%) |
| 35 to 44 Years | 188 (83.6%) | 42 (22.3%) |
| 45 to 54 Years | 162 (84.4%) | 16 (9.9%) |
| 55 to 59 Years | 137 (76.1%) | 3 (2.3%) |
| 60 to 64 Years | 85 (57.4%) | 10 (11.8%) |
| 65 to 74 Years | 27 (15.4%) | 0 (0.0%) |
| 75 Years and over | 22 (11.1%) | 0 (0.0%) |
| Total | 993 (64.4%) | 89 (9.0%) |
Employment Status by Educational Attainment in Southern View
According to labor force statistics for Southern View, 82.2% of individuals (834) out of the total population between 25 and 64 years of age (1,015) are in the labor force, with 9.1% or 76 of them being unemployed. The group with the highest labor force participation rate are those with the educational attainment of bachelor's degree or higher, with 99.1% or 224 individuals in the labor force. Within the labor force, individuals with less than high school education have the highest percentage of unemployment, with 34.9% or 15 of them being unemployed.
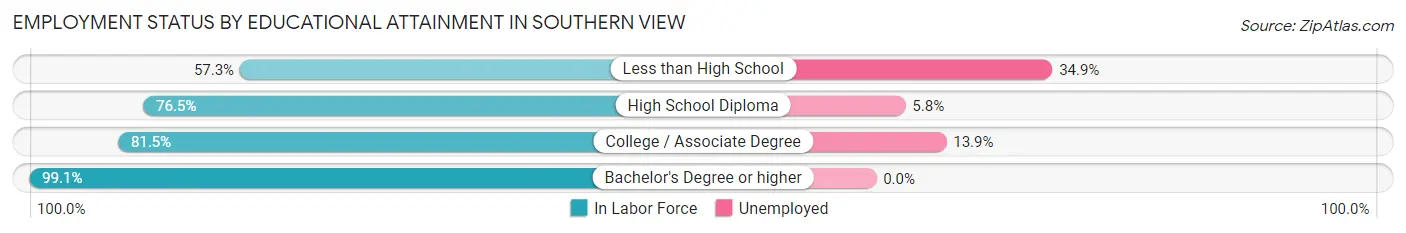
| Educational Attainment | In Labor Force | Unemployed |
| Less than High School | 43 (57.3%) | 26 (34.9%) |
| High School Diploma | 224 (76.5%) | 17 (5.8%) |
| College / Associate Degree | 343 (81.5%) | 59 (13.9%) |
| Bachelor's Degree or higher | 224 (99.1%) | 0 (0.0%) |
| Total | 834 (82.2%) | 92 (9.1%) |
Employment Occupations by Sex in Southern View
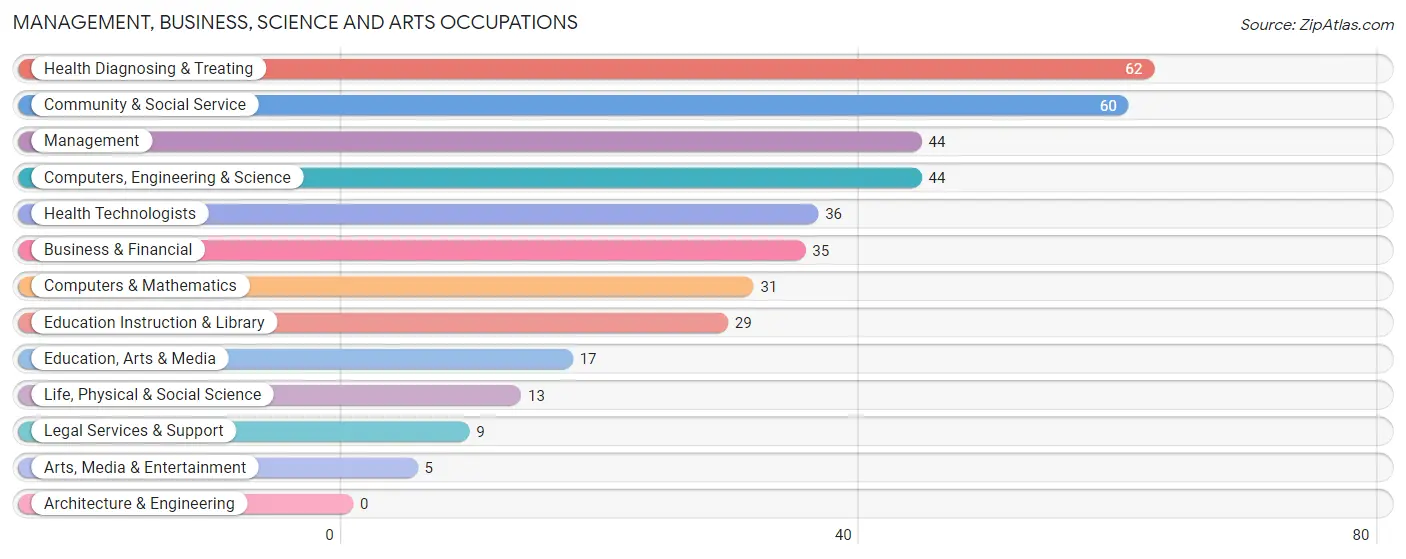
Management, Business, Science and Arts Occupations
The most common Management, Business, Science and Arts occupations in Southern View are Health Diagnosing & Treating (62 | 6.9%), Community & Social Service (60 | 6.7%), Management (44 | 4.9%), Computers, Engineering & Science (44 | 4.9%), and Health Technologists (36 | 4.0%).
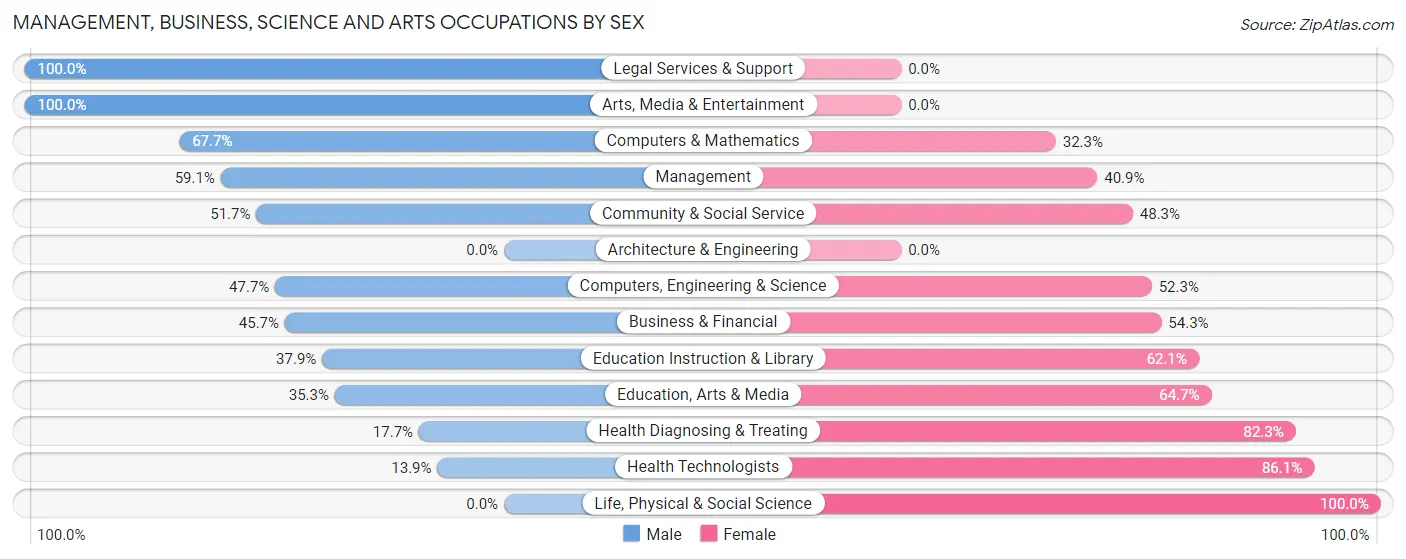
Management, Business, Science and Arts Occupations by Sex
Within the Management, Business, Science and Arts occupations in Southern View, the most male-oriented occupations are Legal Services & Support (100.0%), Arts, Media & Entertainment (100.0%), and Computers & Mathematics (67.7%), while the most female-oriented occupations are Life, Physical & Social Science (100.0%), Health Technologists (86.1%), and Health Diagnosing & Treating (82.3%).
| Occupation | Male | Female |
| Management | 26 (59.1%) | 18 (40.9%) |
| Business & Financial | 16 (45.7%) | 19 (54.3%) |
| Computers, Engineering & Science | 21 (47.7%) | 23 (52.3%) |
| Computers & Mathematics | 21 (67.7%) | 10 (32.3%) |
| Architecture & Engineering | 0 (0.0%) | 0 (0.0%) |
| Life, Physical & Social Science | 0 (0.0%) | 13 (100.0%) |
| Community & Social Service | 31 (51.7%) | 29 (48.3%) |
| Education, Arts & Media | 6 (35.3%) | 11 (64.7%) |
| Legal Services & Support | 9 (100.0%) | 0 (0.0%) |
| Education Instruction & Library | 11 (37.9%) | 18 (62.1%) |
| Arts, Media & Entertainment | 5 (100.0%) | 0 (0.0%) |
| Health Diagnosing & Treating | 11 (17.7%) | 51 (82.3%) |
| Health Technologists | 5 (13.9%) | 31 (86.1%) |
| Total (Category) | 105 (42.9%) | 140 (57.1%) |
| Total (Overall) | 428 (47.7%) | 470 (52.3%) |
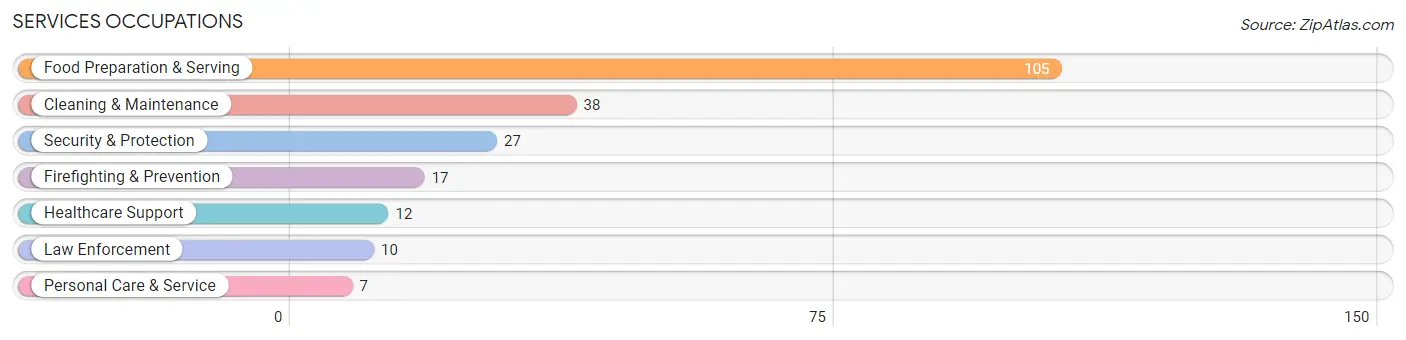
Services Occupations
The most common Services occupations in Southern View are Food Preparation & Serving (105 | 11.7%), Cleaning & Maintenance (38 | 4.2%), Security & Protection (27 | 3.0%), Firefighting & Prevention (17 | 1.9%), and Healthcare Support (12 | 1.3%).
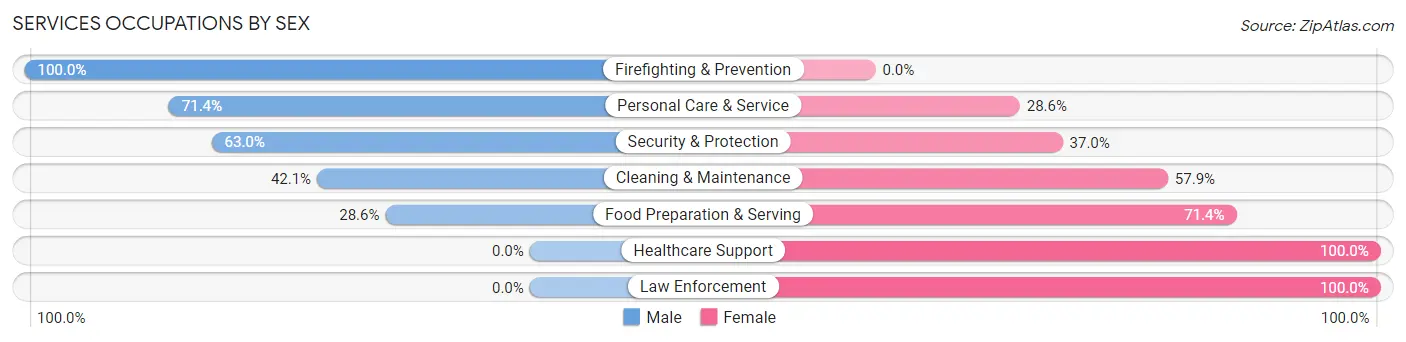
Services Occupations by Sex
Within the Services occupations in Southern View, the most male-oriented occupations are Firefighting & Prevention (100.0%), Personal Care & Service (71.4%), and Security & Protection (63.0%), while the most female-oriented occupations are Healthcare Support (100.0%), Law Enforcement (100.0%), and Food Preparation & Serving (71.4%).
| Occupation | Male | Female |
| Healthcare Support | 0 (0.0%) | 12 (100.0%) |
| Security & Protection | 17 (63.0%) | 10 (37.0%) |
| Firefighting & Prevention | 17 (100.0%) | 0 (0.0%) |
| Law Enforcement | 0 (0.0%) | 10 (100.0%) |
| Food Preparation & Serving | 30 (28.6%) | 75 (71.4%) |
| Cleaning & Maintenance | 16 (42.1%) | 22 (57.9%) |
| Personal Care & Service | 5 (71.4%) | 2 (28.6%) |
| Total (Category) | 68 (36.0%) | 121 (64.0%) |
| Total (Overall) | 428 (47.7%) | 470 (52.3%) |
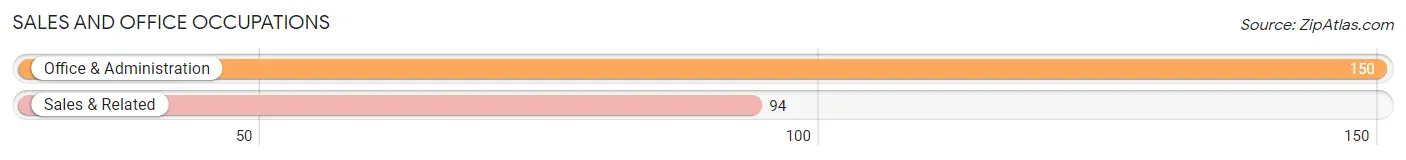
Sales and Office Occupations
The most common Sales and Office occupations in Southern View are Office & Administration (150 | 16.7%), and Sales & Related (94 | 10.5%).
Sales and Office Occupations by Sex
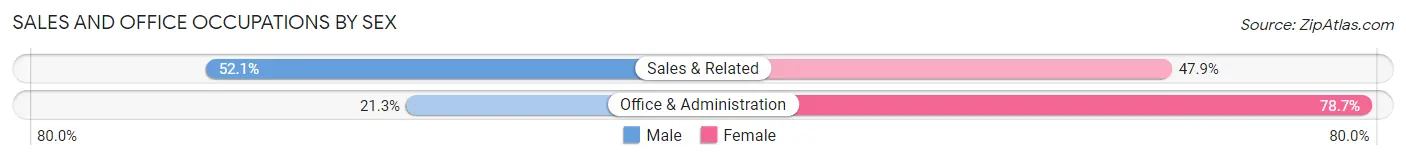
| Occupation | Male | Female |
| Sales & Related | 49 (52.1%) | 45 (47.9%) |
| Office & Administration | 32 (21.3%) | 118 (78.7%) |
| Total (Category) | 81 (33.2%) | 163 (66.8%) |
| Total (Overall) | 428 (47.7%) | 470 (52.3%) |
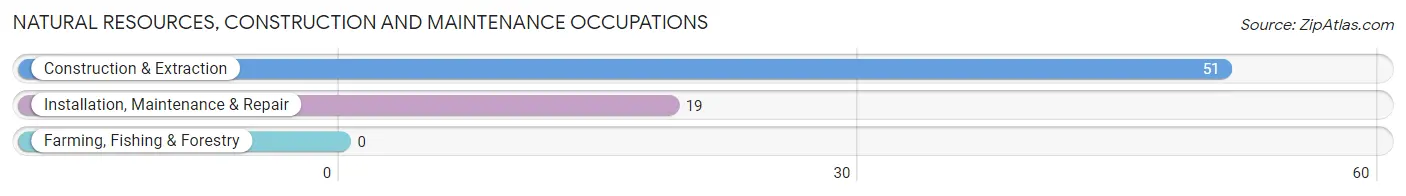
Natural Resources, Construction and Maintenance Occupations
The most common Natural Resources, Construction and Maintenance occupations in Southern View are Construction & Extraction (51 | 5.7%), and Installation, Maintenance & Repair (19 | 2.1%).
Natural Resources, Construction and Maintenance Occupations by Sex
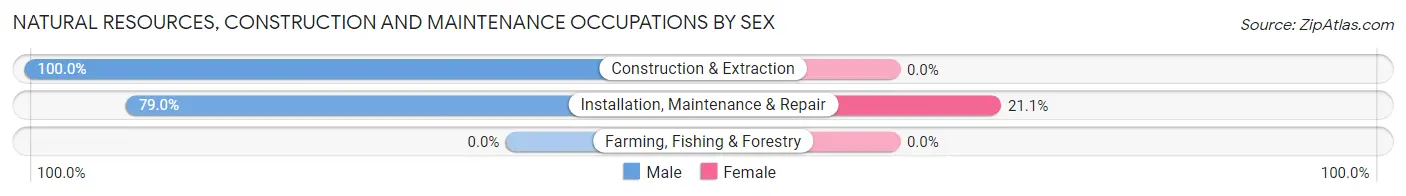
| Occupation | Male | Female |
| Farming, Fishing & Forestry | 0 (0.0%) | 0 (0.0%) |
| Construction & Extraction | 51 (100.0%) | 0 (0.0%) |
| Installation, Maintenance & Repair | 15 (78.9%) | 4 (21.0%) |
| Total (Category) | 66 (94.3%) | 4 (5.7%) |
| Total (Overall) | 428 (47.7%) | 470 (52.3%) |
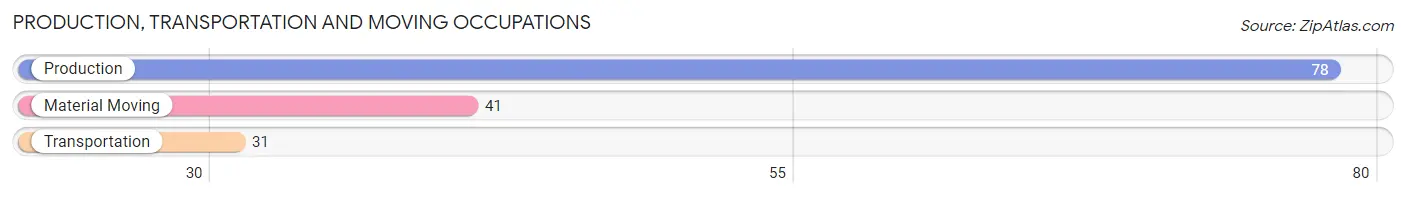
Production, Transportation and Moving Occupations
The most common Production, Transportation and Moving occupations in Southern View are Production (78 | 8.7%), Material Moving (41 | 4.6%), and Transportation (31 | 3.5%).
Production, Transportation and Moving Occupations by Sex
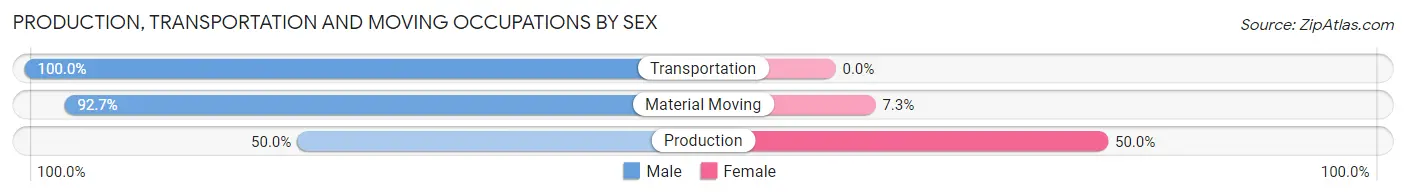
| Occupation | Male | Female |
| Production | 39 (50.0%) | 39 (50.0%) |
| Transportation | 31 (100.0%) | 0 (0.0%) |
| Material Moving | 38 (92.7%) | 3 (7.3%) |
| Total (Category) | 108 (72.0%) | 42 (28.0%) |
| Total (Overall) | 428 (47.7%) | 470 (52.3%) |
Employment Industries by Sex in Southern View
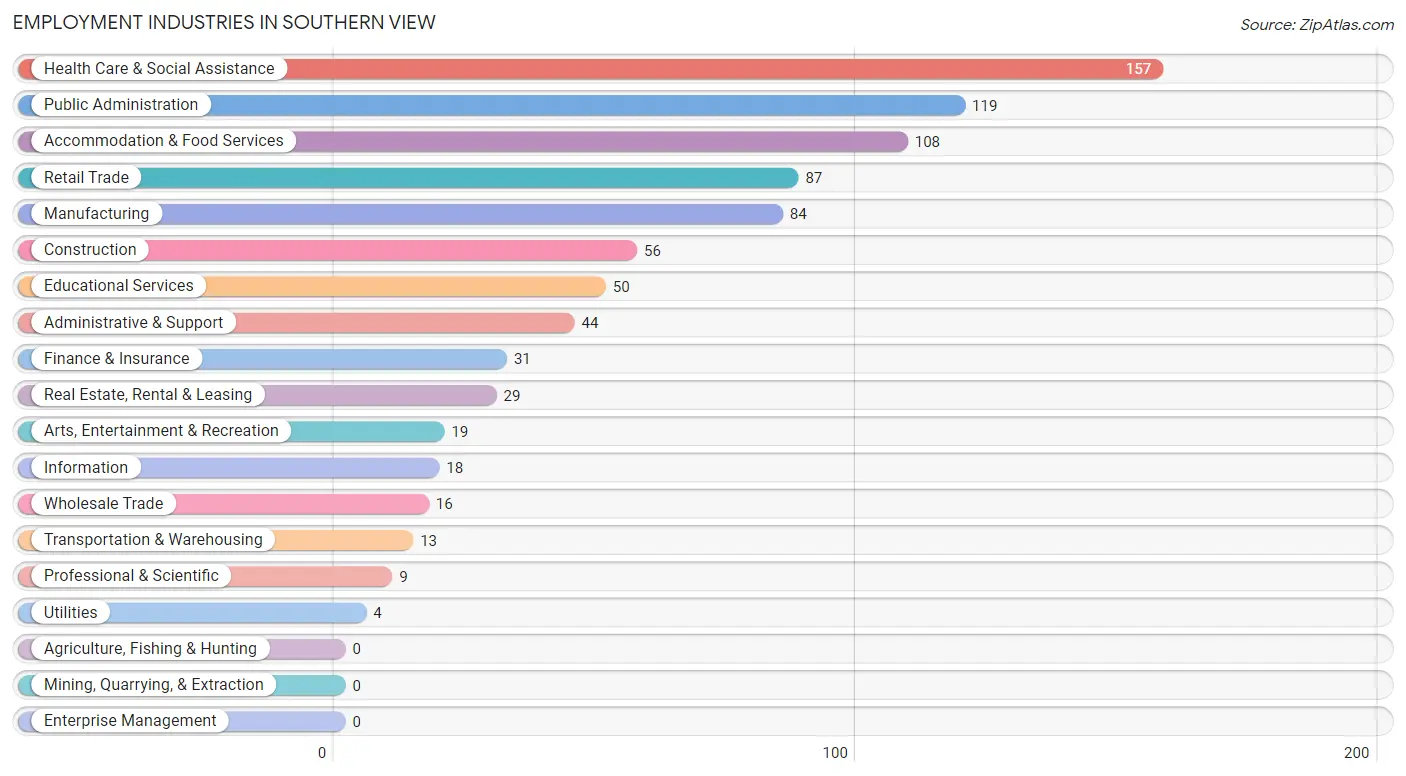
Employment Industries in Southern View
The major employment industries in Southern View include Health Care & Social Assistance (157 | 17.5%), Public Administration (119 | 13.3%), Accommodation & Food Services (108 | 12.0%), Retail Trade (87 | 9.7%), and Manufacturing (84 | 9.3%).
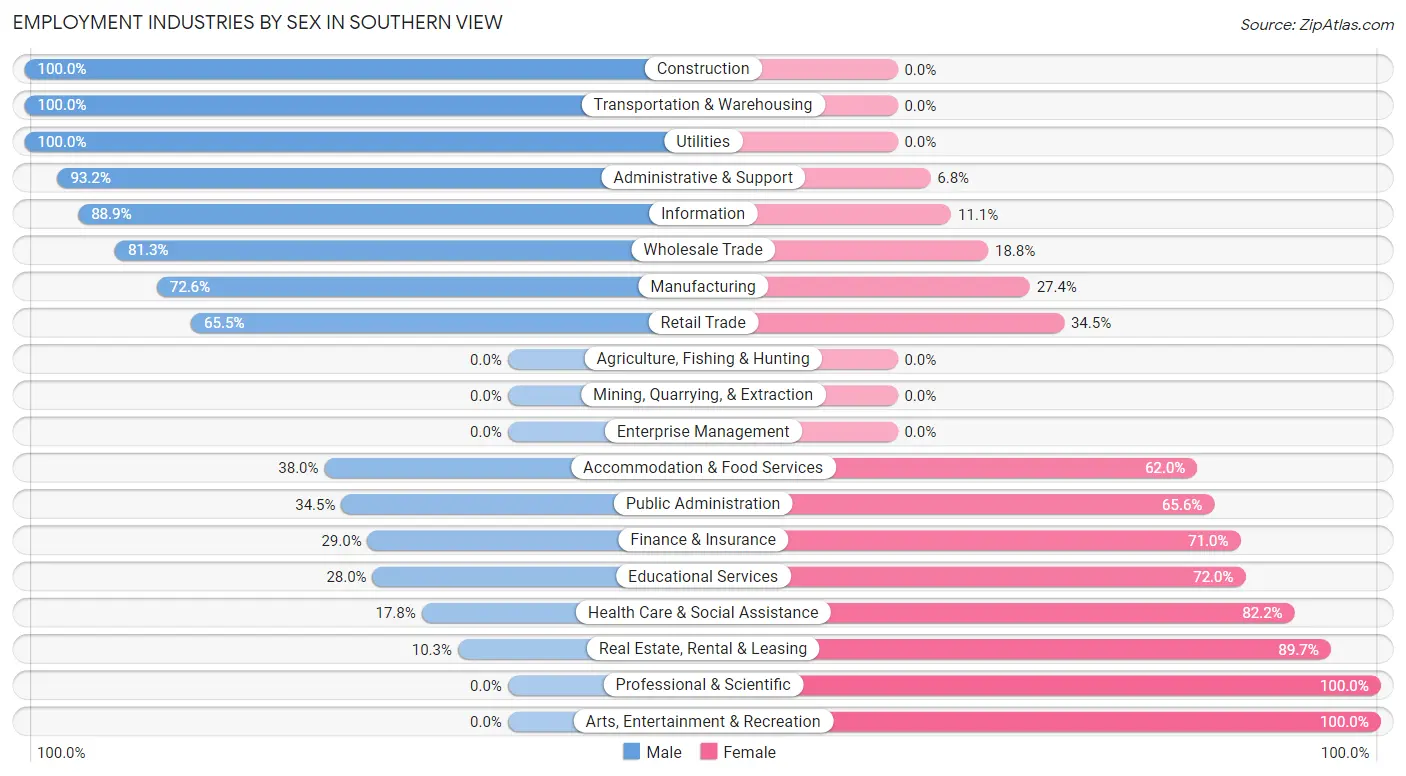
Employment Industries by Sex in Southern View
The Southern View industries that see more men than women are Construction (100.0%), Transportation & Warehousing (100.0%), and Utilities (100.0%), whereas the industries that tend to have a higher number of women are Professional & Scientific (100.0%), Arts, Entertainment & Recreation (100.0%), and Real Estate, Rental & Leasing (89.7%).
| Industry | Male | Female |
| Agriculture, Fishing & Hunting | 0 (0.0%) | 0 (0.0%) |
| Mining, Quarrying, & Extraction | 0 (0.0%) | 0 (0.0%) |
| Construction | 56 (100.0%) | 0 (0.0%) |
| Manufacturing | 61 (72.6%) | 23 (27.4%) |
| Wholesale Trade | 13 (81.2%) | 3 (18.8%) |
| Retail Trade | 57 (65.5%) | 30 (34.5%) |
| Transportation & Warehousing | 13 (100.0%) | 0 (0.0%) |
| Utilities | 4 (100.0%) | 0 (0.0%) |
| Information | 16 (88.9%) | 2 (11.1%) |
| Finance & Insurance | 9 (29.0%) | 22 (71.0%) |
| Real Estate, Rental & Leasing | 3 (10.3%) | 26 (89.7%) |
| Professional & Scientific | 0 (0.0%) | 9 (100.0%) |
| Enterprise Management | 0 (0.0%) | 0 (0.0%) |
| Administrative & Support | 41 (93.2%) | 3 (6.8%) |
| Educational Services | 14 (28.0%) | 36 (72.0%) |
| Health Care & Social Assistance | 28 (17.8%) | 129 (82.2%) |
| Arts, Entertainment & Recreation | 0 (0.0%) | 19 (100.0%) |
| Accommodation & Food Services | 41 (38.0%) | 67 (62.0%) |
| Public Administration | 41 (34.4%) | 78 (65.5%) |
| Total | 428 (47.7%) | 470 (52.3%) |
Education in Southern View
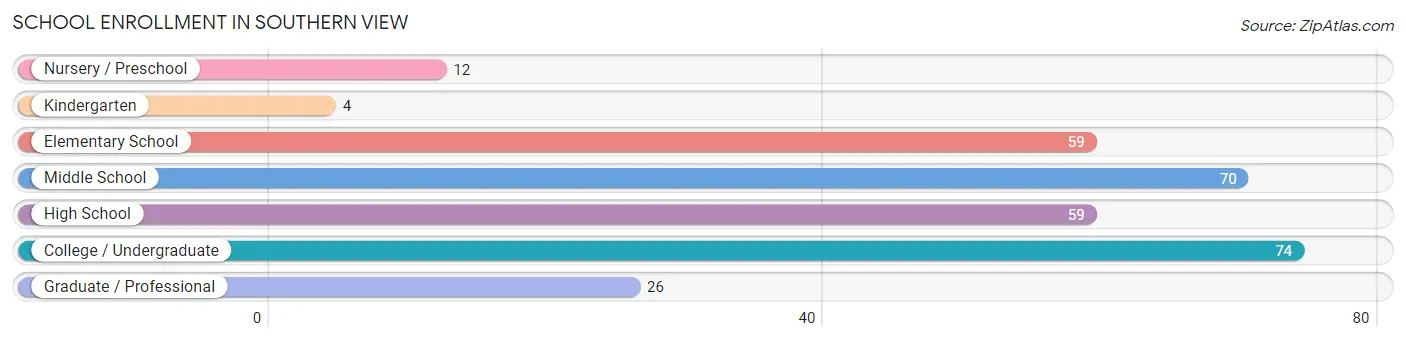
School Enrollment in Southern View
The most common levels of schooling among the 304 students in Southern View are college / undergraduate (74 | 24.3%), middle school (70 | 23.0%), and elementary school (59 | 19.4%).
| School Level | # Students | % Students |
| Nursery / Preschool | 12 | 4.0% |
| Kindergarten | 4 | 1.3% |
| Elementary School | 59 | 19.4% |
| Middle School | 70 | 23.0% |
| High School | 59 | 19.4% |
| College / Undergraduate | 74 | 24.3% |
| Graduate / Professional | 26 | 8.6% |
| Total | 304 | 100.0% |
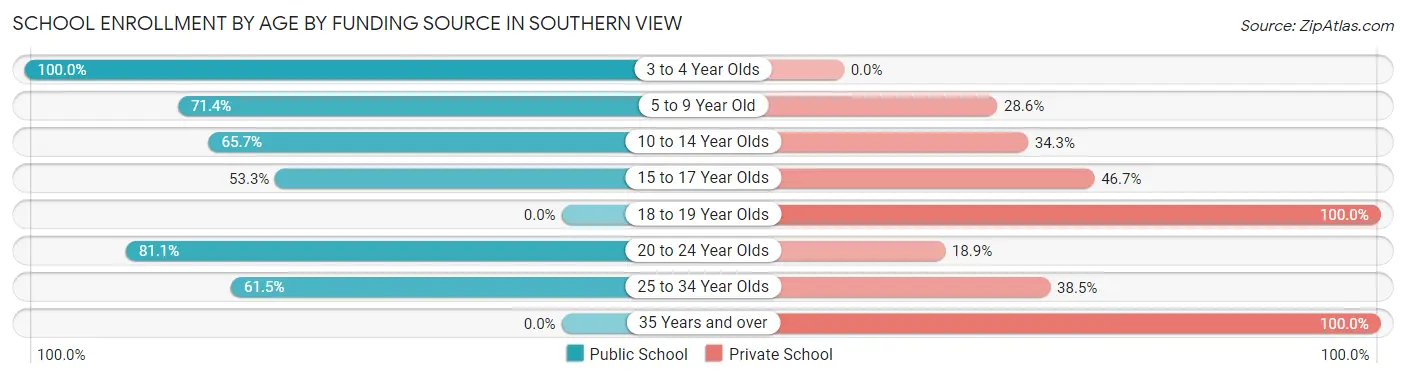
School Enrollment by Age by Funding Source in Southern View
Out of a total of 304 students who are enrolled in schools in Southern View, 118 (38.8%) attend a private institution, while the remaining 186 (61.2%) are enrolled in public schools. The age group of 18 to 19 year olds has the highest likelihood of being enrolled in private schools, with 32 (100.0% in the age bracket) enrolled. Conversely, the age group of 3 to 4 year olds has the lowest likelihood of being enrolled in a private school, with 12 (100.0% in the age bracket) attending a public institution.
| Age Bracket | Public School | Private School |
| 3 to 4 Year Olds | 12 (100.0%) | 0 (0.0%) |
| 5 to 9 Year Old | 45 (71.4%) | 18 (28.6%) |
| 10 to 14 Year Olds | 46 (65.7%) | 24 (34.3%) |
| 15 to 17 Year Olds | 24 (53.3%) | 21 (46.7%) |
| 18 to 19 Year Olds | 0 (0.0%) | 32 (100.0%) |
| 20 to 24 Year Olds | 43 (81.1%) | 10 (18.9%) |
| 25 to 34 Year Olds | 16 (61.5%) | 10 (38.5%) |
| 35 Years and over | 0 (0.0%) | 3 (100.0%) |
| Total | 186 (61.2%) | 118 (38.8%) |
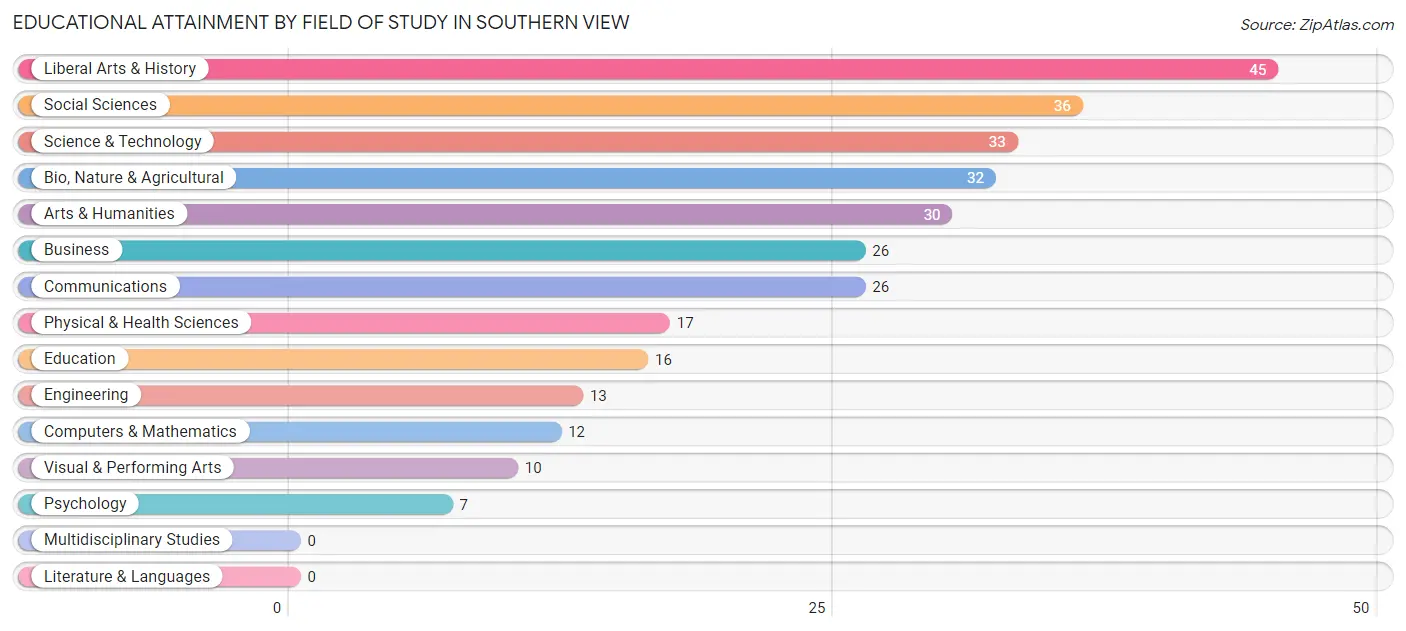
Educational Attainment by Field of Study in Southern View
Liberal arts & history (45 | 14.8%), social sciences (36 | 11.9%), science & technology (33 | 10.9%), bio, nature & agricultural (32 | 10.6%), and arts & humanities (30 | 9.9%) are the most common fields of study among 303 individuals in Southern View who have obtained a bachelor's degree or higher.
| Field of Study | # Graduates | % Graduates |
| Computers & Mathematics | 12 | 4.0% |
| Bio, Nature & Agricultural | 32 | 10.6% |
| Physical & Health Sciences | 17 | 5.6% |
| Psychology | 7 | 2.3% |
| Social Sciences | 36 | 11.9% |
| Engineering | 13 | 4.3% |
| Multidisciplinary Studies | 0 | 0.0% |
| Science & Technology | 33 | 10.9% |
| Business | 26 | 8.6% |
| Education | 16 | 5.3% |
| Literature & Languages | 0 | 0.0% |
| Liberal Arts & History | 45 | 14.8% |
| Visual & Performing Arts | 10 | 3.3% |
| Communications | 26 | 8.6% |
| Arts & Humanities | 30 | 9.9% |
| Total | 303 | 100.0% |
Transportation & Commute in Southern View
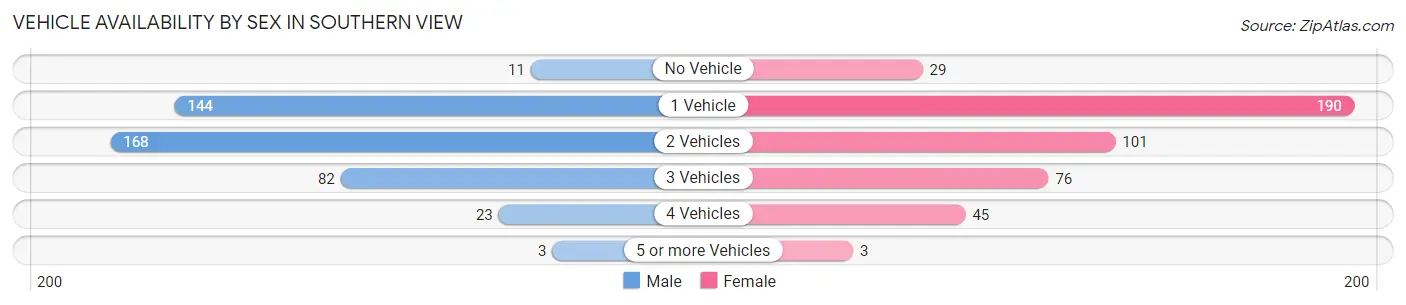
Vehicle Availability by Sex in Southern View
The most prevalent vehicle ownership categories in Southern View are males with 2 vehicles (168, accounting for 39.0%) and females with 2 vehicles (101, making up 37.8%).
| Vehicles Available | Male | Female |
| No Vehicle | 11 (2.5%) | 29 (6.5%) |
| 1 Vehicle | 144 (33.4%) | 190 (42.8%) |
| 2 Vehicles | 168 (39.0%) | 101 (22.8%) |
| 3 Vehicles | 82 (19.0%) | 76 (17.1%) |
| 4 Vehicles | 23 (5.3%) | 45 (10.1%) |
| 5 or more Vehicles | 3 (0.7%) | 3 (0.7%) |
| Total | 431 (100.0%) | 444 (100.0%) |
Commute Time in Southern View
The most frequently occuring commute durations in Southern View are 10 to 14 minutes (310 commuters, 38.0%), 15 to 19 minutes (246 commuters, 30.2%), and 5 to 9 minutes (131 commuters, 16.1%).
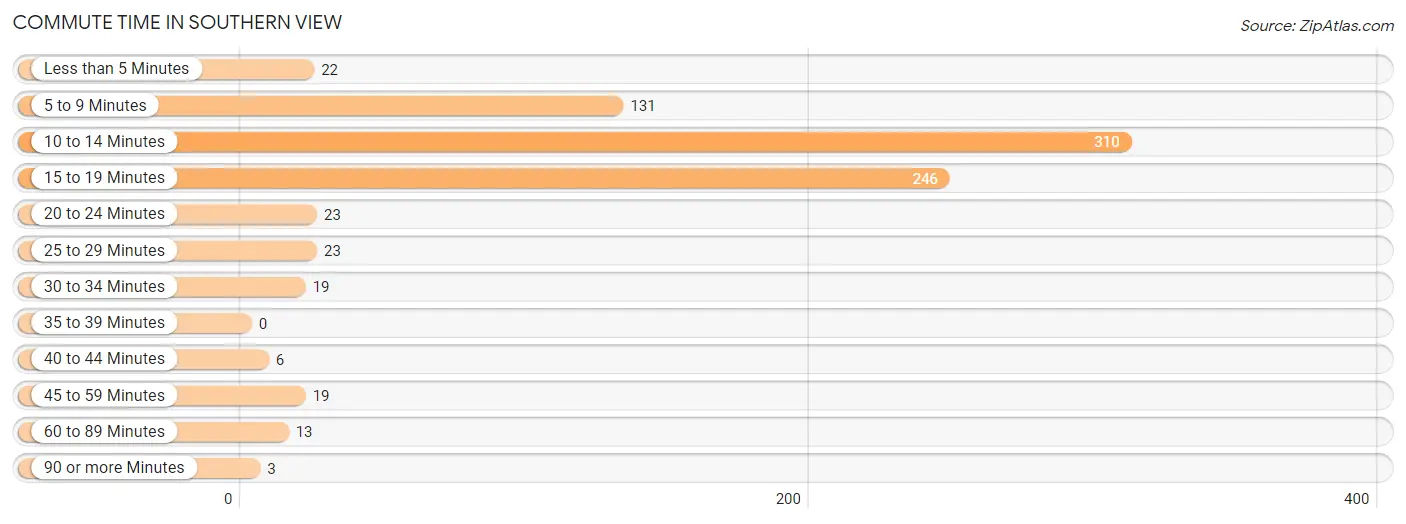
| Commute Time | # Commuters | % Commuters |
| Less than 5 Minutes | 22 | 2.7% |
| 5 to 9 Minutes | 131 | 16.1% |
| 10 to 14 Minutes | 310 | 38.0% |
| 15 to 19 Minutes | 246 | 30.2% |
| 20 to 24 Minutes | 23 | 2.8% |
| 25 to 29 Minutes | 23 | 2.8% |
| 30 to 34 Minutes | 19 | 2.3% |
| 35 to 39 Minutes | 0 | 0.0% |
| 40 to 44 Minutes | 6 | 0.7% |
| 45 to 59 Minutes | 19 | 2.3% |
| 60 to 89 Minutes | 13 | 1.6% |
| 90 or more Minutes | 3 | 0.4% |
Commute Time by Sex in Southern View
The most common commute times in Southern View are 10 to 14 minutes (154 commuters, 37.3%) for males and 10 to 14 minutes (156 commuters, 38.8%) for females.
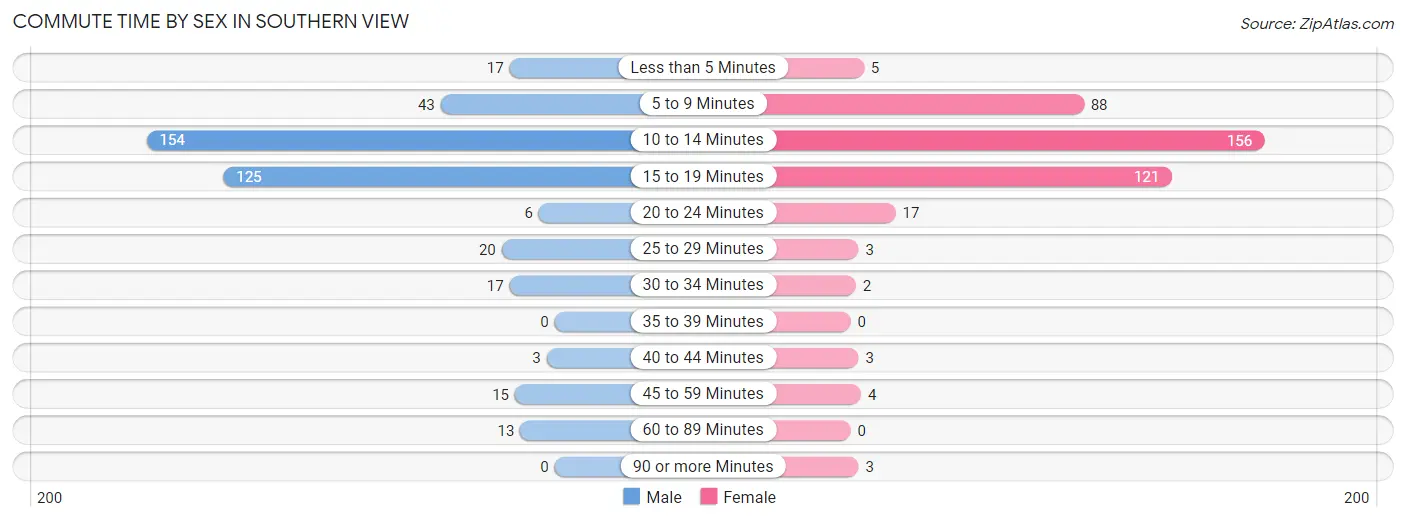
| Commute Time | Male | Female |
| Less than 5 Minutes | 17 (4.1%) | 5 (1.2%) |
| 5 to 9 Minutes | 43 (10.4%) | 88 (21.9%) |
| 10 to 14 Minutes | 154 (37.3%) | 156 (38.8%) |
| 15 to 19 Minutes | 125 (30.3%) | 121 (30.1%) |
| 20 to 24 Minutes | 6 (1.5%) | 17 (4.2%) |
| 25 to 29 Minutes | 20 (4.8%) | 3 (0.7%) |
| 30 to 34 Minutes | 17 (4.1%) | 2 (0.5%) |
| 35 to 39 Minutes | 0 (0.0%) | 0 (0.0%) |
| 40 to 44 Minutes | 3 (0.7%) | 3 (0.7%) |
| 45 to 59 Minutes | 15 (3.6%) | 4 (1.0%) |
| 60 to 89 Minutes | 13 (3.2%) | 0 (0.0%) |
| 90 or more Minutes | 0 (0.0%) | 3 (0.7%) |
Time of Departure to Work by Sex in Southern View
The most frequent times of departure to work in Southern View are 7:30 AM to 7:59 AM (68, 16.5%) for males and 6:30 AM to 6:59 AM (146, 36.3%) for females.
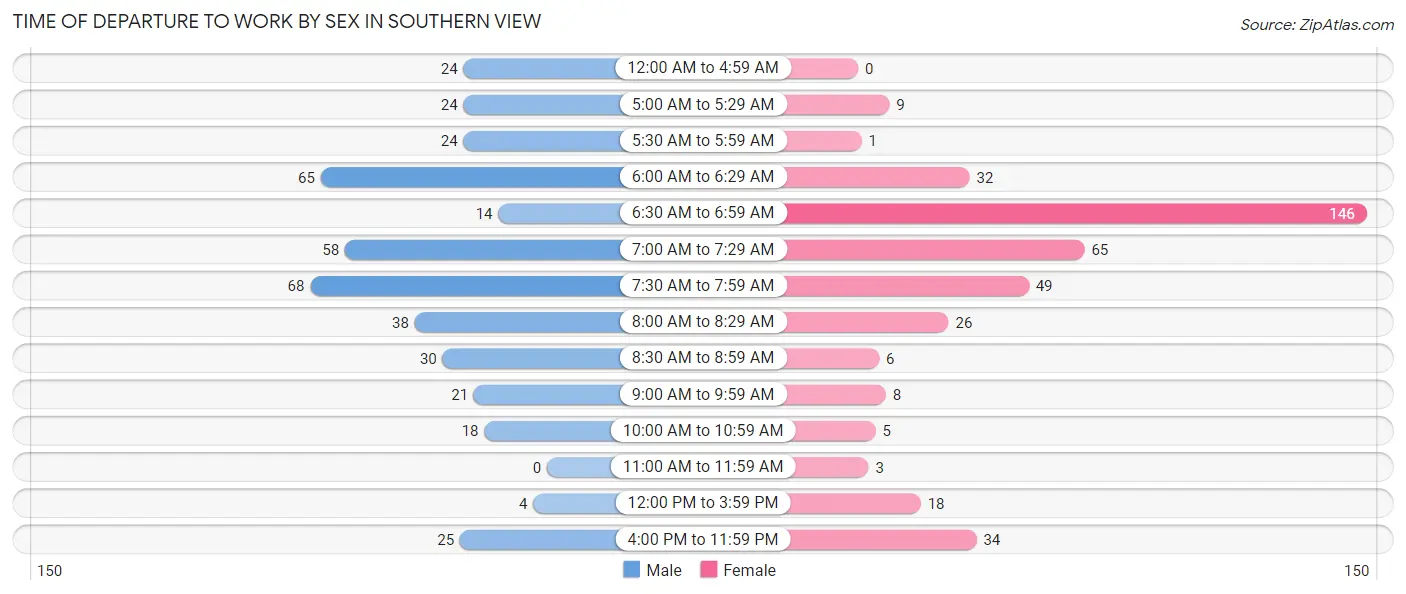
| Time of Departure | Male | Female |
| 12:00 AM to 4:59 AM | 24 (5.8%) | 0 (0.0%) |
| 5:00 AM to 5:29 AM | 24 (5.8%) | 9 (2.2%) |
| 5:30 AM to 5:59 AM | 24 (5.8%) | 1 (0.3%) |
| 6:00 AM to 6:29 AM | 65 (15.7%) | 32 (8.0%) |
| 6:30 AM to 6:59 AM | 14 (3.4%) | 146 (36.3%) |
| 7:00 AM to 7:29 AM | 58 (14.0%) | 65 (16.2%) |
| 7:30 AM to 7:59 AM | 68 (16.5%) | 49 (12.2%) |
| 8:00 AM to 8:29 AM | 38 (9.2%) | 26 (6.5%) |
| 8:30 AM to 8:59 AM | 30 (7.3%) | 6 (1.5%) |
| 9:00 AM to 9:59 AM | 21 (5.1%) | 8 (2.0%) |
| 10:00 AM to 10:59 AM | 18 (4.4%) | 5 (1.2%) |
| 11:00 AM to 11:59 AM | 0 (0.0%) | 3 (0.7%) |
| 12:00 PM to 3:59 PM | 4 (1.0%) | 18 (4.5%) |
| 4:00 PM to 11:59 PM | 25 (6.0%) | 34 (8.5%) |
| Total | 413 (100.0%) | 402 (100.0%) |
Housing Occupancy in Southern View
Occupancy by Ownership in Southern View
Of the total 823 dwellings in Southern View, owner-occupied units account for 580 (70.5%), while renter-occupied units make up 243 (29.5%).
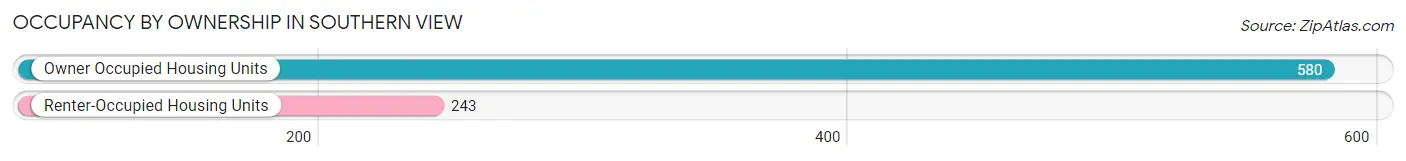
| Occupancy | # Housing Units | % Housing Units |
| Owner Occupied Housing Units | 580 | 70.5% |
| Renter-Occupied Housing Units | 243 | 29.5% |
| Total Occupied Housing Units | 823 | 100.0% |
Occupancy by Household Size in Southern View
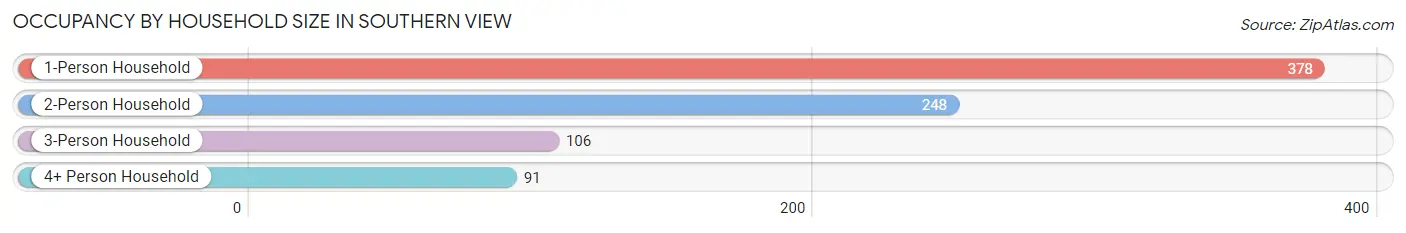
| Household Size | # Housing Units | % Housing Units |
| 1-Person Household | 378 | 45.9% |
| 2-Person Household | 248 | 30.1% |
| 3-Person Household | 106 | 12.9% |
| 4+ Person Household | 91 | 11.1% |
| Total Housing Units | 823 | 100.0% |
Occupancy by Ownership by Household Size in Southern View
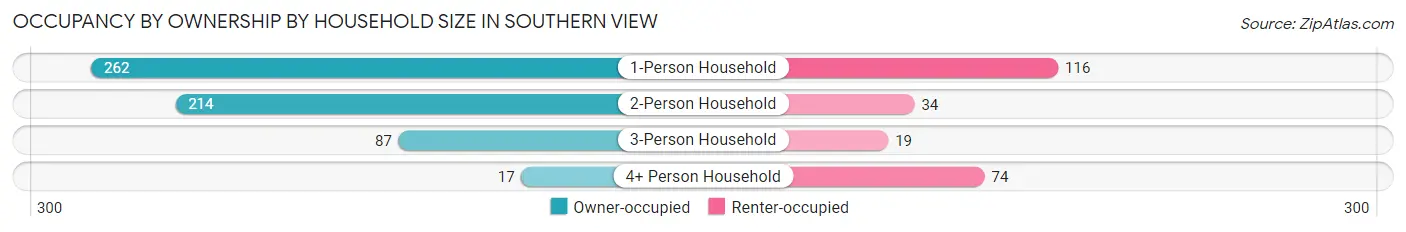
| Household Size | Owner-occupied | Renter-occupied |
| 1-Person Household | 262 (69.3%) | 116 (30.7%) |
| 2-Person Household | 214 (86.3%) | 34 (13.7%) |
| 3-Person Household | 87 (82.1%) | 19 (17.9%) |
| 4+ Person Household | 17 (18.7%) | 74 (81.3%) |
| Total Housing Units | 580 (70.5%) | 243 (29.5%) |
Occupancy by Educational Attainment in Southern View
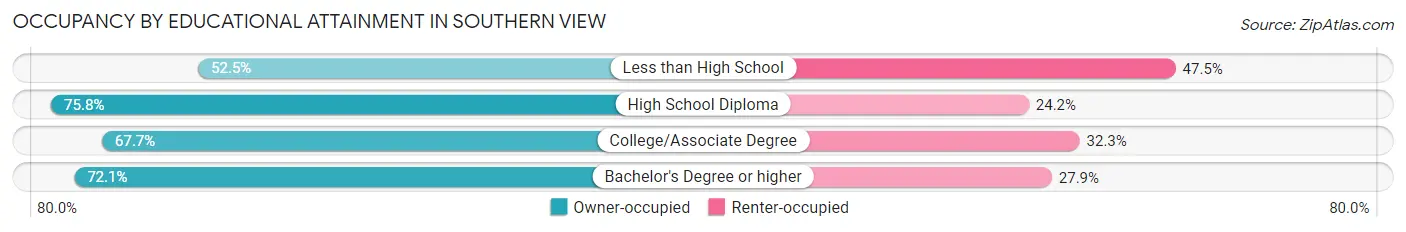
| Household Size | Owner-occupied | Renter-occupied |
| Less than High School | 21 (52.5%) | 19 (47.5%) |
| High School Diploma | 194 (75.8%) | 62 (24.2%) |
| College/Associate Degree | 233 (67.7%) | 111 (32.3%) |
| Bachelor's Degree or higher | 132 (72.1%) | 51 (27.9%) |
Occupancy by Age of Householder in Southern View
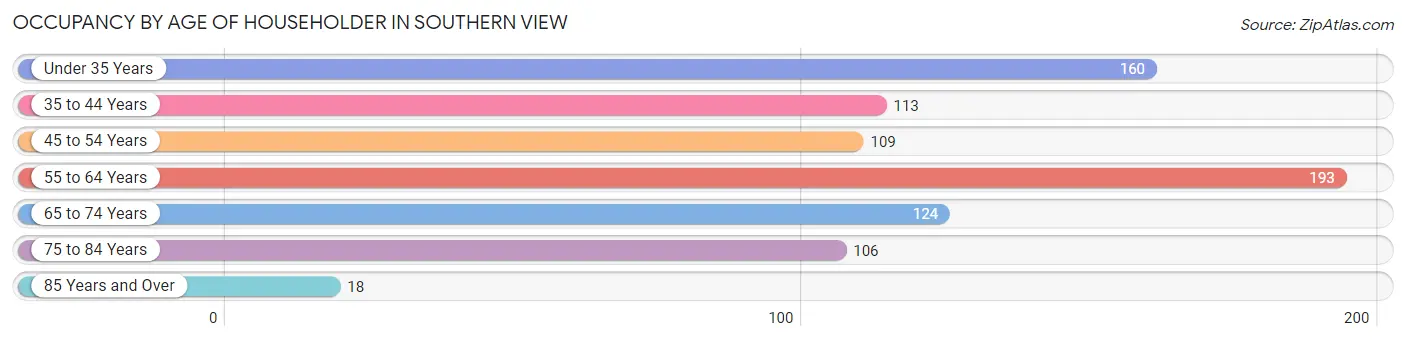
| Age Bracket | # Households | % Households |
| Under 35 Years | 160 | 19.4% |
| 35 to 44 Years | 113 | 13.7% |
| 45 to 54 Years | 109 | 13.2% |
| 55 to 64 Years | 193 | 23.4% |
| 65 to 74 Years | 124 | 15.1% |
| 75 to 84 Years | 106 | 12.9% |
| 85 Years and Over | 18 | 2.2% |
| Total | 823 | 100.0% |
Housing Finances in Southern View
Median Income by Occupancy in Southern View
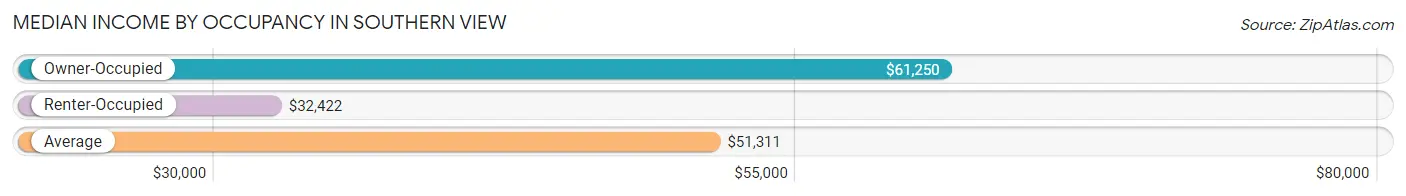
| Occupancy Type | # Households | Median Income |
| Owner-Occupied | 580 (70.5%) | $61,250 |
| Renter-Occupied | 243 (29.5%) | $32,422 |
| Average | 823 (100.0%) | $51,311 |
Occupancy by Householder Income Bracket in Southern View
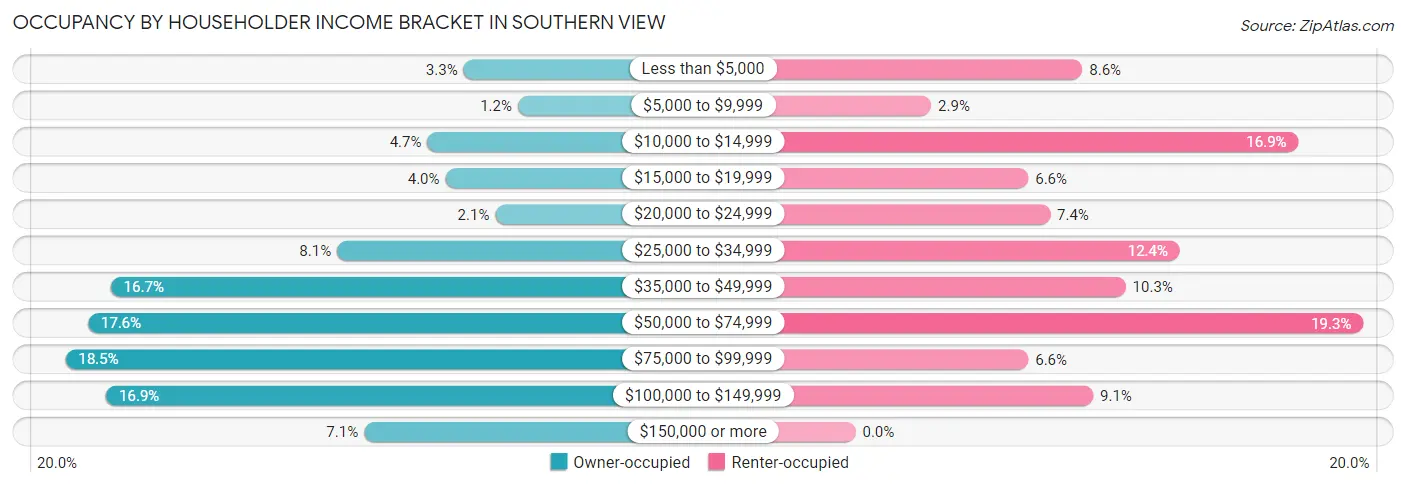
| Income Bracket | Owner-occupied | Renter-occupied |
| Less than $5,000 | 19 (3.3%) | 21 (8.6%) |
| $5,000 to $9,999 | 7 (1.2%) | 7 (2.9%) |
| $10,000 to $14,999 | 27 (4.7%) | 41 (16.9%) |
| $15,000 to $19,999 | 23 (4.0%) | 16 (6.6%) |
| $20,000 to $24,999 | 12 (2.1%) | 18 (7.4%) |
| $25,000 to $34,999 | 47 (8.1%) | 30 (12.3%) |
| $35,000 to $49,999 | 97 (16.7%) | 25 (10.3%) |
| $50,000 to $74,999 | 102 (17.6%) | 47 (19.3%) |
| $75,000 to $99,999 | 107 (18.4%) | 16 (6.6%) |
| $100,000 to $149,999 | 98 (16.9%) | 22 (9.0%) |
| $150,000 or more | 41 (7.1%) | 0 (0.0%) |
| Total | 580 (100.0%) | 243 (100.0%) |
Monthly Housing Cost Tiers in Southern View
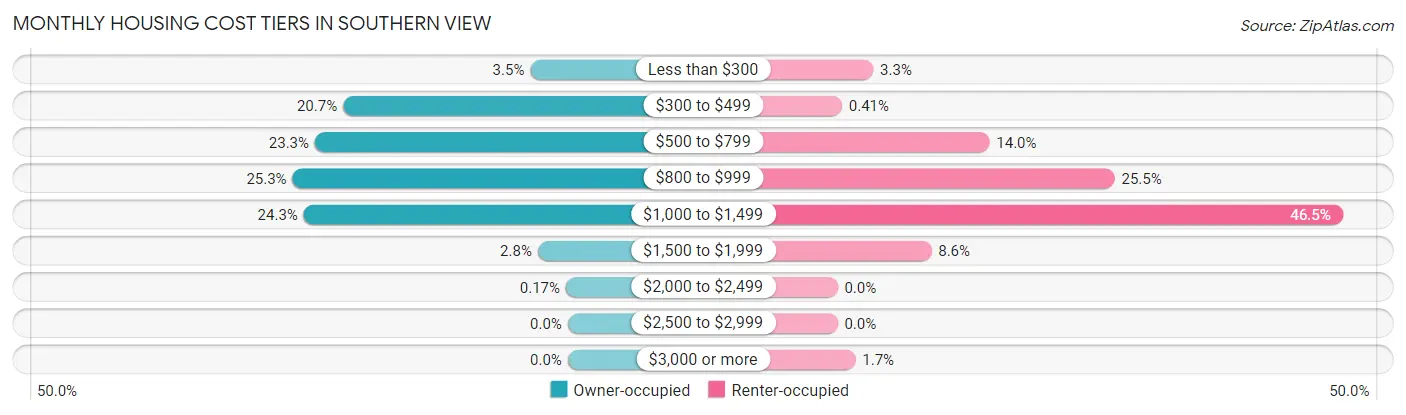
| Monthly Cost | Owner-occupied | Renter-occupied |
| Less than $300 | 20 (3.5%) | 8 (3.3%) |
| $300 to $499 | 120 (20.7%) | 1 (0.4%) |
| $500 to $799 | 135 (23.3%) | 34 (14.0%) |
| $800 to $999 | 147 (25.3%) | 62 (25.5%) |
| $1,000 to $1,499 | 141 (24.3%) | 113 (46.5%) |
| $1,500 to $1,999 | 16 (2.8%) | 21 (8.6%) |
| $2,000 to $2,499 | 1 (0.2%) | 0 (0.0%) |
| $2,500 to $2,999 | 0 (0.0%) | 0 (0.0%) |
| $3,000 or more | 0 (0.0%) | 4 (1.7%) |
| Total | 580 (100.0%) | 243 (100.0%) |
Physical Housing Characteristics in Southern View
Housing Structures in Southern View
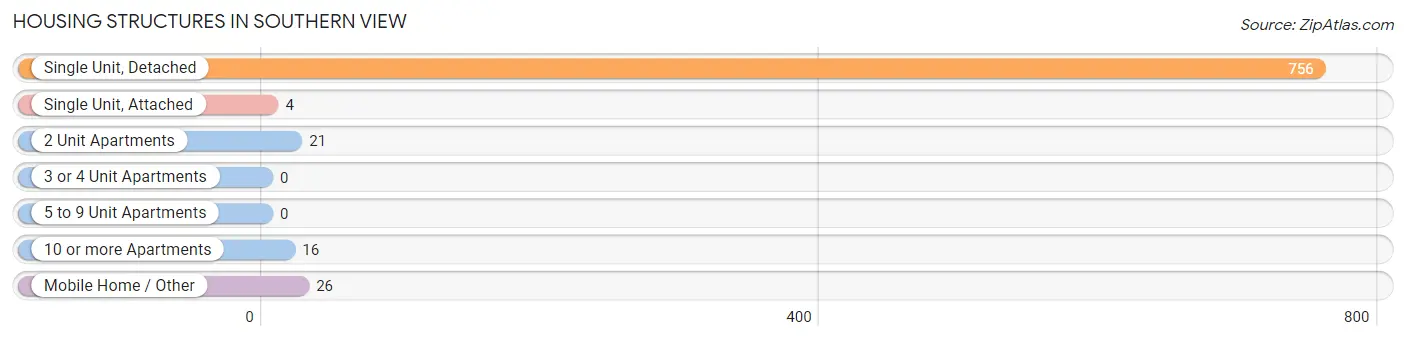
| Structure Type | # Housing Units | % Housing Units |
| Single Unit, Detached | 756 | 91.9% |
| Single Unit, Attached | 4 | 0.5% |
| 2 Unit Apartments | 21 | 2.5% |
| 3 or 4 Unit Apartments | 0 | 0.0% |
| 5 to 9 Unit Apartments | 0 | 0.0% |
| 10 or more Apartments | 16 | 1.9% |
| Mobile Home / Other | 26 | 3.2% |
| Total | 823 | 100.0% |
Housing Structures by Occupancy in Southern View
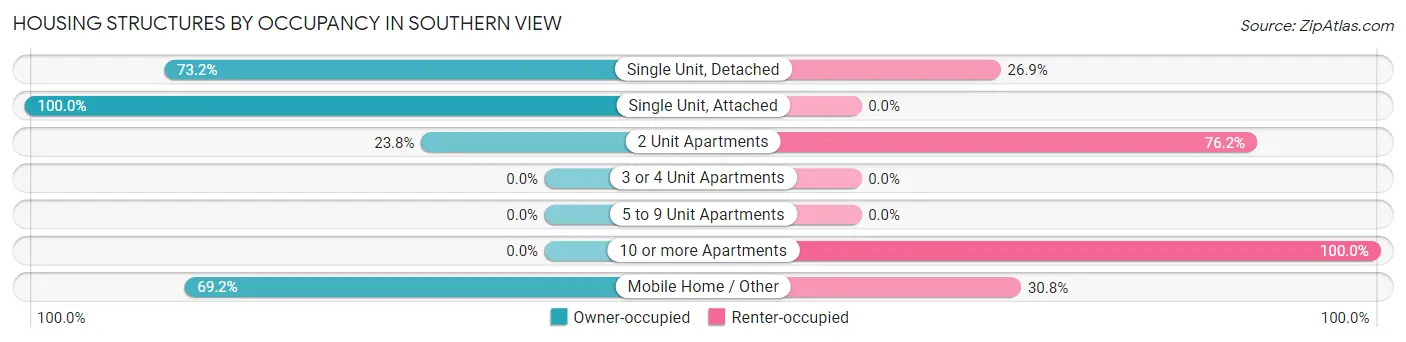
| Structure Type | Owner-occupied | Renter-occupied |
| Single Unit, Detached | 553 (73.2%) | 203 (26.9%) |
| Single Unit, Attached | 4 (100.0%) | 0 (0.0%) |
| 2 Unit Apartments | 5 (23.8%) | 16 (76.2%) |
| 3 or 4 Unit Apartments | 0 (0.0%) | 0 (0.0%) |
| 5 to 9 Unit Apartments | 0 (0.0%) | 0 (0.0%) |
| 10 or more Apartments | 0 (0.0%) | 16 (100.0%) |
| Mobile Home / Other | 18 (69.2%) | 8 (30.8%) |
| Total | 580 (70.5%) | 243 (29.5%) |
Housing Structures by Number of Rooms in Southern View
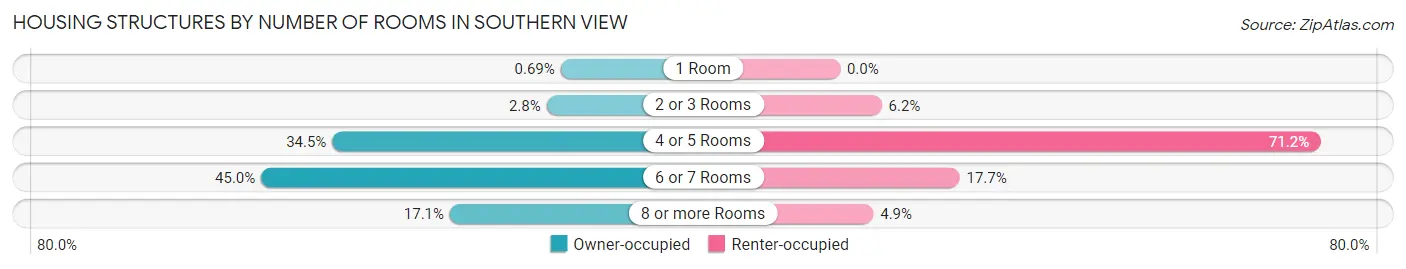
| Number of Rooms | Owner-occupied | Renter-occupied |
| 1 Room | 4 (0.7%) | 0 (0.0%) |
| 2 or 3 Rooms | 16 (2.8%) | 15 (6.2%) |
| 4 or 5 Rooms | 200 (34.5%) | 173 (71.2%) |
| 6 or 7 Rooms | 261 (45.0%) | 43 (17.7%) |
| 8 or more Rooms | 99 (17.1%) | 12 (4.9%) |
| Total | 580 (100.0%) | 243 (100.0%) |
Housing Structure by Heating Type in Southern View
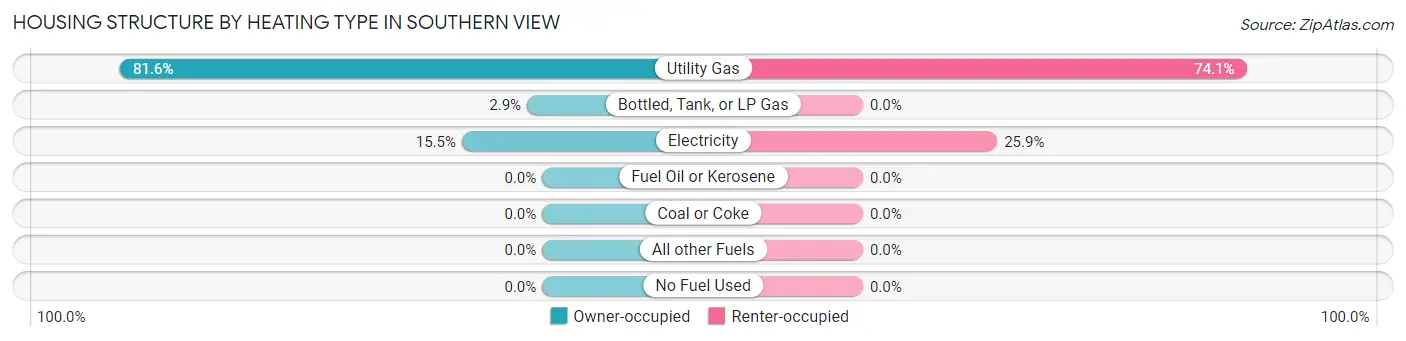
| Heating Type | Owner-occupied | Renter-occupied |
| Utility Gas | 473 (81.6%) | 180 (74.1%) |
| Bottled, Tank, or LP Gas | 17 (2.9%) | 0 (0.0%) |
| Electricity | 90 (15.5%) | 63 (25.9%) |
| Fuel Oil or Kerosene | 0 (0.0%) | 0 (0.0%) |
| Coal or Coke | 0 (0.0%) | 0 (0.0%) |
| All other Fuels | 0 (0.0%) | 0 (0.0%) |
| No Fuel Used | 0 (0.0%) | 0 (0.0%) |
| Total | 580 (100.0%) | 243 (100.0%) |
Household Vehicle Usage in Southern View
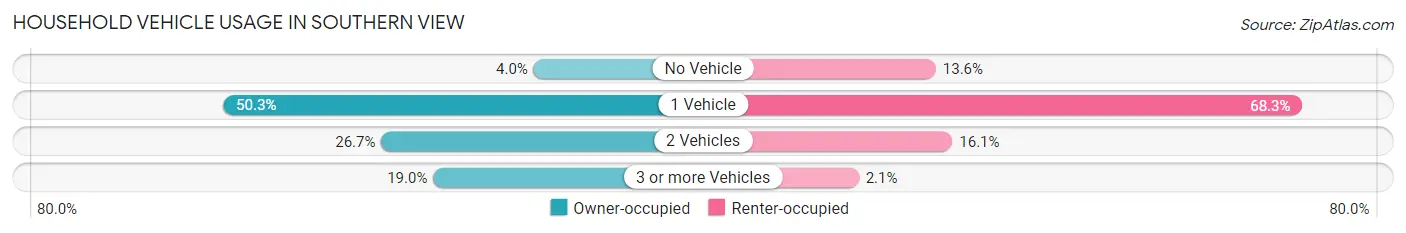
| Vehicles per Household | Owner-occupied | Renter-occupied |
| No Vehicle | 23 (4.0%) | 33 (13.6%) |
| 1 Vehicle | 292 (50.3%) | 166 (68.3%) |
| 2 Vehicles | 155 (26.7%) | 39 (16.1%) |
| 3 or more Vehicles | 110 (19.0%) | 5 (2.1%) |
| Total | 580 (100.0%) | 243 (100.0%) |
Real Estate & Mortgages in Southern View
Real Estate and Mortgage Overview in Southern View
| Characteristic | Without Mortgage | With Mortgage |
| Housing Units | 195 | 385 |
| Median Property Value | $97,700 | $101,000 |
| Median Household Income | $40,625 | $34 |
| Monthly Housing Costs | $437 | $0 |
| Real Estate Taxes | $1,644 | $4 |
Property Value by Mortgage Status in Southern View
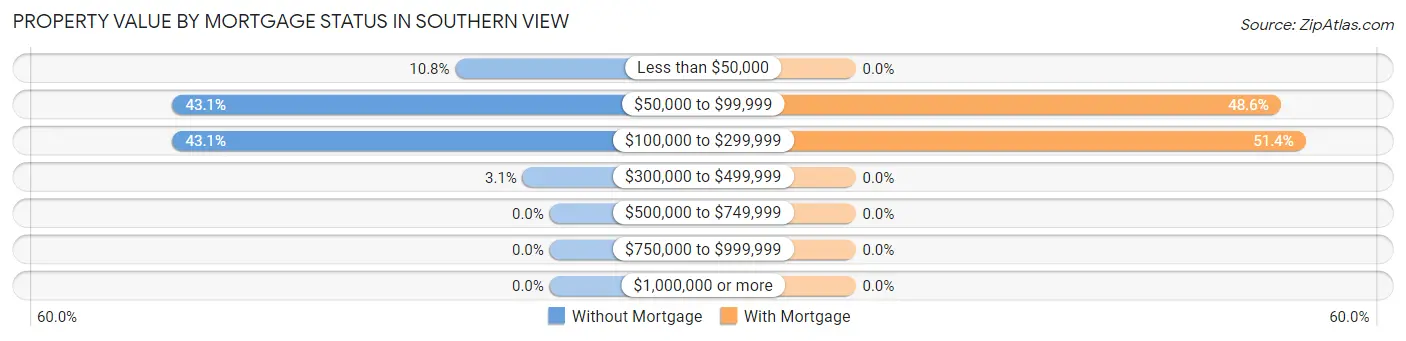
| Property Value | Without Mortgage | With Mortgage |
| Less than $50,000 | 21 (10.8%) | 0 (0.0%) |
| $50,000 to $99,999 | 84 (43.1%) | 187 (48.6%) |
| $100,000 to $299,999 | 84 (43.1%) | 198 (51.4%) |
| $300,000 to $499,999 | 6 (3.1%) | 0 (0.0%) |
| $500,000 to $749,999 | 0 (0.0%) | 0 (0.0%) |
| $750,000 to $999,999 | 0 (0.0%) | 0 (0.0%) |
| $1,000,000 or more | 0 (0.0%) | 0 (0.0%) |
| Total | 195 (100.0%) | 385 (100.0%) |
Household Income by Mortgage Status in Southern View
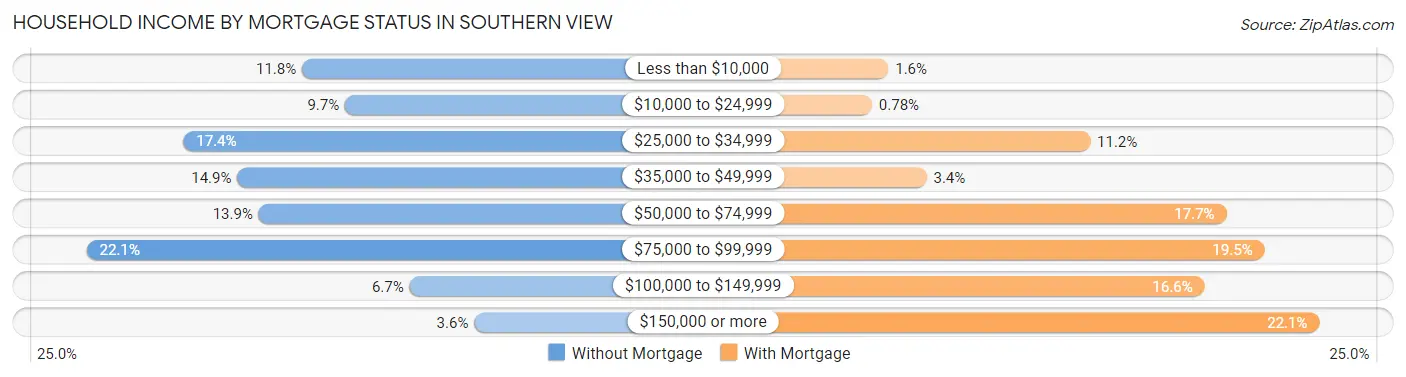
| Household Income | Without Mortgage | With Mortgage |
| Less than $10,000 | 23 (11.8%) | 6 (1.6%) |
| $10,000 to $24,999 | 19 (9.7%) | 3 (0.8%) |
| $25,000 to $34,999 | 34 (17.4%) | 43 (11.2%) |
| $35,000 to $49,999 | 29 (14.9%) | 13 (3.4%) |
| $50,000 to $74,999 | 27 (13.9%) | 68 (17.7%) |
| $75,000 to $99,999 | 43 (22.1%) | 75 (19.5%) |
| $100,000 to $149,999 | 13 (6.7%) | 64 (16.6%) |
| $150,000 or more | 7 (3.6%) | 85 (22.1%) |
| Total | 195 (100.0%) | 385 (100.0%) |
Property Value to Household Income Ratio in Southern View
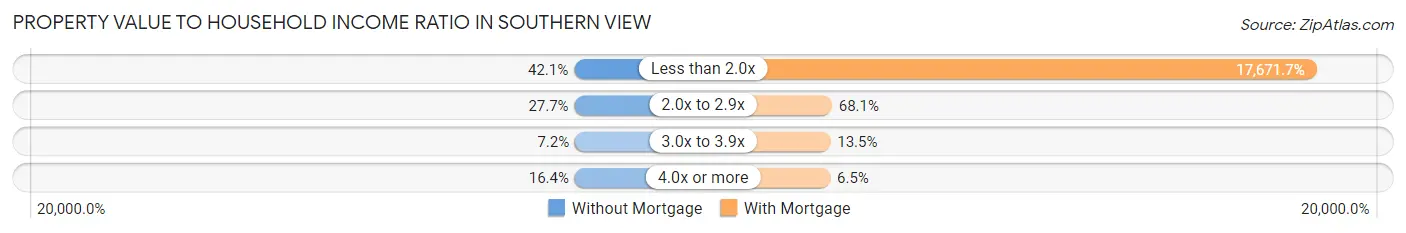
| Value-to-Income Ratio | Without Mortgage | With Mortgage |
| Less than 2.0x | 82 (42.0%) | 68,036 (17,671.7%) |
| 2.0x to 2.9x | 54 (27.7%) | 262 (68.0%) |
| 3.0x to 3.9x | 14 (7.2%) | 52 (13.5%) |
| 4.0x or more | 32 (16.4%) | 25 (6.5%) |
| Total | 195 (100.0%) | 385 (100.0%) |
Real Estate Taxes by Mortgage Status in Southern View
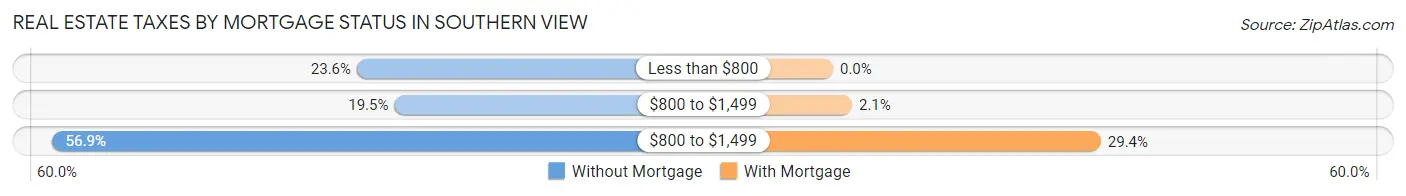
| Property Taxes | Without Mortgage | With Mortgage |
| Less than $800 | 46 (23.6%) | 0 (0.0%) |
| $800 to $1,499 | 38 (19.5%) | 8 (2.1%) |
| $800 to $1,499 | 111 (56.9%) | 113 (29.3%) |
| Total | 195 (100.0%) | 385 (100.0%) |
Health & Disability in Southern View
Health Insurance Coverage by Age in Southern View
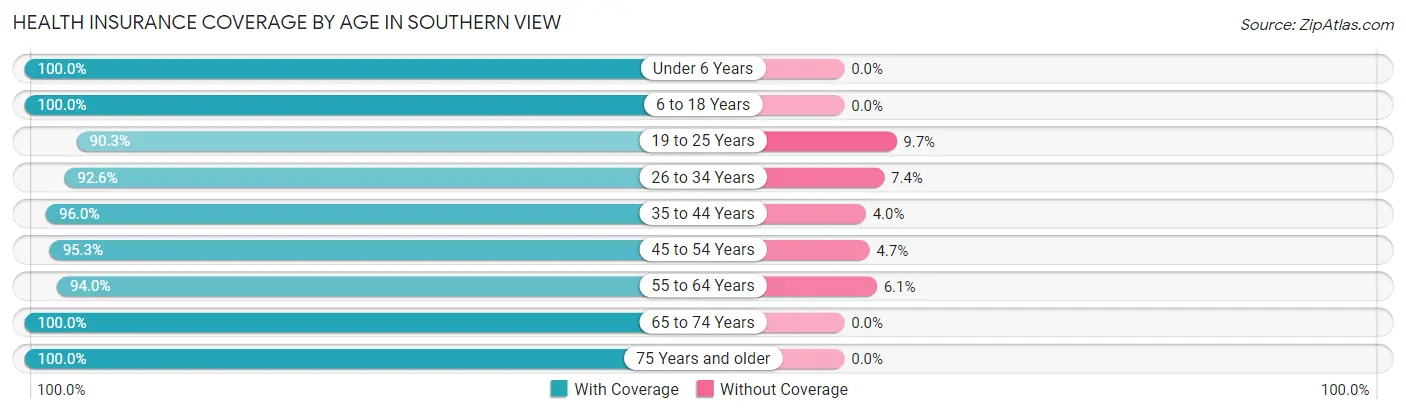
| Age Bracket | With Coverage | Without Coverage |
| Under 6 Years | 19 (100.0%) | 0 (0.0%) |
| 6 to 18 Years | 257 (100.0%) | 0 (0.0%) |
| 19 to 25 Years | 121 (90.3%) | 13 (9.7%) |
| 26 to 34 Years | 237 (92.6%) | 19 (7.4%) |
| 35 to 44 Years | 216 (96.0%) | 9 (4.0%) |
| 45 to 54 Years | 183 (95.3%) | 9 (4.7%) |
| 55 to 64 Years | 295 (94.0%) | 19 (6.0%) |
| 65 to 74 Years | 164 (100.0%) | 0 (0.0%) |
| 75 Years and older | 147 (100.0%) | 0 (0.0%) |
| Total | 1,639 (96.0%) | 69 (4.0%) |
Health Insurance Coverage by Citizenship Status in Southern View
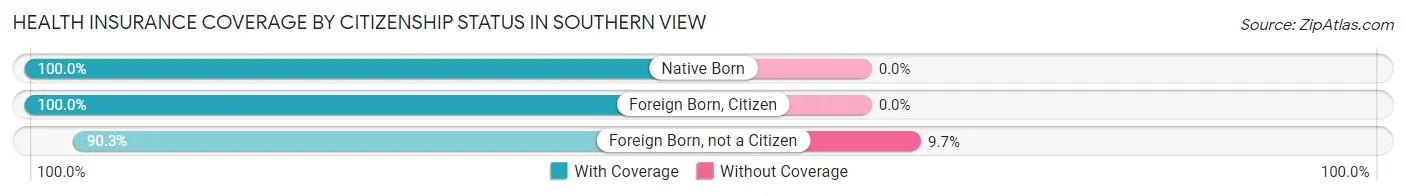
| Citizenship Status | With Coverage | Without Coverage |
| Native Born | 19 (100.0%) | 0 (0.0%) |
| Foreign Born, Citizen | 257 (100.0%) | 0 (0.0%) |
| Foreign Born, not a Citizen | 121 (90.3%) | 13 (9.7%) |
Health Insurance Coverage by Household Income in Southern View
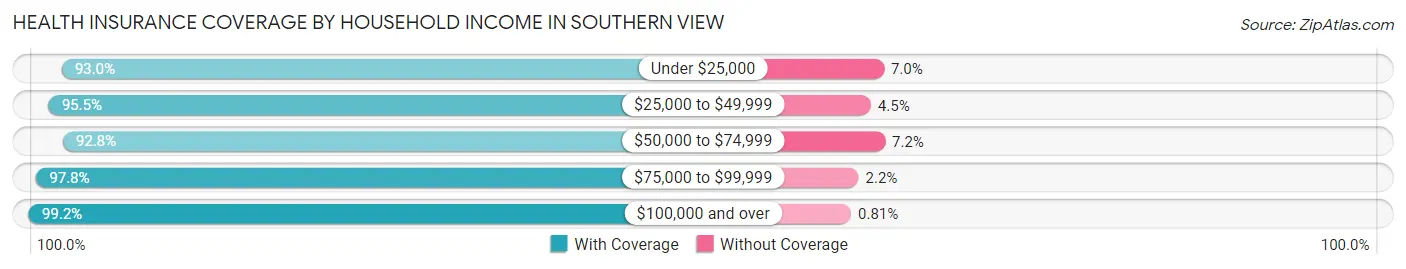
| Household Income | With Coverage | Without Coverage |
| Under $25,000 | 334 (93.0%) | 25 (7.0%) |
| $25,000 to $49,999 | 296 (95.5%) | 14 (4.5%) |
| $50,000 to $74,999 | 272 (92.8%) | 21 (7.2%) |
| $75,000 to $99,999 | 221 (97.8%) | 5 (2.2%) |
| $100,000 and over | 490 (99.2%) | 4 (0.8%) |
Public vs Private Health Insurance Coverage by Age in Southern View
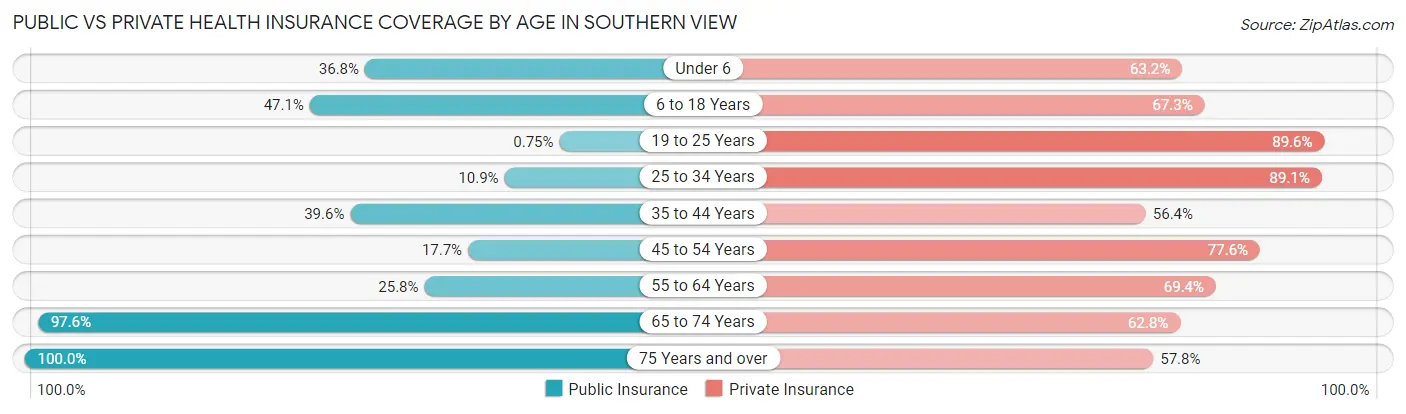
| Age Bracket | Public Insurance | Private Insurance |
| Under 6 | 7 (36.8%) | 12 (63.2%) |
| 6 to 18 Years | 121 (47.1%) | 173 (67.3%) |
| 19 to 25 Years | 1 (0.7%) | 120 (89.5%) |
| 25 to 34 Years | 28 (10.9%) | 228 (89.1%) |
| 35 to 44 Years | 89 (39.6%) | 127 (56.4%) |
| 45 to 54 Years | 34 (17.7%) | 149 (77.6%) |
| 55 to 64 Years | 81 (25.8%) | 218 (69.4%) |
| 65 to 74 Years | 160 (97.6%) | 103 (62.8%) |
| 75 Years and over | 147 (100.0%) | 85 (57.8%) |
| Total | 668 (39.1%) | 1,215 (71.1%) |
Disability Status by Sex by Age in Southern View
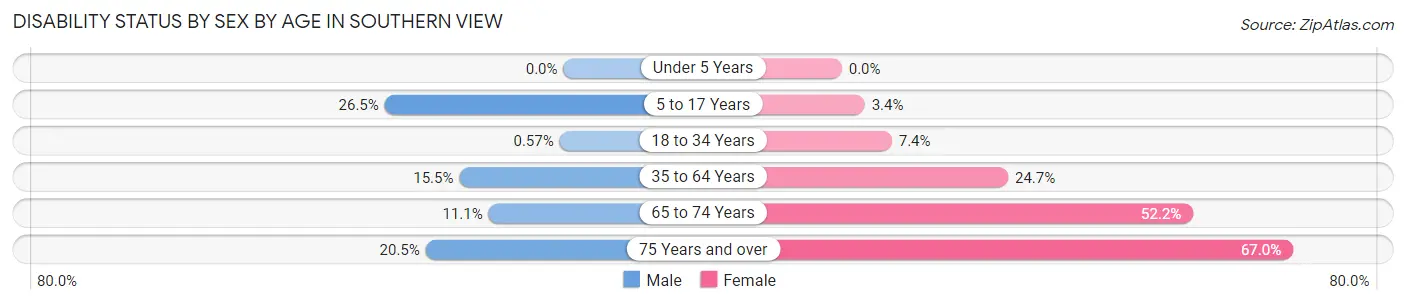
| Age Bracket | Male | Female |
| Under 5 Years | 0 (0.0%) | 0 (0.0%) |
| 5 to 17 Years | 43 (26.5%) | 3 (3.4%) |
| 18 to 34 Years | 1 (0.6%) | 17 (7.4%) |
| 35 to 64 Years | 51 (15.4%) | 99 (24.7%) |
| 65 to 74 Years | 8 (11.1%) | 48 (52.2%) |
| 75 Years and over | 9 (20.4%) | 69 (67.0%) |
Disability Class by Sex by Age in Southern View
Disability Class: Hearing Difficulty
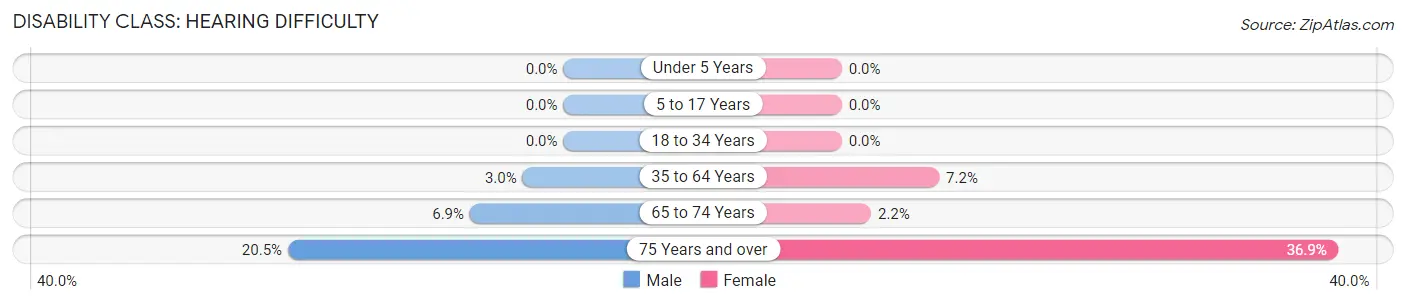
| Age Bracket | Male | Female |
| Under 5 Years | 0 (0.0%) | 0 (0.0%) |
| 5 to 17 Years | 0 (0.0%) | 0 (0.0%) |
| 18 to 34 Years | 0 (0.0%) | 0 (0.0%) |
| 35 to 64 Years | 10 (3.0%) | 29 (7.2%) |
| 65 to 74 Years | 5 (6.9%) | 2 (2.2%) |
| 75 Years and over | 9 (20.4%) | 38 (36.9%) |
Disability Class: Vision Difficulty
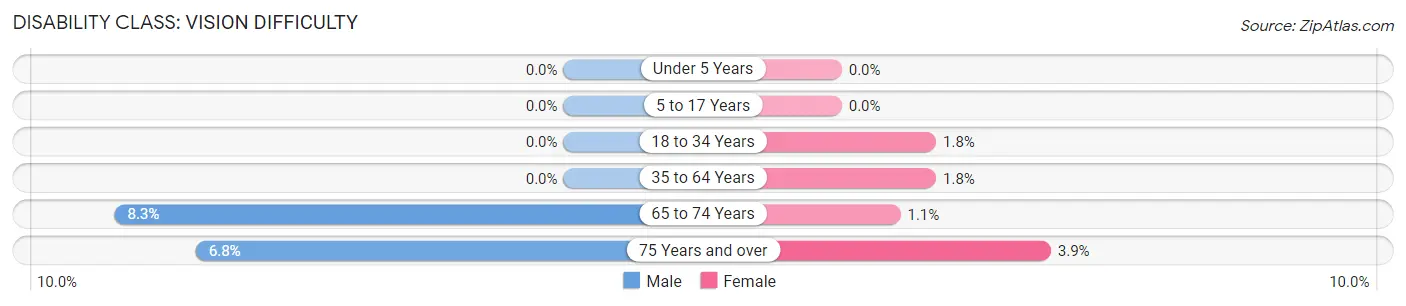
| Age Bracket | Male | Female |
| Under 5 Years | 0 (0.0%) | 0 (0.0%) |
| 5 to 17 Years | 0 (0.0%) | 0 (0.0%) |
| 18 to 34 Years | 0 (0.0%) | 4 (1.8%) |
| 35 to 64 Years | 0 (0.0%) | 7 (1.8%) |
| 65 to 74 Years | 6 (8.3%) | 1 (1.1%) |
| 75 Years and over | 3 (6.8%) | 4 (3.9%) |
Disability Class: Cognitive Difficulty
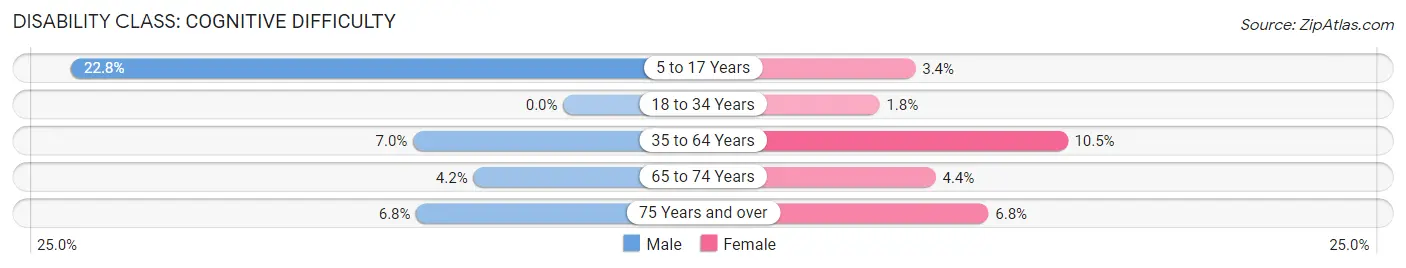
| Age Bracket | Male | Female |
| 5 to 17 Years | 37 (22.8%) | 3 (3.4%) |
| 18 to 34 Years | 0 (0.0%) | 4 (1.8%) |
| 35 to 64 Years | 23 (7.0%) | 42 (10.5%) |
| 65 to 74 Years | 3 (4.2%) | 4 (4.3%) |
| 75 Years and over | 3 (6.8%) | 7 (6.8%) |
Disability Class: Ambulatory Difficulty
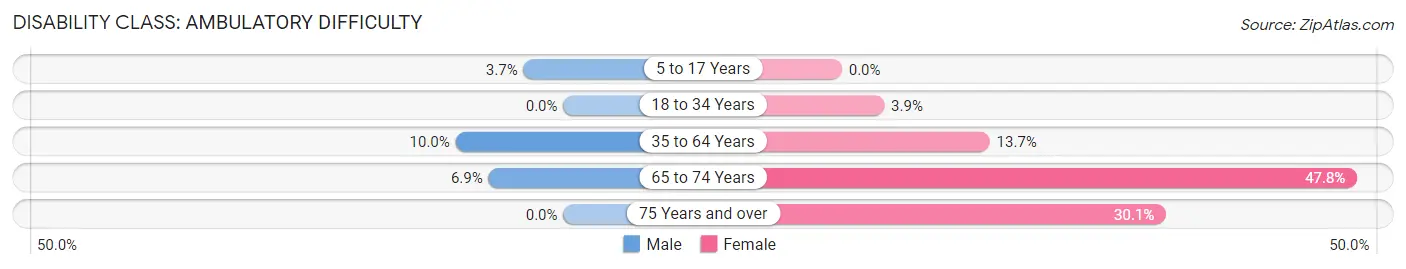
| Age Bracket | Male | Female |
| 5 to 17 Years | 6 (3.7%) | 0 (0.0%) |
| 18 to 34 Years | 0 (0.0%) | 9 (3.9%) |
| 35 to 64 Years | 33 (10.0%) | 55 (13.7%) |
| 65 to 74 Years | 5 (6.9%) | 44 (47.8%) |
| 75 Years and over | 0 (0.0%) | 31 (30.1%) |
Disability Class: Self-Care Difficulty
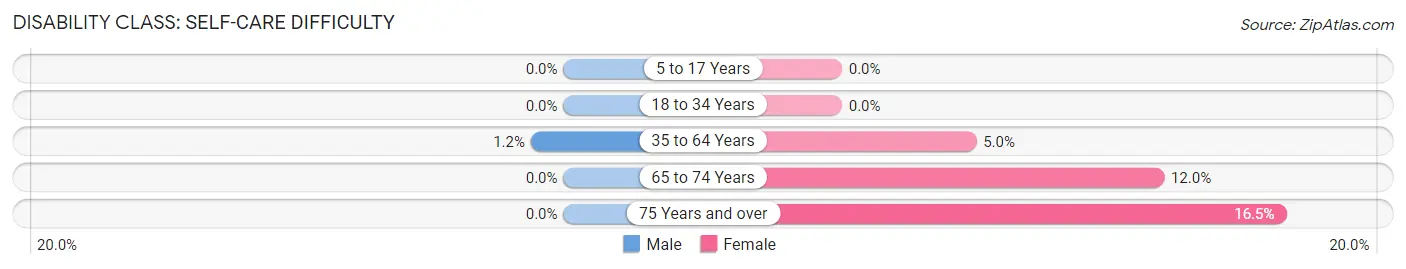
| Age Bracket | Male | Female |
| 5 to 17 Years | 0 (0.0%) | 0 (0.0%) |
| 18 to 34 Years | 0 (0.0%) | 0 (0.0%) |
| 35 to 64 Years | 4 (1.2%) | 20 (5.0%) |
| 65 to 74 Years | 0 (0.0%) | 11 (12.0%) |
| 75 Years and over | 0 (0.0%) | 17 (16.5%) |
Technology Access in Southern View
Computing Device Access in Southern View
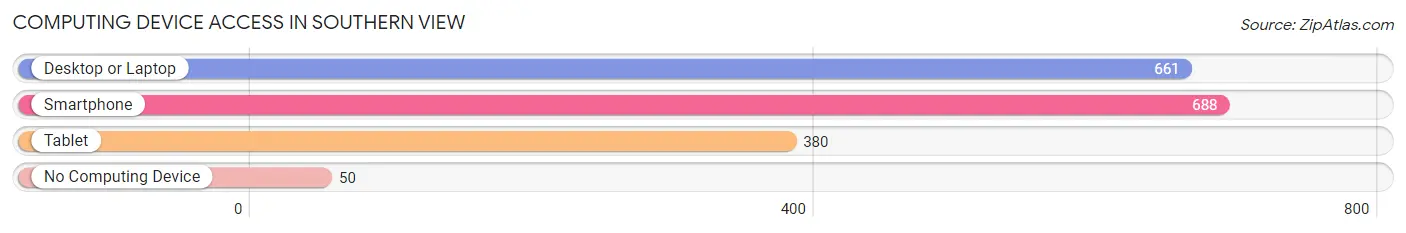
| Device Type | # Households | % Households |
| Desktop or Laptop | 661 | 80.3% |
| Smartphone | 688 | 83.6% |
| Tablet | 380 | 46.2% |
| No Computing Device | 50 | 6.1% |
| Total | 823 | 100.0% |
Internet Access in Southern View
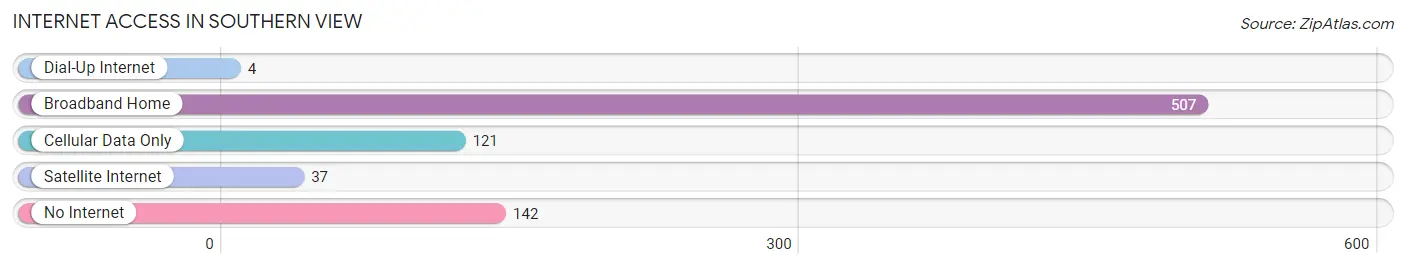
| Internet Type | # Households | % Households |
| Dial-Up Internet | 4 | 0.5% |
| Broadband Home | 507 | 61.6% |
| Cellular Data Only | 121 | 14.7% |
| Satellite Internet | 37 | 4.5% |
| No Internet | 142 | 17.2% |
| Total | 823 | 100.0% |
Southern View Summary
Southern View is a small village located in Sangamon County, Illinois. It is situated on the banks of the Sangamon River, about 10 miles south of the state capital of Springfield. The village has a population of approximately 1,500 people and is part of the Springfield Metropolitan Statistical Area.
Geography
Southern View is located in the central part of the state of Illinois, in Sangamon County. It is situated on the banks of the Sangamon River, about 10 miles south of the state capital of Springfield. The village is located in a rural area, with rolling hills and farmland surrounding it. The climate is humid continental, with hot summers and cold winters.
Economy
The economy of Southern View is largely based on agriculture. The village is home to several farms, which produce a variety of crops, including corn, soybeans, wheat, and hay. The village also has a few small businesses, including a grocery store, a hardware store, and a few restaurants.
Demographics
As of the 2010 census, the population of Southern View was 1,500. The racial makeup of the village was 97.3% White, 0.7% African American, 0.3% Native American, 0.3% Asian, and 1.3% from two or more races. The median household income was $45,000, and the median family income was $50,000.
The majority of the population is of German descent, with a small percentage of Irish, English, and French ancestry. The village is also home to a small Hispanic population.
History
Southern View was founded in 1837 by a group of settlers from Kentucky. The village was originally known as “New Kentucky”, but the name was changed to Southern View in 1839. The village was incorporated in 1854.
In the late 19th century, the village was a popular destination for tourists, who came to enjoy the scenic views of the Sangamon River. The village also had a thriving agricultural industry, with several farms producing a variety of crops.
In the early 20th century, the village began to decline, as many of the farms were abandoned and the population began to decline. The village was revitalized in the 1950s, when the construction of a new highway brought new businesses and residents to the area.
Today, Southern View is a small, rural village with a population of approximately 1,500 people. The village is home to several small businesses, including a grocery store, a hardware store, and a few restaurants. The village is also home to a few farms, which produce a variety of crops, including corn, soybeans, wheat, and hay.
Common Questions
What is Per Capita Income in Southern View?
Per Capita income in Southern View is $31,456.
What is the Median Family Income in Southern View?
Median Family Income in Southern View is $75,977.
What is the Median Household income in Southern View?
Median Household Income in Southern View is $51,311.
What is Income or Wage Gap in Southern View?
Income or Wage Gap in Southern View is 35.9%.
Women in Southern View earn 64.1 cents for every dollar earned by a man.
What is Inequality or Gini Index in Southern View?
Inequality or Gini Index in Southern View is 0.41.
What is the Total Population of Southern View?
Total Population of Southern View is 1,784.
What is the Total Male Population of Southern View?
Total Male Population of Southern View is 818.
What is the Total Female Population of Southern View?
Total Female Population of Southern View is 966.
What is the Ratio of Males per 100 Females in Southern View?
There are 84.68 Males per 100 Females in Southern View.
What is the Ratio of Females per 100 Males in Southern View?
There are 118.09 Females per 100 Males in Southern View.
What is the Median Population Age in Southern View?
Median Population Age in Southern View is 45.0 Years.
What is the Average Family Size in Southern View
Average Family Size in Southern View is 2.8 People.
What is the Average Household Size in Southern View
Average Household Size in Southern View is 2.0 People.
How Large is the Labor Force in Southern View?
There are 993 People in the Labor Forcein in Southern View.
What is the Percentage of People in the Labor Force in Southern View?
64.4% of People are in the Labor Force in Southern View.
What is the Unemployment Rate in Southern View?
Unemployment Rate in Southern View is 9.0%.