Shelbyville, IL Map & Demographics
Shelbyville Map
Shelbyville Overview
$30,347
PER CAPITA INCOME
$66,386
AVG FAMILY INCOME
$53,859
AVG HOUSEHOLD INCOME
7.1%
WAGE / INCOME GAP [ % ]
92.9¢/ $1
WAGE / INCOME GAP [ $ ]
0.42
INEQUALITY / GINI INDEX
4,156
TOTAL POPULATION
1,854
MALE POPULATION
2,302
FEMALE POPULATION
80.54
MALES / 100 FEMALES
124.16
FEMALES / 100 MALES
48.3
MEDIAN AGE
2.9
AVG FAMILY SIZE
2.0
AVG HOUSEHOLD SIZE
2,288
LABOR FORCE [ PEOPLE ]
64.7%
PERCENT IN LABOR FORCE
3.8%
UNEMPLOYMENT RATE
Shelbyville Zip Codes
Shelbyville Area Codes
Income in Shelbyville
Income Overview in Shelbyville
Per Capita Income in Shelbyville is $30,347, while median incomes of families and households are $66,386 and $53,859 respectively.
| Characteristic | Number | Measure |
| Per Capita Income | 4,156 | $30,347 |
| Median Family Income | 1,001 | $66,386 |
| Mean Family Income | 1,001 | $77,908 |
| Median Household Income | 2,001 | $53,859 |
| Mean Household Income | 2,001 | $62,382 |
| Income Deficit | 1,001 | $0 |
| Wage / Income Gap (%) | 4,156 | 7.10% |
| Wage / Income Gap ($) | 4,156 | 92.90¢ per $1 |
| Gini / Inequality Index | 4,156 | 0.42 |
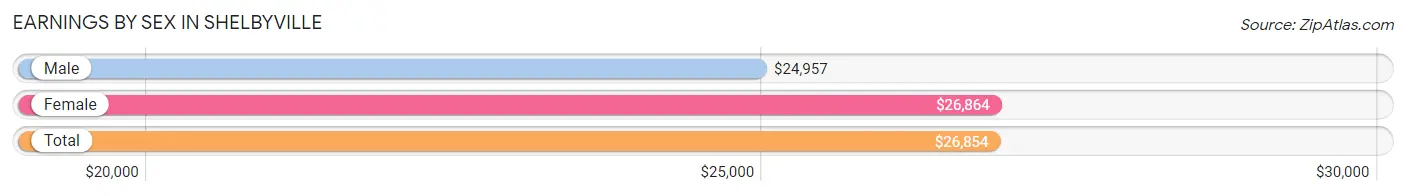
Earnings by Sex in Shelbyville
Average Earnings in Shelbyville are $26,854, $24,957 for men and $26,864 for women, a difference of 7.1%.
| Sex | Number | Average Earnings |
| Male | 1,093 (46.5%) | $24,957 |
| Female | 1,256 (53.5%) | $26,864 |
| Total | 2,349 (100.0%) | $26,854 |
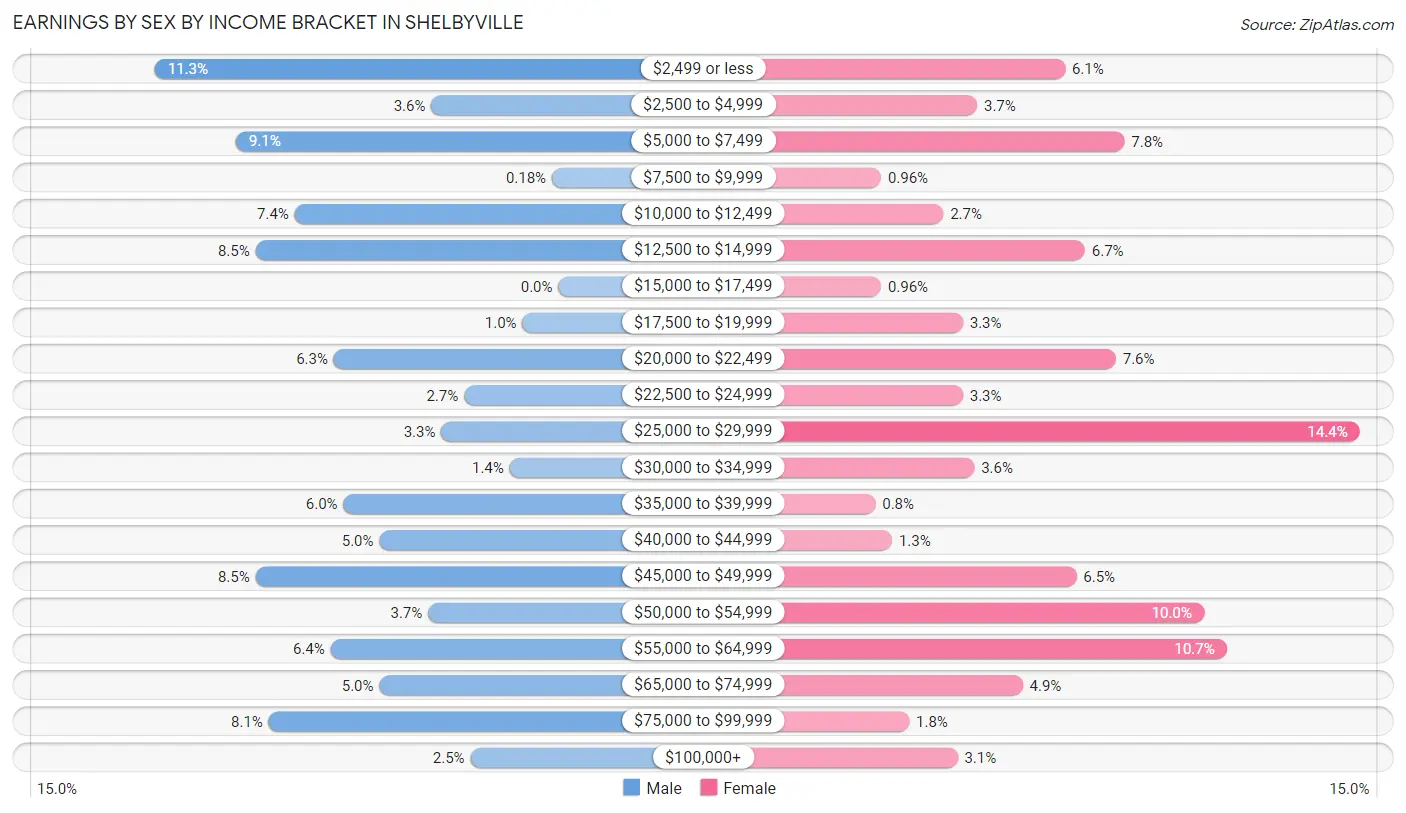
Earnings by Sex by Income Bracket in Shelbyville
The most common earnings brackets in Shelbyville are $2,499 or less for men (124 | 11.3%) and $25,000 to $29,999 for women (181 | 14.4%).
| Income | Male | Female |
| $2,499 or less | 124 (11.3%) | 77 (6.1%) |
| $2,500 to $4,999 | 39 (3.6%) | 46 (3.7%) |
| $5,000 to $7,499 | 99 (9.1%) | 98 (7.8%) |
| $7,500 to $9,999 | 2 (0.2%) | 12 (1.0%) |
| $10,000 to $12,499 | 81 (7.4%) | 34 (2.7%) |
| $12,500 to $14,999 | 93 (8.5%) | 84 (6.7%) |
| $15,000 to $17,499 | 0 (0.0%) | 12 (1.0%) |
| $17,500 to $19,999 | 11 (1.0%) | 41 (3.3%) |
| $20,000 to $22,499 | 69 (6.3%) | 95 (7.6%) |
| $22,500 to $24,999 | 29 (2.6%) | 41 (3.3%) |
| $25,000 to $29,999 | 36 (3.3%) | 181 (14.4%) |
| $30,000 to $34,999 | 15 (1.4%) | 45 (3.6%) |
| $35,000 to $39,999 | 66 (6.0%) | 10 (0.8%) |
| $40,000 to $44,999 | 55 (5.0%) | 16 (1.3%) |
| $45,000 to $49,999 | 93 (8.5%) | 81 (6.5%) |
| $50,000 to $54,999 | 40 (3.7%) | 126 (10.0%) |
| $55,000 to $64,999 | 70 (6.4%) | 134 (10.7%) |
| $65,000 to $74,999 | 55 (5.0%) | 62 (4.9%) |
| $75,000 to $99,999 | 89 (8.1%) | 22 (1.8%) |
| $100,000+ | 27 (2.5%) | 39 (3.1%) |
| Total | 1,093 (100.0%) | 1,256 (100.0%) |
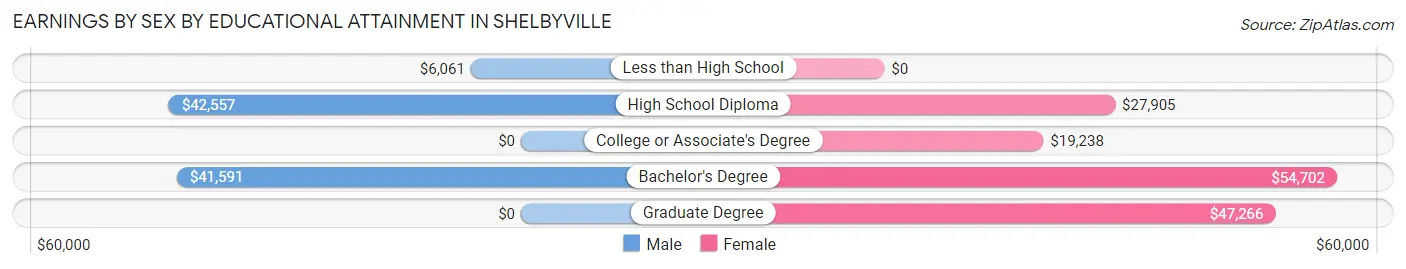
Earnings by Sex by Educational Attainment in Shelbyville
| Educational Attainment | Male Income | Female Income |
| Less than High School | $6,061 | $0 |
| High School Diploma | $42,557 | $27,905 |
| College or Associate's Degree | - | - |
| Bachelor's Degree | $41,591 | $54,702 |
| Graduate Degree | - | - |
| Total | - | - |
Family Income in Shelbyville
Family Income Brackets in Shelbyville
According to the Shelbyville family income data, there are 243 families falling into the $75,000 to $99,999 income range, which is the most common income bracket and makes up 24.3% of all families.
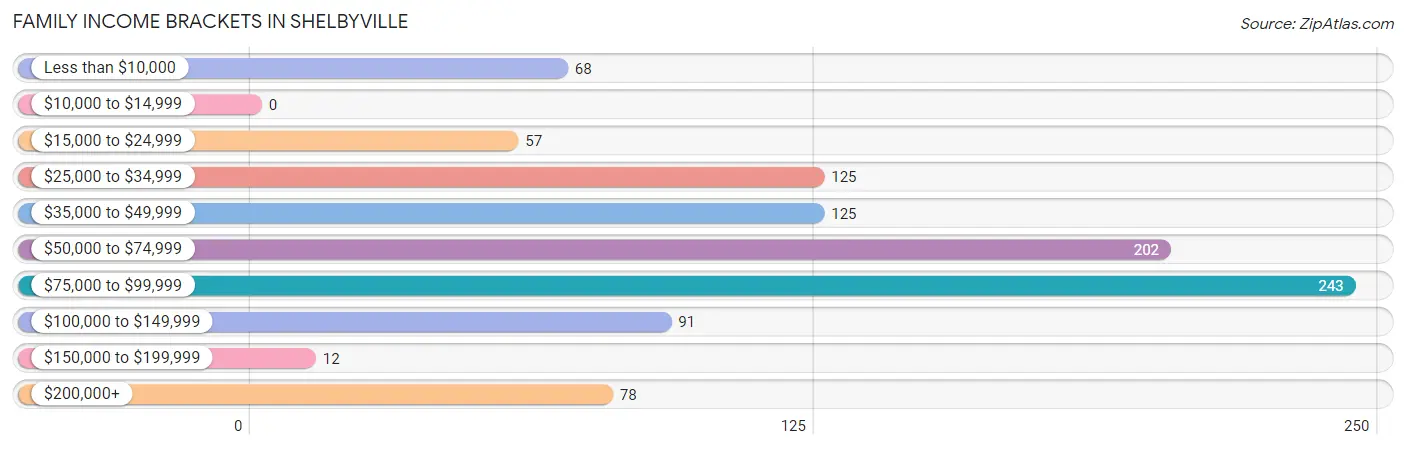
| Income Bracket | # Families | % Families |
| Less than $10,000 | 68 | 6.8% |
| $10,000 to $14,999 | 0 | 0.0% |
| $15,000 to $24,999 | 57 | 5.7% |
| $25,000 to $34,999 | 125 | 12.5% |
| $35,000 to $49,999 | 125 | 12.5% |
| $50,000 to $74,999 | 202 | 20.2% |
| $75,000 to $99,999 | 243 | 24.3% |
| $100,000 to $149,999 | 91 | 9.1% |
| $150,000 to $199,999 | 12 | 1.2% |
| $200,000+ | 78 | 7.8% |
Family Income by Famaliy Size in Shelbyville
4-person families (105 | 10.5%) account for the highest median family income in Shelbyville with $97,039 per family, while 2-person families (444 | 44.4%) have the highest median income of $29,750 per family member.
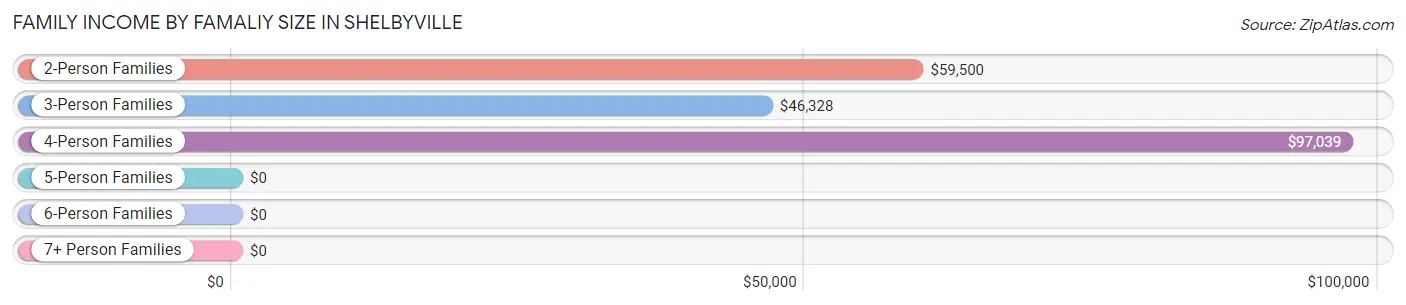
| Income Bracket | # Families | Median Income |
| 2-Person Families | 444 (44.4%) | $59,500 |
| 3-Person Families | 383 (38.3%) | $46,328 |
| 4-Person Families | 105 (10.5%) | $97,039 |
| 5-Person Families | 35 (3.5%) | $0 |
| 6-Person Families | 34 (3.4%) | $0 |
| 7+ Person Families | 0 (0.0%) | $0 |
| Total | 1,001 (100.0%) | $66,386 |
Family Income by Number of Earners in Shelbyville
The median family income in Shelbyville is $66,386, with families comprising 3+ earners (68) having the highest median family income of $217,571, while families with 1 earner (388) have the lowest median family income of $31,027, accounting for 6.8% and 38.8% of families, respectively.
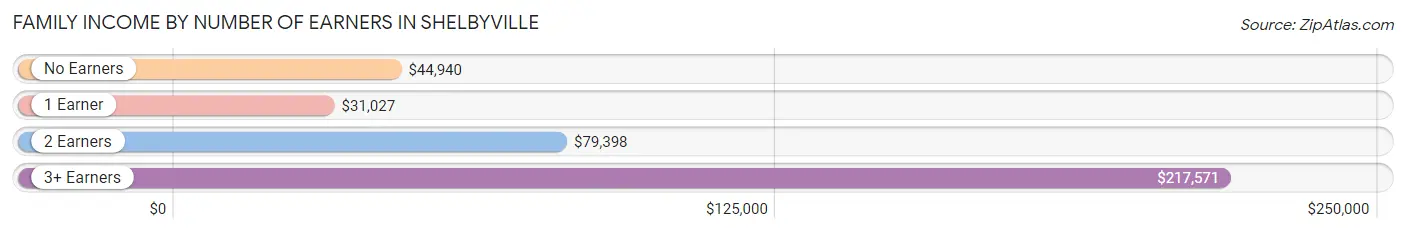
| Number of Earners | # Families | Median Income |
| No Earners | 101 (10.1%) | $44,940 |
| 1 Earner | 388 (38.8%) | $31,027 |
| 2 Earners | 444 (44.4%) | $79,398 |
| 3+ Earners | 68 (6.8%) | $217,571 |
| Total | 1,001 (100.0%) | $66,386 |
Household Income in Shelbyville
Household Income Brackets in Shelbyville
With 600 households falling in the category, the $50,000 to $74,999 income range is the most frequent in Shelbyville, accounting for 30.0% of all households. In contrast, only 30 households (1.5%) fall into the $150,000 to $199,999 income bracket, making it the least populous group.
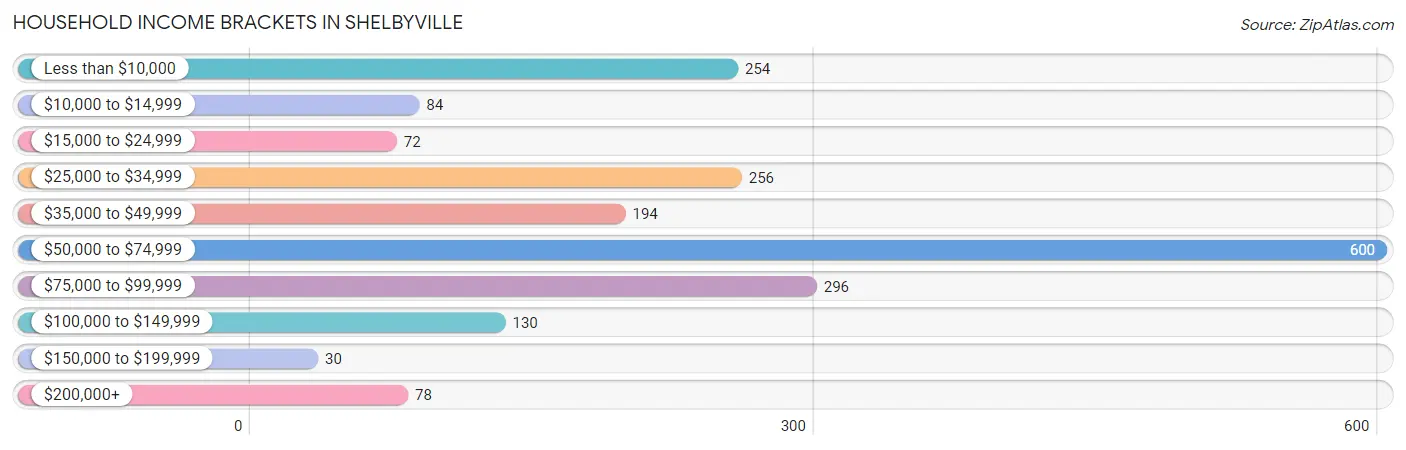
| Income Bracket | # Households | % Households |
| Less than $10,000 | 254 | 12.7% |
| $10,000 to $14,999 | 84 | 4.2% |
| $15,000 to $24,999 | 72 | 3.6% |
| $25,000 to $34,999 | 256 | 12.8% |
| $35,000 to $49,999 | 194 | 9.7% |
| $50,000 to $74,999 | 600 | 30.0% |
| $75,000 to $99,999 | 296 | 14.8% |
| $100,000 to $149,999 | 130 | 6.5% |
| $150,000 to $199,999 | 30 | 1.5% |
| $200,000+ | 78 | 3.9% |
Household Income by Householder Age in Shelbyville
The median household income in Shelbyville is $53,859, with the highest median household income of $63,958 found in the 25 to 44 years age bracket for the primary householder. A total of 394 households (19.7%) fall into this category. Meanwhile, the 15 to 24 years age bracket for the primary householder has the lowest median household income of $0, with 91 households (4.5%) in this group.
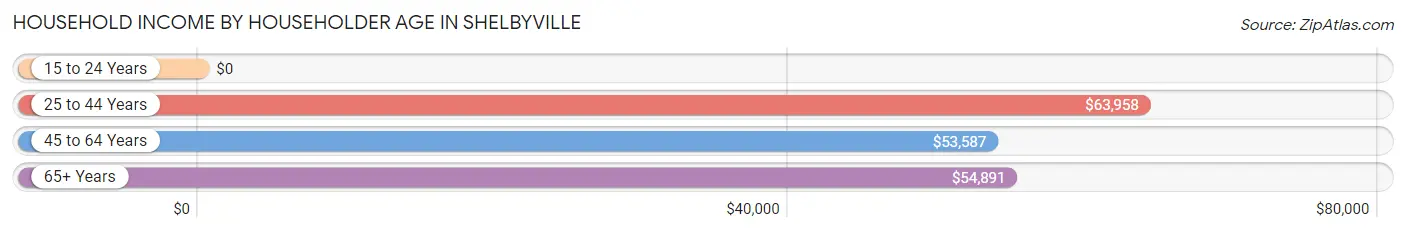
| Income Bracket | # Households | Median Income |
| 15 to 24 Years | 91 (4.5%) | $0 |
| 25 to 44 Years | 394 (19.7%) | $63,958 |
| 45 to 64 Years | 776 (38.8%) | $53,587 |
| 65+ Years | 740 (37.0%) | $54,891 |
| Total | 2,001 (100.0%) | $53,859 |
Poverty in Shelbyville
Income Below Poverty by Sex and Age in Shelbyville
With 20.9% poverty level for males and 10.3% for females among the residents of Shelbyville, 16 and 17 year old males and 55 to 64 year old females are the most vulnerable to poverty, with 50 males (100.0%) and 73 females (18.4%) in their respective age groups living below the poverty level.
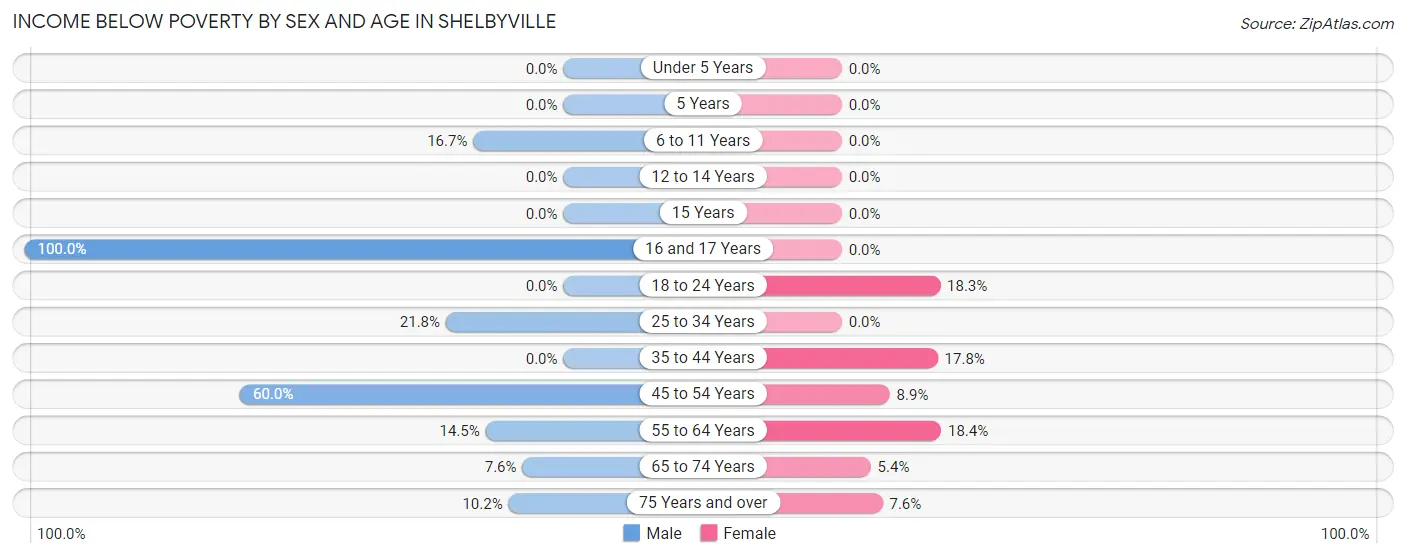
| Age Bracket | Male | Female |
| Under 5 Years | 0 (0.0%) | 0 (0.0%) |
| 5 Years | 0 (0.0%) | 0 (0.0%) |
| 6 to 11 Years | 43 (16.7%) | 0 (0.0%) |
| 12 to 14 Years | 0 (0.0%) | 0 (0.0%) |
| 15 Years | 0 (0.0%) | 0 (0.0%) |
| 16 and 17 Years | 50 (100.0%) | 0 (0.0%) |
| 18 to 24 Years | 0 (0.0%) | 46 (18.2%) |
| 25 to 34 Years | 41 (21.8%) | 0 (0.0%) |
| 35 to 44 Years | 0 (0.0%) | 53 (17.8%) |
| 45 to 54 Years | 174 (60.0%) | 23 (8.9%) |
| 55 to 64 Years | 38 (14.4%) | 73 (18.4%) |
| 65 to 74 Years | 14 (7.6%) | 17 (5.4%) |
| 75 Years and over | 17 (10.2%) | 18 (7.6%) |
| Total | 377 (20.9%) | 230 (10.3%) |
Income Above Poverty by Sex and Age in Shelbyville
According to the poverty statistics in Shelbyville, males aged under 5 years and females aged under 5 years are the age groups that are most secure financially, with 100.0% of males and 100.0% of females in these age groups living above the poverty line.
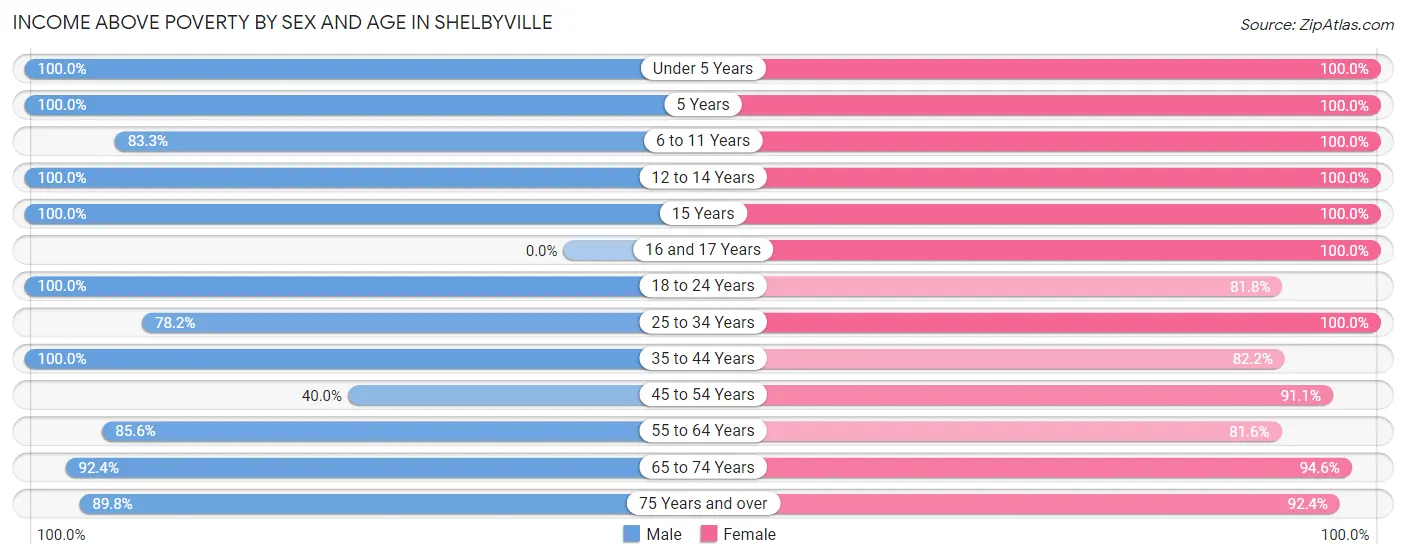
| Age Bracket | Male | Female |
| Under 5 Years | 47 (100.0%) | 114 (100.0%) |
| 5 Years | 11 (100.0%) | 18 (100.0%) |
| 6 to 11 Years | 214 (83.3%) | 95 (100.0%) |
| 12 to 14 Years | 20 (100.0%) | 21 (100.0%) |
| 15 Years | 12 (100.0%) | 25 (100.0%) |
| 16 and 17 Years | 0 (0.0%) | 58 (100.0%) |
| 18 to 24 Years | 115 (100.0%) | 206 (81.8%) |
| 25 to 34 Years | 147 (78.2%) | 134 (100.0%) |
| 35 to 44 Years | 203 (100.0%) | 245 (82.2%) |
| 45 to 54 Years | 116 (40.0%) | 236 (91.1%) |
| 55 to 64 Years | 225 (85.6%) | 323 (81.6%) |
| 65 to 74 Years | 170 (92.4%) | 300 (94.6%) |
| 75 Years and over | 150 (89.8%) | 220 (92.4%) |
| Total | 1,430 (79.1%) | 1,995 (89.7%) |
Income Below Poverty Among Married-Couple Families in Shelbyville
The poverty statistics for married-couple families in Shelbyville show that 9.4% or 68 of the total 720 families live below the poverty line. Families with no children have the highest poverty rate of 12.2%, comprising of 68 families. On the other hand, families with 1 or 2 children have the lowest poverty rate of 0.0%, which includes 0 families.
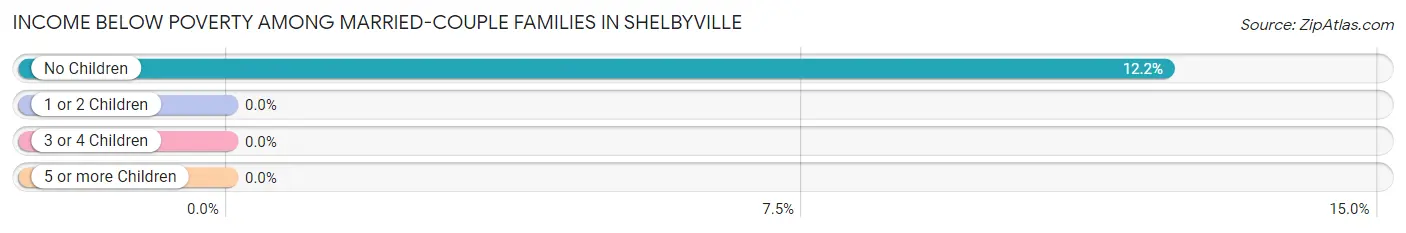
| Children | Above Poverty | Below Poverty |
| No Children | 488 (87.8%) | 68 (12.2%) |
| 1 or 2 Children | 130 (100.0%) | 0 (0.0%) |
| 3 or 4 Children | 34 (100.0%) | 0 (0.0%) |
| 5 or more Children | 0 (0.0%) | 0 (0.0%) |
| Total | 652 (90.6%) | 68 (9.4%) |
Income Below Poverty Among Single-Parent Households in Shelbyville
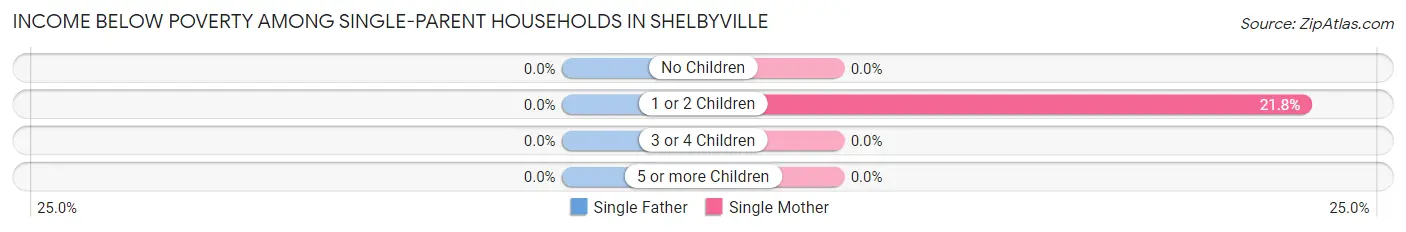
| Children | Single Father | Single Mother |
| No Children | 0 (0.0%) | 0 (0.0%) |
| 1 or 2 Children | 0 (0.0%) | 41 (21.8%) |
| 3 or 4 Children | 0 (0.0%) | 0 (0.0%) |
| 5 or more Children | 0 (0.0%) | 0 (0.0%) |
| Total | 0 (0.0%) | 41 (15.5%) |
Income Below Poverty Among Married-Couple vs Single-Parent Households in Shelbyville
The poverty data for Shelbyville shows that 68 of the married-couple family households (9.4%) and 41 of the single-parent households (14.6%) are living below the poverty level. Within the married-couple family households, those with no children have the highest poverty rate, with 68 households (12.2%) falling below the poverty line. Among the single-parent households, those with 1 or 2 children have the highest poverty rate, with 41 household (20.1%) living below poverty.
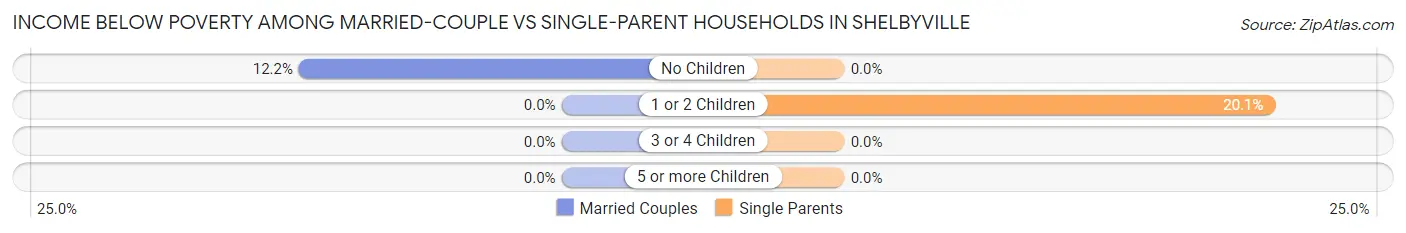
| Children | Married-Couple Families | Single-Parent Households |
| No Children | 68 (12.2%) | 0 (0.0%) |
| 1 or 2 Children | 0 (0.0%) | 41 (20.1%) |
| 3 or 4 Children | 0 (0.0%) | 0 (0.0%) |
| 5 or more Children | 0 (0.0%) | 0 (0.0%) |
| Total | 68 (9.4%) | 41 (14.6%) |
Race in Shelbyville
The most populous races in Shelbyville are White / Caucasian (4,095 | 98.5%), Two or more Races (38 | 0.9%), and Hispanic or Latino (32 | 0.8%).
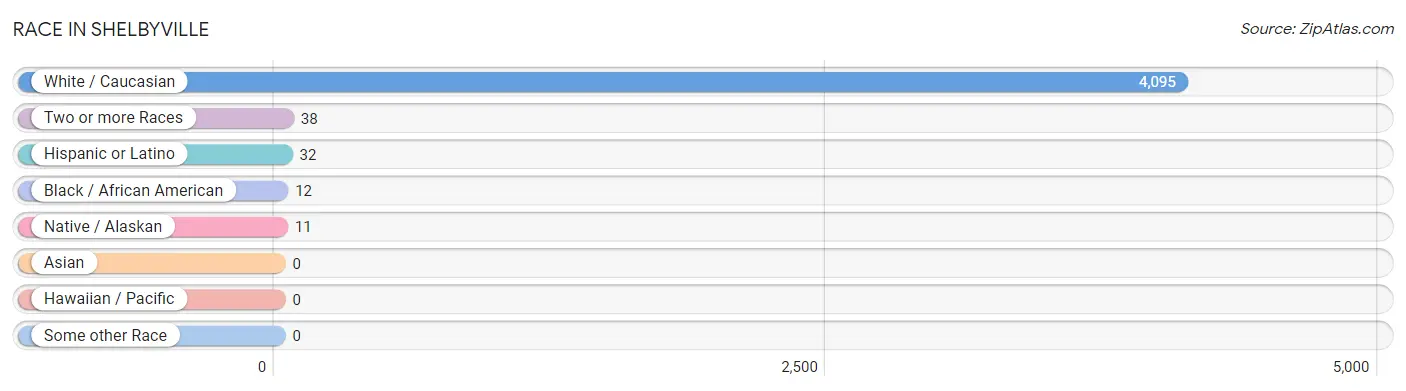
| Race | # Population | % Population |
| Asian | 0 | 0.0% |
| Black / African American | 12 | 0.3% |
| Hawaiian / Pacific | 0 | 0.0% |
| Hispanic or Latino | 32 | 0.8% |
| Native / Alaskan | 11 | 0.3% |
| White / Caucasian | 4,095 | 98.5% |
| Two or more Races | 38 | 0.9% |
| Some other Race | 0 | 0.0% |
| Total | 4,156 | 100.0% |
Ancestry in Shelbyville
The most populous ancestries reported in Shelbyville are English (798 | 19.2%), German (680 | 16.4%), American (360 | 8.7%), Irish (220 | 5.3%), and French (216 | 5.2%), together accounting for 54.7% of all Shelbyville residents.
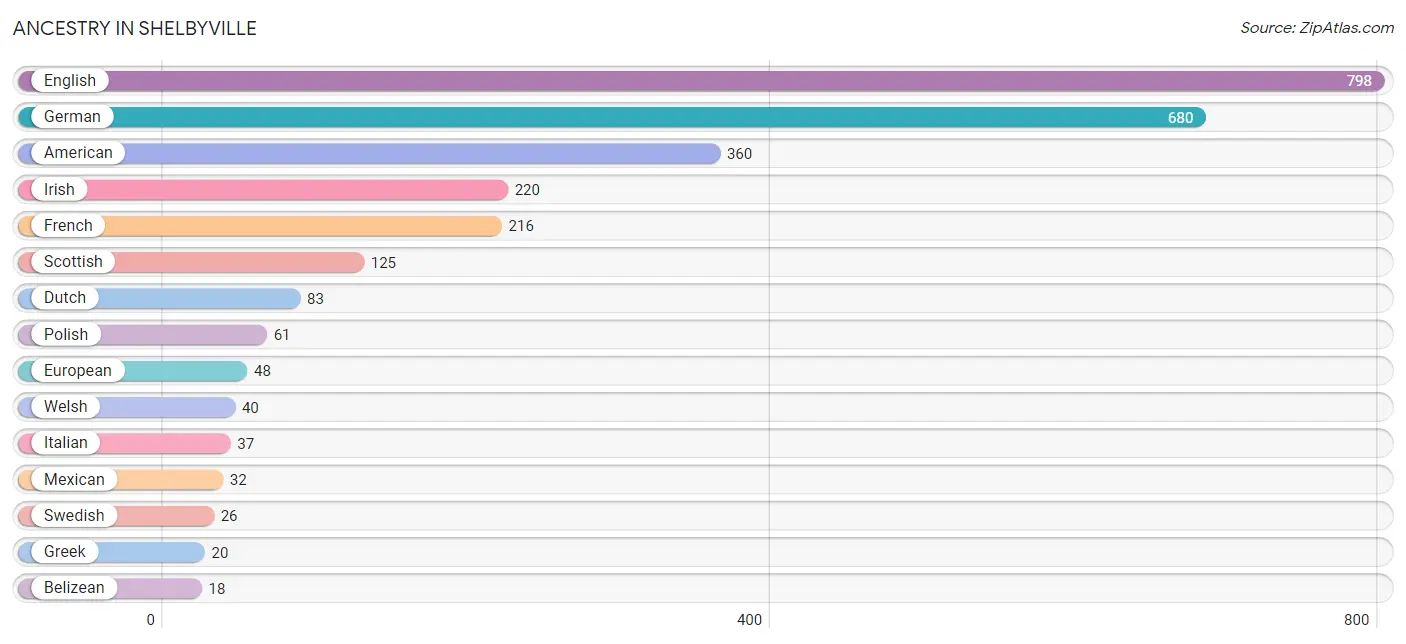
| Ancestry | # Population | % Population |
| American | 360 | 8.7% |
| Belizean | 18 | 0.4% |
| Central American Indian | 18 | 0.4% |
| Czech | 17 | 0.4% |
| Dutch | 83 | 2.0% |
| English | 798 | 19.2% |
| European | 48 | 1.1% |
| Finnish | 1 | 0.0% |
| French | 216 | 5.2% |
| German | 680 | 16.4% |
| Greek | 20 | 0.5% |
| Irish | 220 | 5.3% |
| Italian | 37 | 0.9% |
| Mexican | 32 | 0.8% |
| Norwegian | 9 | 0.2% |
| Polish | 61 | 1.5% |
| Scottish | 125 | 3.0% |
| Swedish | 26 | 0.6% |
| Swiss | 11 | 0.3% |
| Ukrainian | 11 | 0.3% |
| Welsh | 40 | 1.0% | View All 21 Rows |
Immigrants in Shelbyville
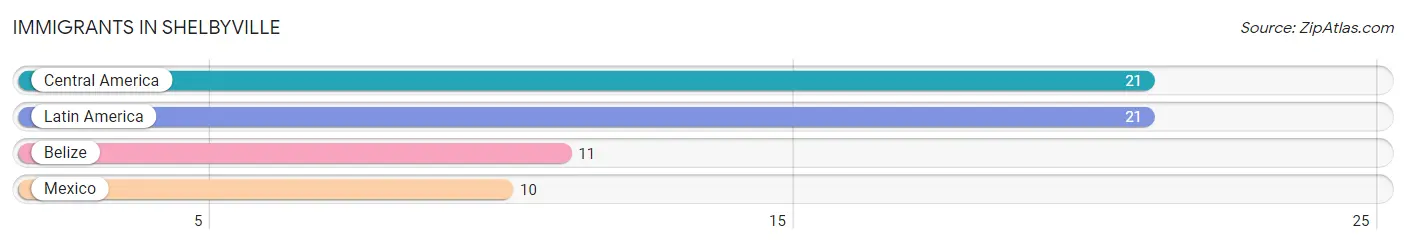
The most numerous immigrant groups reported in Shelbyville came from Central America (21 | 0.5%), Latin America (21 | 0.5%), Belize (11 | 0.3%), and Mexico (10 | 0.2%), together accounting for 1.5% of all Shelbyville residents.
| Immigration Origin | # Population | % Population |
| Belize | 11 | 0.3% |
| Central America | 21 | 0.5% |
| Latin America | 21 | 0.5% |
| Mexico | 10 | 0.2% | View All 4 Rows |
Sex and Age in Shelbyville
Sex and Age in Shelbyville
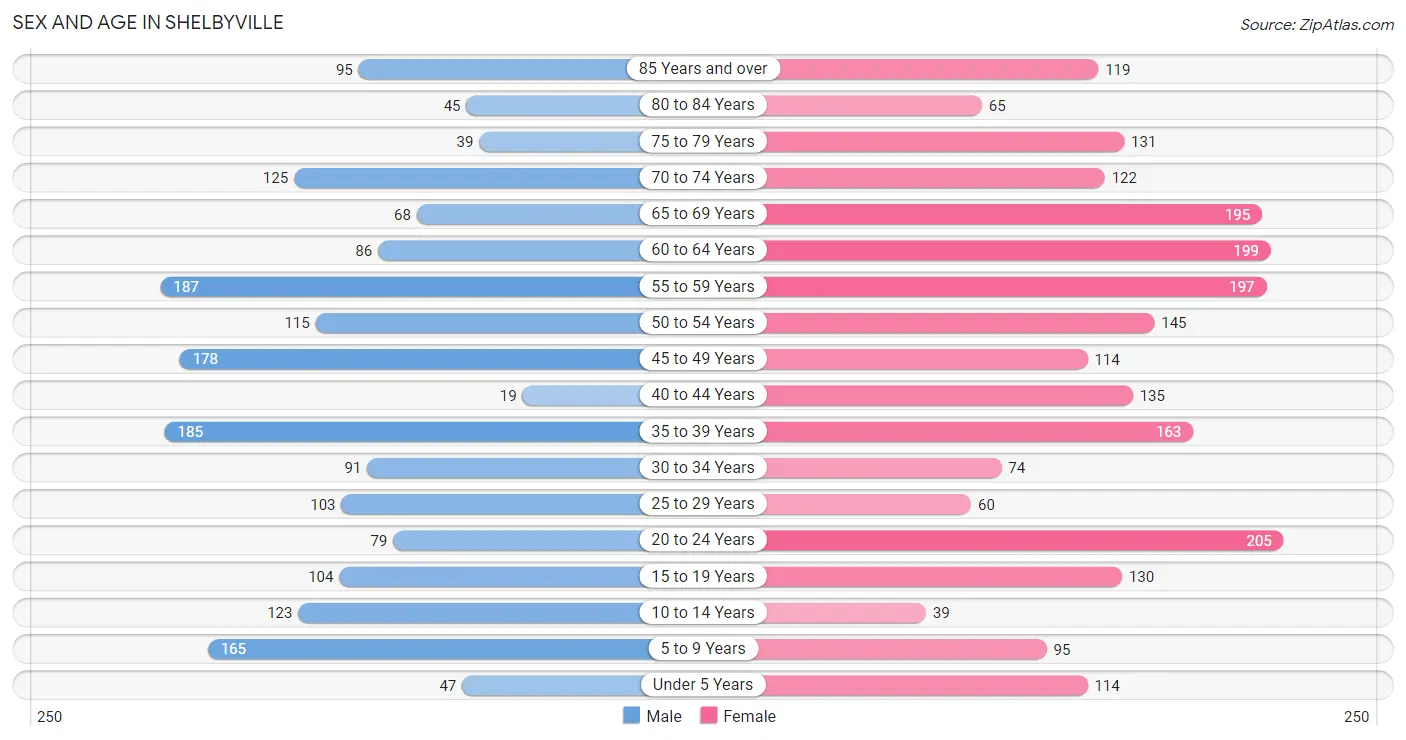
The most populous age groups in Shelbyville are 55 to 59 Years (187 | 10.1%) for men and 20 to 24 Years (205 | 8.9%) for women.
| Age Bracket | Male | Female |
| Under 5 Years | 47 (2.5%) | 114 (5.0%) |
| 5 to 9 Years | 165 (8.9%) | 95 (4.1%) |
| 10 to 14 Years | 123 (6.6%) | 39 (1.7%) |
| 15 to 19 Years | 104 (5.6%) | 130 (5.7%) |
| 20 to 24 Years | 79 (4.3%) | 205 (8.9%) |
| 25 to 29 Years | 103 (5.6%) | 60 (2.6%) |
| 30 to 34 Years | 91 (4.9%) | 74 (3.2%) |
| 35 to 39 Years | 185 (10.0%) | 163 (7.1%) |
| 40 to 44 Years | 19 (1.0%) | 135 (5.9%) |
| 45 to 49 Years | 178 (9.6%) | 114 (5.0%) |
| 50 to 54 Years | 115 (6.2%) | 145 (6.3%) |
| 55 to 59 Years | 187 (10.1%) | 197 (8.6%) |
| 60 to 64 Years | 86 (4.6%) | 199 (8.6%) |
| 65 to 69 Years | 68 (3.7%) | 195 (8.5%) |
| 70 to 74 Years | 125 (6.7%) | 122 (5.3%) |
| 75 to 79 Years | 39 (2.1%) | 131 (5.7%) |
| 80 to 84 Years | 45 (2.4%) | 65 (2.8%) |
| 85 Years and over | 95 (5.1%) | 119 (5.2%) |
| Total | 1,854 (100.0%) | 2,302 (100.0%) |
Families and Households in Shelbyville
Median Family Size in Shelbyville
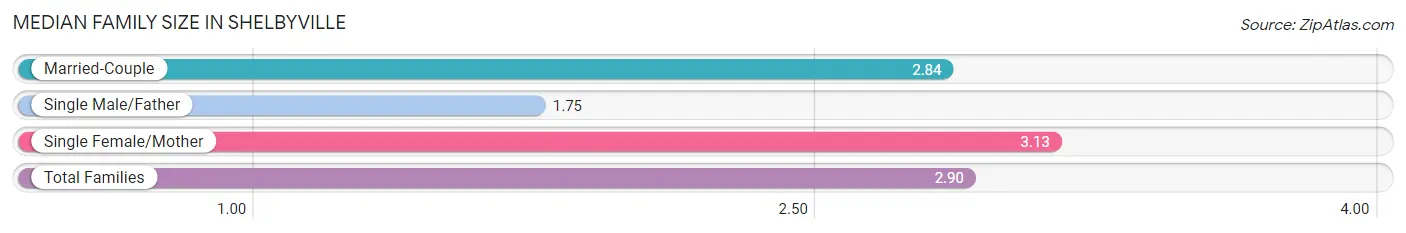
The median family size in Shelbyville is 2.90 persons per family, with single female/mother families (265 | 26.5%) accounting for the largest median family size of 3.13 persons per family. On the other hand, single male/father families (16 | 1.6%) represent the smallest median family size with 1.75 persons per family.
| Family Type | # Families | Family Size |
| Married-Couple | 720 (71.9%) | 2.84 |
| Single Male/Father | 16 (1.6%) | 1.75 |
| Single Female/Mother | 265 (26.5%) | 3.13 |
| Total Families | 1,001 (100.0%) | 2.90 |
Median Household Size in Shelbyville
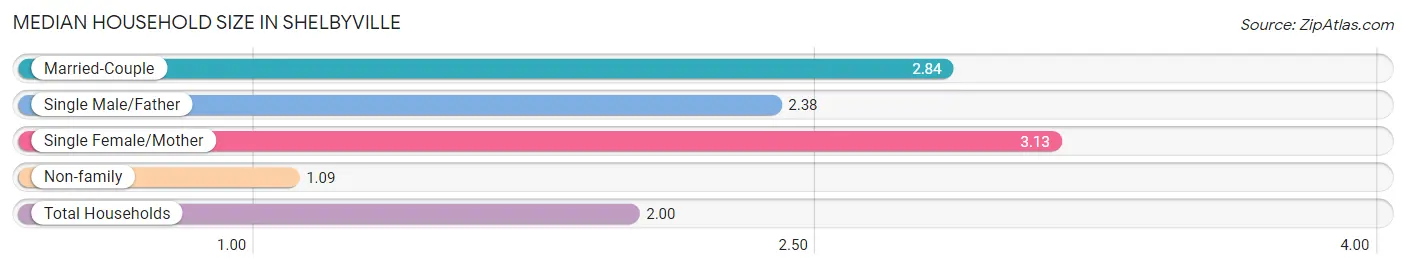
The median household size in Shelbyville is 2.00 persons per household, with single female/mother households (265 | 13.2%) accounting for the largest median household size of 3.13 persons per household. non-family households (1,000 | 50.0%) represent the smallest median household size with 1.09 persons per household.
| Household Type | # Households | Household Size |
| Married-Couple | 720 (36.0%) | 2.84 |
| Single Male/Father | 16 (0.8%) | 2.38 |
| Single Female/Mother | 265 (13.2%) | 3.13 |
| Non-family | 1,000 (50.0%) | 1.09 |
| Total Households | 2,001 (100.0%) | 2.00 |
Household Size by Marriage Status in Shelbyville
Out of a total of 2,001 households in Shelbyville, 1,001 (50.0%) are family households, while 1,000 (50.0%) are nonfamily households. The most numerous type of family households are 2-person households, comprising 428, and the most common type of nonfamily households are 1-person households, comprising 921.
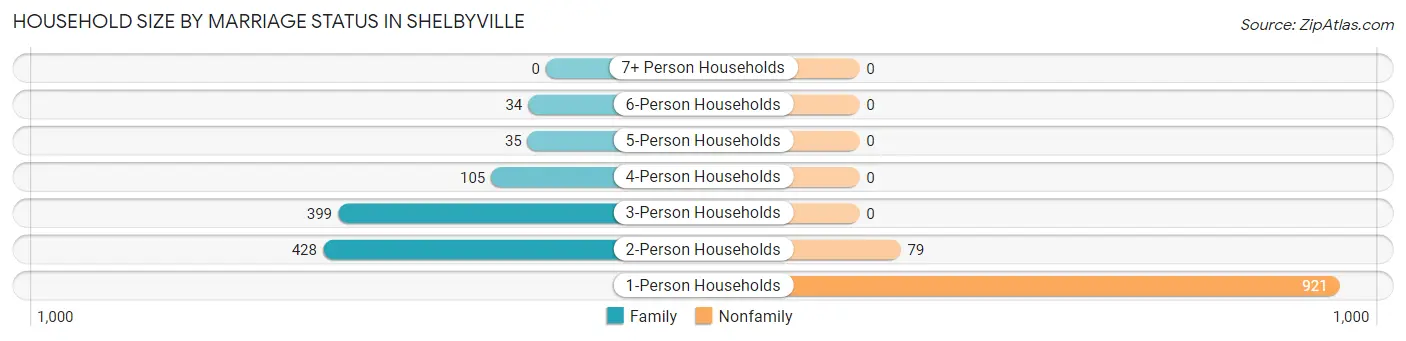
| Household Size | Family Households | Nonfamily Households |
| 1-Person Households | - | 921 (46.0%) |
| 2-Person Households | 428 (21.4%) | 79 (4.0%) |
| 3-Person Households | 399 (19.9%) | 0 (0.0%) |
| 4-Person Households | 105 (5.2%) | 0 (0.0%) |
| 5-Person Households | 35 (1.8%) | 0 (0.0%) |
| 6-Person Households | 34 (1.7%) | 0 (0.0%) |
| 7+ Person Households | 0 (0.0%) | 0 (0.0%) |
| Total | 1,001 (50.0%) | 1,000 (50.0%) |
Female Fertility in Shelbyville
Fertility by Age in Shelbyville
Average fertility rate in Shelbyville is 49.0 births per 1,000 women. Women in the age bracket of 20 to 34 years have the highest fertility rate with 127.0 births per 1,000 women. Women in the age bracket of 20 to 34 years acount for 100.0% of all women with births.
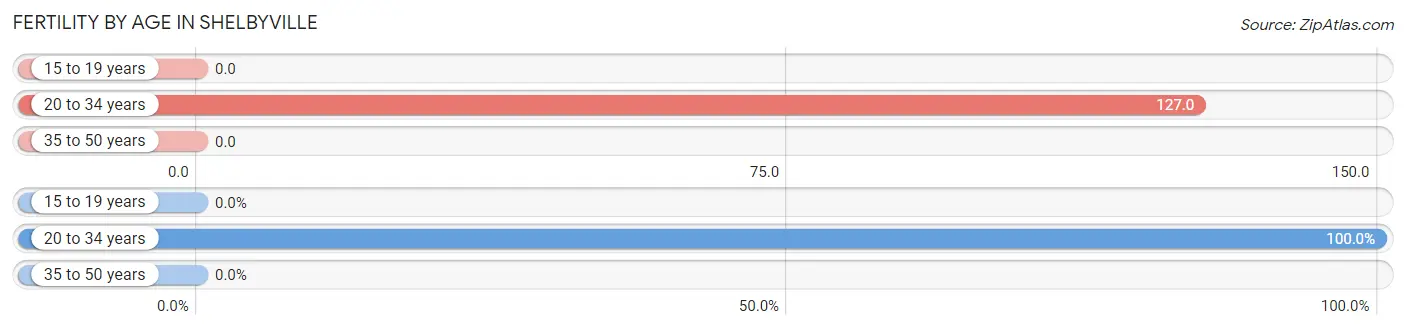
| Age Bracket | Women with Births | Births / 1,000 Women |
| 15 to 19 years | 0 (0.0%) | 0.0 |
| 20 to 34 years | 43 (100.0%) | 127.0 |
| 35 to 50 years | 0 (0.0%) | 0.0 |
| Total | 43 (100.0%) | 49.0 |
Fertility by Age by Marriage Status in Shelbyville
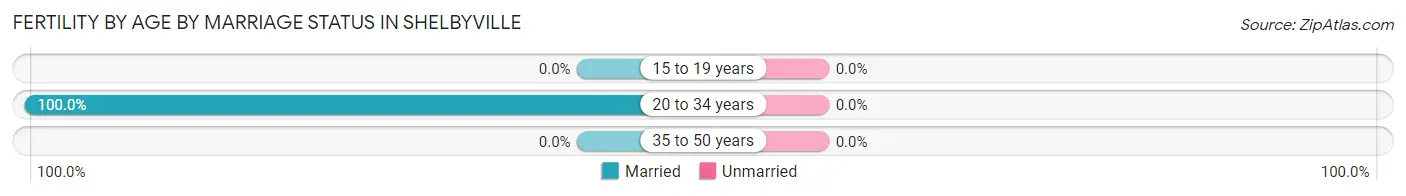
| Age Bracket | Married | Unmarried |
| 15 to 19 years | 0 (0.0%) | 0 (0.0%) |
| 20 to 34 years | 43 (100.0%) | 0 (0.0%) |
| 35 to 50 years | 0 (0.0%) | 0 (0.0%) |
| Total | 43 (100.0%) | 0 (0.0%) |
Fertility by Education in Shelbyville
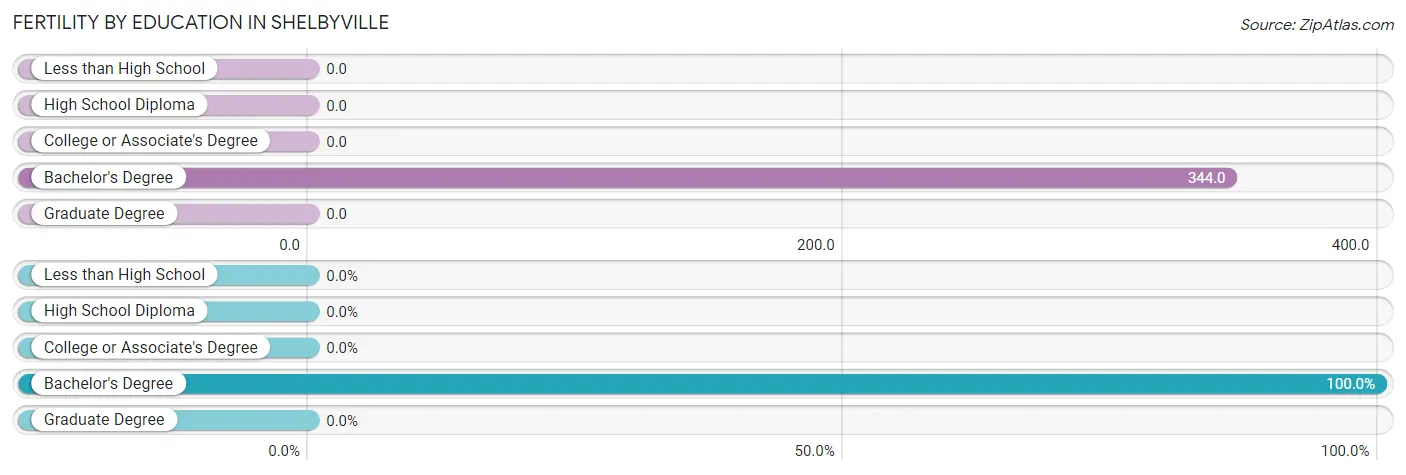
| Educational Attainment | Women with Births | Births / 1,000 Women |
| Less than High School | 0 (0.0%) | 0.0 |
| High School Diploma | 0 (0.0%) | 0.0 |
| College or Associate's Degree | 0 (0.0%) | 0.0 |
| Bachelor's Degree | 43 (100.0%) | 344.0 |
| Graduate Degree | 0 (0.0%) | 0.0 |
| Total | 43 (100.0%) | 49.0 |
Fertility by Education by Marriage Status in Shelbyville
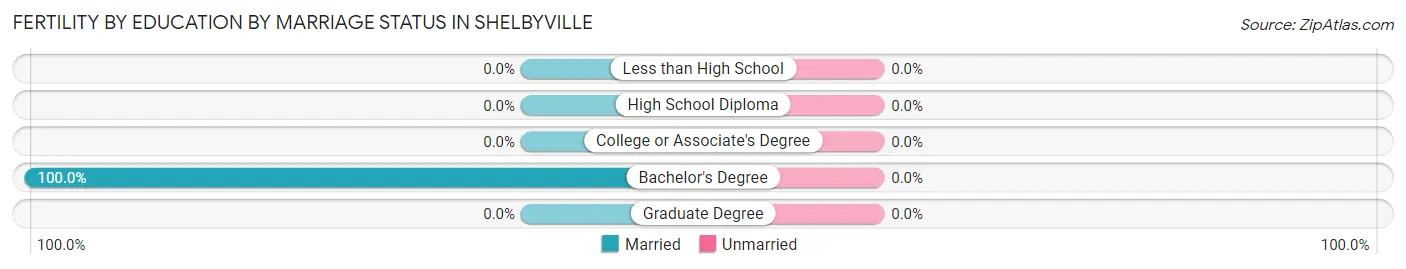
| Educational Attainment | Married | Unmarried |
| Less than High School | 0 (0.0%) | 0 (0.0%) |
| High School Diploma | 0 (0.0%) | 0 (0.0%) |
| College or Associate's Degree | 0 (0.0%) | 0 (0.0%) |
| Bachelor's Degree | 43 (100.0%) | 0 (0.0%) |
| Graduate Degree | 0 (0.0%) | 0 (0.0%) |
| Total | 43 (100.0%) | 0 (0.0%) |
Employment Characteristics in Shelbyville
Employment by Class of Employer in Shelbyville
Among the 2,203 employed individuals in Shelbyville, private company employees (1,310 | 59.5%), local government employees (292 | 13.3%), and not-for-profit organizations (278 | 12.6%) make up the most common classes of employment.
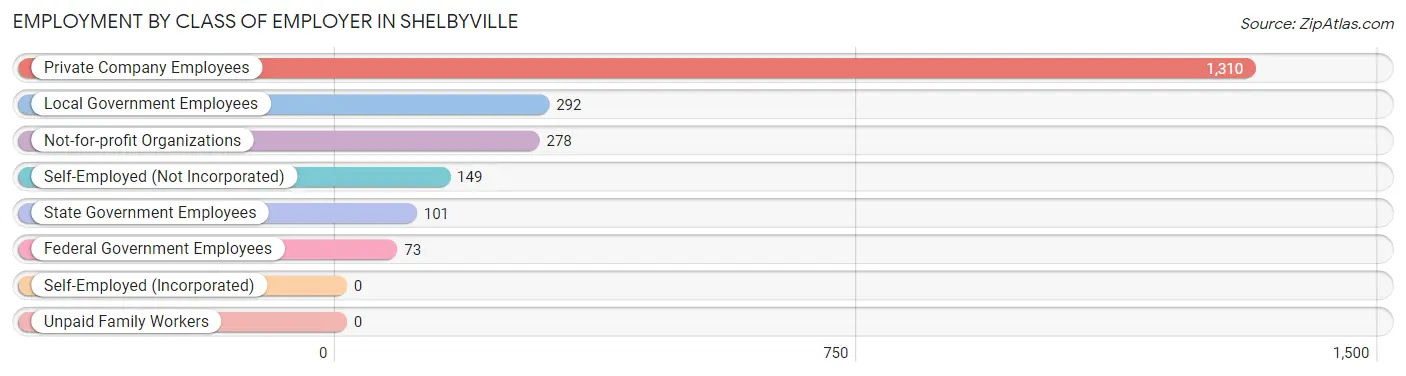
| Employer Class | # Employees | % Employees |
| Private Company Employees | 1,310 | 59.5% |
| Self-Employed (Incorporated) | 0 | 0.0% |
| Self-Employed (Not Incorporated) | 149 | 6.8% |
| Not-for-profit Organizations | 278 | 12.6% |
| Local Government Employees | 292 | 13.3% |
| State Government Employees | 101 | 4.6% |
| Federal Government Employees | 73 | 3.3% |
| Unpaid Family Workers | 0 | 0.0% |
| Total | 2,203 | 100.0% |
Employment Status by Age in Shelbyville
According to the labor force statistics for Shelbyville, out of the total population over 16 years of age (3,536), 64.7% or 2,288 individuals are in the labor force, with 3.8% or 87 of them unemployed. The age group with the highest labor force participation rate is 20 to 24 years, with 98.2% or 279 individuals in the labor force. Within the labor force, the 25 to 29 years age range has the highest percentage of unemployed individuals, with 15.8% or 25 of them being unemployed.
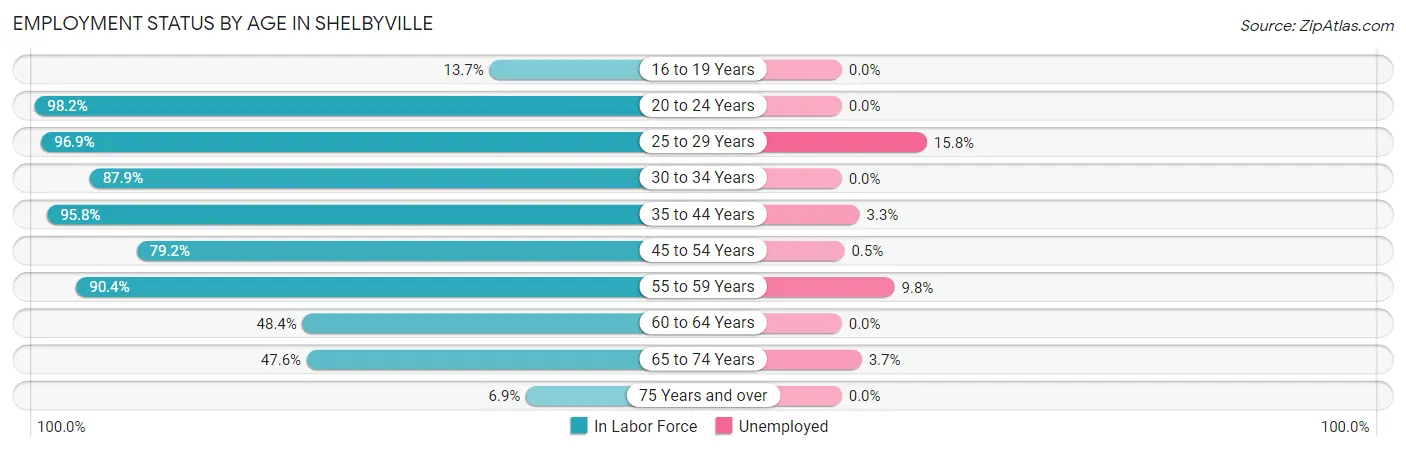
| Age Bracket | In Labor Force | Unemployed |
| 16 to 19 Years | 27 (13.7%) | 0 (0.0%) |
| 20 to 24 Years | 279 (98.2%) | 0 (0.0%) |
| 25 to 29 Years | 158 (96.9%) | 25 (15.8%) |
| 30 to 34 Years | 145 (87.9%) | 0 (0.0%) |
| 35 to 44 Years | 481 (95.8%) | 16 (3.3%) |
| 45 to 54 Years | 437 (79.2%) | 2 (0.5%) |
| 55 to 59 Years | 347 (90.4%) | 34 (9.8%) |
| 60 to 64 Years | 138 (48.4%) | 0 (0.0%) |
| 65 to 74 Years | 243 (47.6%) | 9 (3.7%) |
| 75 Years and over | 34 (6.9%) | 0 (0.0%) |
| Total | 2,288 (64.7%) | 87 (3.8%) |
Employment Status by Educational Attainment in Shelbyville
According to labor force statistics for Shelbyville, 83.2% of individuals (1,706) out of the total population between 25 and 64 years of age (2,051) are in the labor force, with 4.5% or 77 of them being unemployed. The group with the highest labor force participation rate are those with the educational attainment of bachelor's degree or higher, with 96.5% or 385 individuals in the labor force. Within the labor force, individuals with high school diploma education have the highest percentage of unemployment, with 9.6% or 54 of them being unemployed.
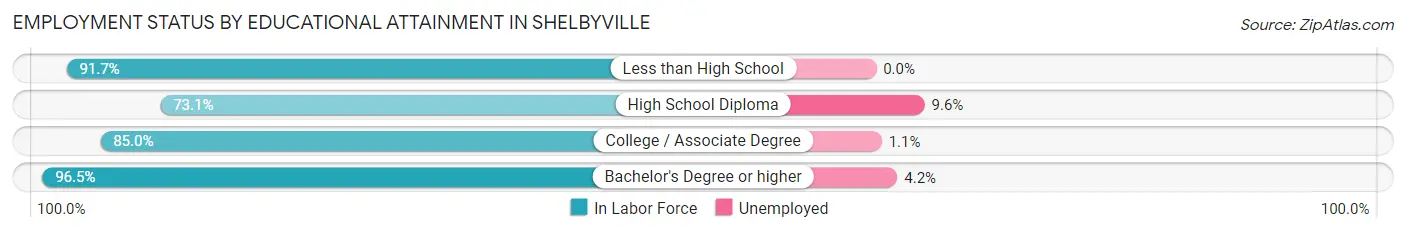
| Educational Attainment | In Labor Force | Unemployed |
| Less than High School | 110 (91.7%) | 0 (0.0%) |
| High School Diploma | 563 (73.1%) | 74 (9.6%) |
| College / Associate Degree | 648 (85.0%) | 8 (1.1%) |
| Bachelor's Degree or higher | 385 (96.5%) | 17 (4.2%) |
| Total | 1,706 (83.2%) | 92 (4.5%) |
Employment Occupations by Sex in Shelbyville
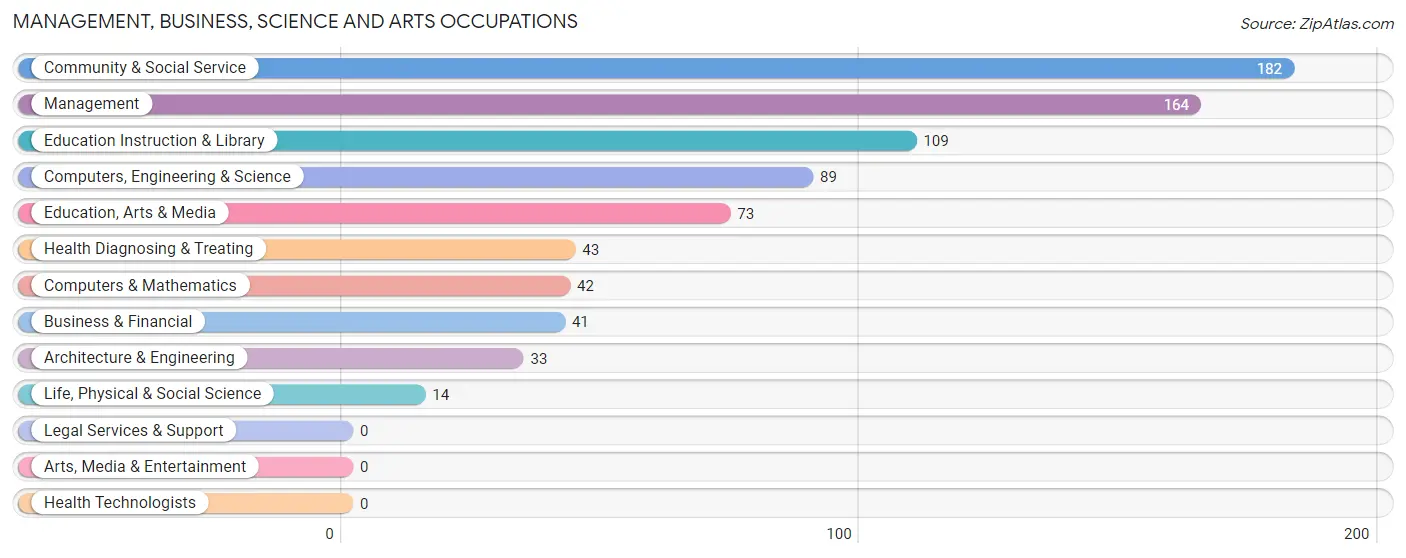
Management, Business, Science and Arts Occupations
The most common Management, Business, Science and Arts occupations in Shelbyville are Community & Social Service (182 | 8.3%), Management (164 | 7.4%), Education Instruction & Library (109 | 5.0%), Computers, Engineering & Science (89 | 4.0%), and Education, Arts & Media (73 | 3.3%).
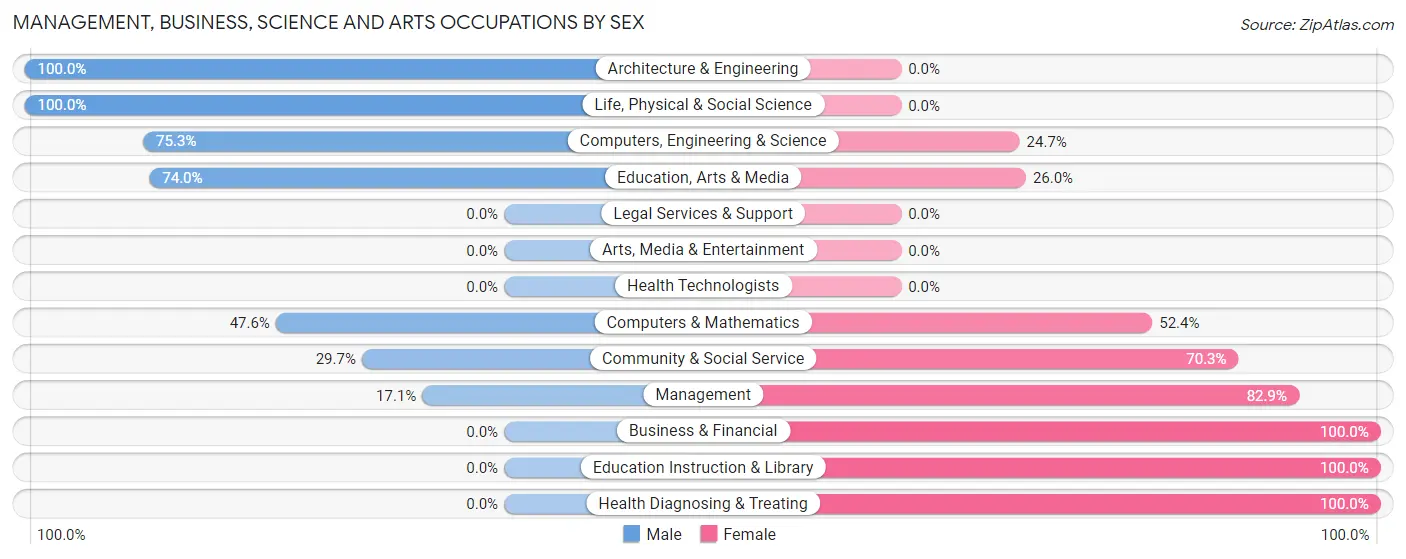
Management, Business, Science and Arts Occupations by Sex
Within the Management, Business, Science and Arts occupations in Shelbyville, the most male-oriented occupations are Architecture & Engineering (100.0%), Life, Physical & Social Science (100.0%), and Computers, Engineering & Science (75.3%), while the most female-oriented occupations are Business & Financial (100.0%), Education Instruction & Library (100.0%), and Health Diagnosing & Treating (100.0%).
| Occupation | Male | Female |
| Management | 28 (17.1%) | 136 (82.9%) |
| Business & Financial | 0 (0.0%) | 41 (100.0%) |
| Computers, Engineering & Science | 67 (75.3%) | 22 (24.7%) |
| Computers & Mathematics | 20 (47.6%) | 22 (52.4%) |
| Architecture & Engineering | 33 (100.0%) | 0 (0.0%) |
| Life, Physical & Social Science | 14 (100.0%) | 0 (0.0%) |
| Community & Social Service | 54 (29.7%) | 128 (70.3%) |
| Education, Arts & Media | 54 (74.0%) | 19 (26.0%) |
| Legal Services & Support | 0 (0.0%) | 0 (0.0%) |
| Education Instruction & Library | 0 (0.0%) | 109 (100.0%) |
| Arts, Media & Entertainment | 0 (0.0%) | 0 (0.0%) |
| Health Diagnosing & Treating | 0 (0.0%) | 43 (100.0%) |
| Health Technologists | 0 (0.0%) | 0 (0.0%) |
| Total (Category) | 149 (28.7%) | 370 (71.3%) |
| Total (Overall) | 984 (44.7%) | 1,219 (55.3%) |
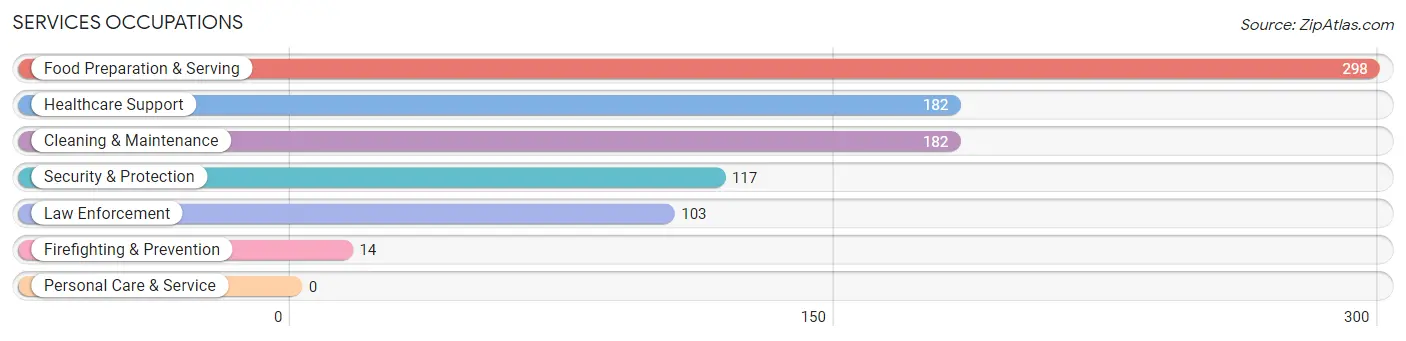
Services Occupations
The most common Services occupations in Shelbyville are Food Preparation & Serving (298 | 13.5%), Healthcare Support (182 | 8.3%), Cleaning & Maintenance (182 | 8.3%), Security & Protection (117 | 5.3%), and Law Enforcement (103 | 4.7%).
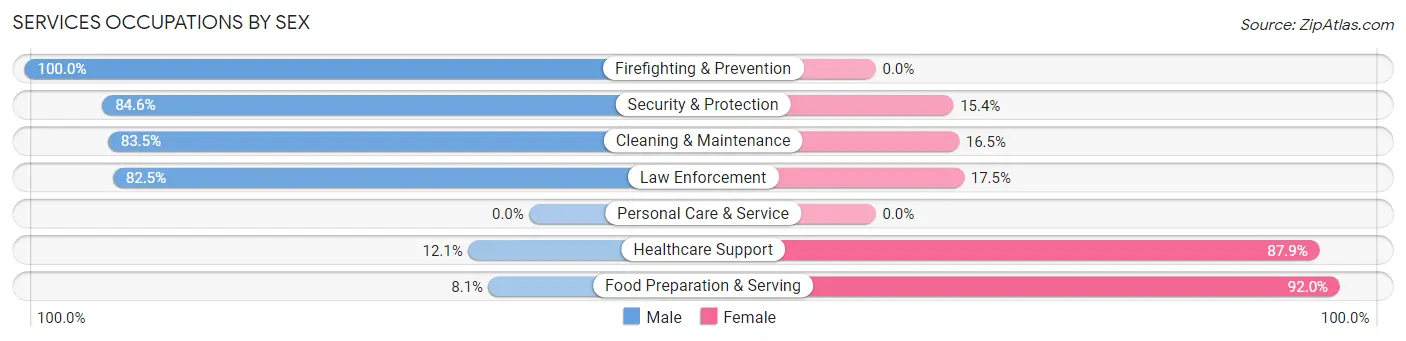
Services Occupations by Sex
Within the Services occupations in Shelbyville, the most male-oriented occupations are Firefighting & Prevention (100.0%), Security & Protection (84.6%), and Cleaning & Maintenance (83.5%), while the most female-oriented occupations are Food Preparation & Serving (91.9%), Healthcare Support (87.9%), and Law Enforcement (17.5%).
| Occupation | Male | Female |
| Healthcare Support | 22 (12.1%) | 160 (87.9%) |
| Security & Protection | 99 (84.6%) | 18 (15.4%) |
| Firefighting & Prevention | 14 (100.0%) | 0 (0.0%) |
| Law Enforcement | 85 (82.5%) | 18 (17.5%) |
| Food Preparation & Serving | 24 (8.1%) | 274 (91.9%) |
| Cleaning & Maintenance | 152 (83.5%) | 30 (16.5%) |
| Personal Care & Service | 0 (0.0%) | 0 (0.0%) |
| Total (Category) | 297 (38.1%) | 482 (61.9%) |
| Total (Overall) | 984 (44.7%) | 1,219 (55.3%) |
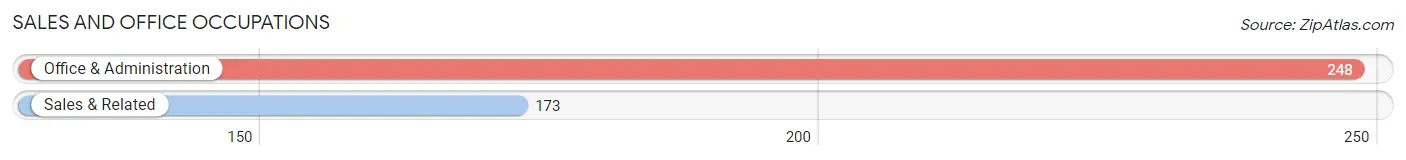
Sales and Office Occupations
The most common Sales and Office occupations in Shelbyville are Office & Administration (248 | 11.3%), and Sales & Related (173 | 7.9%).
Sales and Office Occupations by Sex
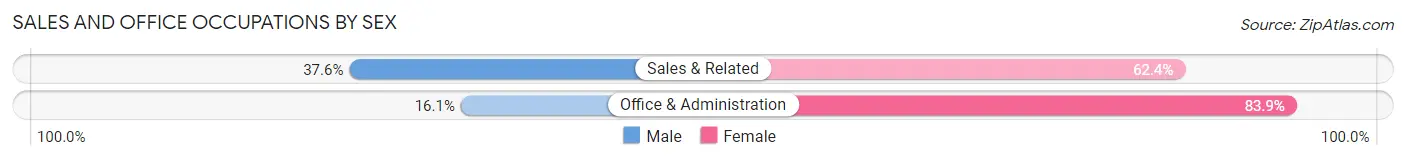
| Occupation | Male | Female |
| Sales & Related | 65 (37.6%) | 108 (62.4%) |
| Office & Administration | 40 (16.1%) | 208 (83.9%) |
| Total (Category) | 105 (24.9%) | 316 (75.1%) |
| Total (Overall) | 984 (44.7%) | 1,219 (55.3%) |
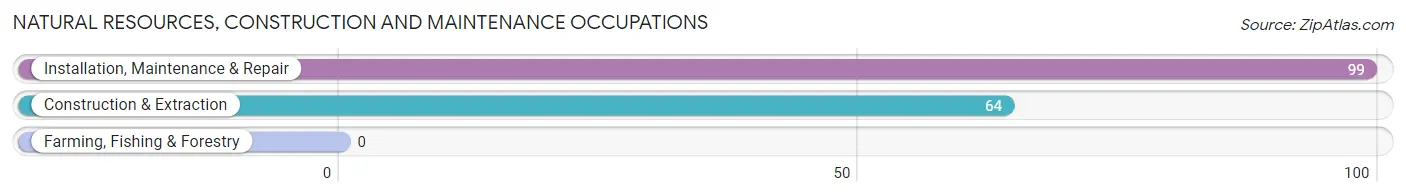
Natural Resources, Construction and Maintenance Occupations
The most common Natural Resources, Construction and Maintenance occupations in Shelbyville are Installation, Maintenance & Repair (99 | 4.5%), and Construction & Extraction (64 | 2.9%).
Natural Resources, Construction and Maintenance Occupations by Sex
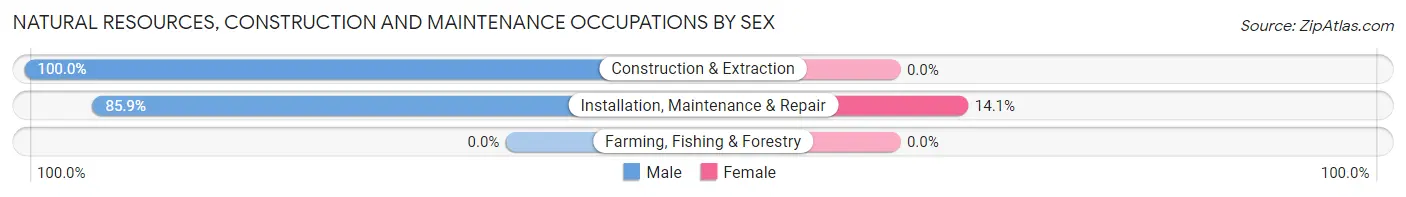
| Occupation | Male | Female |
| Farming, Fishing & Forestry | 0 (0.0%) | 0 (0.0%) |
| Construction & Extraction | 64 (100.0%) | 0 (0.0%) |
| Installation, Maintenance & Repair | 85 (85.9%) | 14 (14.1%) |
| Total (Category) | 149 (91.4%) | 14 (8.6%) |
| Total (Overall) | 984 (44.7%) | 1,219 (55.3%) |
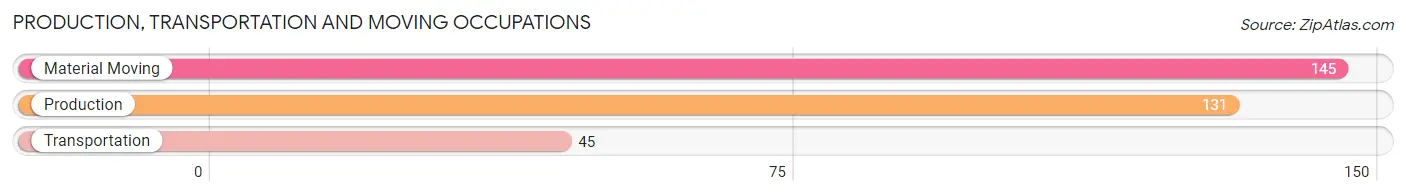
Production, Transportation and Moving Occupations
The most common Production, Transportation and Moving occupations in Shelbyville are Material Moving (145 | 6.6%), Production (131 | 5.9%), and Transportation (45 | 2.0%).
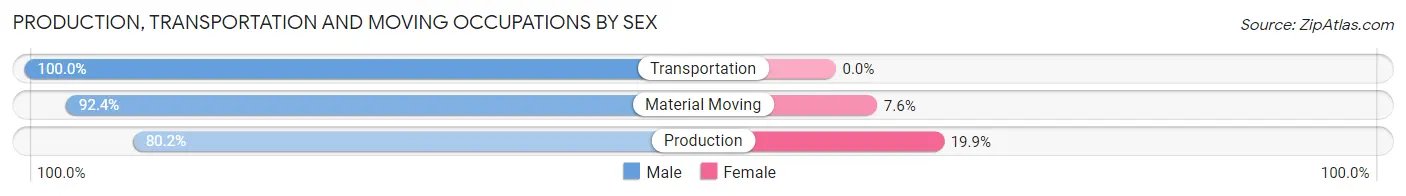
Production, Transportation and Moving Occupations by Sex
| Occupation | Male | Female |
| Production | 105 (80.1%) | 26 (19.9%) |
| Transportation | 45 (100.0%) | 0 (0.0%) |
| Material Moving | 134 (92.4%) | 11 (7.6%) |
| Total (Category) | 284 (88.5%) | 37 (11.5%) |
| Total (Overall) | 984 (44.7%) | 1,219 (55.3%) |
Employment Industries by Sex in Shelbyville
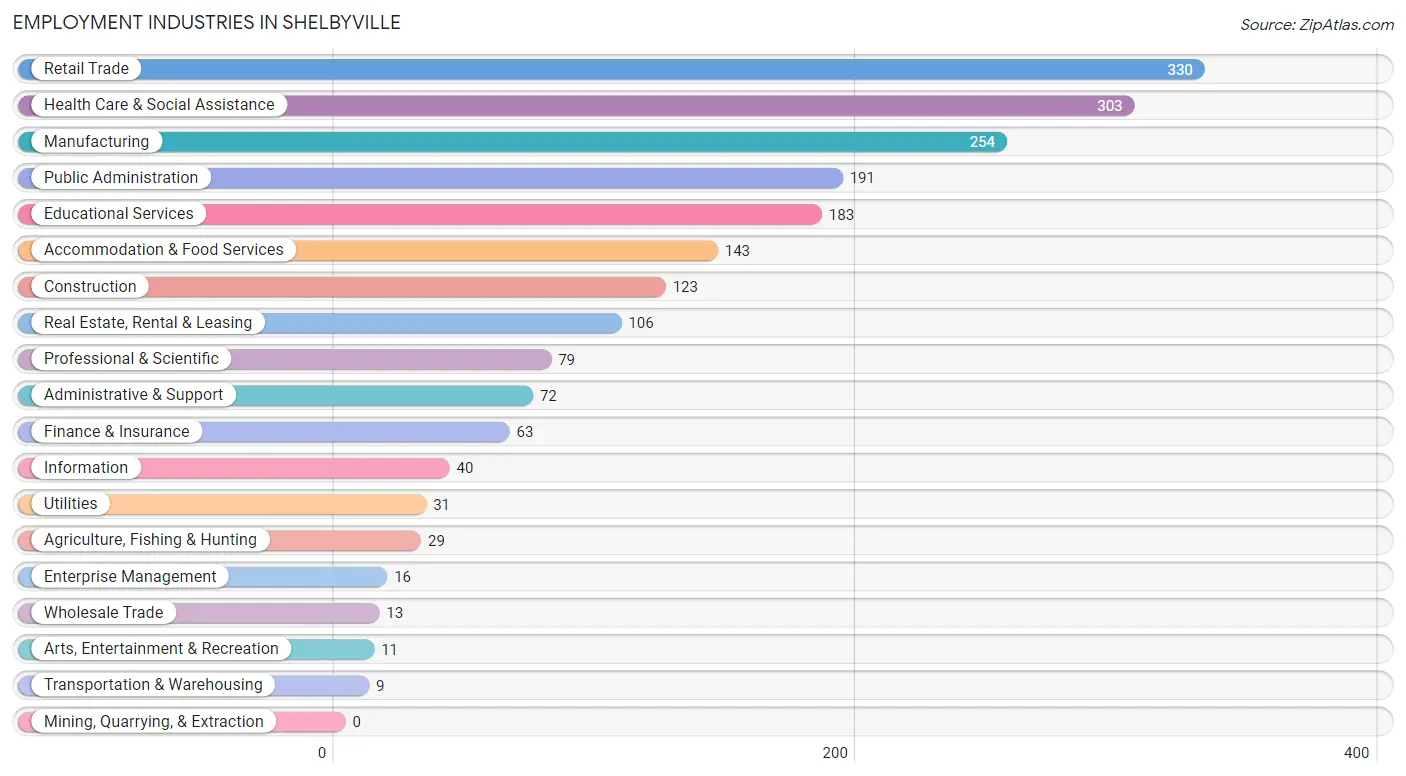
Employment Industries in Shelbyville
The major employment industries in Shelbyville include Retail Trade (330 | 15.0%), Health Care & Social Assistance (303 | 13.8%), Manufacturing (254 | 11.5%), Public Administration (191 | 8.7%), and Educational Services (183 | 8.3%).
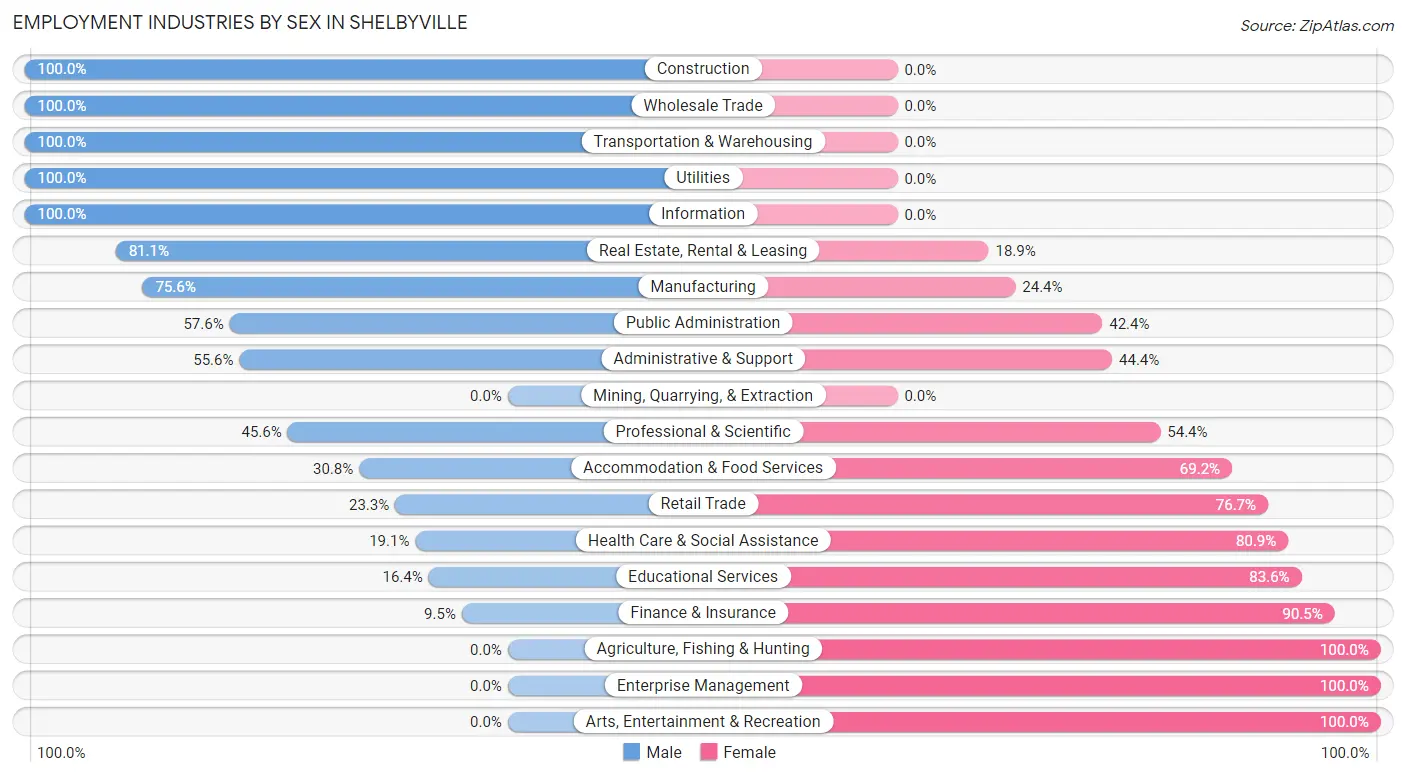
Employment Industries by Sex in Shelbyville
The Shelbyville industries that see more men than women are Construction (100.0%), Wholesale Trade (100.0%), and Transportation & Warehousing (100.0%), whereas the industries that tend to have a higher number of women are Agriculture, Fishing & Hunting (100.0%), Enterprise Management (100.0%), and Arts, Entertainment & Recreation (100.0%).
| Industry | Male | Female |
| Agriculture, Fishing & Hunting | 0 (0.0%) | 29 (100.0%) |
| Mining, Quarrying, & Extraction | 0 (0.0%) | 0 (0.0%) |
| Construction | 123 (100.0%) | 0 (0.0%) |
| Manufacturing | 192 (75.6%) | 62 (24.4%) |
| Wholesale Trade | 13 (100.0%) | 0 (0.0%) |
| Retail Trade | 77 (23.3%) | 253 (76.7%) |
| Transportation & Warehousing | 9 (100.0%) | 0 (0.0%) |
| Utilities | 31 (100.0%) | 0 (0.0%) |
| Information | 40 (100.0%) | 0 (0.0%) |
| Finance & Insurance | 6 (9.5%) | 57 (90.5%) |
| Real Estate, Rental & Leasing | 86 (81.1%) | 20 (18.9%) |
| Professional & Scientific | 36 (45.6%) | 43 (54.4%) |
| Enterprise Management | 0 (0.0%) | 16 (100.0%) |
| Administrative & Support | 40 (55.6%) | 32 (44.4%) |
| Educational Services | 30 (16.4%) | 153 (83.6%) |
| Health Care & Social Assistance | 58 (19.1%) | 245 (80.9%) |
| Arts, Entertainment & Recreation | 0 (0.0%) | 11 (100.0%) |
| Accommodation & Food Services | 44 (30.8%) | 99 (69.2%) |
| Public Administration | 110 (57.6%) | 81 (42.4%) |
| Total | 984 (44.7%) | 1,219 (55.3%) |
Education in Shelbyville
School Enrollment in Shelbyville
The most common levels of schooling among the 718 students in Shelbyville are high school (203 | 28.3%), middle school (162 | 22.6%), and elementary school (143 | 19.9%).
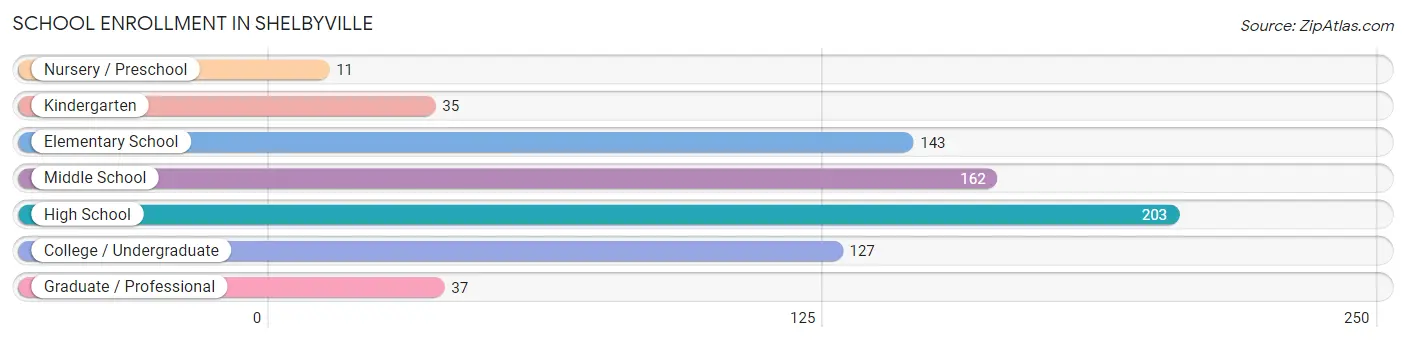
| School Level | # Students | % Students |
| Nursery / Preschool | 11 | 1.5% |
| Kindergarten | 35 | 4.9% |
| Elementary School | 143 | 19.9% |
| Middle School | 162 | 22.6% |
| High School | 203 | 28.3% |
| College / Undergraduate | 127 | 17.7% |
| Graduate / Professional | 37 | 5.1% |
| Total | 718 | 100.0% |
School Enrollment by Age by Funding Source in Shelbyville
Out of a total of 718 students who are enrolled in schools in Shelbyville, 51 (7.1%) attend a private institution, while the remaining 667 (92.9%) are enrolled in public schools. The age group of 5 to 9 year old has the highest likelihood of being enrolled in private schools, with 21 (11.1% in the age bracket) enrolled. Conversely, the age group of 18 to 19 year olds has the lowest likelihood of being enrolled in a private school, with 62 (100.0% in the age bracket) attending a public institution.
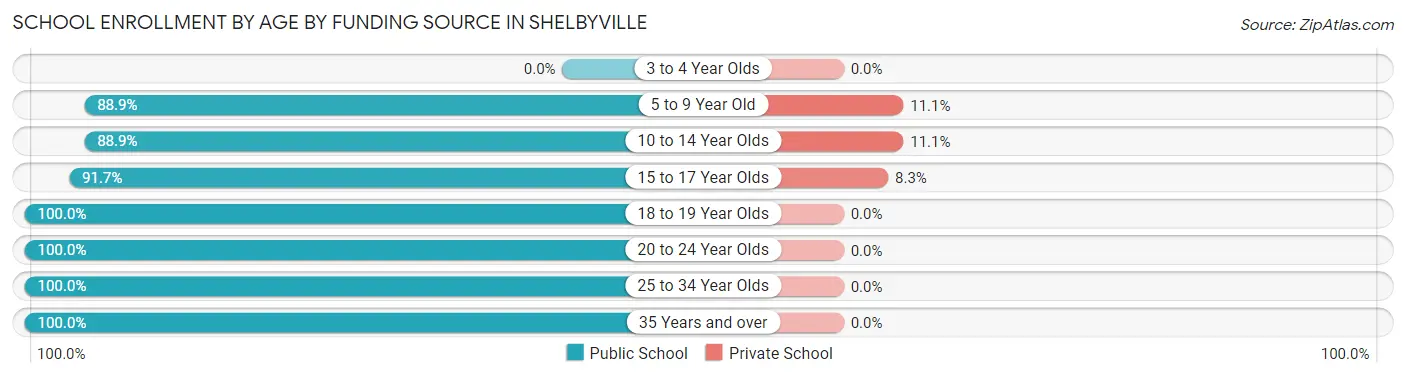
| Age Bracket | Public School | Private School |
| 3 to 4 Year Olds | 0 (0.0%) | 0 (0.0%) |
| 5 to 9 Year Old | 168 (88.9%) | 21 (11.1%) |
| 10 to 14 Year Olds | 144 (88.9%) | 18 (11.1%) |
| 15 to 17 Year Olds | 133 (91.7%) | 12 (8.3%) |
| 18 to 19 Year Olds | 62 (100.0%) | 0 (0.0%) |
| 20 to 24 Year Olds | 110 (100.0%) | 0 (0.0%) |
| 25 to 34 Year Olds | 40 (100.0%) | 0 (0.0%) |
| 35 Years and over | 10 (100.0%) | 0 (0.0%) |
| Total | 667 (92.9%) | 51 (7.1%) |
Educational Attainment by Field of Study in Shelbyville
Business (95 | 16.2%), liberal arts & history (90 | 15.4%), literature & languages (67 | 11.5%), education (59 | 10.1%), and computers & mathematics (50 | 8.6%) are the most common fields of study among 585 individuals in Shelbyville who have obtained a bachelor's degree or higher.
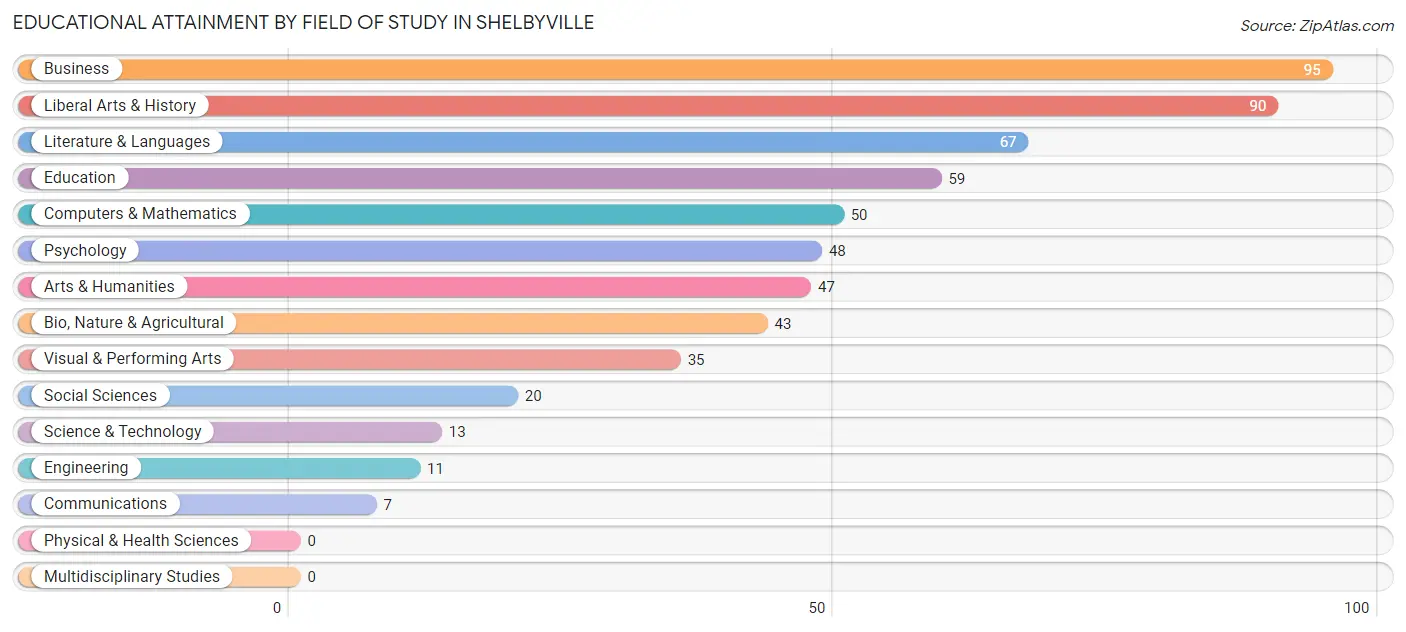
| Field of Study | # Graduates | % Graduates |
| Computers & Mathematics | 50 | 8.6% |
| Bio, Nature & Agricultural | 43 | 7.3% |
| Physical & Health Sciences | 0 | 0.0% |
| Psychology | 48 | 8.2% |
| Social Sciences | 20 | 3.4% |
| Engineering | 11 | 1.9% |
| Multidisciplinary Studies | 0 | 0.0% |
| Science & Technology | 13 | 2.2% |
| Business | 95 | 16.2% |
| Education | 59 | 10.1% |
| Literature & Languages | 67 | 11.5% |
| Liberal Arts & History | 90 | 15.4% |
| Visual & Performing Arts | 35 | 6.0% |
| Communications | 7 | 1.2% |
| Arts & Humanities | 47 | 8.0% |
| Total | 585 | 100.0% |
Transportation & Commute in Shelbyville
Vehicle Availability by Sex in Shelbyville
The most prevalent vehicle ownership categories in Shelbyville are males with 2 vehicles (486, accounting for 49.8%) and females with 2 vehicles (455, making up 40.1%).
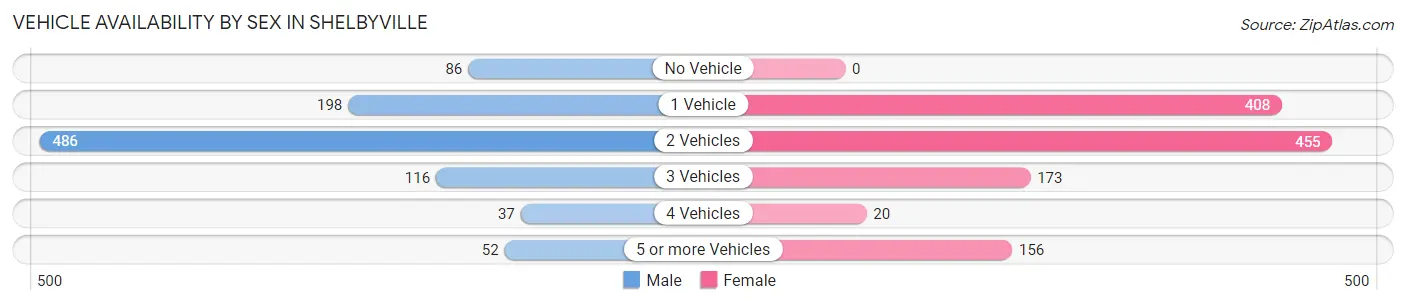
| Vehicles Available | Male | Female |
| No Vehicle | 86 (8.8%) | 0 (0.0%) |
| 1 Vehicle | 198 (20.3%) | 408 (33.7%) |
| 2 Vehicles | 486 (49.8%) | 455 (37.5%) |
| 3 Vehicles | 116 (11.9%) | 173 (14.3%) |
| 4 Vehicles | 37 (3.8%) | 20 (1.7%) |
| 5 or more Vehicles | 52 (5.3%) | 156 (12.9%) |
| Total | 975 (100.0%) | 1,212 (100.0%) |
Commute Time in Shelbyville
The most frequently occuring commute durations in Shelbyville are 5 to 9 minutes (656 commuters, 31.2%), less than 5 minutes (476 commuters, 22.7%), and 10 to 14 minutes (449 commuters, 21.4%).
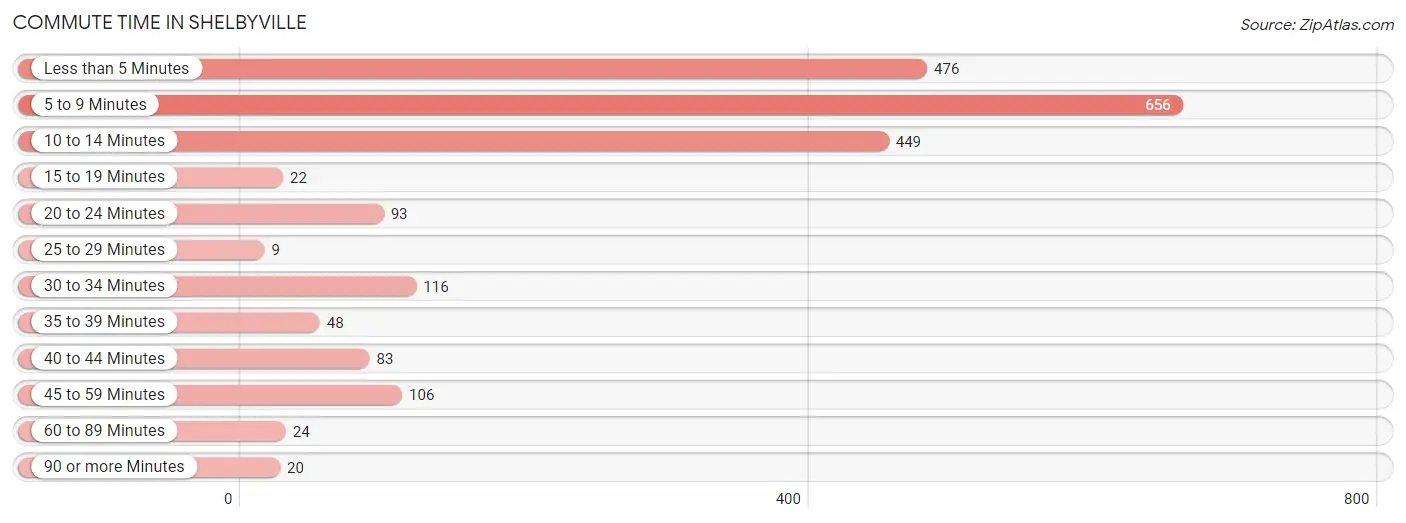
| Commute Time | # Commuters | % Commuters |
| Less than 5 Minutes | 476 | 22.7% |
| 5 to 9 Minutes | 656 | 31.2% |
| 10 to 14 Minutes | 449 | 21.4% |
| 15 to 19 Minutes | 22 | 1.1% |
| 20 to 24 Minutes | 93 | 4.4% |
| 25 to 29 Minutes | 9 | 0.4% |
| 30 to 34 Minutes | 116 | 5.5% |
| 35 to 39 Minutes | 48 | 2.3% |
| 40 to 44 Minutes | 83 | 4.0% |
| 45 to 59 Minutes | 106 | 5.0% |
| 60 to 89 Minutes | 24 | 1.1% |
| 90 or more Minutes | 20 | 0.9% |
Commute Time by Sex in Shelbyville
The most common commute times in Shelbyville are 5 to 9 minutes (282 commuters, 28.7%) for males and 5 to 9 minutes (374 commuters, 33.5%) for females.
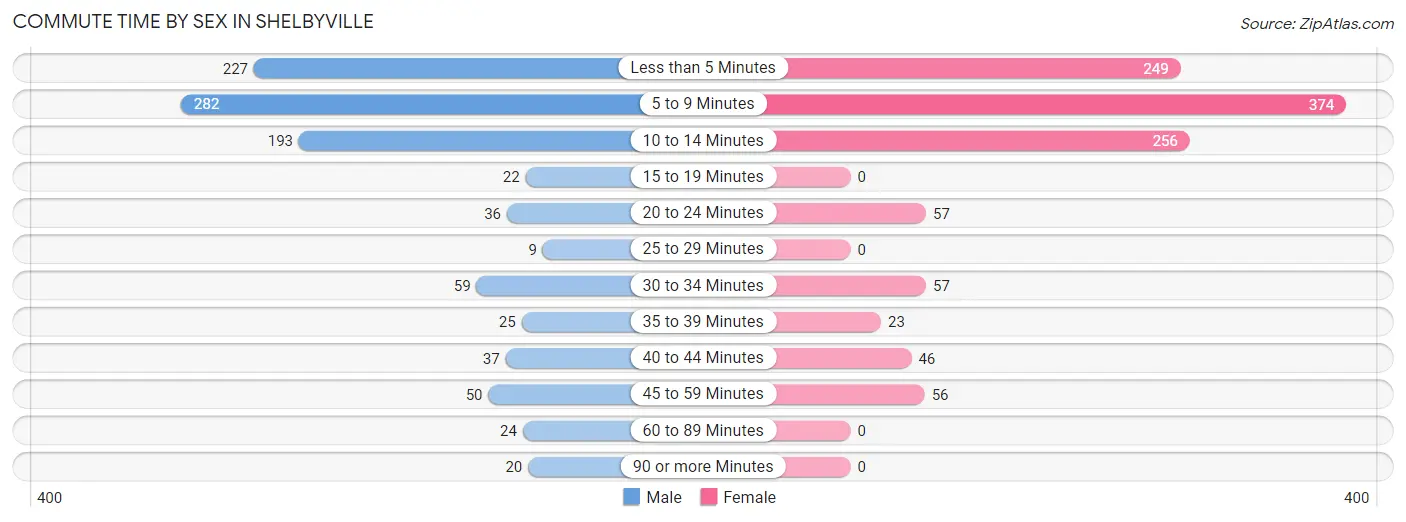
| Commute Time | Male | Female |
| Less than 5 Minutes | 227 (23.1%) | 249 (22.3%) |
| 5 to 9 Minutes | 282 (28.7%) | 374 (33.5%) |
| 10 to 14 Minutes | 193 (19.6%) | 256 (22.9%) |
| 15 to 19 Minutes | 22 (2.2%) | 0 (0.0%) |
| 20 to 24 Minutes | 36 (3.7%) | 57 (5.1%) |
| 25 to 29 Minutes | 9 (0.9%) | 0 (0.0%) |
| 30 to 34 Minutes | 59 (6.0%) | 57 (5.1%) |
| 35 to 39 Minutes | 25 (2.5%) | 23 (2.1%) |
| 40 to 44 Minutes | 37 (3.8%) | 46 (4.1%) |
| 45 to 59 Minutes | 50 (5.1%) | 56 (5.0%) |
| 60 to 89 Minutes | 24 (2.4%) | 0 (0.0%) |
| 90 or more Minutes | 20 (2.0%) | 0 (0.0%) |
Time of Departure to Work by Sex in Shelbyville
The most frequent times of departure to work in Shelbyville are 7:00 AM to 7:29 AM (174, 17.7%) for males and 8:00 AM to 8:29 AM (164, 14.7%) for females.
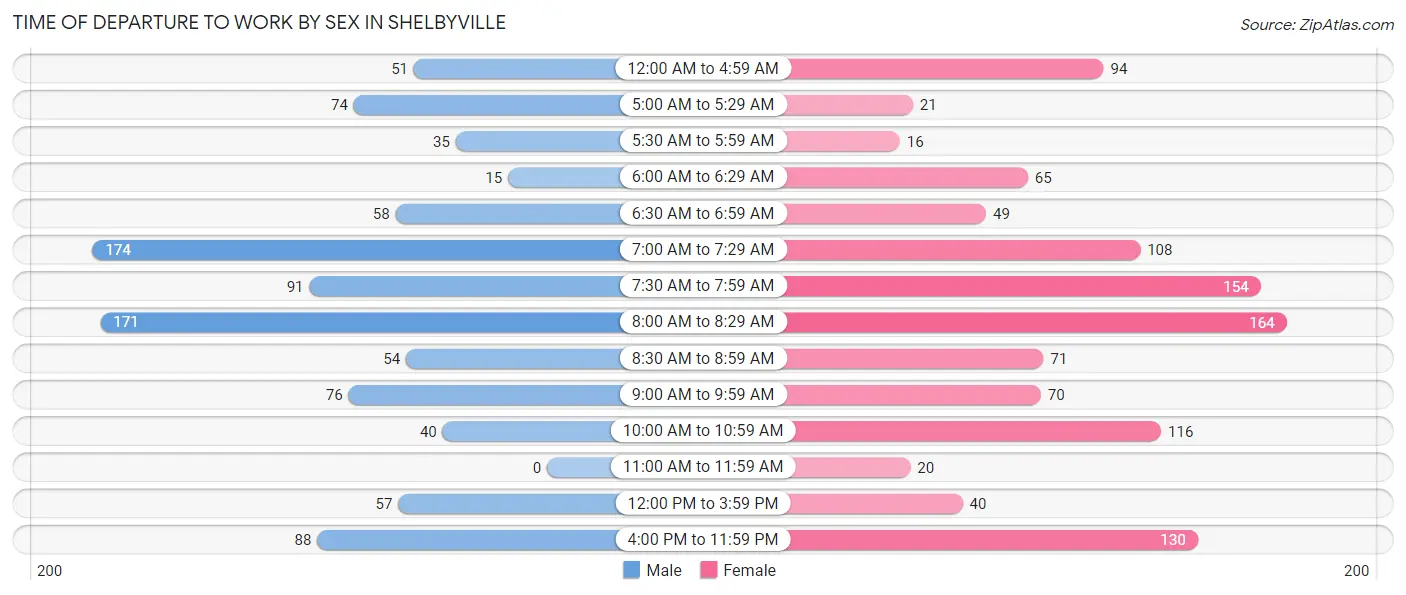
| Time of Departure | Male | Female |
| 12:00 AM to 4:59 AM | 51 (5.2%) | 94 (8.4%) |
| 5:00 AM to 5:29 AM | 74 (7.5%) | 21 (1.9%) |
| 5:30 AM to 5:59 AM | 35 (3.6%) | 16 (1.4%) |
| 6:00 AM to 6:29 AM | 15 (1.5%) | 65 (5.8%) |
| 6:30 AM to 6:59 AM | 58 (5.9%) | 49 (4.4%) |
| 7:00 AM to 7:29 AM | 174 (17.7%) | 108 (9.7%) |
| 7:30 AM to 7:59 AM | 91 (9.2%) | 154 (13.8%) |
| 8:00 AM to 8:29 AM | 171 (17.4%) | 164 (14.7%) |
| 8:30 AM to 8:59 AM | 54 (5.5%) | 71 (6.4%) |
| 9:00 AM to 9:59 AM | 76 (7.7%) | 70 (6.3%) |
| 10:00 AM to 10:59 AM | 40 (4.1%) | 116 (10.4%) |
| 11:00 AM to 11:59 AM | 0 (0.0%) | 20 (1.8%) |
| 12:00 PM to 3:59 PM | 57 (5.8%) | 40 (3.6%) |
| 4:00 PM to 11:59 PM | 88 (8.9%) | 130 (11.6%) |
| Total | 984 (100.0%) | 1,118 (100.0%) |
Housing Occupancy in Shelbyville
Occupancy by Ownership in Shelbyville
Of the total 2,001 dwellings in Shelbyville, owner-occupied units account for 1,220 (61.0%), while renter-occupied units make up 781 (39.0%).
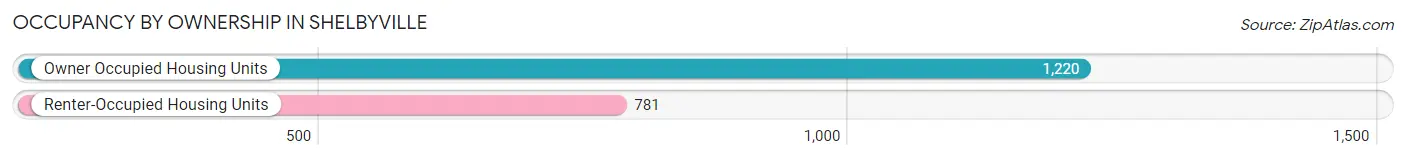
| Occupancy | # Housing Units | % Housing Units |
| Owner Occupied Housing Units | 1,220 | 61.0% |
| Renter-Occupied Housing Units | 781 | 39.0% |
| Total Occupied Housing Units | 2,001 | 100.0% |
Occupancy by Household Size in Shelbyville
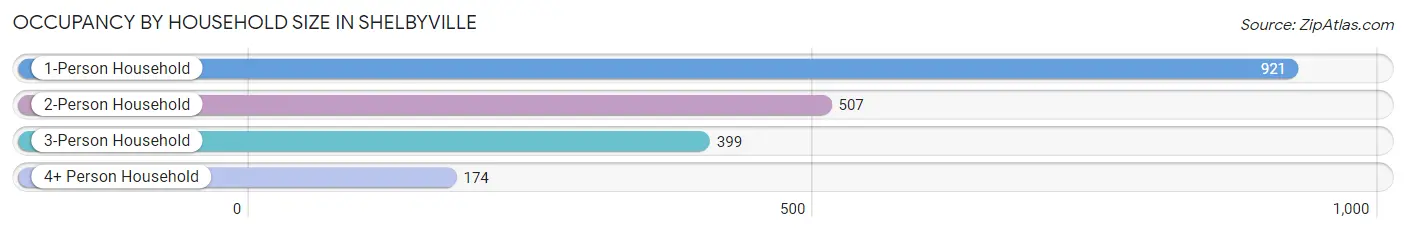
| Household Size | # Housing Units | % Housing Units |
| 1-Person Household | 921 | 46.0% |
| 2-Person Household | 507 | 25.3% |
| 3-Person Household | 399 | 19.9% |
| 4+ Person Household | 174 | 8.7% |
| Total Housing Units | 2,001 | 100.0% |
Occupancy by Ownership by Household Size in Shelbyville
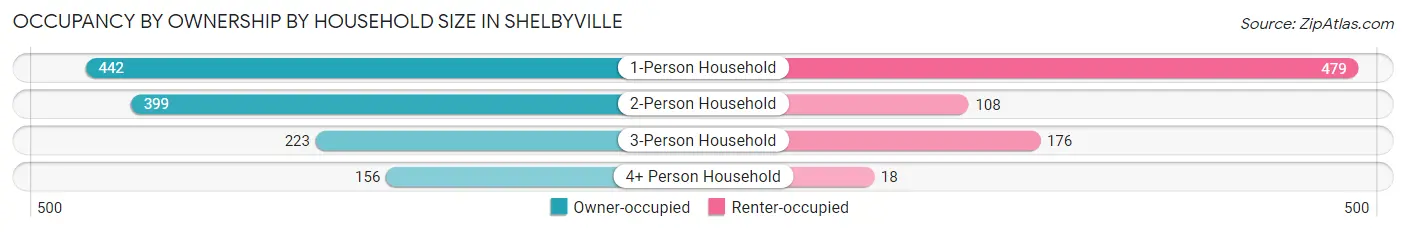
| Household Size | Owner-occupied | Renter-occupied |
| 1-Person Household | 442 (48.0%) | 479 (52.0%) |
| 2-Person Household | 399 (78.7%) | 108 (21.3%) |
| 3-Person Household | 223 (55.9%) | 176 (44.1%) |
| 4+ Person Household | 156 (89.7%) | 18 (10.3%) |
| Total Housing Units | 1,220 (61.0%) | 781 (39.0%) |
Occupancy by Educational Attainment in Shelbyville
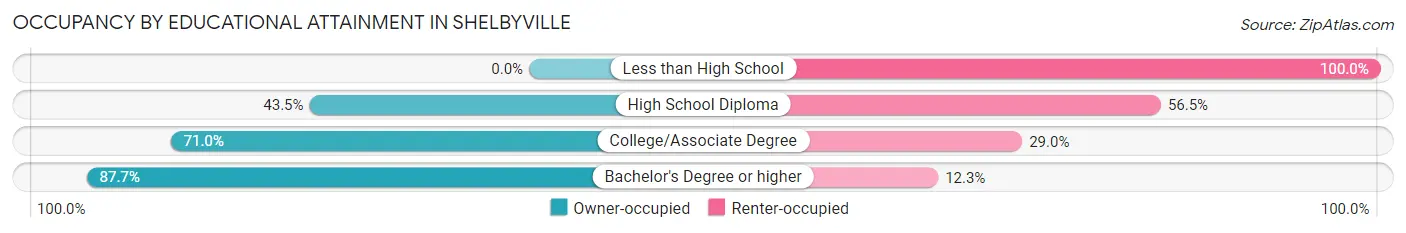
| Household Size | Owner-occupied | Renter-occupied |
| Less than High School | 0 (0.0%) | 85 (100.0%) |
| High School Diploma | 320 (43.5%) | 415 (56.5%) |
| College/Associate Degree | 579 (71.0%) | 236 (29.0%) |
| Bachelor's Degree or higher | 321 (87.7%) | 45 (12.3%) |
Occupancy by Age of Householder in Shelbyville
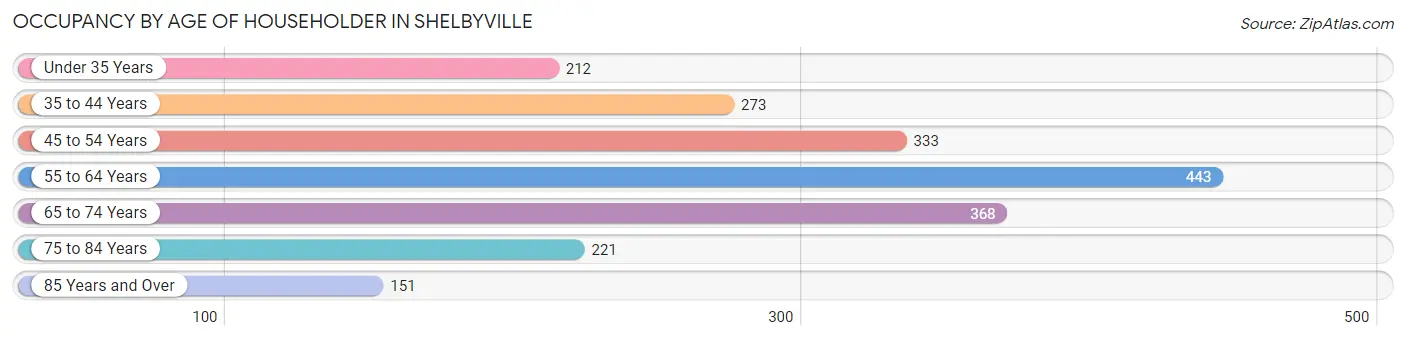
| Age Bracket | # Households | % Households |
| Under 35 Years | 212 | 10.6% |
| 35 to 44 Years | 273 | 13.6% |
| 45 to 54 Years | 333 | 16.6% |
| 55 to 64 Years | 443 | 22.1% |
| 65 to 74 Years | 368 | 18.4% |
| 75 to 84 Years | 221 | 11.0% |
| 85 Years and Over | 151 | 7.5% |
| Total | 2,001 | 100.0% |
Housing Finances in Shelbyville
Median Income by Occupancy in Shelbyville
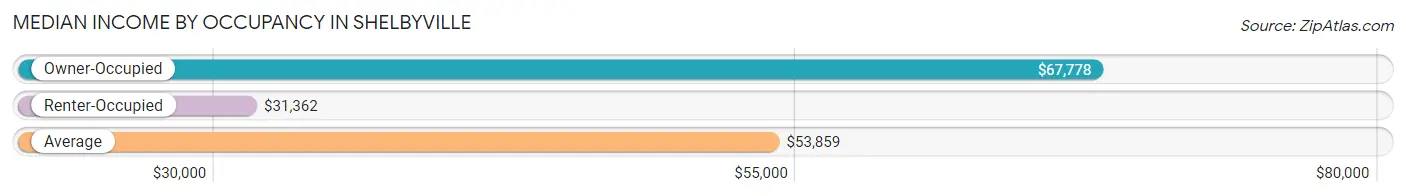
| Occupancy Type | # Households | Median Income |
| Owner-Occupied | 1,220 (61.0%) | $67,778 |
| Renter-Occupied | 781 (39.0%) | $31,362 |
| Average | 2,001 (100.0%) | $53,859 |
Occupancy by Householder Income Bracket in Shelbyville
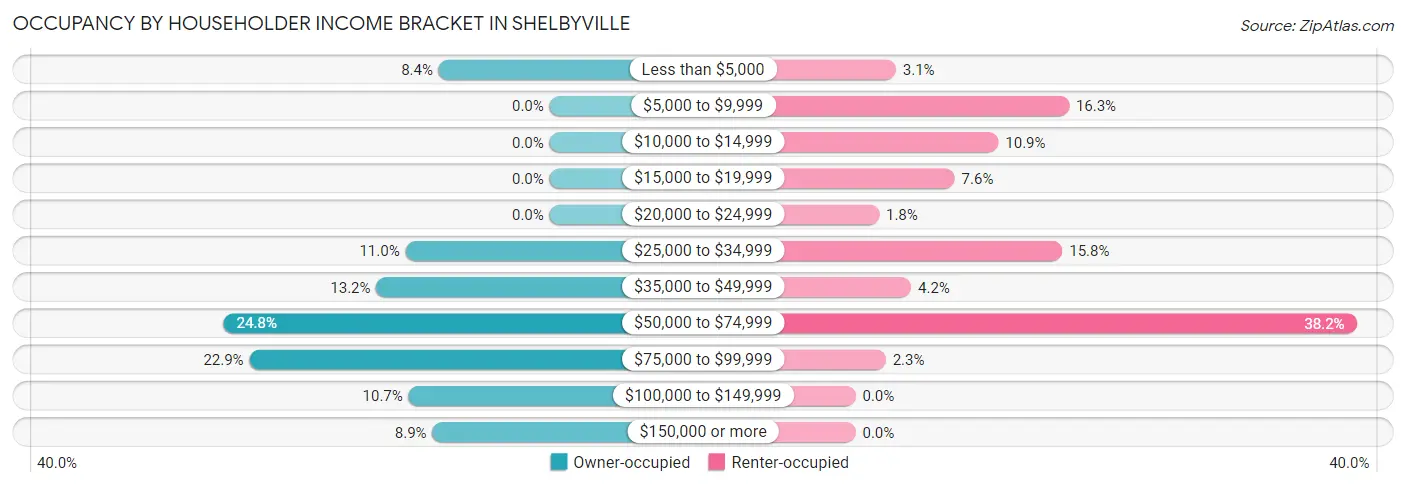
| Income Bracket | Owner-occupied | Renter-occupied |
| Less than $5,000 | 103 (8.4%) | 24 (3.1%) |
| $5,000 to $9,999 | 0 (0.0%) | 127 (16.3%) |
| $10,000 to $14,999 | 0 (0.0%) | 85 (10.9%) |
| $15,000 to $19,999 | 0 (0.0%) | 59 (7.5%) |
| $20,000 to $24,999 | 0 (0.0%) | 14 (1.8%) |
| $25,000 to $34,999 | 134 (11.0%) | 123 (15.8%) |
| $35,000 to $49,999 | 161 (13.2%) | 33 (4.2%) |
| $50,000 to $74,999 | 303 (24.8%) | 298 (38.2%) |
| $75,000 to $99,999 | 279 (22.9%) | 18 (2.3%) |
| $100,000 to $149,999 | 131 (10.7%) | 0 (0.0%) |
| $150,000 or more | 109 (8.9%) | 0 (0.0%) |
| Total | 1,220 (100.0%) | 781 (100.0%) |
Monthly Housing Cost Tiers in Shelbyville
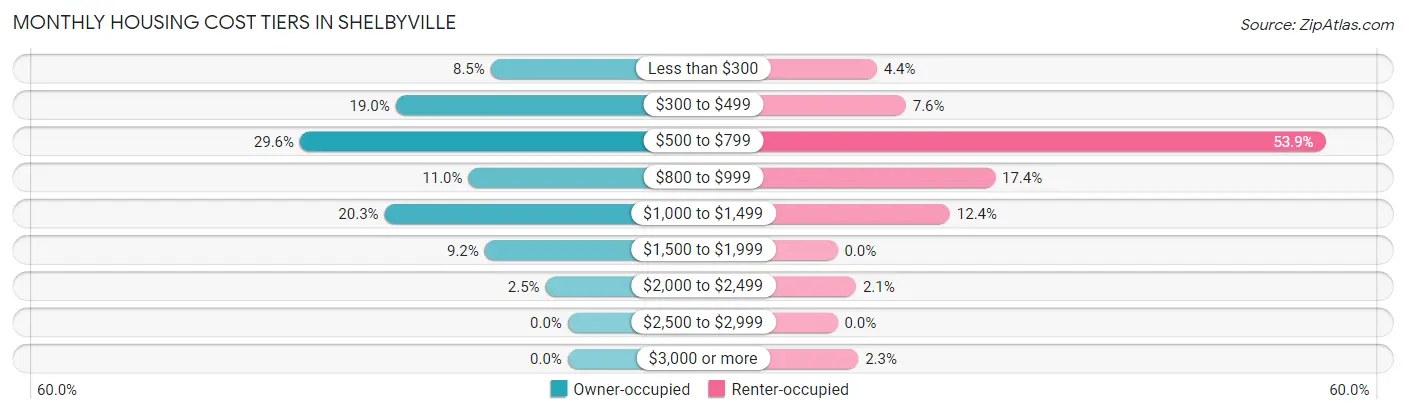
| Monthly Cost | Owner-occupied | Renter-occupied |
| Less than $300 | 104 (8.5%) | 34 (4.3%) |
| $300 to $499 | 232 (19.0%) | 59 (7.5%) |
| $500 to $799 | 361 (29.6%) | 421 (53.9%) |
| $800 to $999 | 134 (11.0%) | 136 (17.4%) |
| $1,000 to $1,499 | 247 (20.3%) | 97 (12.4%) |
| $1,500 to $1,999 | 112 (9.2%) | 0 (0.0%) |
| $2,000 to $2,499 | 30 (2.5%) | 16 (2.1%) |
| $2,500 to $2,999 | 0 (0.0%) | 0 (0.0%) |
| $3,000 or more | 0 (0.0%) | 18 (2.3%) |
| Total | 1,220 (100.0%) | 781 (100.0%) |
Physical Housing Characteristics in Shelbyville
Housing Structures in Shelbyville
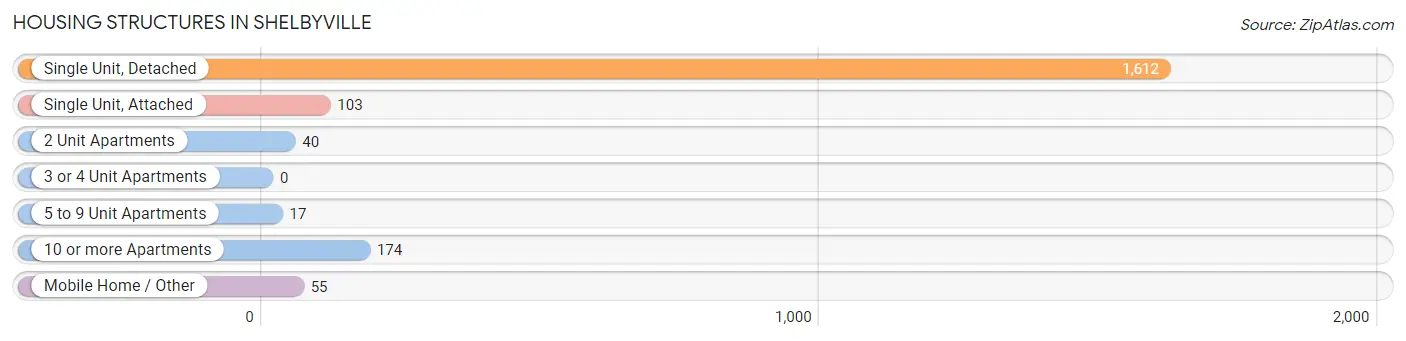
| Structure Type | # Housing Units | % Housing Units |
| Single Unit, Detached | 1,612 | 80.6% |
| Single Unit, Attached | 103 | 5.1% |
| 2 Unit Apartments | 40 | 2.0% |
| 3 or 4 Unit Apartments | 0 | 0.0% |
| 5 to 9 Unit Apartments | 17 | 0.9% |
| 10 or more Apartments | 174 | 8.7% |
| Mobile Home / Other | 55 | 2.8% |
| Total | 2,001 | 100.0% |
Housing Structures by Occupancy in Shelbyville
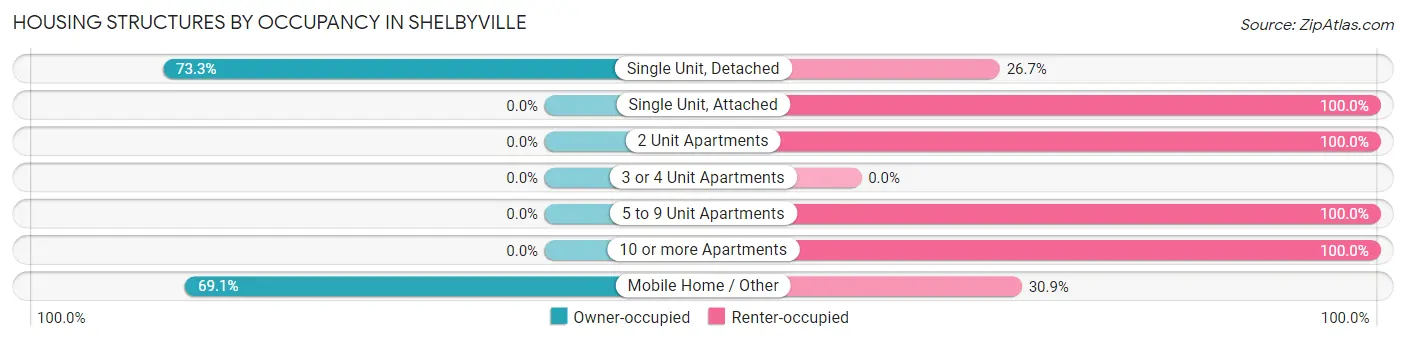
| Structure Type | Owner-occupied | Renter-occupied |
| Single Unit, Detached | 1,182 (73.3%) | 430 (26.7%) |
| Single Unit, Attached | 0 (0.0%) | 103 (100.0%) |
| 2 Unit Apartments | 0 (0.0%) | 40 (100.0%) |
| 3 or 4 Unit Apartments | 0 (0.0%) | 0 (0.0%) |
| 5 to 9 Unit Apartments | 0 (0.0%) | 17 (100.0%) |
| 10 or more Apartments | 0 (0.0%) | 174 (100.0%) |
| Mobile Home / Other | 38 (69.1%) | 17 (30.9%) |
| Total | 1,220 (61.0%) | 781 (39.0%) |
Housing Structures by Number of Rooms in Shelbyville
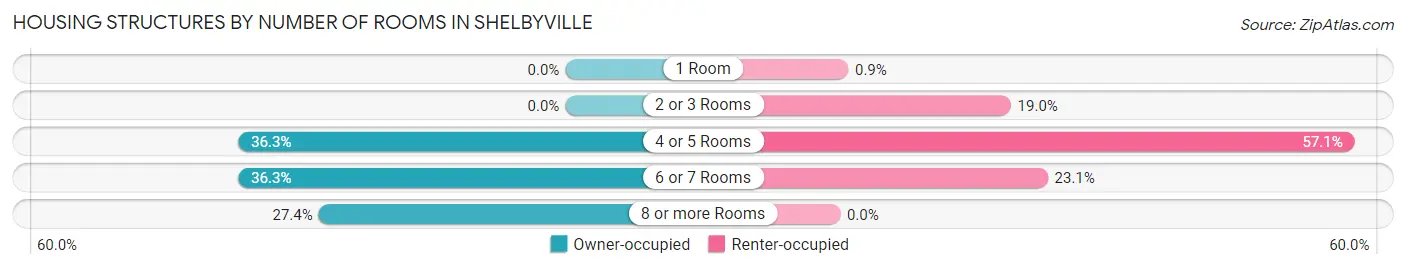
| Number of Rooms | Owner-occupied | Renter-occupied |
| 1 Room | 0 (0.0%) | 7 (0.9%) |
| 2 or 3 Rooms | 0 (0.0%) | 148 (19.0%) |
| 4 or 5 Rooms | 443 (36.3%) | 446 (57.1%) |
| 6 or 7 Rooms | 443 (36.3%) | 180 (23.1%) |
| 8 or more Rooms | 334 (27.4%) | 0 (0.0%) |
| Total | 1,220 (100.0%) | 781 (100.0%) |
Housing Structure by Heating Type in Shelbyville
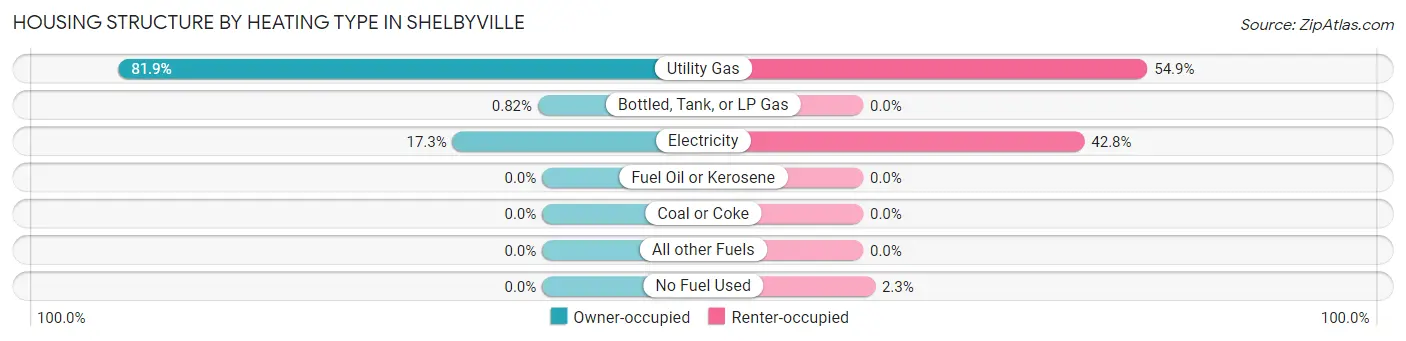
| Heating Type | Owner-occupied | Renter-occupied |
| Utility Gas | 999 (81.9%) | 429 (54.9%) |
| Bottled, Tank, or LP Gas | 10 (0.8%) | 0 (0.0%) |
| Electricity | 211 (17.3%) | 334 (42.8%) |
| Fuel Oil or Kerosene | 0 (0.0%) | 0 (0.0%) |
| Coal or Coke | 0 (0.0%) | 0 (0.0%) |
| All other Fuels | 0 (0.0%) | 0 (0.0%) |
| No Fuel Used | 0 (0.0%) | 18 (2.3%) |
| Total | 1,220 (100.0%) | 781 (100.0%) |
Household Vehicle Usage in Shelbyville
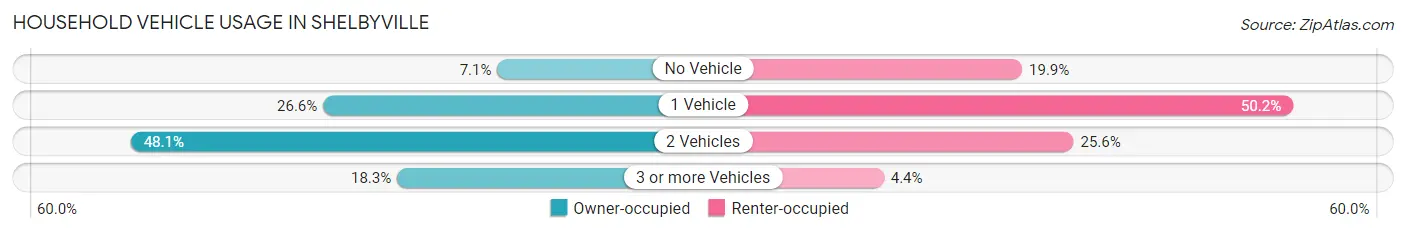
| Vehicles per Household | Owner-occupied | Renter-occupied |
| No Vehicle | 86 (7.0%) | 155 (19.9%) |
| 1 Vehicle | 324 (26.6%) | 392 (50.2%) |
| 2 Vehicles | 587 (48.1%) | 200 (25.6%) |
| 3 or more Vehicles | 223 (18.3%) | 34 (4.3%) |
| Total | 1,220 (100.0%) | 781 (100.0%) |
Real Estate & Mortgages in Shelbyville
Real Estate and Mortgage Overview in Shelbyville
| Characteristic | Without Mortgage | With Mortgage |
| Housing Units | 560 | 660 |
| Median Property Value | $78,800 | $120,700 |
| Median Household Income | $58,000 | $39 |
| Monthly Housing Costs | $454 | $0 |
| Real Estate Taxes | $1,754 | $13 |
Property Value by Mortgage Status in Shelbyville
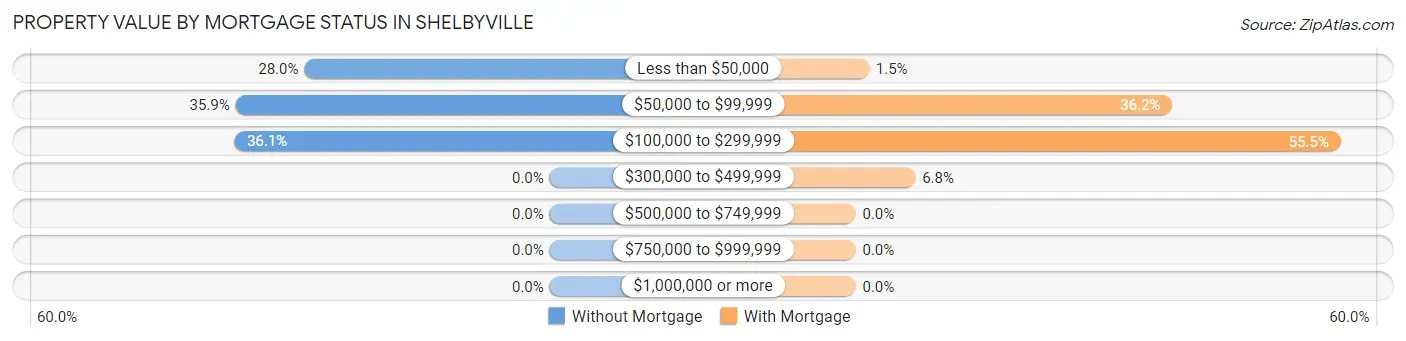
| Property Value | Without Mortgage | With Mortgage |
| Less than $50,000 | 157 (28.0%) | 10 (1.5%) |
| $50,000 to $99,999 | 201 (35.9%) | 239 (36.2%) |
| $100,000 to $299,999 | 202 (36.1%) | 366 (55.4%) |
| $300,000 to $499,999 | 0 (0.0%) | 45 (6.8%) |
| $500,000 to $749,999 | 0 (0.0%) | 0 (0.0%) |
| $750,000 to $999,999 | 0 (0.0%) | 0 (0.0%) |
| $1,000,000 or more | 0 (0.0%) | 0 (0.0%) |
| Total | 560 (100.0%) | 660 (100.0%) |
Household Income by Mortgage Status in Shelbyville
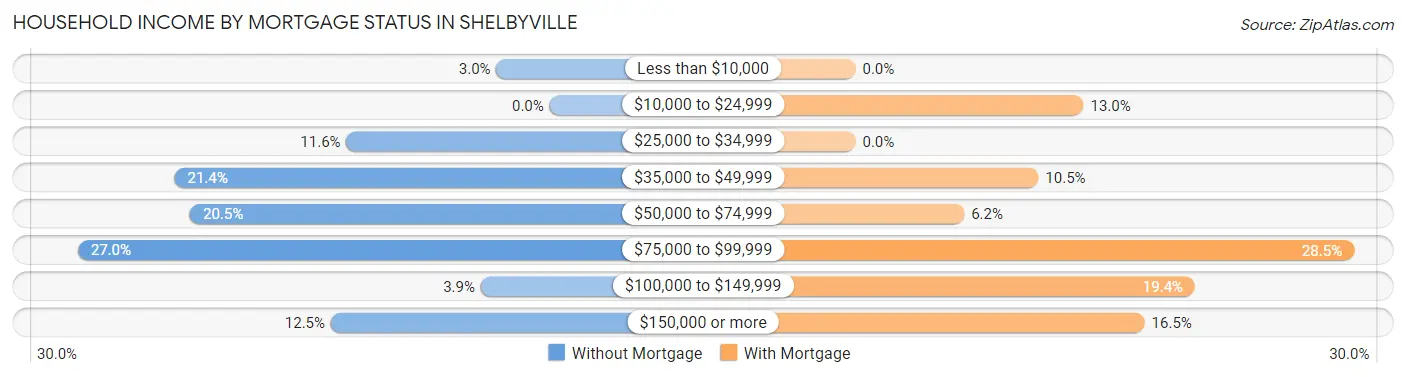
| Household Income | Without Mortgage | With Mortgage |
| Less than $10,000 | 17 (3.0%) | 0 (0.0%) |
| $10,000 to $24,999 | 0 (0.0%) | 86 (13.0%) |
| $25,000 to $34,999 | 65 (11.6%) | 0 (0.0%) |
| $35,000 to $49,999 | 120 (21.4%) | 69 (10.4%) |
| $50,000 to $74,999 | 115 (20.5%) | 41 (6.2%) |
| $75,000 to $99,999 | 151 (27.0%) | 188 (28.5%) |
| $100,000 to $149,999 | 22 (3.9%) | 128 (19.4%) |
| $150,000 or more | 70 (12.5%) | 109 (16.5%) |
| Total | 560 (100.0%) | 660 (100.0%) |
Property Value to Household Income Ratio in Shelbyville
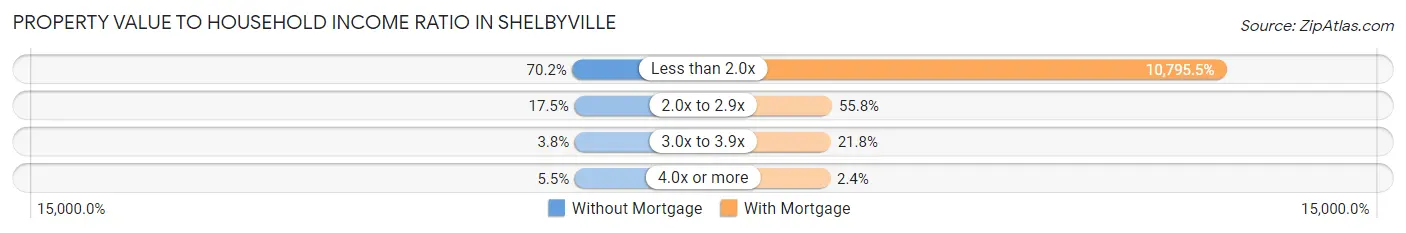
| Value-to-Income Ratio | Without Mortgage | With Mortgage |
| Less than 2.0x | 393 (70.2%) | 71,250 (10,795.4%) |
| 2.0x to 2.9x | 98 (17.5%) | 368 (55.8%) |
| 3.0x to 3.9x | 21 (3.7%) | 144 (21.8%) |
| 4.0x or more | 31 (5.5%) | 16 (2.4%) |
| Total | 560 (100.0%) | 660 (100.0%) |
Real Estate Taxes by Mortgage Status in Shelbyville
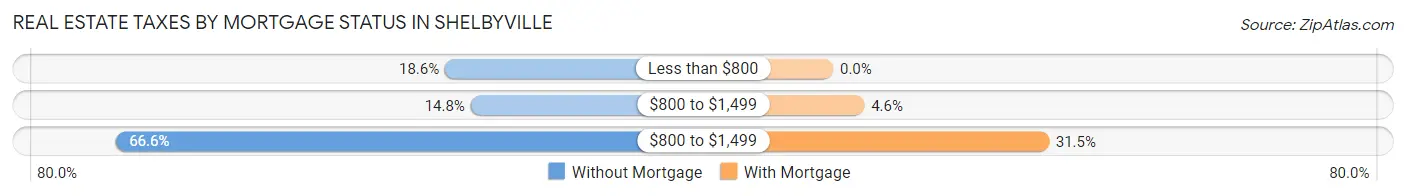
| Property Taxes | Without Mortgage | With Mortgage |
| Less than $800 | 104 (18.6%) | 0 (0.0%) |
| $800 to $1,499 | 83 (14.8%) | 30 (4.5%) |
| $800 to $1,499 | 373 (66.6%) | 208 (31.5%) |
| Total | 560 (100.0%) | 660 (100.0%) |
Health & Disability in Shelbyville
Health Insurance Coverage by Age in Shelbyville
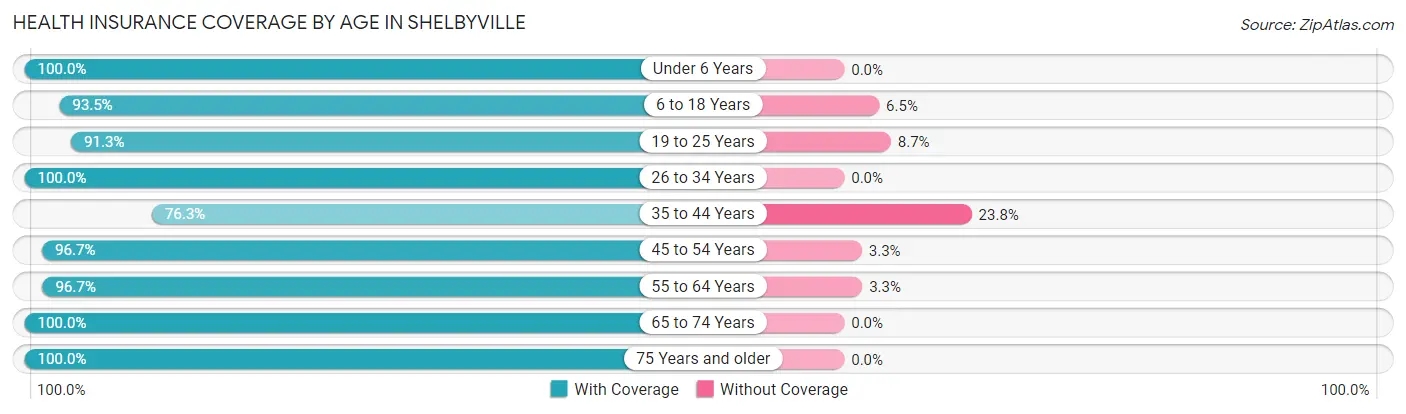
| Age Bracket | With Coverage | Without Coverage |
| Under 6 Years | 190 (100.0%) | 0 (0.0%) |
| 6 to 18 Years | 547 (93.5%) | 38 (6.5%) |
| 19 to 25 Years | 305 (91.3%) | 29 (8.7%) |
| 26 to 34 Years | 308 (100.0%) | 0 (0.0%) |
| 35 to 44 Years | 382 (76.2%) | 119 (23.7%) |
| 45 to 54 Years | 531 (96.7%) | 18 (3.3%) |
| 55 to 64 Years | 637 (96.7%) | 22 (3.3%) |
| 65 to 74 Years | 501 (100.0%) | 0 (0.0%) |
| 75 Years and older | 405 (100.0%) | 0 (0.0%) |
| Total | 3,806 (94.4%) | 226 (5.6%) |
Health Insurance Coverage by Citizenship Status in Shelbyville
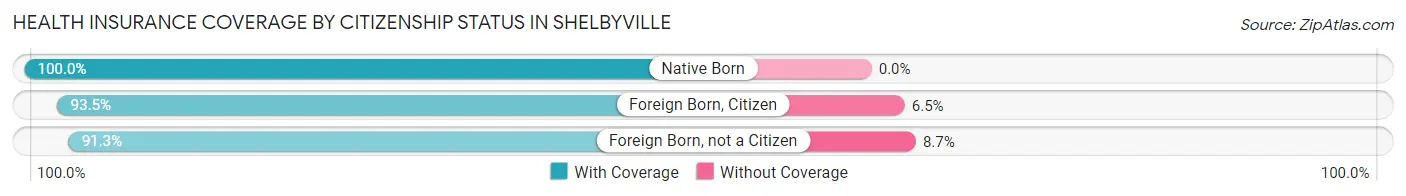
| Citizenship Status | With Coverage | Without Coverage |
| Native Born | 190 (100.0%) | 0 (0.0%) |
| Foreign Born, Citizen | 547 (93.5%) | 38 (6.5%) |
| Foreign Born, not a Citizen | 305 (91.3%) | 29 (8.7%) |
Health Insurance Coverage by Household Income in Shelbyville
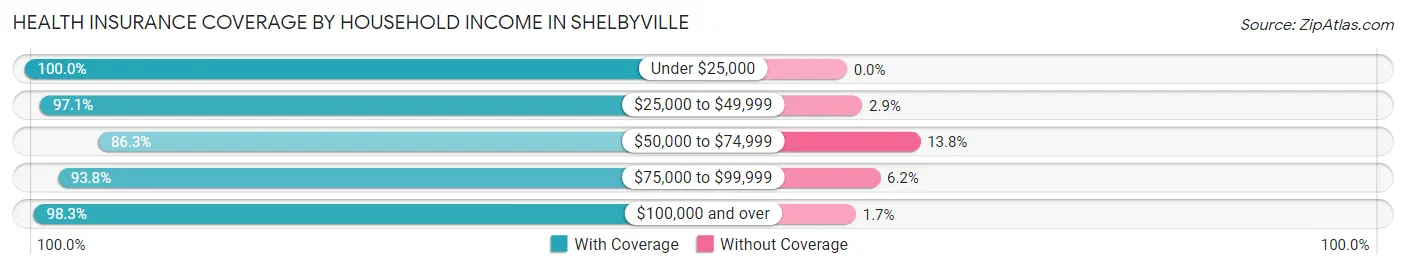
| Household Income | With Coverage | Without Coverage |
| Under $25,000 | 591 (100.0%) | 0 (0.0%) |
| $25,000 to $49,999 | 876 (97.1%) | 26 (2.9%) |
| $50,000 to $74,999 | 847 (86.3%) | 135 (13.8%) |
| $75,000 to $99,999 | 813 (93.8%) | 54 (6.2%) |
| $100,000 and over | 645 (98.3%) | 11 (1.7%) |
Public vs Private Health Insurance Coverage by Age in Shelbyville
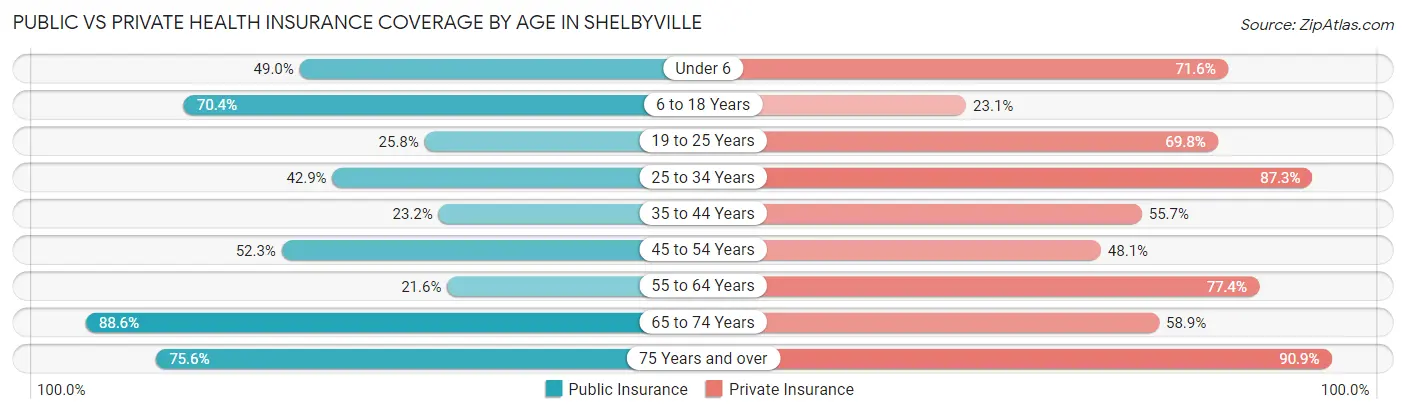
| Age Bracket | Public Insurance | Private Insurance |
| Under 6 | 93 (48.9%) | 136 (71.6%) |
| 6 to 18 Years | 412 (70.4%) | 135 (23.1%) |
| 19 to 25 Years | 86 (25.8%) | 233 (69.8%) |
| 25 to 34 Years | 132 (42.9%) | 269 (87.3%) |
| 35 to 44 Years | 116 (23.2%) | 279 (55.7%) |
| 45 to 54 Years | 287 (52.3%) | 264 (48.1%) |
| 55 to 64 Years | 142 (21.5%) | 510 (77.4%) |
| 65 to 74 Years | 444 (88.6%) | 295 (58.9%) |
| 75 Years and over | 306 (75.6%) | 368 (90.9%) |
| Total | 2,018 (50.0%) | 2,489 (61.7%) |
Disability Status by Sex by Age in Shelbyville
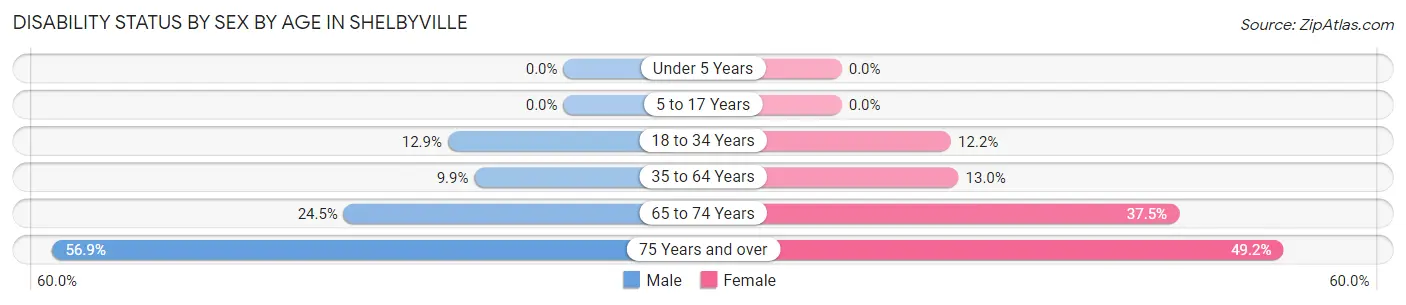
| Age Bracket | Male | Female |
| Under 5 Years | 0 (0.0%) | 0 (0.0%) |
| 5 to 17 Years | 0 (0.0%) | 0 (0.0%) |
| 18 to 34 Years | 39 (12.9%) | 47 (12.2%) |
| 35 to 64 Years | 75 (9.9%) | 124 (13.0%) |
| 65 to 74 Years | 45 (24.5%) | 119 (37.5%) |
| 75 Years and over | 95 (56.9%) | 117 (49.2%) |
Disability Class by Sex by Age in Shelbyville
Disability Class: Hearing Difficulty
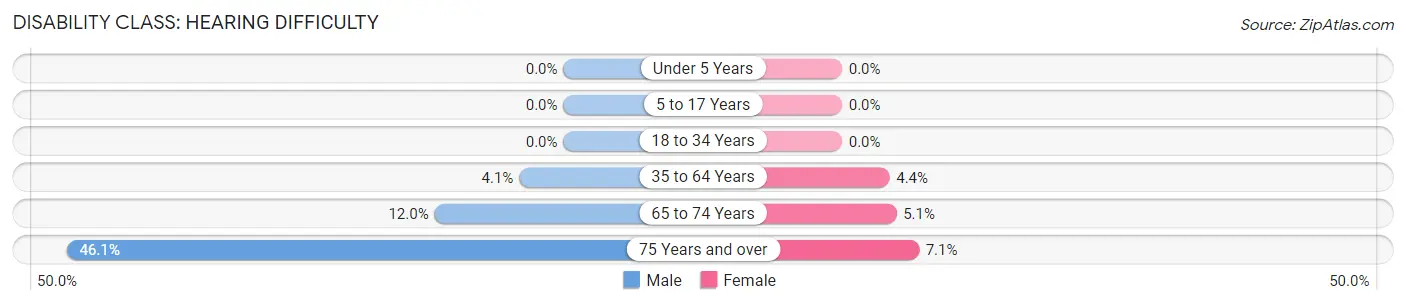
| Age Bracket | Male | Female |
| Under 5 Years | 0 (0.0%) | 0 (0.0%) |
| 5 to 17 Years | 0 (0.0%) | 0 (0.0%) |
| 18 to 34 Years | 0 (0.0%) | 0 (0.0%) |
| 35 to 64 Years | 31 (4.1%) | 42 (4.4%) |
| 65 to 74 Years | 22 (12.0%) | 16 (5.1%) |
| 75 Years and over | 77 (46.1%) | 17 (7.1%) |
Disability Class: Vision Difficulty
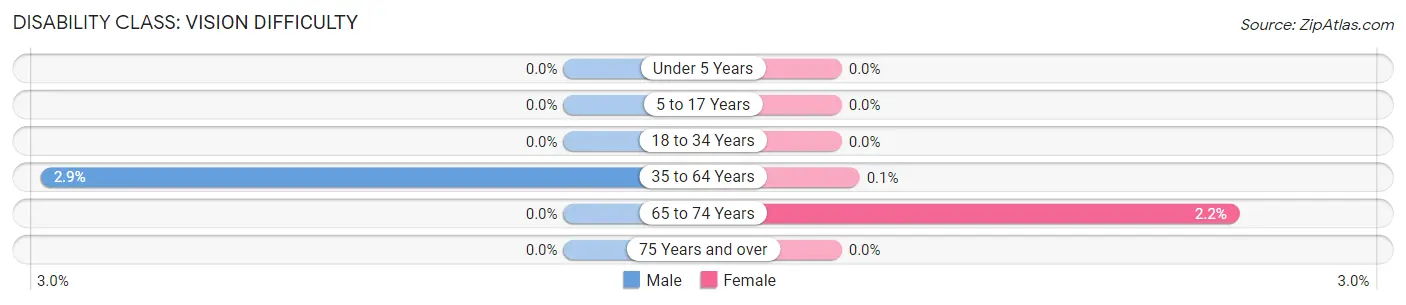
| Age Bracket | Male | Female |
| Under 5 Years | 0 (0.0%) | 0 (0.0%) |
| 5 to 17 Years | 0 (0.0%) | 0 (0.0%) |
| 18 to 34 Years | 0 (0.0%) | 0 (0.0%) |
| 35 to 64 Years | 22 (2.9%) | 1 (0.1%) |
| 65 to 74 Years | 0 (0.0%) | 7 (2.2%) |
| 75 Years and over | 0 (0.0%) | 0 (0.0%) |
Disability Class: Cognitive Difficulty
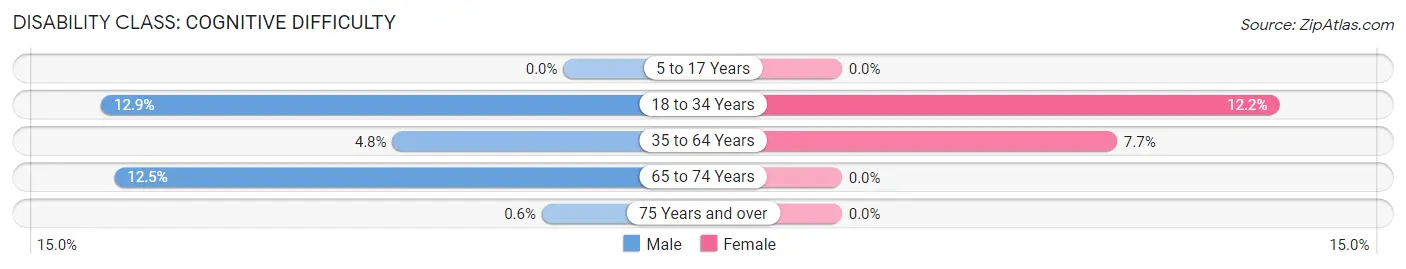
| Age Bracket | Male | Female |
| 5 to 17 Years | 0 (0.0%) | 0 (0.0%) |
| 18 to 34 Years | 39 (12.9%) | 47 (12.2%) |
| 35 to 64 Years | 36 (4.8%) | 73 (7.7%) |
| 65 to 74 Years | 23 (12.5%) | 0 (0.0%) |
| 75 Years and over | 1 (0.6%) | 0 (0.0%) |
Disability Class: Ambulatory Difficulty
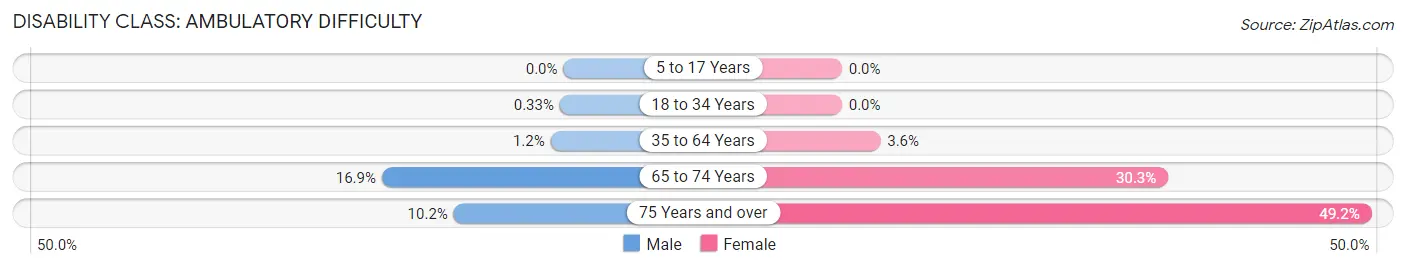
| Age Bracket | Male | Female |
| 5 to 17 Years | 0 (0.0%) | 0 (0.0%) |
| 18 to 34 Years | 1 (0.3%) | 0 (0.0%) |
| 35 to 64 Years | 9 (1.2%) | 34 (3.6%) |
| 65 to 74 Years | 31 (16.9%) | 96 (30.3%) |
| 75 Years and over | 17 (10.2%) | 117 (49.2%) |
Disability Class: Self-Care Difficulty
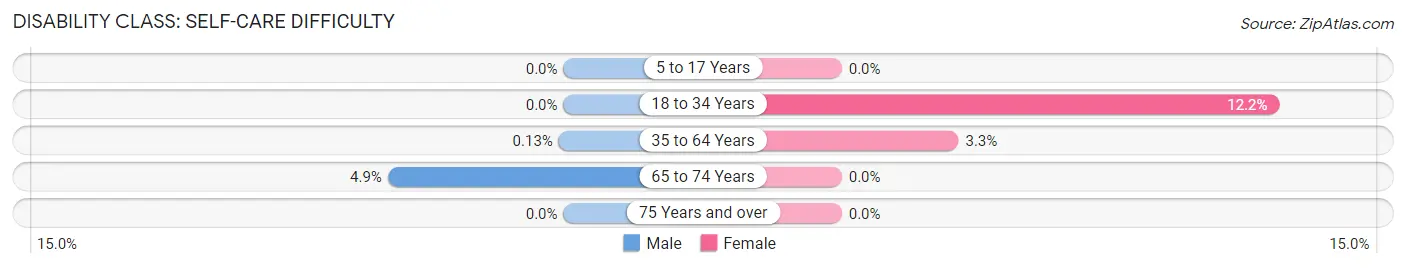
| Age Bracket | Male | Female |
| 5 to 17 Years | 0 (0.0%) | 0 (0.0%) |
| 18 to 34 Years | 0 (0.0%) | 47 (12.2%) |
| 35 to 64 Years | 1 (0.1%) | 31 (3.3%) |
| 65 to 74 Years | 9 (4.9%) | 0 (0.0%) |
| 75 Years and over | 0 (0.0%) | 0 (0.0%) |
Technology Access in Shelbyville
Computing Device Access in Shelbyville
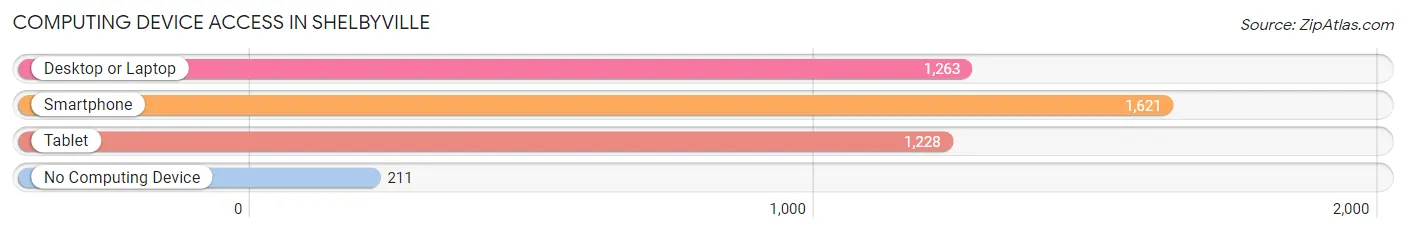
| Device Type | # Households | % Households |
| Desktop or Laptop | 1,263 | 63.1% |
| Smartphone | 1,621 | 81.0% |
| Tablet | 1,228 | 61.4% |
| No Computing Device | 211 | 10.5% |
| Total | 2,001 | 100.0% |
Internet Access in Shelbyville
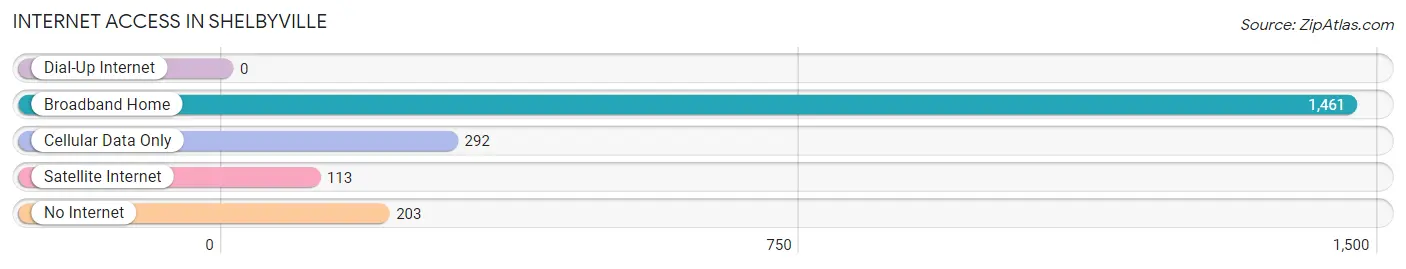
| Internet Type | # Households | % Households |
| Dial-Up Internet | 0 | 0.0% |
| Broadband Home | 1,461 | 73.0% |
| Cellular Data Only | 292 | 14.6% |
| Satellite Internet | 113 | 5.7% |
| No Internet | 203 | 10.1% |
| Total | 2,001 | 100.0% |
Shelbyville Summary
Shelbyville, Illinois is a small city located in the central part of the state, about 50 miles east of St. Louis, Missouri. It is the county seat of Shelby County and has a population of about 4,700 people. The city is known for its historic downtown area, which is home to a variety of shops, restaurants, and other businesses.
History
Shelbyville was founded in 1827 by William and Mary Shelby, who had moved to the area from Kentucky. The city was named after William Shelby, who was a veteran of the War of 1812. The city was incorporated in 1837 and quickly became a center of commerce and industry. The first railroad line in the area was built in 1853, connecting Shelbyville to St. Louis. This allowed the city to become a major hub for the transportation of goods and people.
In the late 19th century, Shelbyville was a major center for the production of agricultural products, such as corn, wheat, and oats. The city also had a thriving manufacturing sector, with several factories producing furniture, clothing, and other goods.
Geography
Shelbyville is located in the central part of Illinois, about 50 miles east of St. Louis, Missouri. The city is situated in the fertile Shelbyville Valley, which is surrounded by rolling hills and wooded areas. The city is located on the Kaskaskia River, which flows through the city and provides a source of water for the area.
The climate in Shelbyville is typical of the Midwest, with hot summers and cold winters. The average temperature in the summer is around 80 degrees Fahrenheit, while the average temperature in the winter is around 30 degrees Fahrenheit.
Economy
Shelbyville’s economy is largely based on agriculture and manufacturing. The city is home to several large farms, which produce a variety of crops, including corn, wheat, and oats. The city also has several factories that produce furniture, clothing, and other goods.
The city is also home to several businesses, including restaurants, retail stores, and other services. The city is also home to several educational institutions, including a community college and a technical school.
Demographics
As of the 2010 census, the population of Shelbyville was 4,700 people. The racial makeup of the city was 95.3% White, 1.2% African American, 0.3% Native American, 0.7% Asian, 0.1% Pacific Islander, and 2.4% from other races. The median household income in the city was $37,000, and the median family income was $45,000.
Shelbyville is a small city with a rich history and a diverse economy. The city is home to a variety of businesses, educational institutions, and other services. The city is also home to a variety of cultural attractions, including several historic sites and museums. The city is a great place to live, work, and visit.
Common Questions
What is Per Capita Income in Shelbyville?
Per Capita income in Shelbyville is $30,347.
What is the Median Family Income in Shelbyville?
Median Family Income in Shelbyville is $66,386.
What is the Median Household income in Shelbyville?
Median Household Income in Shelbyville is $53,859.
What is Income or Wage Gap in Shelbyville?
Income or Wage Gap in Shelbyville is 7.1%.
Women in Shelbyville earn 92.9 cents for every dollar earned by a man.
What is Inequality or Gini Index in Shelbyville?
Inequality or Gini Index in Shelbyville is 0.42.
What is the Total Population of Shelbyville?
Total Population of Shelbyville is 4,156.
What is the Total Male Population of Shelbyville?
Total Male Population of Shelbyville is 1,854.
What is the Total Female Population of Shelbyville?
Total Female Population of Shelbyville is 2,302.
What is the Ratio of Males per 100 Females in Shelbyville?
There are 80.54 Males per 100 Females in Shelbyville.
What is the Ratio of Females per 100 Males in Shelbyville?
There are 124.16 Females per 100 Males in Shelbyville.
What is the Median Population Age in Shelbyville?
Median Population Age in Shelbyville is 48.3 Years.
What is the Average Family Size in Shelbyville
Average Family Size in Shelbyville is 2.9 People.
What is the Average Household Size in Shelbyville
Average Household Size in Shelbyville is 2.0 People.
How Large is the Labor Force in Shelbyville?
There are 2,288 People in the Labor Forcein in Shelbyville.
What is the Percentage of People in the Labor Force in Shelbyville?
64.7% of People are in the Labor Force in Shelbyville.
What is the Unemployment Rate in Shelbyville?
Unemployment Rate in Shelbyville is 3.8%.