Zip Codes with the Highest Percentage of Population Employed in Architecture & Engineering in Schaumburg, IL
RELATED REPORTS & OPTIONS
Architecture & Engineering
Schaumburg
Compare Zip Codes
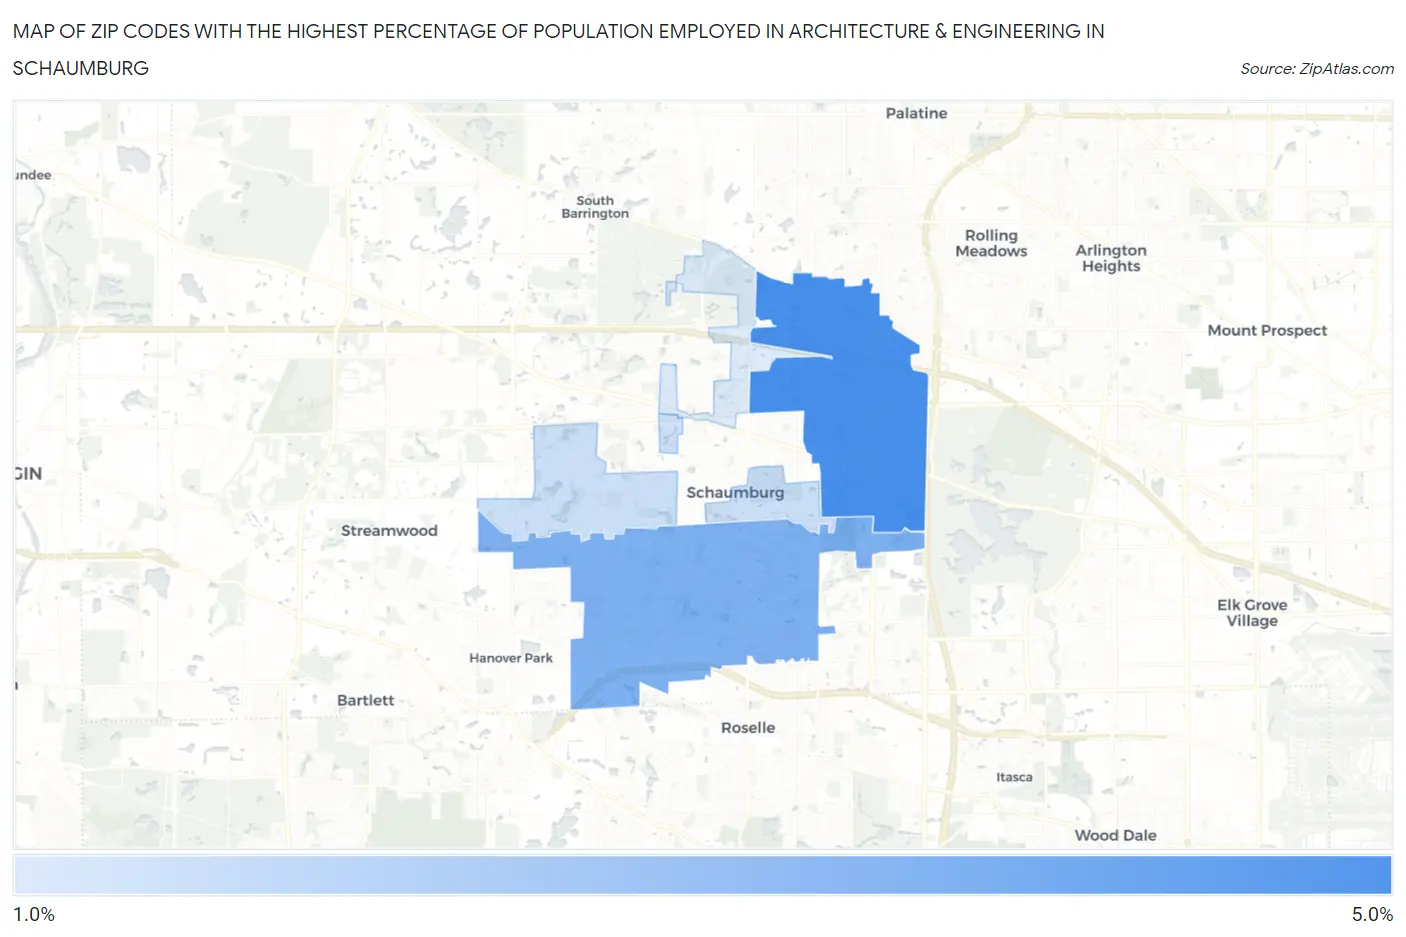
Map of Zip Codes with the Highest Percentage of Population Employed in Architecture & Engineering in Schaumburg
1.7%
4.2%
Zip Codes with the Highest Percentage of Population Employed in Architecture & Engineering in Schaumburg, IL
| Zip Code | % Employed | vs State | vs National | |
| 1. | 60173 | 4.2% | 1.9%(+2.32)#82 | 2.1%(+2.06)#2,476 |
| 2. | 60193 | 3.3% | 1.9%(+1.39)#156 | 2.1%(+1.14)#4,239 |
| 3. | 60194 | 1.9% | 1.9%(+0.044)#402 | 2.1%(-0.211)#9,991 |
| 4. | 60195 | 1.7% | 1.9%(-0.213)#495 | 2.1%(-0.467)#11,620 |
1
Common Questions
What are the Top 3 Zip Codes with the Highest Percentage of Population Employed in Architecture & Engineering in Schaumburg, IL?
Top 3 Zip Codes with the Highest Percentage of Population Employed in Architecture & Engineering in Schaumburg, IL are:
What zip code has the Highest Percentage of Population Employed in Architecture & Engineering in Schaumburg, IL?
60173 has the Highest Percentage of Population Employed in Architecture & Engineering in Schaumburg, IL with 4.2%.
What is the Percentage of Population Employed in Architecture & Engineering in Schaumburg, IL?
Percentage of Population Employed in Architecture & Engineering in Schaumburg is 3.0%.
What is the Percentage of Population Employed in Architecture & Engineering in Illinois?
Percentage of Population Employed in Architecture & Engineering in Illinois is 1.9%.
What is the Percentage of Population Employed in Architecture & Engineering in the United States?
Percentage of Population Employed in Architecture & Engineering in the United States is 2.1%.