Rossville, IL Map & Demographics
Rossville Map
Rossville Overview
$28,161
PER CAPITA INCOME
$75,625
AVG FAMILY INCOME
$62,500
AVG HOUSEHOLD INCOME
32.3%
WAGE / INCOME GAP [ % ]
67.7¢/ $1
WAGE / INCOME GAP [ $ ]
0.43
INEQUALITY / GINI INDEX
1,198
TOTAL POPULATION
587
MALE POPULATION
611
FEMALE POPULATION
96.07
MALES / 100 FEMALES
104.09
FEMALES / 100 MALES
37.2
MEDIAN AGE
3.4
AVG FAMILY SIZE
2.8
AVG HOUSEHOLD SIZE
506
LABOR FORCE [ PEOPLE ]
60.2%
PERCENT IN LABOR FORCE
2.0%
UNEMPLOYMENT RATE
Rossville Zip Codes
Rossville Area Codes
Income in Rossville
Income Overview in Rossville
Per Capita Income in Rossville is $28,161, while median incomes of families and households are $75,625 and $62,500 respectively.
| Characteristic | Number | Measure |
| Per Capita Income | 1,198 | $28,161 |
| Median Family Income | 281 | $75,625 |
| Mean Family Income | 281 | $82,584 |
| Median Household Income | 426 | $62,500 |
| Mean Household Income | 426 | $76,408 |
| Income Deficit | 281 | $0 |
| Wage / Income Gap (%) | 1,198 | 32.31% |
| Wage / Income Gap ($) | 1,198 | 67.69¢ per $1 |
| Gini / Inequality Index | 1,198 | 0.43 |
Earnings by Sex in Rossville
Average Earnings in Rossville are $30,543, $36,750 for men and $24,875 for women, a difference of 32.3%.
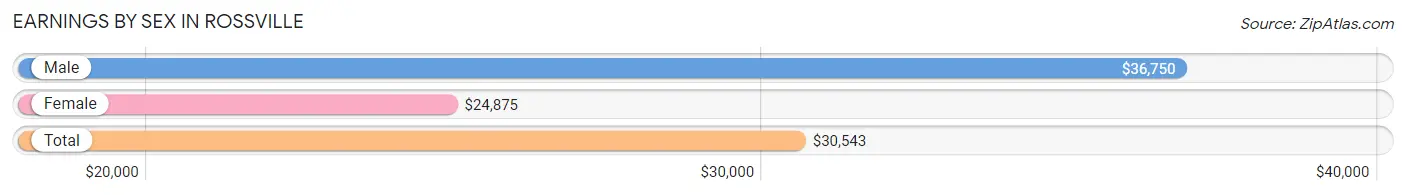
| Sex | Number | Average Earnings |
| Male | 259 (48.5%) | $36,750 |
| Female | 275 (51.5%) | $24,875 |
| Total | 534 (100.0%) | $30,543 |
Earnings by Sex by Income Bracket in Rossville
The most common earnings brackets in Rossville are $75,000 to $99,999 for men (33 | 12.7%) and $2,499 or less for women (26 | 9.5%).
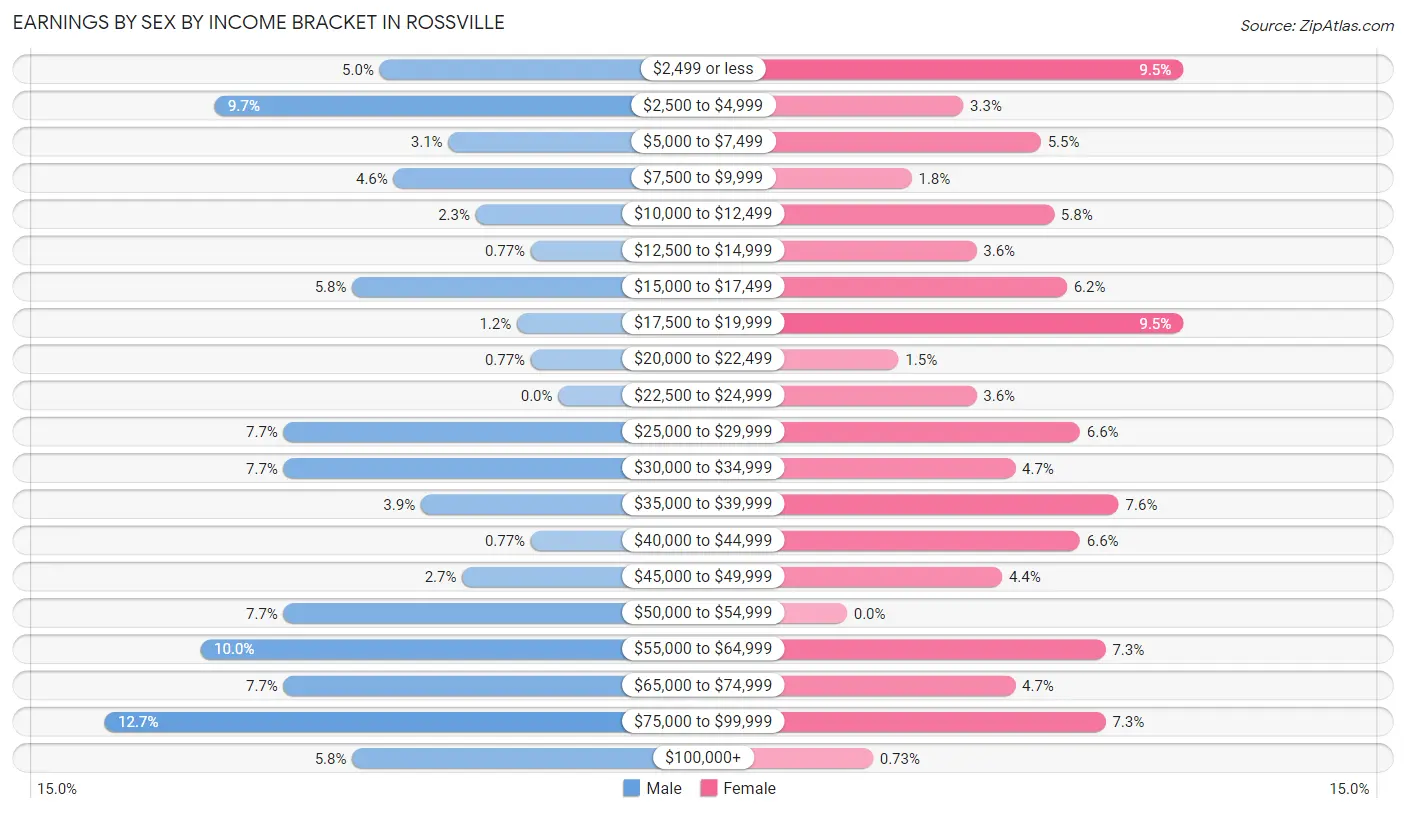
| Income | Male | Female |
| $2,499 or less | 13 (5.0%) | 26 (9.5%) |
| $2,500 to $4,999 | 25 (9.7%) | 9 (3.3%) |
| $5,000 to $7,499 | 8 (3.1%) | 15 (5.4%) |
| $7,500 to $9,999 | 12 (4.6%) | 5 (1.8%) |
| $10,000 to $12,499 | 6 (2.3%) | 16 (5.8%) |
| $12,500 to $14,999 | 2 (0.8%) | 10 (3.6%) |
| $15,000 to $17,499 | 15 (5.8%) | 17 (6.2%) |
| $17,500 to $19,999 | 3 (1.2%) | 26 (9.5%) |
| $20,000 to $22,499 | 2 (0.8%) | 4 (1.5%) |
| $22,500 to $24,999 | 0 (0.0%) | 10 (3.6%) |
| $25,000 to $29,999 | 20 (7.7%) | 18 (6.6%) |
| $30,000 to $34,999 | 20 (7.7%) | 13 (4.7%) |
| $35,000 to $39,999 | 10 (3.9%) | 21 (7.6%) |
| $40,000 to $44,999 | 2 (0.8%) | 18 (6.6%) |
| $45,000 to $49,999 | 7 (2.7%) | 12 (4.4%) |
| $50,000 to $54,999 | 20 (7.7%) | 0 (0.0%) |
| $55,000 to $64,999 | 26 (10.0%) | 20 (7.3%) |
| $65,000 to $74,999 | 20 (7.7%) | 13 (4.7%) |
| $75,000 to $99,999 | 33 (12.7%) | 20 (7.3%) |
| $100,000+ | 15 (5.8%) | 2 (0.7%) |
| Total | 259 (100.0%) | 275 (100.0%) |
Earnings by Sex by Educational Attainment in Rossville
Average earnings in Rossville are $54,625 for men and $30,875 for women, a difference of 43.5%. Men with an educational attainment of less than high school enjoy the highest average annual earnings of $78,333, while those with high school diploma education earn the least with $45,313. Women with an educational attainment of college or associate's degree earn the most with the average annual earnings of $37,857, while those with high school diploma education have the smallest earnings of $23,875.
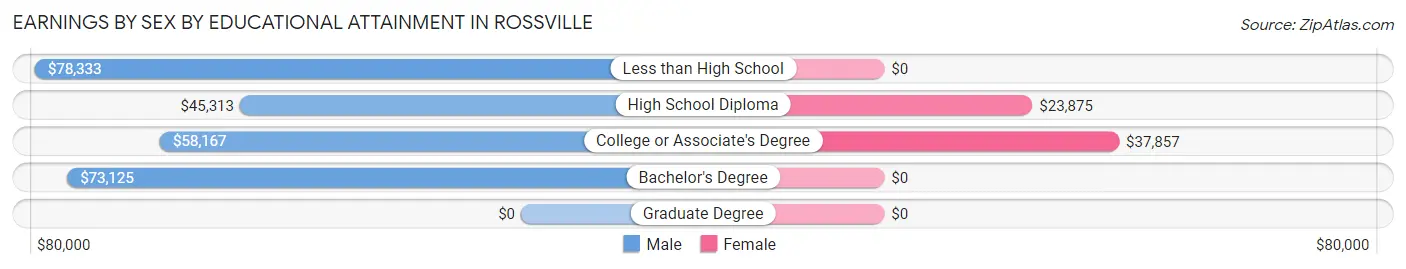
| Educational Attainment | Male Income | Female Income |
| Less than High School | $78,333 | $0 |
| High School Diploma | $45,313 | $23,875 |
| College or Associate's Degree | $58,167 | $37,857 |
| Bachelor's Degree | $73,125 | $0 |
| Graduate Degree | - | - |
| Total | $54,625 | $30,875 |
Family Income in Rossville
Family Income Brackets in Rossville
According to the Rossville family income data, there are 83 families falling into the $75,000 to $99,999 income range, which is the most common income bracket and makes up 29.5% of all families.
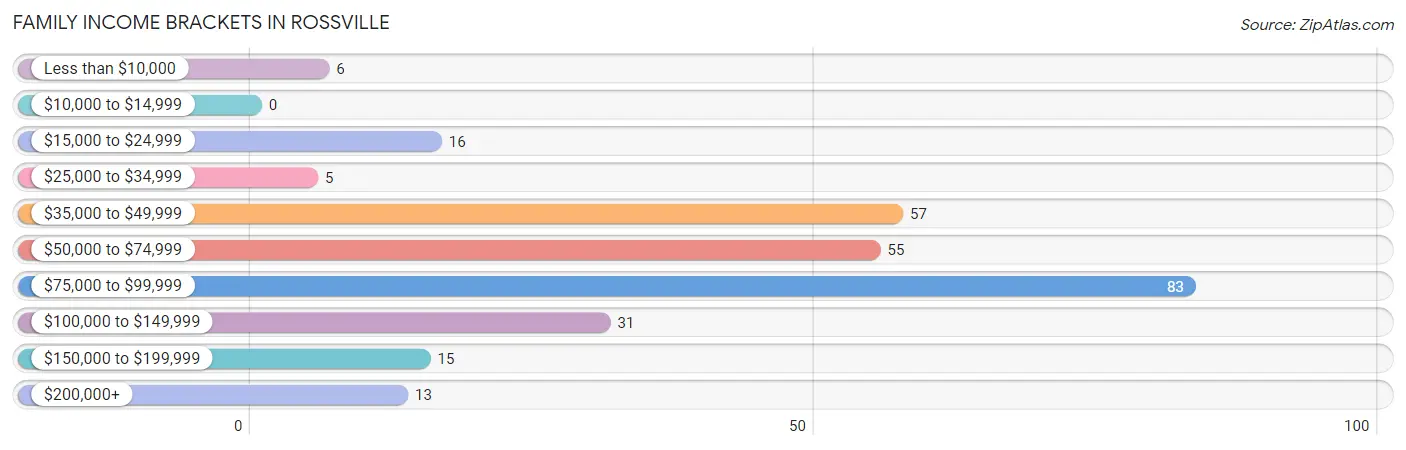
| Income Bracket | # Families | % Families |
| Less than $10,000 | 6 | 2.1% |
| $10,000 to $14,999 | 0 | 0.0% |
| $15,000 to $24,999 | 16 | 5.7% |
| $25,000 to $34,999 | 5 | 1.8% |
| $35,000 to $49,999 | 57 | 20.3% |
| $50,000 to $74,999 | 55 | 19.6% |
| $75,000 to $99,999 | 83 | 29.5% |
| $100,000 to $149,999 | 31 | 11.0% |
| $150,000 to $199,999 | 15 | 5.3% |
| $200,000+ | 13 | 4.6% |
Family Income by Famaliy Size in Rossville
4-person families (46 | 16.4%) account for the highest median family income in Rossville with $85,833 per family, while 2-person families (151 | 53.7%) have the highest median income of $32,708 per family member.
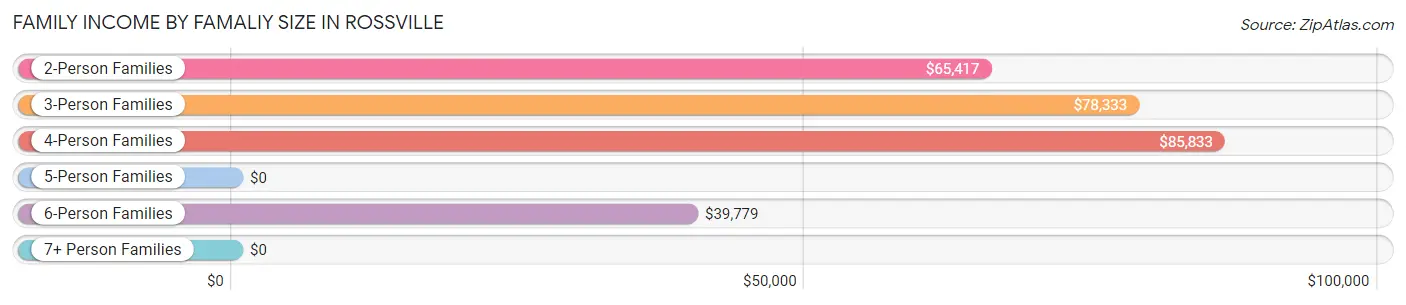
| Income Bracket | # Families | Median Income |
| 2-Person Families | 151 (53.7%) | $65,417 |
| 3-Person Families | 32 (11.4%) | $78,333 |
| 4-Person Families | 46 (16.4%) | $85,833 |
| 5-Person Families | 12 (4.3%) | $0 |
| 6-Person Families | 31 (11.0%) | $39,779 |
| 7+ Person Families | 9 (3.2%) | $0 |
| Total | 281 (100.0%) | $75,625 |
Family Income by Number of Earners in Rossville
The median family income in Rossville is $75,625, with families comprising 3+ earners (30) having the highest median family income of $97,500, while families with 1 earner (101) have the lowest median family income of $47,361, accounting for 10.7% and 35.9% of families, respectively.
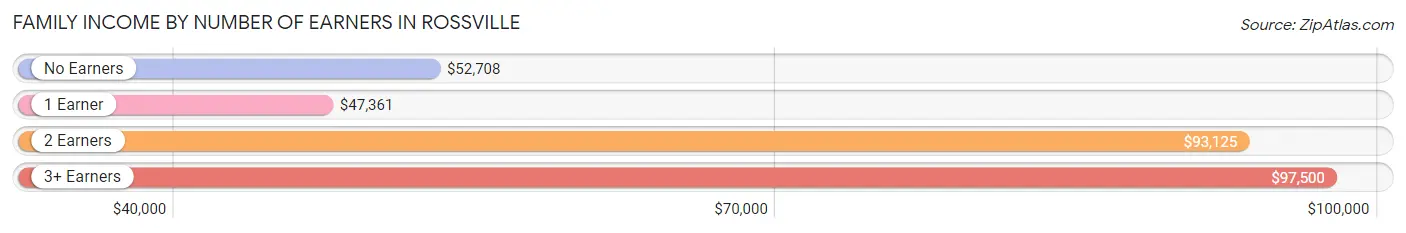
| Number of Earners | # Families | Median Income |
| No Earners | 53 (18.9%) | $52,708 |
| 1 Earner | 101 (35.9%) | $47,361 |
| 2 Earners | 97 (34.5%) | $93,125 |
| 3+ Earners | 30 (10.7%) | $97,500 |
| Total | 281 (100.0%) | $75,625 |
Household Income in Rossville
Household Income Brackets in Rossville
With 95 households falling in the category, the $75,000 to $99,999 income range is the most frequent in Rossville, accounting for 22.3% of all households. In contrast, only 15 households (3.5%) fall into the $150,000 to $199,999 income bracket, making it the least populous group.
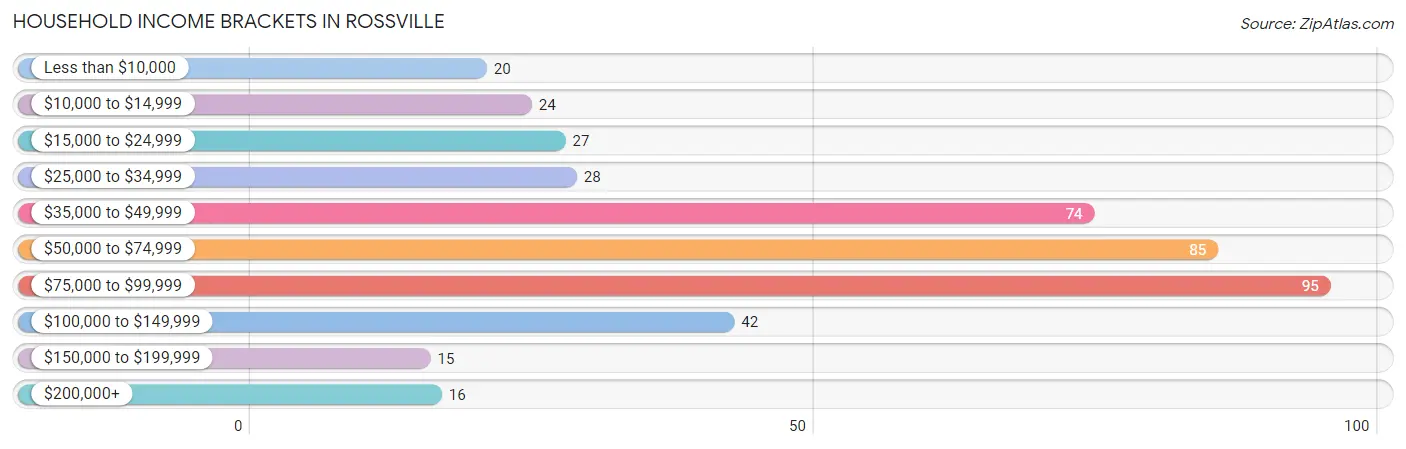
| Income Bracket | # Households | % Households |
| Less than $10,000 | 20 | 4.7% |
| $10,000 to $14,999 | 24 | 5.6% |
| $15,000 to $24,999 | 27 | 6.3% |
| $25,000 to $34,999 | 28 | 6.6% |
| $35,000 to $49,999 | 74 | 17.4% |
| $50,000 to $74,999 | 85 | 20.0% |
| $75,000 to $99,999 | 95 | 22.3% |
| $100,000 to $149,999 | 42 | 9.9% |
| $150,000 to $199,999 | 15 | 3.5% |
| $200,000+ | 16 | 3.8% |
Household Income by Householder Age in Rossville
The median household income in Rossville is $62,500, with the highest median household income of $76,458 found in the 25 to 44 years age bracket for the primary householder. A total of 119 households (27.9%) fall into this category. Meanwhile, the 15 to 24 years age bracket for the primary householder has the lowest median household income of $50,417, with 10 households (2.4%) in this group.
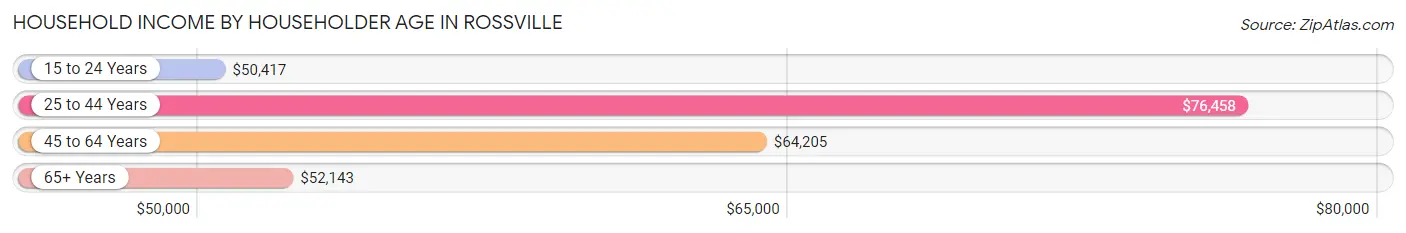
| Income Bracket | # Households | Median Income |
| 15 to 24 Years | 10 (2.4%) | $50,417 |
| 25 to 44 Years | 119 (27.9%) | $76,458 |
| 45 to 64 Years | 149 (35.0%) | $64,205 |
| 65+ Years | 148 (34.7%) | $52,143 |
| Total | 426 (100.0%) | $62,500 |
Poverty in Rossville
Income Below Poverty by Sex and Age in Rossville
With 9.5% poverty level for males and 12.0% for females among the residents of Rossville, 16 and 17 year old males and 5 year old females are the most vulnerable to poverty, with 3 males (50.0%) and 6 females (100.0%) in their respective age groups living below the poverty level.
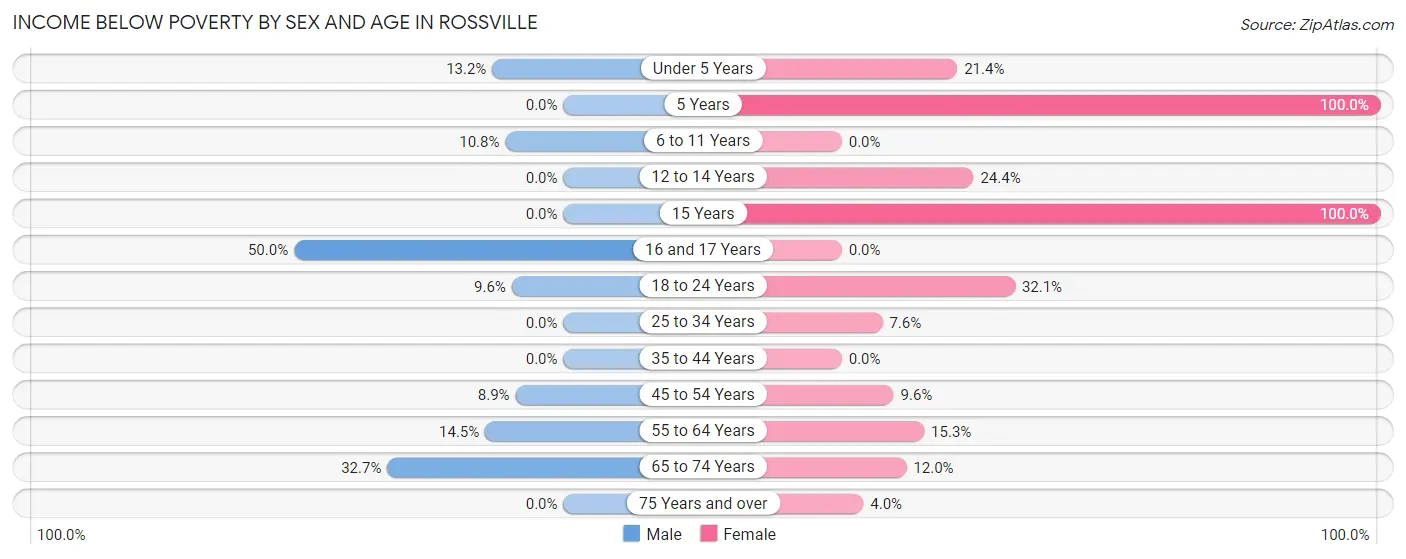
| Age Bracket | Male | Female |
| Under 5 Years | 7 (13.2%) | 9 (21.4%) |
| 5 Years | 0 (0.0%) | 6 (100.0%) |
| 6 to 11 Years | 7 (10.8%) | 0 (0.0%) |
| 12 to 14 Years | 0 (0.0%) | 11 (24.4%) |
| 15 Years | 0 (0.0%) | 5 (100.0%) |
| 16 and 17 Years | 3 (50.0%) | 0 (0.0%) |
| 18 to 24 Years | 7 (9.6%) | 9 (32.1%) |
| 25 to 34 Years | 0 (0.0%) | 4 (7.5%) |
| 35 to 44 Years | 0 (0.0%) | 0 (0.0%) |
| 45 to 54 Years | 4 (8.9%) | 5 (9.6%) |
| 55 to 64 Years | 9 (14.5%) | 13 (15.3%) |
| 65 to 74 Years | 17 (32.7%) | 6 (12.0%) |
| 75 Years and over | 0 (0.0%) | 3 (4.0%) |
| Total | 54 (9.5%) | 71 (12.0%) |
Income Above Poverty by Sex and Age in Rossville
According to the poverty statistics in Rossville, males aged 5 years and females aged 6 to 11 years are the age groups that are most secure financially, with 100.0% of males and 100.0% of females in these age groups living above the poverty line.
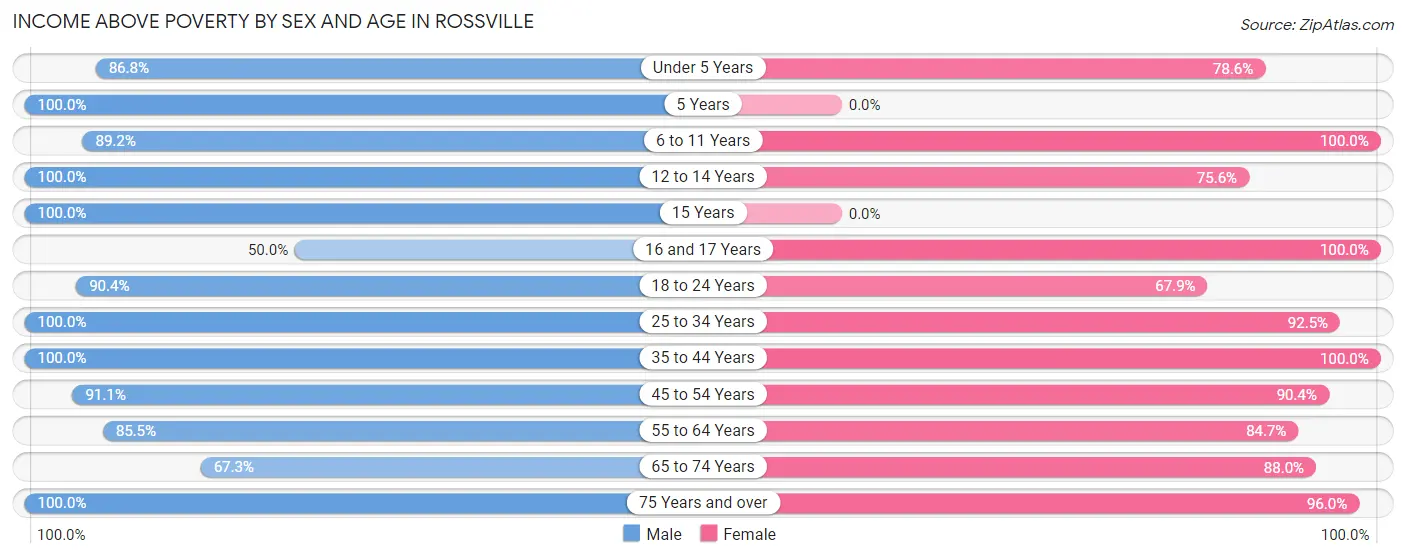
| Age Bracket | Male | Female |
| Under 5 Years | 46 (86.8%) | 33 (78.6%) |
| 5 Years | 2 (100.0%) | 0 (0.0%) |
| 6 to 11 Years | 58 (89.2%) | 52 (100.0%) |
| 12 to 14 Years | 47 (100.0%) | 34 (75.6%) |
| 15 Years | 6 (100.0%) | 0 (0.0%) |
| 16 and 17 Years | 3 (50.0%) | 16 (100.0%) |
| 18 to 24 Years | 66 (90.4%) | 19 (67.9%) |
| 25 to 34 Years | 29 (100.0%) | 49 (92.4%) |
| 35 to 44 Years | 78 (100.0%) | 84 (100.0%) |
| 45 to 54 Years | 41 (91.1%) | 47 (90.4%) |
| 55 to 64 Years | 53 (85.5%) | 72 (84.7%) |
| 65 to 74 Years | 35 (67.3%) | 44 (88.0%) |
| 75 Years and over | 52 (100.0%) | 72 (96.0%) |
| Total | 516 (90.5%) | 522 (88.0%) |
Income Below Poverty Among Married-Couple Families in Rossville
The poverty statistics for married-couple families in Rossville show that 1.5% or 3 of the total 204 families live below the poverty line. Families with 5 or more children have the highest poverty rate of 33.3%, comprising of 3 families. On the other hand, families with no children have the lowest poverty rate of 0.0%, which includes 0 families.
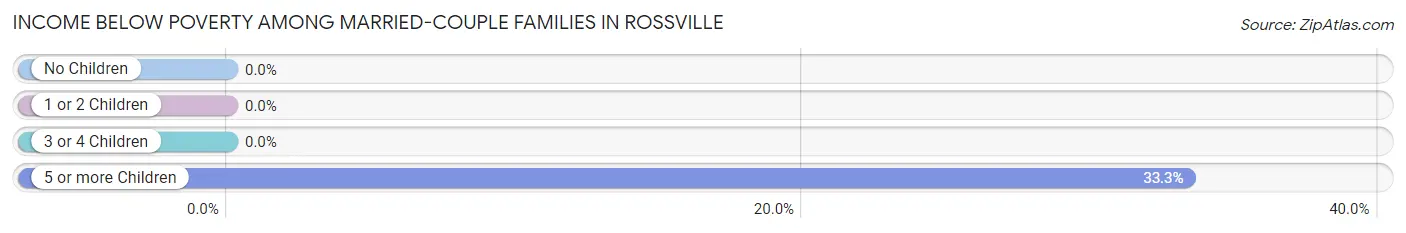
| Children | Above Poverty | Below Poverty |
| No Children | 122 (100.0%) | 0 (0.0%) |
| 1 or 2 Children | 48 (100.0%) | 0 (0.0%) |
| 3 or 4 Children | 25 (100.0%) | 0 (0.0%) |
| 5 or more Children | 6 (66.7%) | 3 (33.3%) |
| Total | 201 (98.5%) | 3 (1.5%) |
Income Below Poverty Among Single-Parent Households in Rossville
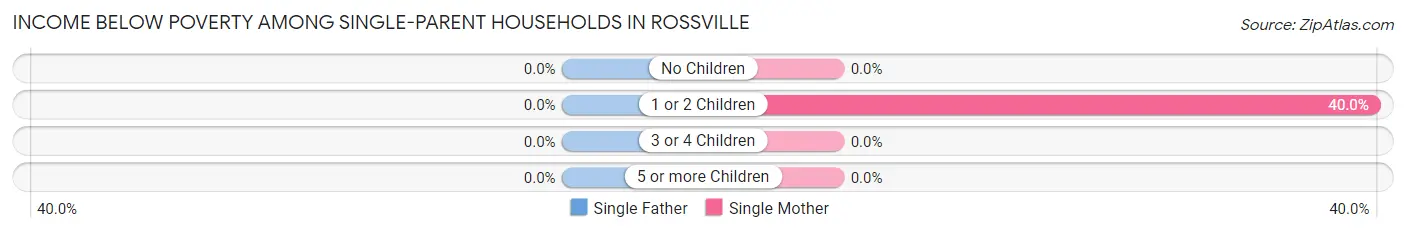
| Children | Single Father | Single Mother |
| No Children | 0 (0.0%) | 0 (0.0%) |
| 1 or 2 Children | 0 (0.0%) | 14 (40.0%) |
| 3 or 4 Children | 0 (0.0%) | 0 (0.0%) |
| 5 or more Children | 0 (0.0%) | 0 (0.0%) |
| Total | 0 (0.0%) | 14 (26.4%) |
Income Below Poverty Among Married-Couple vs Single-Parent Households in Rossville
The poverty data for Rossville shows that 3 of the married-couple family households (1.5%) and 14 of the single-parent households (18.2%) are living below the poverty level. Within the married-couple family households, those with 5 or more children have the highest poverty rate, with 3 households (33.3%) falling below the poverty line. Among the single-parent households, those with 1 or 2 children have the highest poverty rate, with 14 household (33.3%) living below poverty.
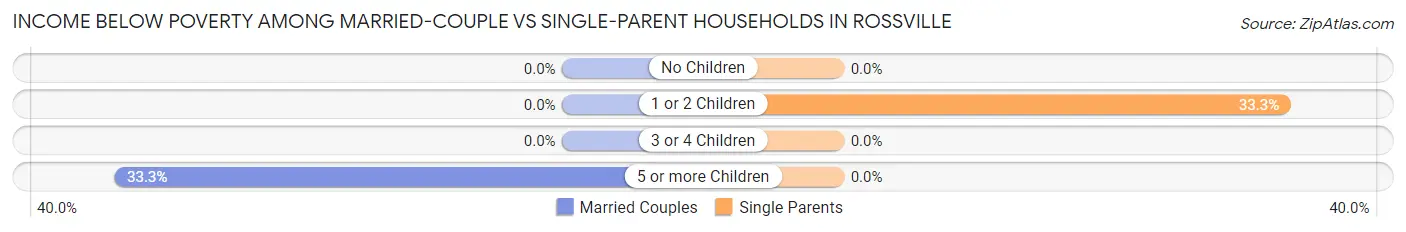
| Children | Married-Couple Families | Single-Parent Households |
| No Children | 0 (0.0%) | 0 (0.0%) |
| 1 or 2 Children | 0 (0.0%) | 14 (33.3%) |
| 3 or 4 Children | 0 (0.0%) | 0 (0.0%) |
| 5 or more Children | 3 (33.3%) | 0 (0.0%) |
| Total | 3 (1.5%) | 14 (18.2%) |
Race in Rossville
The most populous races in Rossville are White / Caucasian (1,132 | 94.5%), Hispanic or Latino (193 | 16.1%), and Two or more Races (47 | 3.9%).
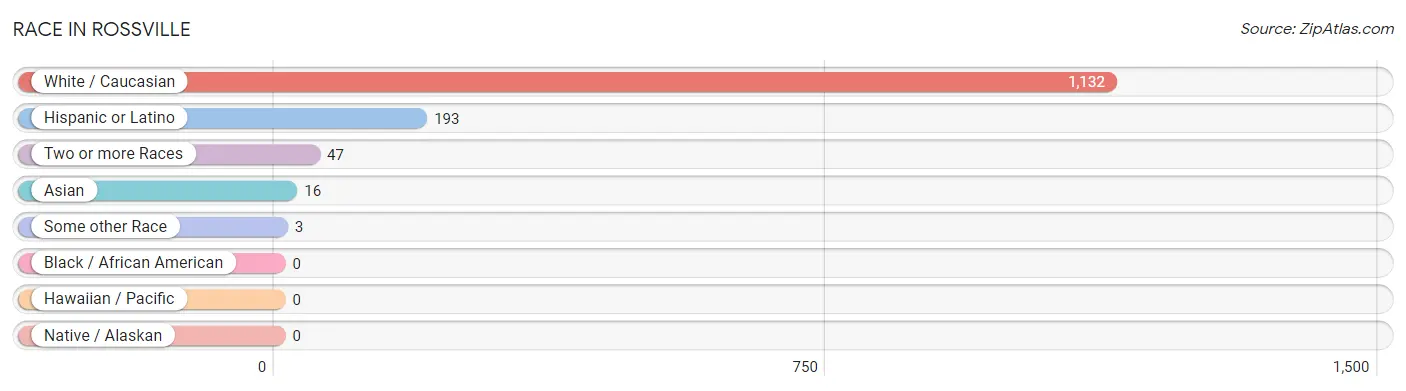
| Race | # Population | % Population |
| Asian | 16 | 1.3% |
| Black / African American | 0 | 0.0% |
| Hawaiian / Pacific | 0 | 0.0% |
| Hispanic or Latino | 193 | 16.1% |
| Native / Alaskan | 0 | 0.0% |
| White / Caucasian | 1,132 | 94.5% |
| Two or more Races | 47 | 3.9% |
| Some other Race | 3 | 0.3% |
| Total | 1,198 | 100.0% |
Ancestry in Rossville
The most populous ancestries reported in Rossville are Mexican (184 | 15.4%), German (123 | 10.3%), American (122 | 10.2%), English (121 | 10.1%), and Irish (94 | 7.9%), together accounting for 53.8% of all Rossville residents.
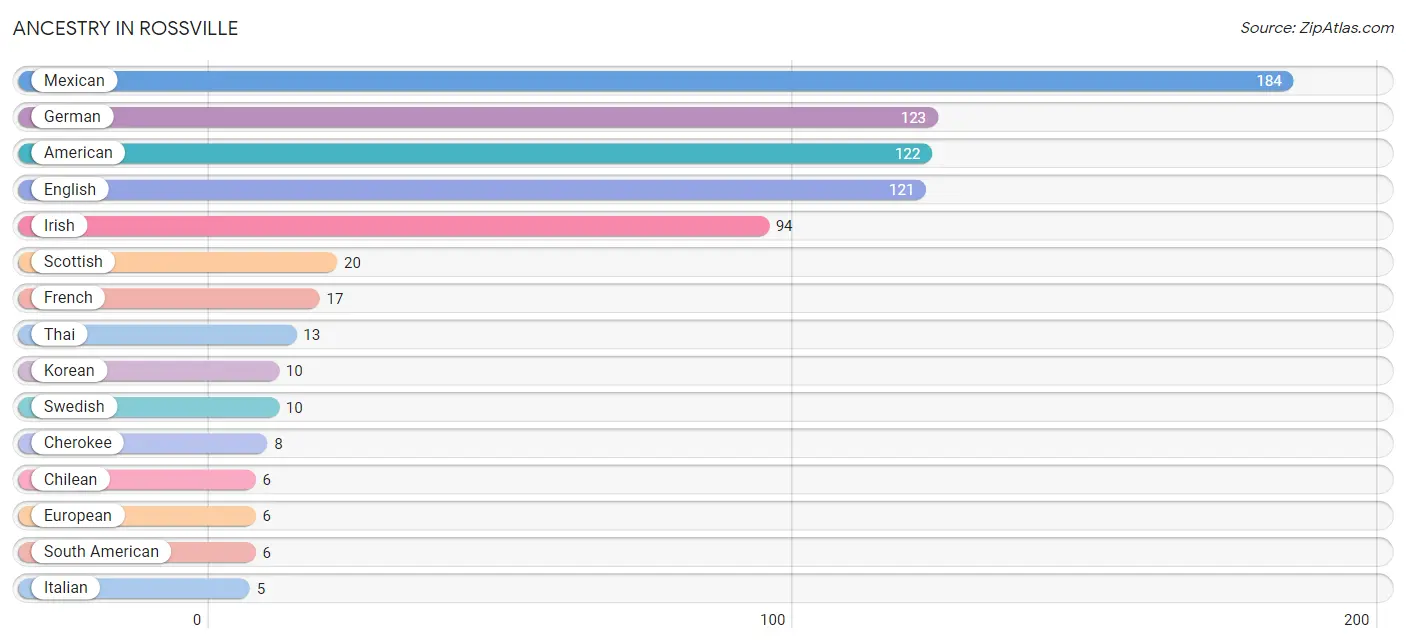
| Ancestry | # Population | % Population |
| American | 122 | 10.2% |
| British | 2 | 0.2% |
| Cherokee | 8 | 0.7% |
| Chilean | 6 | 0.5% |
| Danish | 2 | 0.2% |
| Dutch | 4 | 0.3% |
| English | 121 | 10.1% |
| European | 6 | 0.5% |
| French | 17 | 1.4% |
| French Canadian | 3 | 0.3% |
| German | 123 | 10.3% |
| Hungarian | 3 | 0.3% |
| Irish | 94 | 7.9% |
| Italian | 5 | 0.4% |
| Korean | 10 | 0.8% |
| Mexican | 184 | 15.4% |
| Polish | 5 | 0.4% |
| Puerto Rican | 3 | 0.3% |
| Scotch-Irish | 2 | 0.2% |
| Scottish | 20 | 1.7% |
| South American | 6 | 0.5% |
| Swedish | 10 | 0.8% |
| Swiss | 2 | 0.2% |
| Thai | 13 | 1.1% | View All 24 Rows |
Immigrants in Rossville
The most numerous immigrant groups reported in Rossville came from Asia (13 | 1.1%), India (10 | 0.8%), South Central Asia (10 | 0.8%), Latin America (8 | 0.7%), and Chile (6 | 0.5%), together accounting for 3.9% of all Rossville residents.
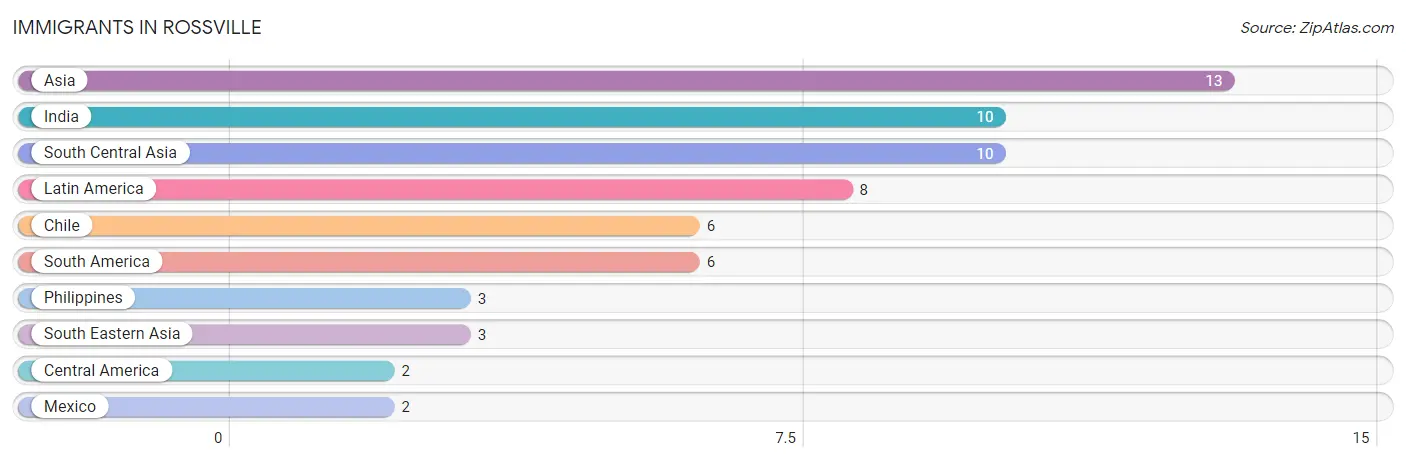
| Immigration Origin | # Population | % Population |
| Asia | 13 | 1.1% |
| Central America | 2 | 0.2% |
| Chile | 6 | 0.5% |
| India | 10 | 0.8% |
| Latin America | 8 | 0.7% |
| Mexico | 2 | 0.2% |
| Philippines | 3 | 0.3% |
| South America | 6 | 0.5% |
| South Central Asia | 10 | 0.8% |
| South Eastern Asia | 3 | 0.3% | View All 10 Rows |
Sex and Age in Rossville
Sex and Age in Rossville
The most populous age groups in Rossville are 10 to 14 Years (70 | 11.9%) for men and 10 to 14 Years (78 | 12.8%) for women.
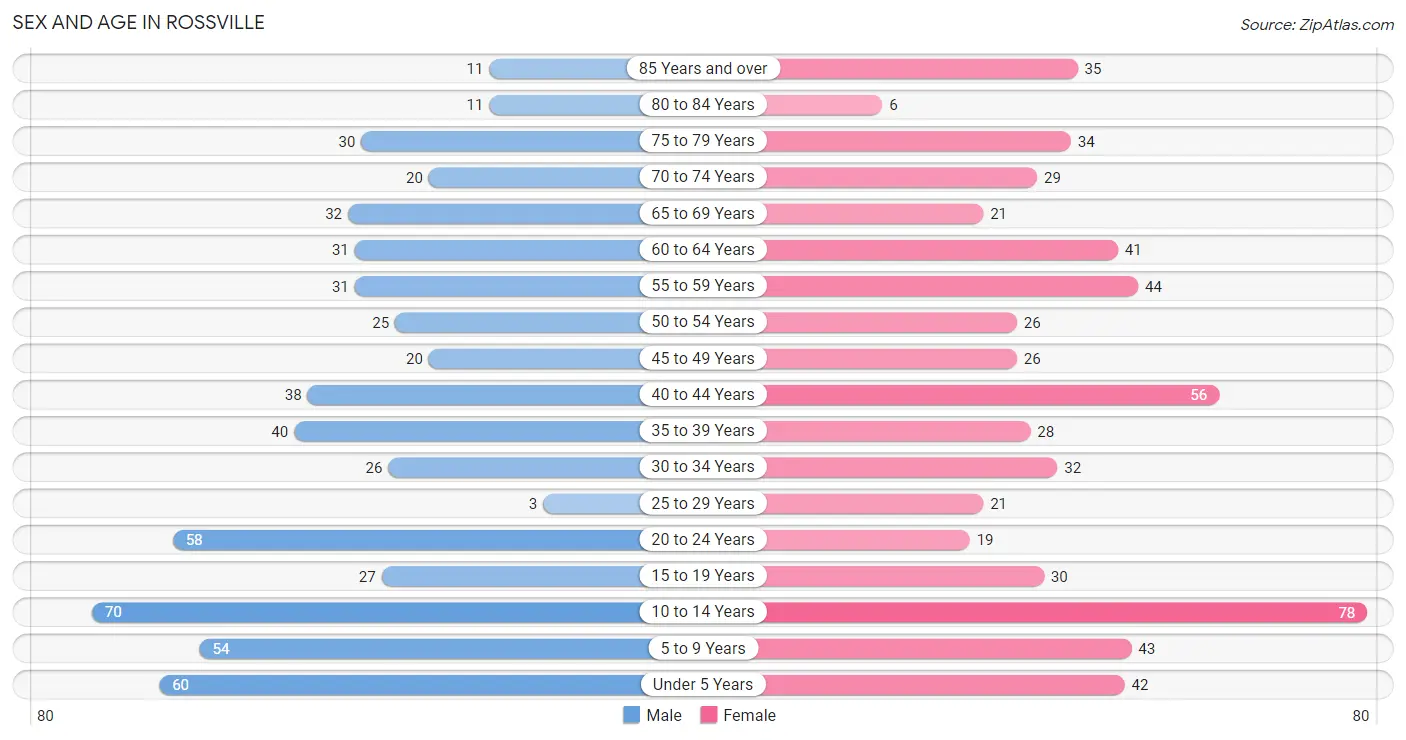
| Age Bracket | Male | Female |
| Under 5 Years | 60 (10.2%) | 42 (6.9%) |
| 5 to 9 Years | 54 (9.2%) | 43 (7.0%) |
| 10 to 14 Years | 70 (11.9%) | 78 (12.8%) |
| 15 to 19 Years | 27 (4.6%) | 30 (4.9%) |
| 20 to 24 Years | 58 (9.9%) | 19 (3.1%) |
| 25 to 29 Years | 3 (0.5%) | 21 (3.4%) |
| 30 to 34 Years | 26 (4.4%) | 32 (5.2%) |
| 35 to 39 Years | 40 (6.8%) | 28 (4.6%) |
| 40 to 44 Years | 38 (6.5%) | 56 (9.2%) |
| 45 to 49 Years | 20 (3.4%) | 26 (4.3%) |
| 50 to 54 Years | 25 (4.3%) | 26 (4.3%) |
| 55 to 59 Years | 31 (5.3%) | 44 (7.2%) |
| 60 to 64 Years | 31 (5.3%) | 41 (6.7%) |
| 65 to 69 Years | 32 (5.4%) | 21 (3.4%) |
| 70 to 74 Years | 20 (3.4%) | 29 (4.8%) |
| 75 to 79 Years | 30 (5.1%) | 34 (5.6%) |
| 80 to 84 Years | 11 (1.9%) | 6 (1.0%) |
| 85 Years and over | 11 (1.9%) | 35 (5.7%) |
| Total | 587 (100.0%) | 611 (100.0%) |
Families and Households in Rossville
Median Family Size in Rossville
The median family size in Rossville is 3.43 persons per family, with married-couple families (204 | 72.6%) accounting for the largest median family size of 3.48 persons per family. On the other hand, single male/father families (24 | 8.5%) represent the smallest median family size with 3.13 persons per family.
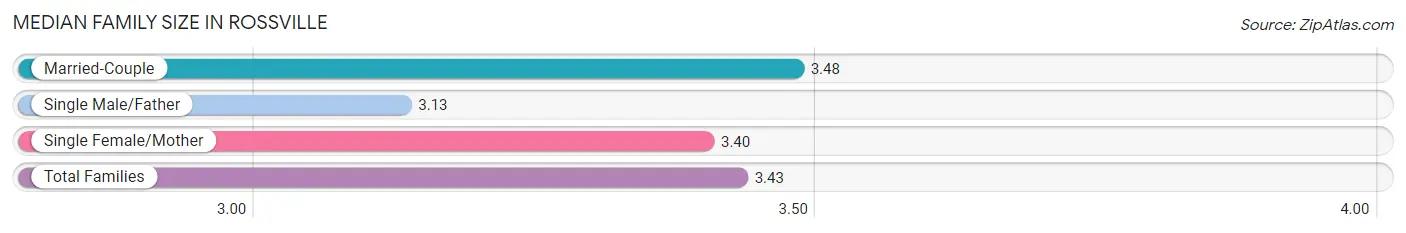
| Family Type | # Families | Family Size |
| Married-Couple | 204 (72.6%) | 3.48 |
| Single Male/Father | 24 (8.5%) | 3.13 |
| Single Female/Mother | 53 (18.9%) | 3.40 |
| Total Families | 281 (100.0%) | 3.43 |
Median Household Size in Rossville
The median household size in Rossville is 2.81 persons per household, with single male/father households (24 | 5.6%) accounting for the largest median household size of 4.08 persons per household. non-family households (145 | 34.0%) represent the smallest median household size with 1.11 persons per household.
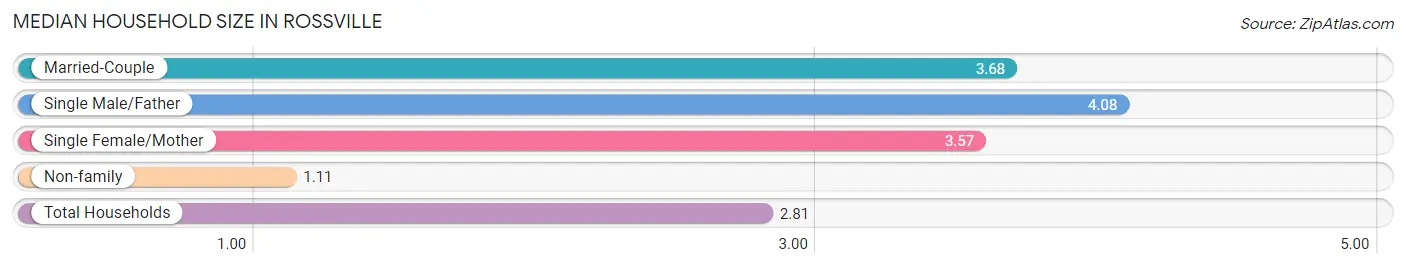
| Household Type | # Households | Household Size |
| Married-Couple | 204 (47.9%) | 3.68 |
| Single Male/Father | 24 (5.6%) | 4.08 |
| Single Female/Mother | 53 (12.4%) | 3.57 |
| Non-family | 145 (34.0%) | 1.11 |
| Total Households | 426 (100.0%) | 2.81 |
Household Size by Marriage Status in Rossville
Out of a total of 426 households in Rossville, 281 (66.0%) are family households, while 145 (34.0%) are nonfamily households. The most numerous type of family households are 2-person households, comprising 139, and the most common type of nonfamily households are 1-person households, comprising 131.
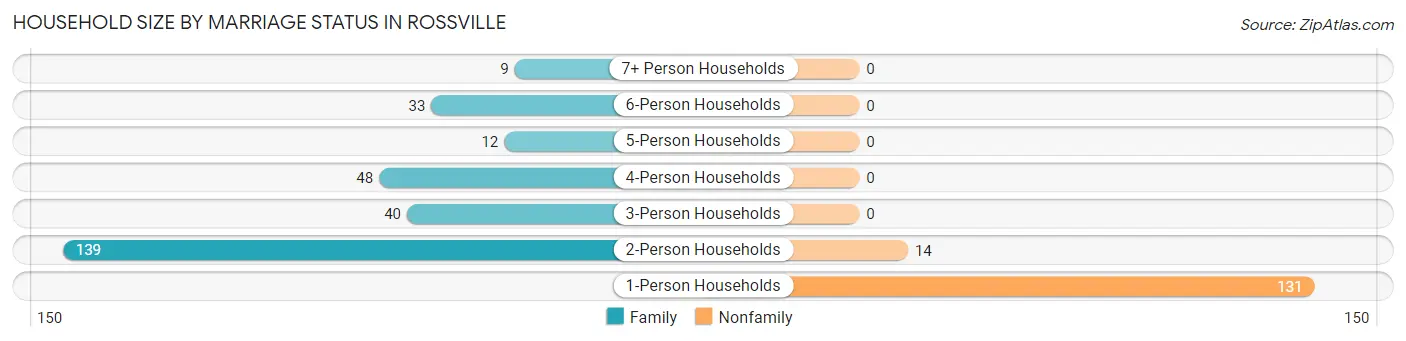
| Household Size | Family Households | Nonfamily Households |
| 1-Person Households | - | 131 (30.7%) |
| 2-Person Households | 139 (32.6%) | 14 (3.3%) |
| 3-Person Households | 40 (9.4%) | 0 (0.0%) |
| 4-Person Households | 48 (11.3%) | 0 (0.0%) |
| 5-Person Households | 12 (2.8%) | 0 (0.0%) |
| 6-Person Households | 33 (7.7%) | 0 (0.0%) |
| 7+ Person Households | 9 (2.1%) | 0 (0.0%) |
| Total | 281 (66.0%) | 145 (34.0%) |
Female Fertility in Rossville
Fertility by Age in Rossville
Average fertility rate in Rossville is 65.0 births per 1,000 women. Women in the age bracket of 15 to 19 years have the highest fertility rate with 167.0 births per 1,000 women. Women in the age bracket of 20 to 34 years acount for 64.3% of all women with births.
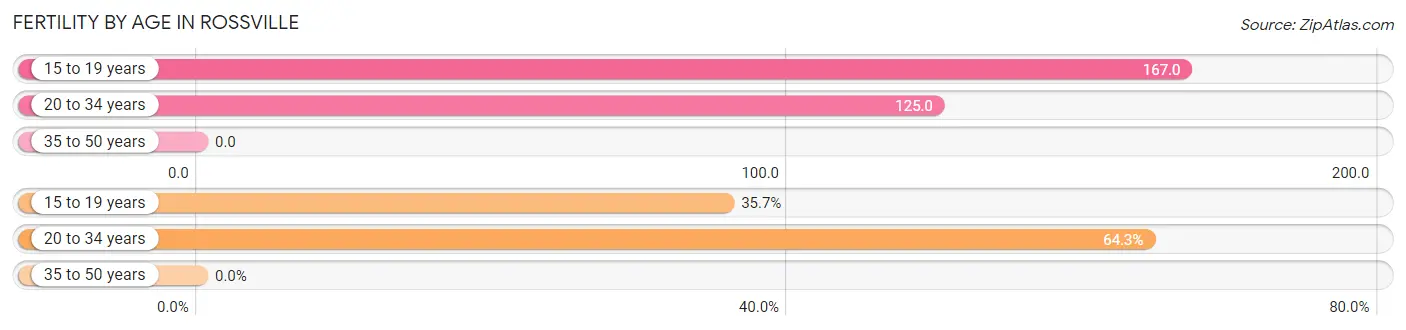
| Age Bracket | Women with Births | Births / 1,000 Women |
| 15 to 19 years | 5 (35.7%) | 167.0 |
| 20 to 34 years | 9 (64.3%) | 125.0 |
| 35 to 50 years | 0 (0.0%) | 0.0 |
| Total | 14 (100.0%) | 65.0 |
Fertility by Age by Marriage Status in Rossville
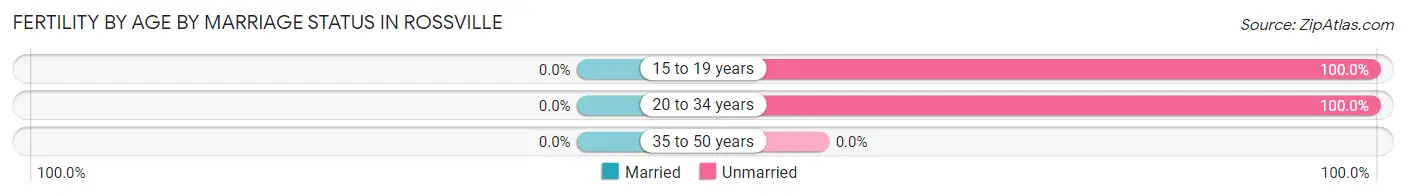
| Age Bracket | Married | Unmarried |
| 15 to 19 years | 0 (0.0%) | 5 (100.0%) |
| 20 to 34 years | 0 (0.0%) | 9 (100.0%) |
| 35 to 50 years | 0 (0.0%) | 0 (0.0%) |
| Total | 0 (0.0%) | 14 (100.0%) |
Fertility by Education in Rossville
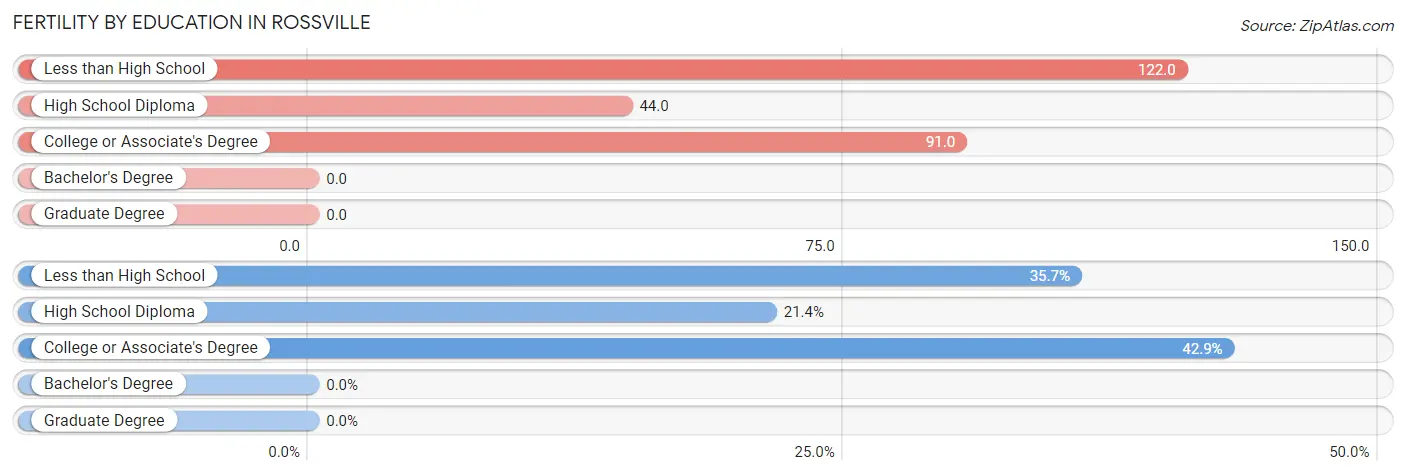
| Educational Attainment | Women with Births | Births / 1,000 Women |
| Less than High School | 5 (35.7%) | 122.0 |
| High School Diploma | 3 (21.4%) | 44.0 |
| College or Associate's Degree | 6 (42.9%) | 91.0 |
| Bachelor's Degree | 0 (0.0%) | 0.0 |
| Graduate Degree | 0 (0.0%) | 0.0 |
| Total | 14 (100.0%) | 65.0 |
Fertility by Education by Marriage Status in Rossville
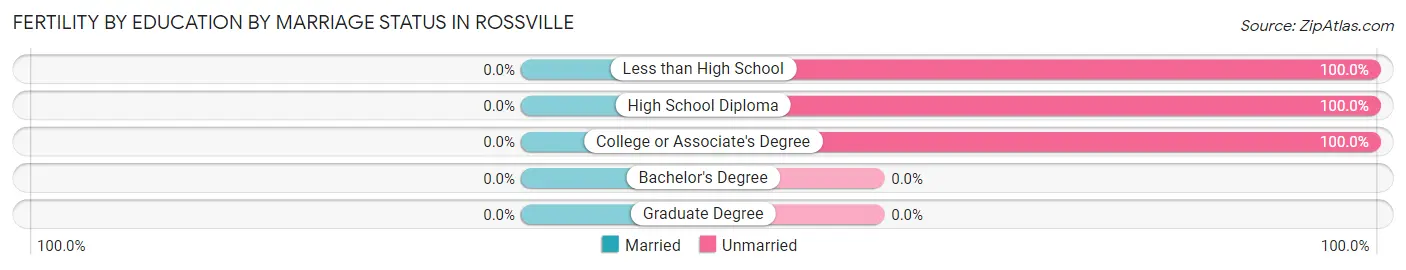
| Educational Attainment | Married | Unmarried |
| Less than High School | 0 (0.0%) | 5 (100.0%) |
| High School Diploma | 0 (0.0%) | 3 (100.0%) |
| College or Associate's Degree | 0 (0.0%) | 6 (100.0%) |
| Bachelor's Degree | 0 (0.0%) | 0 (0.0%) |
| Graduate Degree | 0 (0.0%) | 0 (0.0%) |
| Total | 0 (0.0%) | 14 (100.0%) |
Employment Characteristics in Rossville
Employment by Class of Employer in Rossville
Among the 458 employed individuals in Rossville, private company employees (310 | 67.7%), not-for-profit organizations (65 | 14.2%), and self-employed (not incorporated) (31 | 6.8%) make up the most common classes of employment.
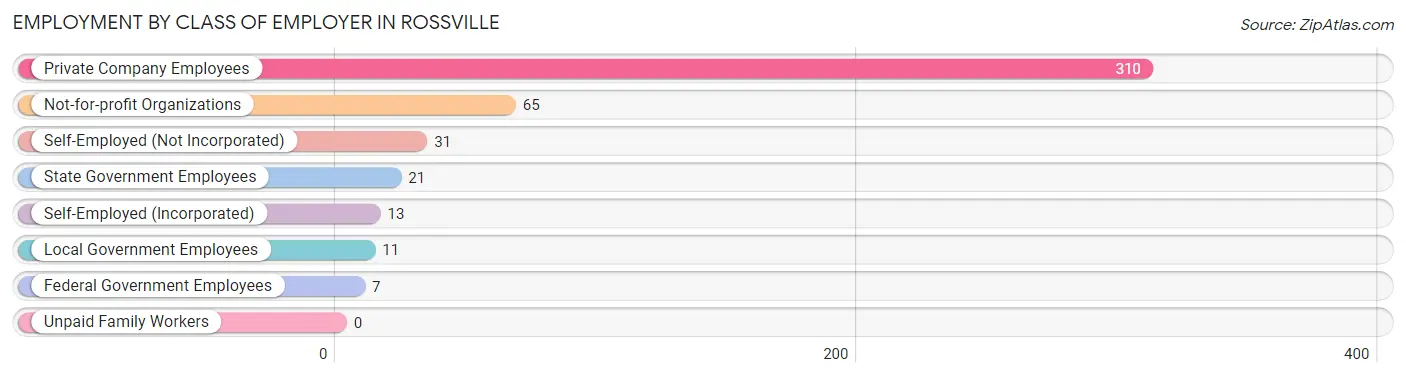
| Employer Class | # Employees | % Employees |
| Private Company Employees | 310 | 67.7% |
| Self-Employed (Incorporated) | 13 | 2.8% |
| Self-Employed (Not Incorporated) | 31 | 6.8% |
| Not-for-profit Organizations | 65 | 14.2% |
| Local Government Employees | 11 | 2.4% |
| State Government Employees | 21 | 4.6% |
| Federal Government Employees | 7 | 1.5% |
| Unpaid Family Workers | 0 | 0.0% |
| Total | 458 | 100.0% |
Employment Status by Age in Rossville
According to the labor force statistics for Rossville, out of the total population over 16 years of age (840), 60.2% or 506 individuals are in the labor force, with 2.0% or 10 of them unemployed. The age group with the highest labor force participation rate is 25 to 29 years, with 100.0% or 24 individuals in the labor force. Within the labor force, the 30 to 34 years age range has the highest percentage of unemployed individuals, with 8.2% or 4 of them being unemployed.
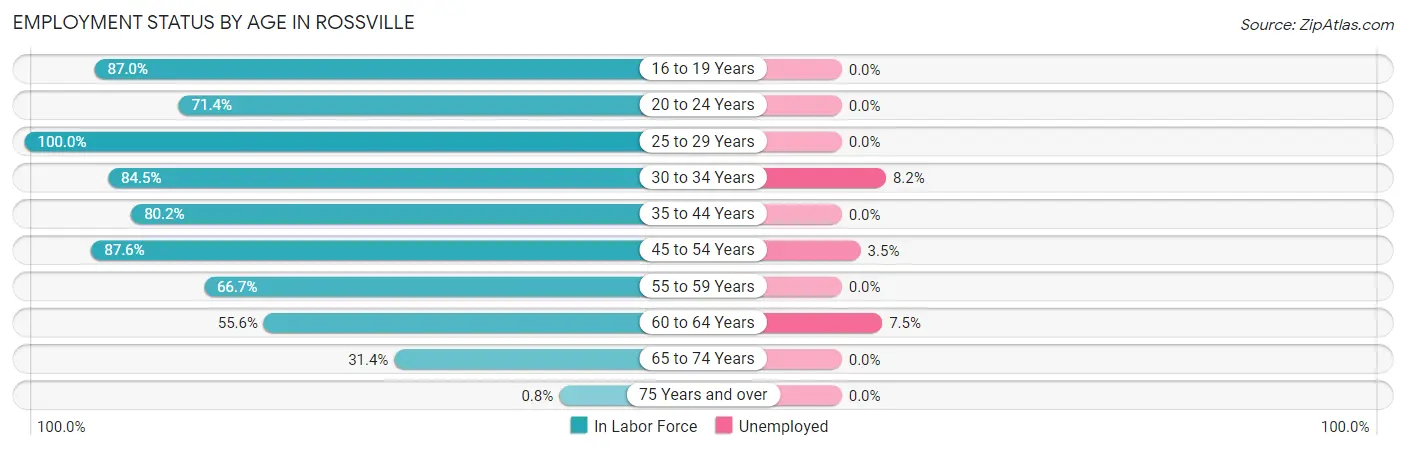
| Age Bracket | In Labor Force | Unemployed |
| 16 to 19 Years | 40 (87.0%) | 0 (0.0%) |
| 20 to 24 Years | 55 (71.4%) | 0 (0.0%) |
| 25 to 29 Years | 24 (100.0%) | 0 (0.0%) |
| 30 to 34 Years | 49 (84.5%) | 4 (8.2%) |
| 35 to 44 Years | 130 (80.2%) | 0 (0.0%) |
| 45 to 54 Years | 85 (87.6%) | 3 (3.5%) |
| 55 to 59 Years | 50 (66.7%) | 0 (0.0%) |
| 60 to 64 Years | 40 (55.6%) | 3 (7.5%) |
| 65 to 74 Years | 32 (31.4%) | 0 (0.0%) |
| 75 Years and over | 1 (0.8%) | 0 (0.0%) |
| Total | 506 (60.2%) | 10 (2.0%) |
Employment Status by Educational Attainment in Rossville
According to labor force statistics for Rossville, 77.5% of individuals (378) out of the total population between 25 and 64 years of age (488) are in the labor force, with 2.6% or 10 of them being unemployed. The group with the highest labor force participation rate are those with the educational attainment of college / associate degree, with 86.4% or 152 individuals in the labor force. Within the labor force, individuals with less than high school education have the highest percentage of unemployment, with 13.6% or 3 of them being unemployed.
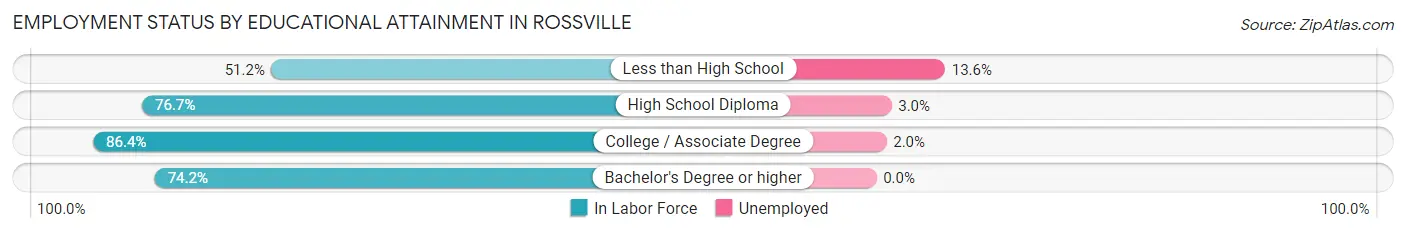
| Educational Attainment | In Labor Force | Unemployed |
| Less than High School | 22 (51.2%) | 6 (13.6%) |
| High School Diploma | 132 (76.7%) | 5 (3.0%) |
| College / Associate Degree | 152 (86.4%) | 4 (2.0%) |
| Bachelor's Degree or higher | 72 (74.2%) | 0 (0.0%) |
| Total | 378 (77.5%) | 13 (2.6%) |
Employment Occupations by Sex in Rossville
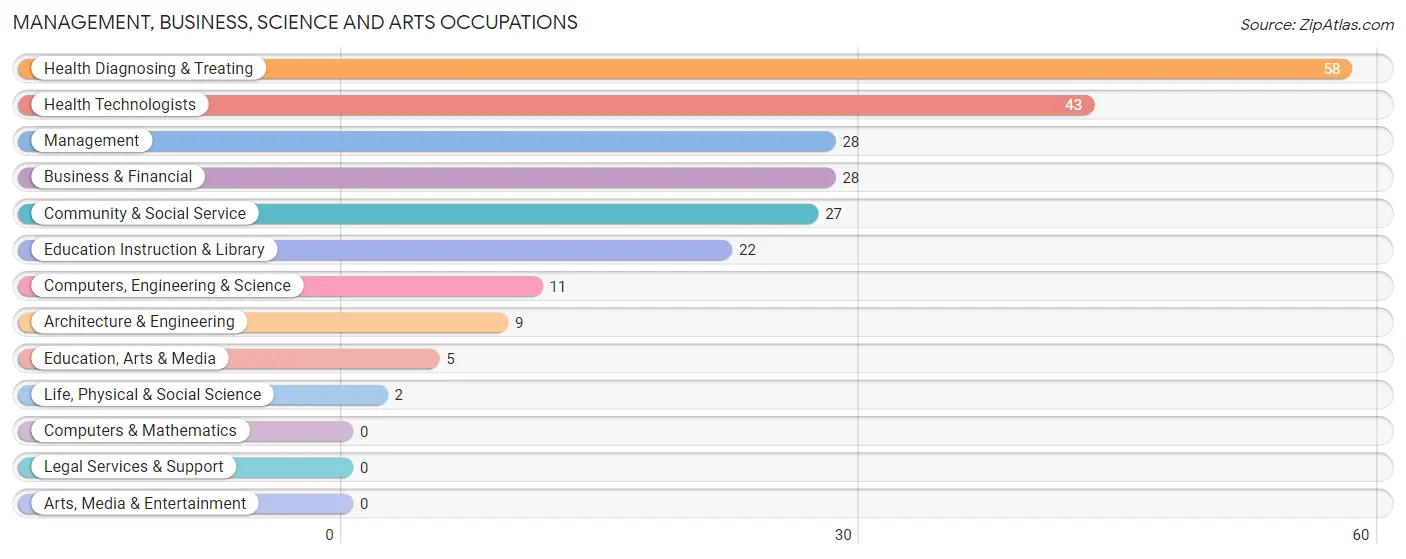
Management, Business, Science and Arts Occupations
The most common Management, Business, Science and Arts occupations in Rossville are Health Diagnosing & Treating (58 | 11.7%), Health Technologists (43 | 8.7%), Management (28 | 5.7%), Business & Financial (28 | 5.7%), and Community & Social Service (27 | 5.4%).
Management, Business, Science and Arts Occupations by Sex
Within the Management, Business, Science and Arts occupations in Rossville, the most male-oriented occupations are Computers, Engineering & Science (100.0%), Architecture & Engineering (100.0%), and Life, Physical & Social Science (100.0%), while the most female-oriented occupations are Health Diagnosing & Treating (100.0%), Health Technologists (100.0%), and Education Instruction & Library (77.3%).
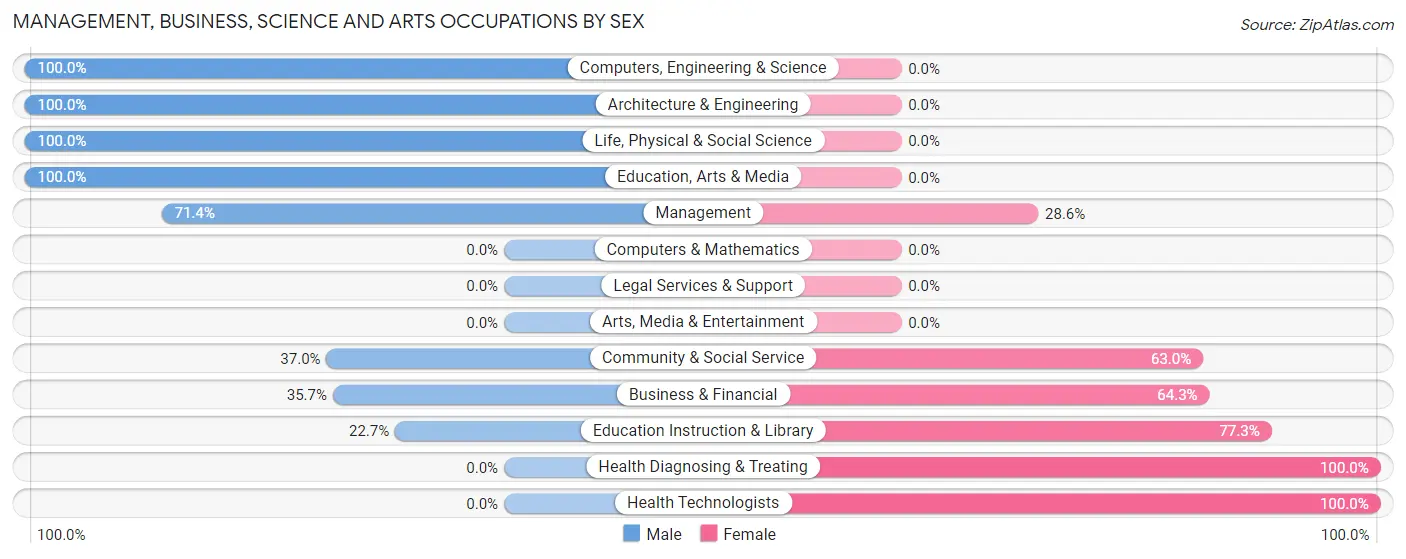
| Occupation | Male | Female |
| Management | 20 (71.4%) | 8 (28.6%) |
| Business & Financial | 10 (35.7%) | 18 (64.3%) |
| Computers, Engineering & Science | 11 (100.0%) | 0 (0.0%) |
| Computers & Mathematics | 0 (0.0%) | 0 (0.0%) |
| Architecture & Engineering | 9 (100.0%) | 0 (0.0%) |
| Life, Physical & Social Science | 2 (100.0%) | 0 (0.0%) |
| Community & Social Service | 10 (37.0%) | 17 (63.0%) |
| Education, Arts & Media | 5 (100.0%) | 0 (0.0%) |
| Legal Services & Support | 0 (0.0%) | 0 (0.0%) |
| Education Instruction & Library | 5 (22.7%) | 17 (77.3%) |
| Arts, Media & Entertainment | 0 (0.0%) | 0 (0.0%) |
| Health Diagnosing & Treating | 0 (0.0%) | 58 (100.0%) |
| Health Technologists | 0 (0.0%) | 43 (100.0%) |
| Total (Category) | 51 (33.6%) | 101 (66.4%) |
| Total (Overall) | 242 (48.8%) | 254 (51.2%) |
Services Occupations
The most common Services occupations in Rossville are Food Preparation & Serving (35 | 7.1%), Personal Care & Service (22 | 4.4%), Healthcare Support (16 | 3.2%), Cleaning & Maintenance (12 | 2.4%), and Security & Protection (2 | 0.4%).
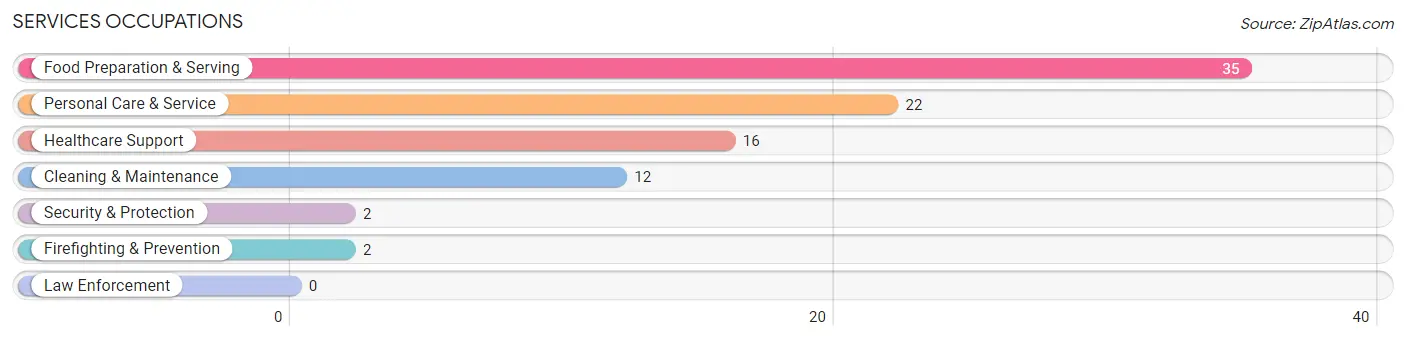
Services Occupations by Sex
Within the Services occupations in Rossville, the most male-oriented occupations are Security & Protection (100.0%), Firefighting & Prevention (100.0%), and Cleaning & Maintenance (58.3%), while the most female-oriented occupations are Healthcare Support (100.0%), Personal Care & Service (68.2%), and Food Preparation & Serving (48.6%).
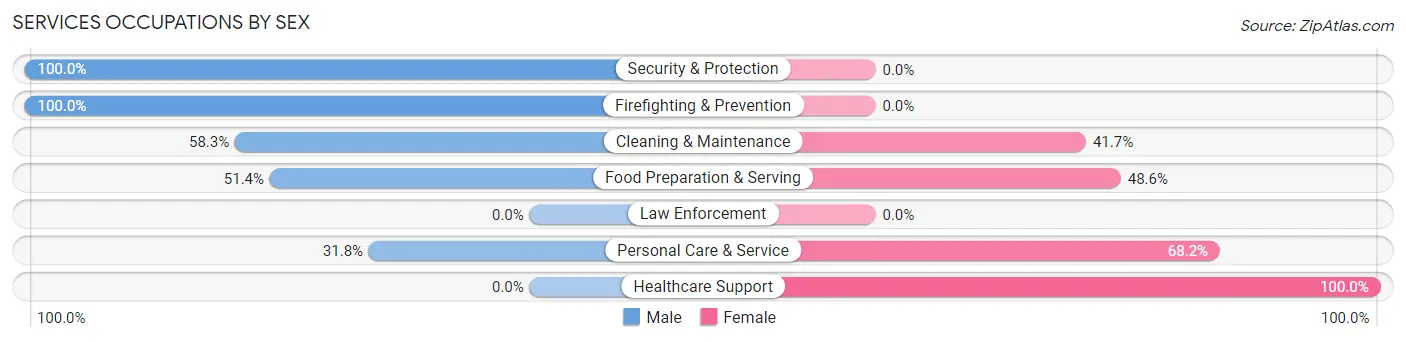
| Occupation | Male | Female |
| Healthcare Support | 0 (0.0%) | 16 (100.0%) |
| Security & Protection | 2 (100.0%) | 0 (0.0%) |
| Firefighting & Prevention | 2 (100.0%) | 0 (0.0%) |
| Law Enforcement | 0 (0.0%) | 0 (0.0%) |
| Food Preparation & Serving | 18 (51.4%) | 17 (48.6%) |
| Cleaning & Maintenance | 7 (58.3%) | 5 (41.7%) |
| Personal Care & Service | 7 (31.8%) | 15 (68.2%) |
| Total (Category) | 34 (39.1%) | 53 (60.9%) |
| Total (Overall) | 242 (48.8%) | 254 (51.2%) |
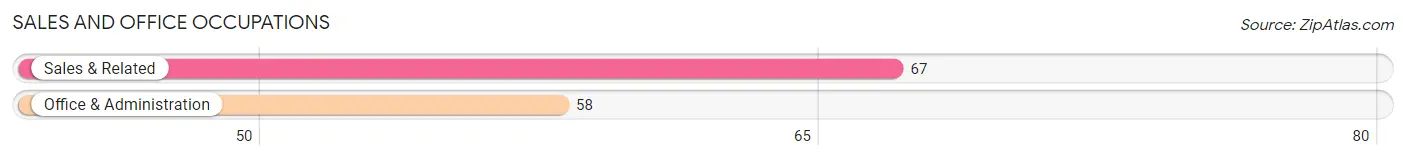
Sales and Office Occupations
The most common Sales and Office occupations in Rossville are Sales & Related (67 | 13.5%), and Office & Administration (58 | 11.7%).
Sales and Office Occupations by Sex

| Occupation | Male | Female |
| Sales & Related | 33 (49.2%) | 34 (50.7%) |
| Office & Administration | 11 (19.0%) | 47 (81.0%) |
| Total (Category) | 44 (35.2%) | 81 (64.8%) |
| Total (Overall) | 242 (48.8%) | 254 (51.2%) |
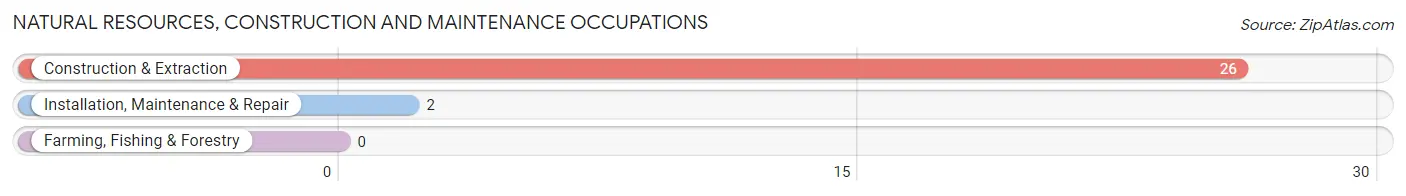
Natural Resources, Construction and Maintenance Occupations
The most common Natural Resources, Construction and Maintenance occupations in Rossville are Construction & Extraction (26 | 5.2%), and Installation, Maintenance & Repair (2 | 0.4%).
Natural Resources, Construction and Maintenance Occupations by Sex
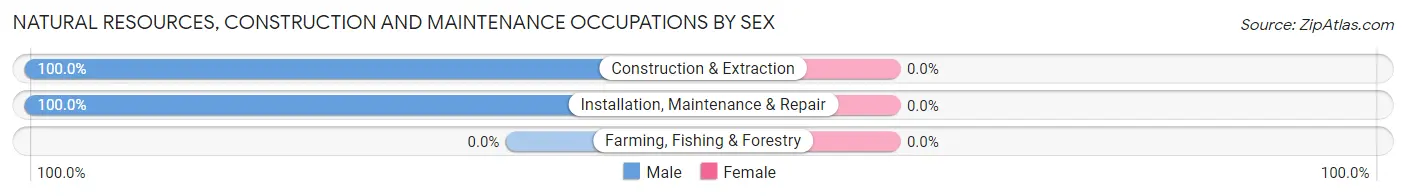
| Occupation | Male | Female |
| Farming, Fishing & Forestry | 0 (0.0%) | 0 (0.0%) |
| Construction & Extraction | 26 (100.0%) | 0 (0.0%) |
| Installation, Maintenance & Repair | 2 (100.0%) | 0 (0.0%) |
| Total (Category) | 28 (100.0%) | 0 (0.0%) |
| Total (Overall) | 242 (48.8%) | 254 (51.2%) |
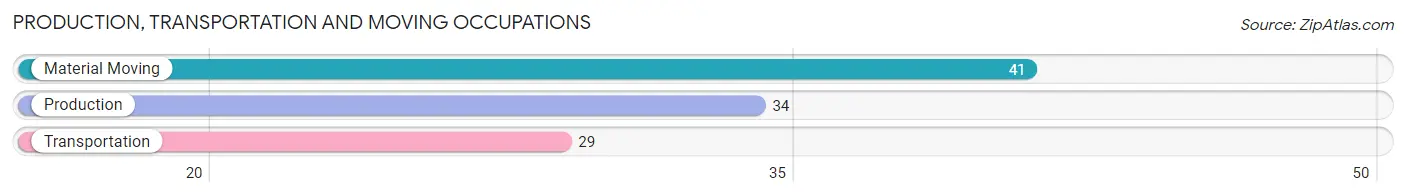
Production, Transportation and Moving Occupations
The most common Production, Transportation and Moving occupations in Rossville are Material Moving (41 | 8.3%), Production (34 | 6.9%), and Transportation (29 | 5.9%).
Production, Transportation and Moving Occupations by Sex
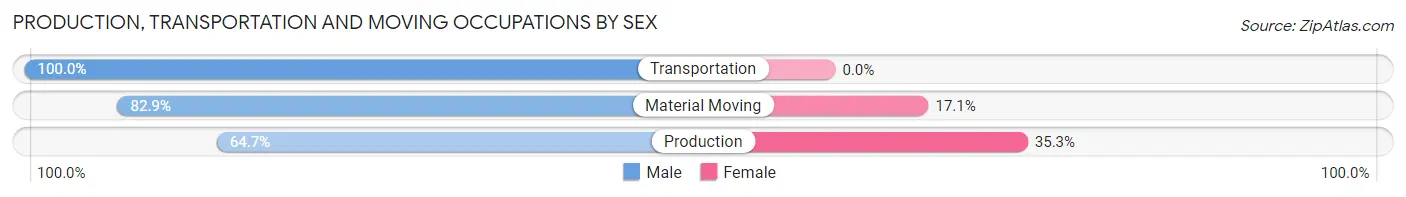
| Occupation | Male | Female |
| Production | 22 (64.7%) | 12 (35.3%) |
| Transportation | 29 (100.0%) | 0 (0.0%) |
| Material Moving | 34 (82.9%) | 7 (17.1%) |
| Total (Category) | 85 (81.7%) | 19 (18.3%) |
| Total (Overall) | 242 (48.8%) | 254 (51.2%) |
Employment Industries by Sex in Rossville
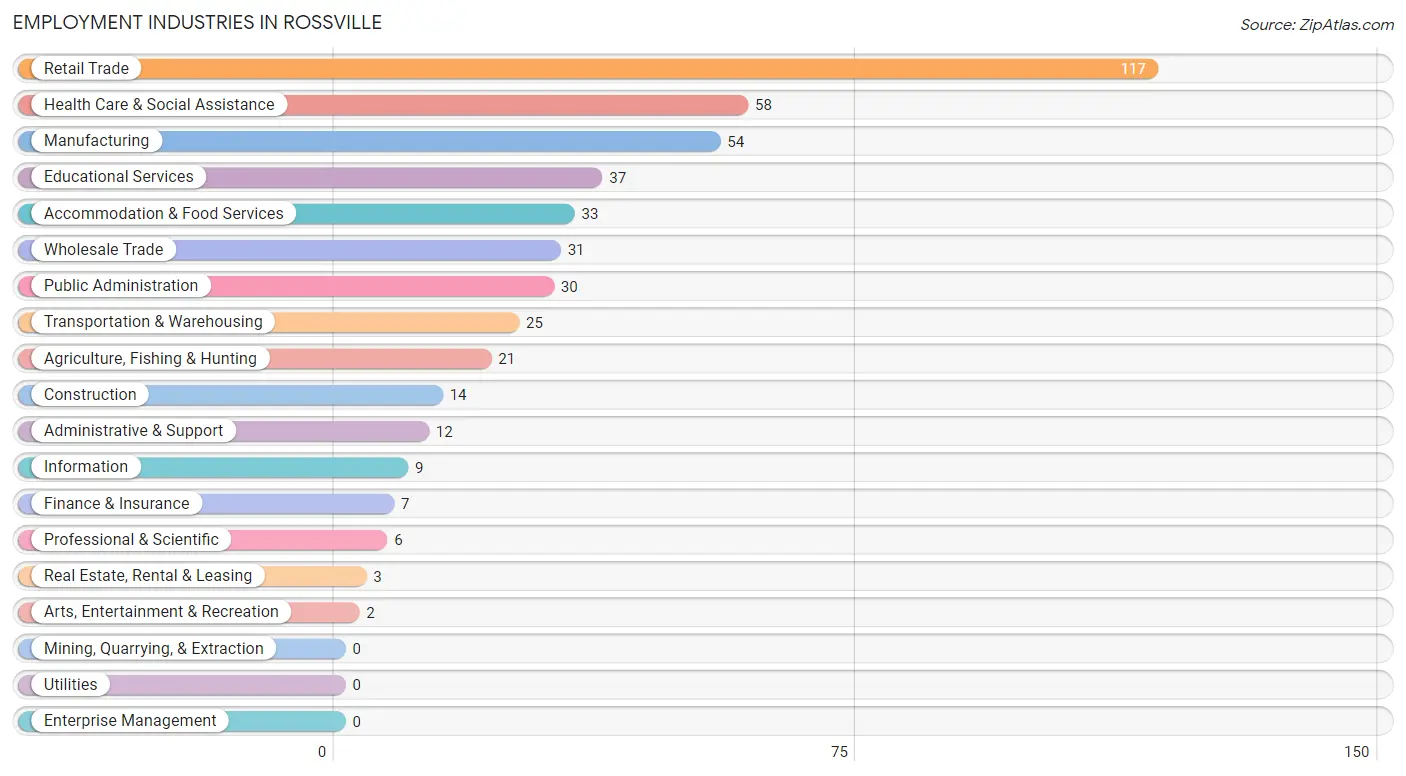
Employment Industries in Rossville
The major employment industries in Rossville include Retail Trade (117 | 23.6%), Health Care & Social Assistance (58 | 11.7%), Manufacturing (54 | 10.9%), Educational Services (37 | 7.5%), and Accommodation & Food Services (33 | 6.7%).
Employment Industries by Sex in Rossville
The Rossville industries that see more men than women are Agriculture, Fishing & Hunting (100.0%), Construction (100.0%), and Information (100.0%), whereas the industries that tend to have a higher number of women are Professional & Scientific (100.0%), Health Care & Social Assistance (100.0%), and Arts, Entertainment & Recreation (100.0%).
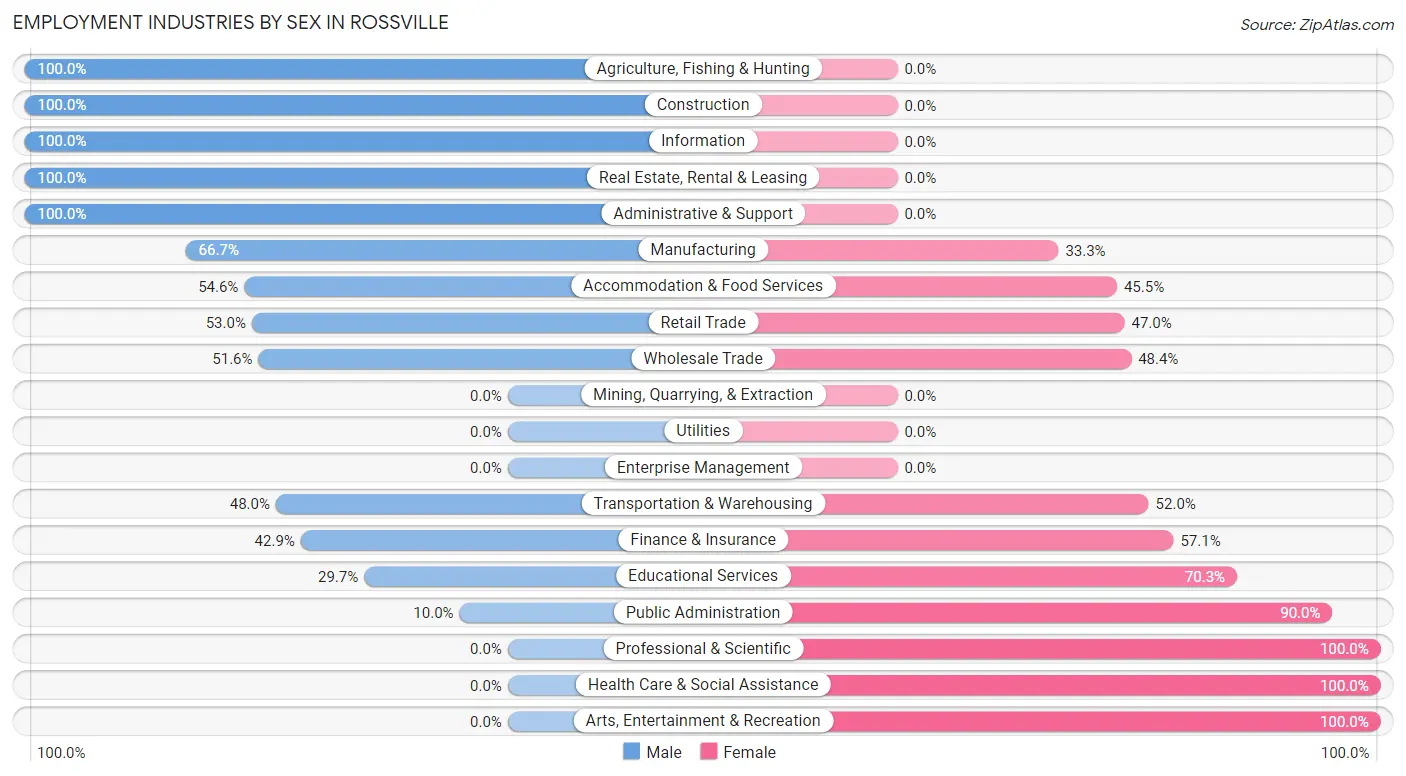
| Industry | Male | Female |
| Agriculture, Fishing & Hunting | 21 (100.0%) | 0 (0.0%) |
| Mining, Quarrying, & Extraction | 0 (0.0%) | 0 (0.0%) |
| Construction | 14 (100.0%) | 0 (0.0%) |
| Manufacturing | 36 (66.7%) | 18 (33.3%) |
| Wholesale Trade | 16 (51.6%) | 15 (48.4%) |
| Retail Trade | 62 (53.0%) | 55 (47.0%) |
| Transportation & Warehousing | 12 (48.0%) | 13 (52.0%) |
| Utilities | 0 (0.0%) | 0 (0.0%) |
| Information | 9 (100.0%) | 0 (0.0%) |
| Finance & Insurance | 3 (42.9%) | 4 (57.1%) |
| Real Estate, Rental & Leasing | 3 (100.0%) | 0 (0.0%) |
| Professional & Scientific | 0 (0.0%) | 6 (100.0%) |
| Enterprise Management | 0 (0.0%) | 0 (0.0%) |
| Administrative & Support | 12 (100.0%) | 0 (0.0%) |
| Educational Services | 11 (29.7%) | 26 (70.3%) |
| Health Care & Social Assistance | 0 (0.0%) | 58 (100.0%) |
| Arts, Entertainment & Recreation | 0 (0.0%) | 2 (100.0%) |
| Accommodation & Food Services | 18 (54.5%) | 15 (45.5%) |
| Public Administration | 3 (10.0%) | 27 (90.0%) |
| Total | 242 (48.8%) | 254 (51.2%) |
Education in Rossville
School Enrollment in Rossville
The most common levels of schooling among the 324 students in Rossville are middle school (112 | 34.6%), elementary school (84 | 25.9%), and high school (53 | 16.4%).
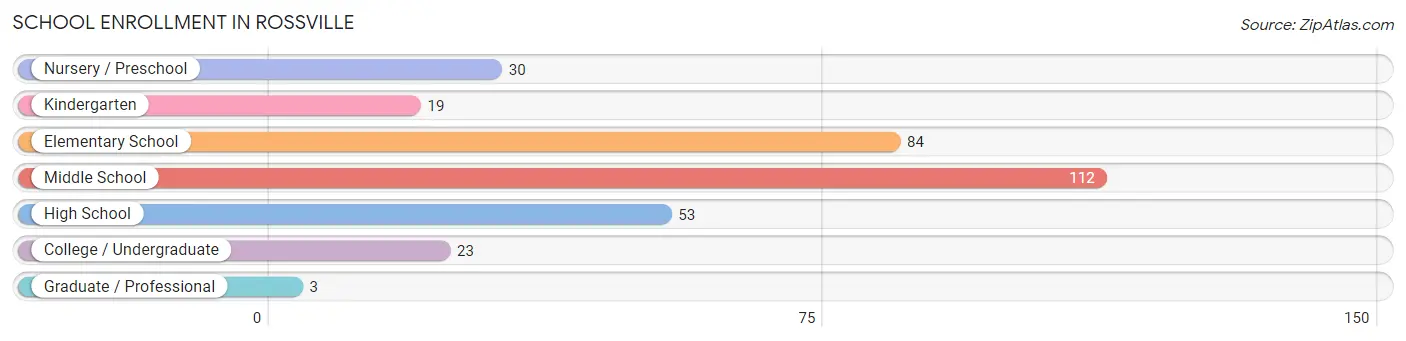
| School Level | # Students | % Students |
| Nursery / Preschool | 30 | 9.3% |
| Kindergarten | 19 | 5.9% |
| Elementary School | 84 | 25.9% |
| Middle School | 112 | 34.6% |
| High School | 53 | 16.4% |
| College / Undergraduate | 23 | 7.1% |
| Graduate / Professional | 3 | 0.9% |
| Total | 324 | 100.0% |
School Enrollment by Age by Funding Source in Rossville
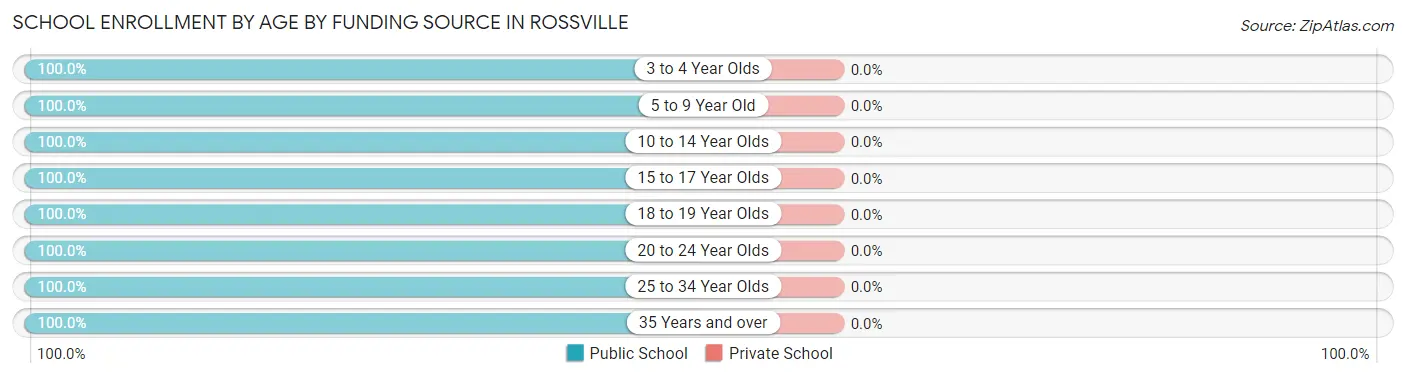
| Age Bracket | Public School | Private School |
| 3 to 4 Year Olds | 28 (100.0%) | 0 (0.0%) |
| 5 to 9 Year Old | 97 (100.0%) | 0 (0.0%) |
| 10 to 14 Year Olds | 148 (100.0%) | 0 (0.0%) |
| 15 to 17 Year Olds | 14 (100.0%) | 0 (0.0%) |
| 18 to 19 Year Olds | 11 (100.0%) | 0 (0.0%) |
| 20 to 24 Year Olds | 9 (100.0%) | 0 (0.0%) |
| 25 to 34 Year Olds | 6 (100.0%) | 0 (0.0%) |
| 35 Years and over | 11 (100.0%) | 0 (0.0%) |
| Total | 324 (100.0%) | 0 (0.0%) |
Educational Attainment by Field of Study in Rossville
Education (39 | 28.1%), science & technology (38 | 27.3%), social sciences (17 | 12.2%), business (11 | 7.9%), and bio, nature & agricultural (7 | 5.0%) are the most common fields of study among 139 individuals in Rossville who have obtained a bachelor's degree or higher.
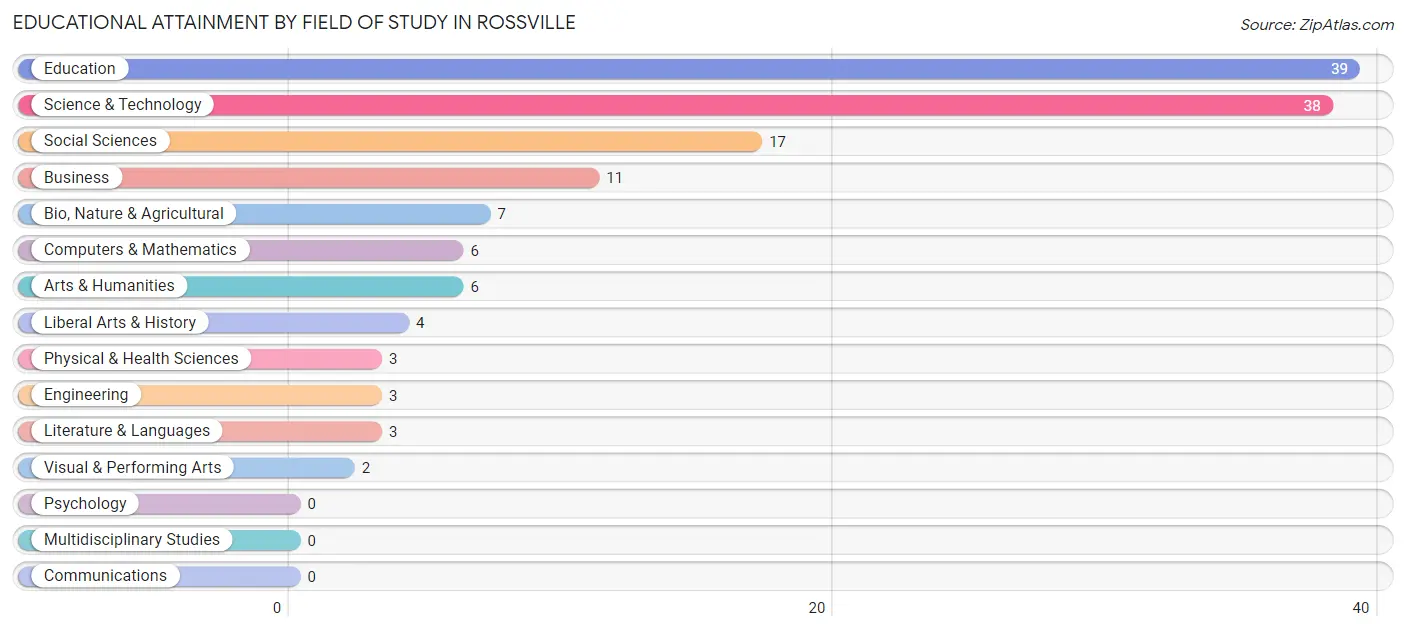
| Field of Study | # Graduates | % Graduates |
| Computers & Mathematics | 6 | 4.3% |
| Bio, Nature & Agricultural | 7 | 5.0% |
| Physical & Health Sciences | 3 | 2.2% |
| Psychology | 0 | 0.0% |
| Social Sciences | 17 | 12.2% |
| Engineering | 3 | 2.2% |
| Multidisciplinary Studies | 0 | 0.0% |
| Science & Technology | 38 | 27.3% |
| Business | 11 | 7.9% |
| Education | 39 | 28.1% |
| Literature & Languages | 3 | 2.2% |
| Liberal Arts & History | 4 | 2.9% |
| Visual & Performing Arts | 2 | 1.4% |
| Communications | 0 | 0.0% |
| Arts & Humanities | 6 | 4.3% |
| Total | 139 | 100.0% |
Transportation & Commute in Rossville
Vehicle Availability by Sex in Rossville
The most prevalent vehicle ownership categories in Rossville are males with 2 vehicles (128, accounting for 54.5%) and females with 2 vehicles (113, making up 57.4%).
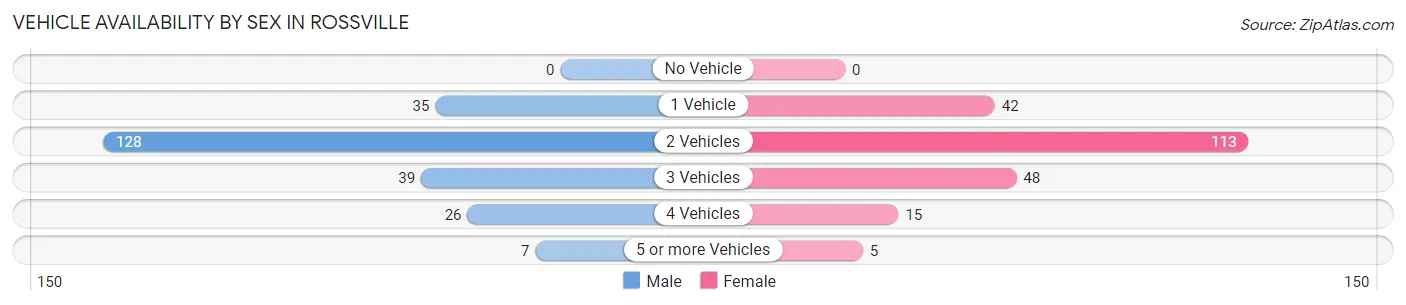
| Vehicles Available | Male | Female |
| No Vehicle | 0 (0.0%) | 0 (0.0%) |
| 1 Vehicle | 35 (14.9%) | 42 (18.8%) |
| 2 Vehicles | 128 (54.5%) | 113 (50.7%) |
| 3 Vehicles | 39 (16.6%) | 48 (21.5%) |
| 4 Vehicles | 26 (11.1%) | 15 (6.7%) |
| 5 or more Vehicles | 7 (3.0%) | 5 (2.2%) |
| Total | 235 (100.0%) | 223 (100.0%) |
Commute Time in Rossville
The most frequently occuring commute durations in Rossville are 30 to 34 minutes (130 commuters, 30.7%), 15 to 19 minutes (66 commuters, 15.6%), and 10 to 14 minutes (47 commuters, 11.1%).
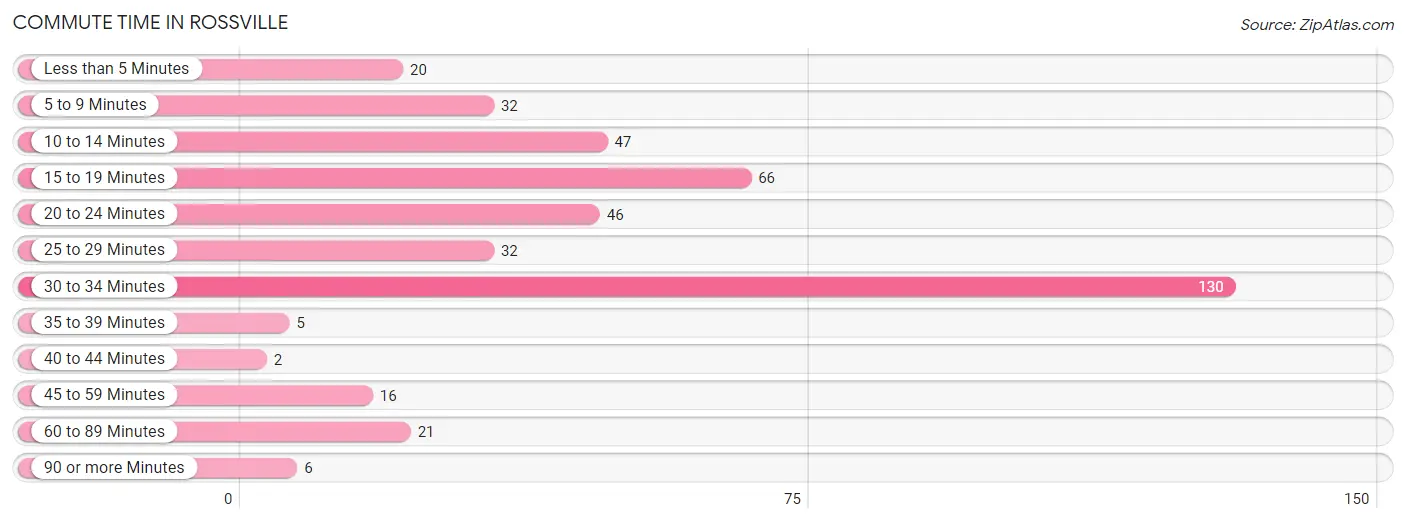
| Commute Time | # Commuters | % Commuters |
| Less than 5 Minutes | 20 | 4.7% |
| 5 to 9 Minutes | 32 | 7.6% |
| 10 to 14 Minutes | 47 | 11.1% |
| 15 to 19 Minutes | 66 | 15.6% |
| 20 to 24 Minutes | 46 | 10.9% |
| 25 to 29 Minutes | 32 | 7.6% |
| 30 to 34 Minutes | 130 | 30.7% |
| 35 to 39 Minutes | 5 | 1.2% |
| 40 to 44 Minutes | 2 | 0.5% |
| 45 to 59 Minutes | 16 | 3.8% |
| 60 to 89 Minutes | 21 | 5.0% |
| 90 or more Minutes | 6 | 1.4% |
Commute Time by Sex in Rossville
The most common commute times in Rossville are 30 to 34 minutes (78 commuters, 34.5%) for males and 30 to 34 minutes (52 commuters, 26.4%) for females.
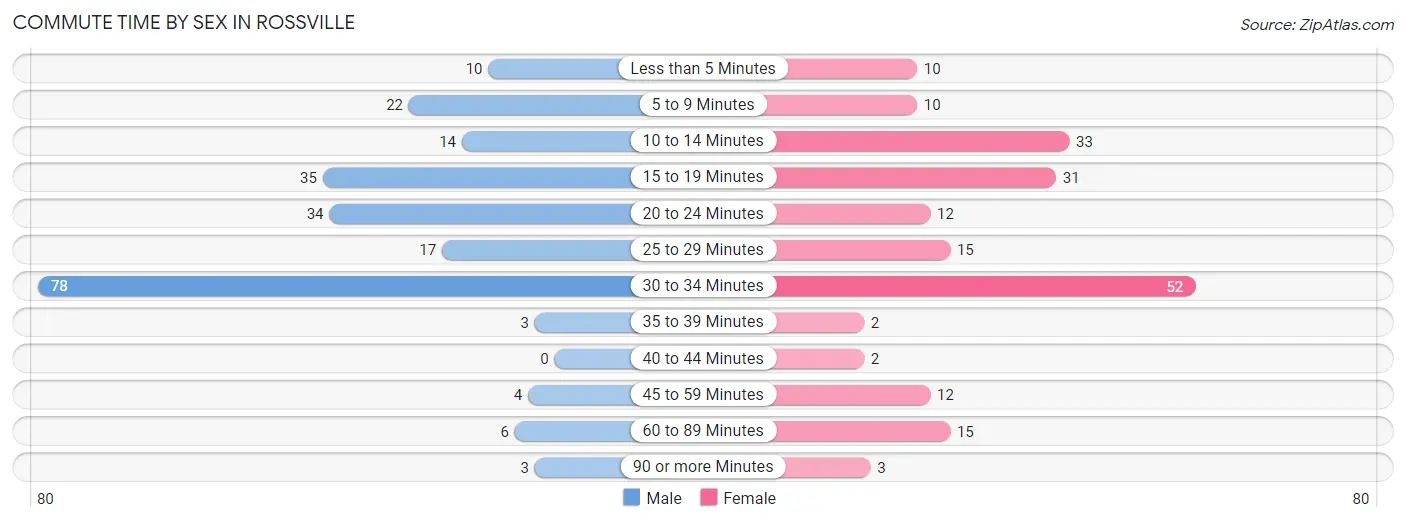
| Commute Time | Male | Female |
| Less than 5 Minutes | 10 (4.4%) | 10 (5.1%) |
| 5 to 9 Minutes | 22 (9.7%) | 10 (5.1%) |
| 10 to 14 Minutes | 14 (6.2%) | 33 (16.8%) |
| 15 to 19 Minutes | 35 (15.5%) | 31 (15.7%) |
| 20 to 24 Minutes | 34 (15.0%) | 12 (6.1%) |
| 25 to 29 Minutes | 17 (7.5%) | 15 (7.6%) |
| 30 to 34 Minutes | 78 (34.5%) | 52 (26.4%) |
| 35 to 39 Minutes | 3 (1.3%) | 2 (1.0%) |
| 40 to 44 Minutes | 0 (0.0%) | 2 (1.0%) |
| 45 to 59 Minutes | 4 (1.8%) | 12 (6.1%) |
| 60 to 89 Minutes | 6 (2.6%) | 15 (7.6%) |
| 90 or more Minutes | 3 (1.3%) | 3 (1.5%) |
Time of Departure to Work by Sex in Rossville
The most frequent times of departure to work in Rossville are 7:00 AM to 7:29 AM (74, 32.7%) for males and 12:00 PM to 3:59 PM (34, 17.3%) for females.
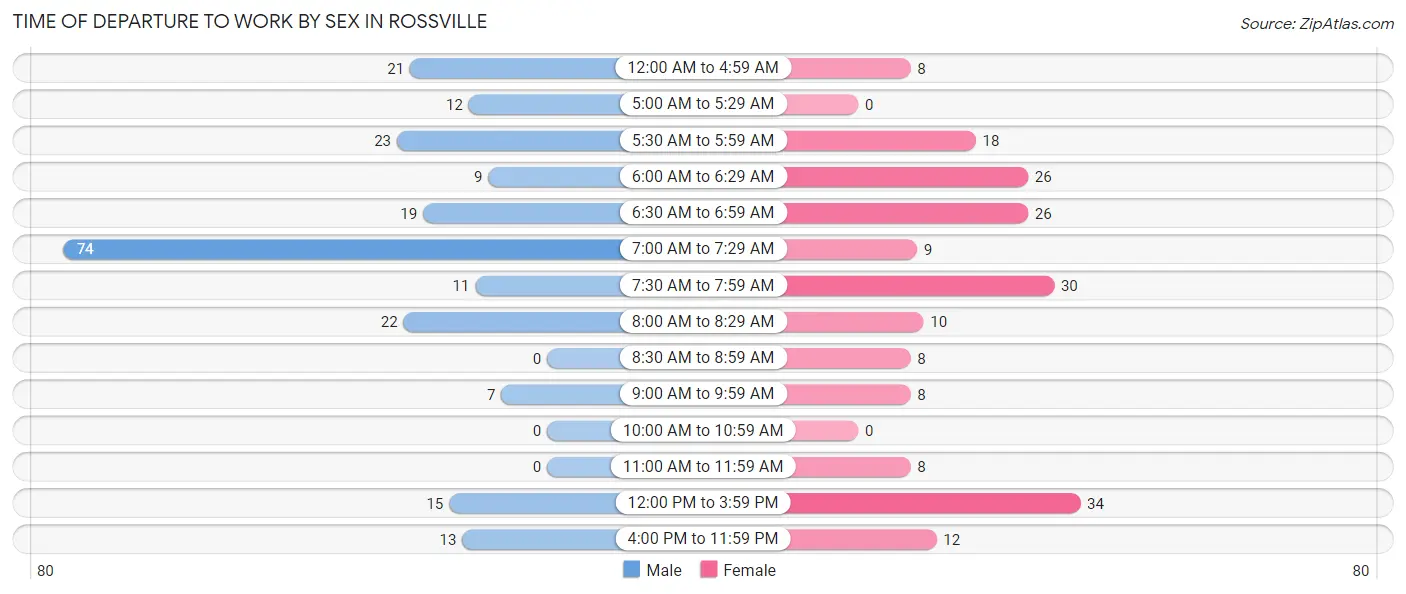
| Time of Departure | Male | Female |
| 12:00 AM to 4:59 AM | 21 (9.3%) | 8 (4.1%) |
| 5:00 AM to 5:29 AM | 12 (5.3%) | 0 (0.0%) |
| 5:30 AM to 5:59 AM | 23 (10.2%) | 18 (9.1%) |
| 6:00 AM to 6:29 AM | 9 (4.0%) | 26 (13.2%) |
| 6:30 AM to 6:59 AM | 19 (8.4%) | 26 (13.2%) |
| 7:00 AM to 7:29 AM | 74 (32.7%) | 9 (4.6%) |
| 7:30 AM to 7:59 AM | 11 (4.9%) | 30 (15.2%) |
| 8:00 AM to 8:29 AM | 22 (9.7%) | 10 (5.1%) |
| 8:30 AM to 8:59 AM | 0 (0.0%) | 8 (4.1%) |
| 9:00 AM to 9:59 AM | 7 (3.1%) | 8 (4.1%) |
| 10:00 AM to 10:59 AM | 0 (0.0%) | 0 (0.0%) |
| 11:00 AM to 11:59 AM | 0 (0.0%) | 8 (4.1%) |
| 12:00 PM to 3:59 PM | 15 (6.6%) | 34 (17.3%) |
| 4:00 PM to 11:59 PM | 13 (5.8%) | 12 (6.1%) |
| Total | 226 (100.0%) | 197 (100.0%) |
Housing Occupancy in Rossville
Occupancy by Ownership in Rossville
Of the total 426 dwellings in Rossville, owner-occupied units account for 325 (76.3%), while renter-occupied units make up 101 (23.7%).
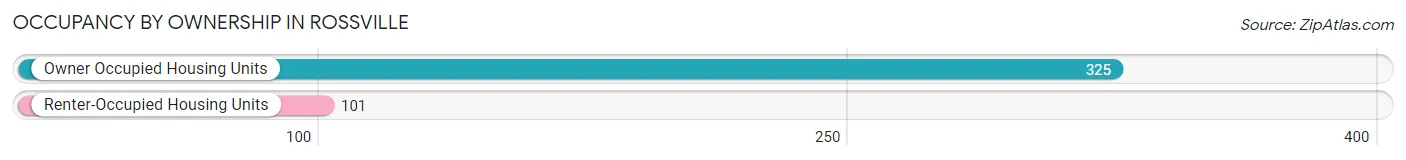
| Occupancy | # Housing Units | % Housing Units |
| Owner Occupied Housing Units | 325 | 76.3% |
| Renter-Occupied Housing Units | 101 | 23.7% |
| Total Occupied Housing Units | 426 | 100.0% |
Occupancy by Household Size in Rossville
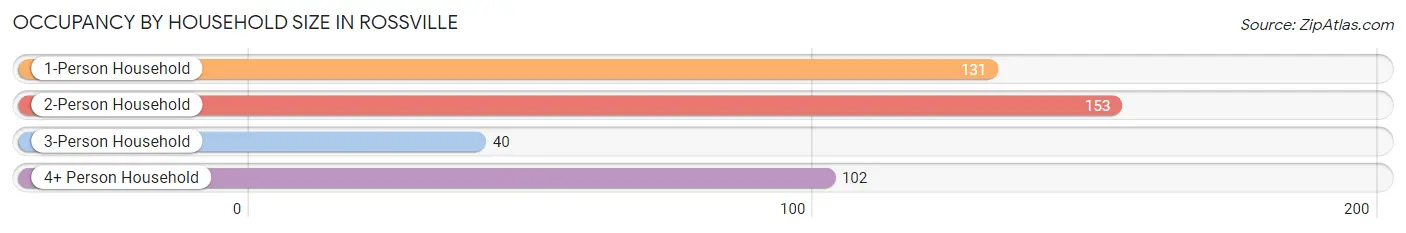
| Household Size | # Housing Units | % Housing Units |
| 1-Person Household | 131 | 30.7% |
| 2-Person Household | 153 | 35.9% |
| 3-Person Household | 40 | 9.4% |
| 4+ Person Household | 102 | 23.9% |
| Total Housing Units | 426 | 100.0% |
Occupancy by Ownership by Household Size in Rossville
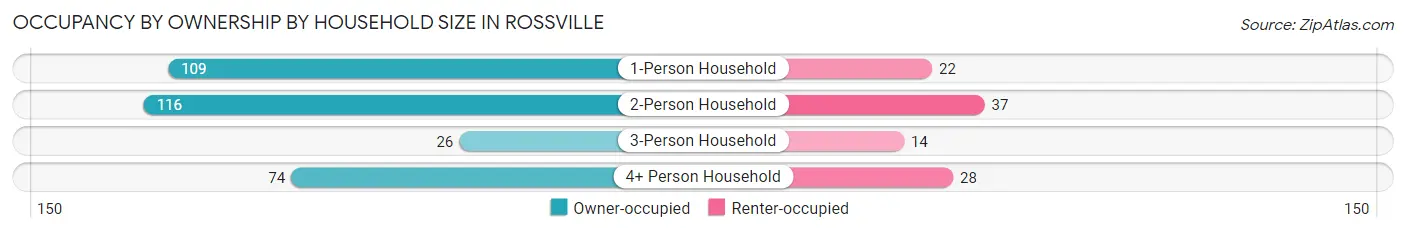
| Household Size | Owner-occupied | Renter-occupied |
| 1-Person Household | 109 (83.2%) | 22 (16.8%) |
| 2-Person Household | 116 (75.8%) | 37 (24.2%) |
| 3-Person Household | 26 (65.0%) | 14 (35.0%) |
| 4+ Person Household | 74 (72.6%) | 28 (27.5%) |
| Total Housing Units | 325 (76.3%) | 101 (23.7%) |
Occupancy by Educational Attainment in Rossville
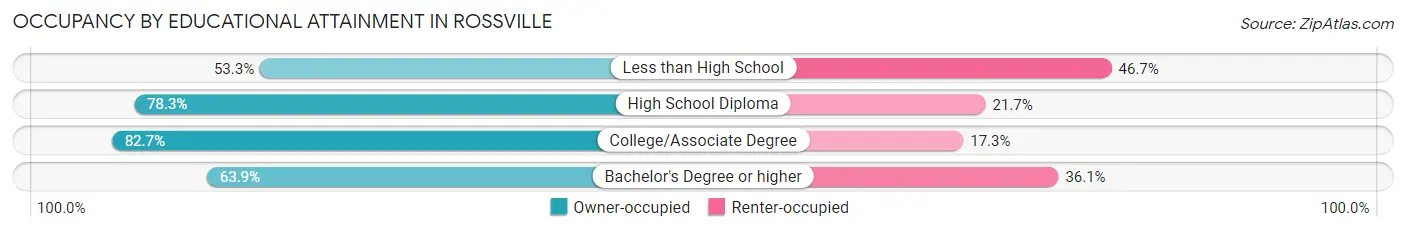
| Household Size | Owner-occupied | Renter-occupied |
| Less than High School | 8 (53.3%) | 7 (46.7%) |
| High School Diploma | 130 (78.3%) | 36 (21.7%) |
| College/Associate Degree | 134 (82.7%) | 28 (17.3%) |
| Bachelor's Degree or higher | 53 (63.9%) | 30 (36.1%) |
Occupancy by Age of Householder in Rossville
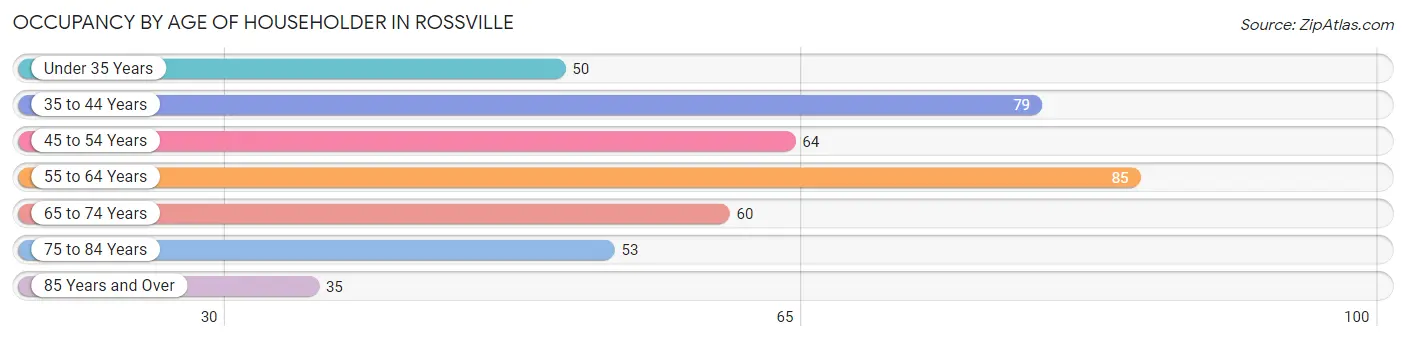
| Age Bracket | # Households | % Households |
| Under 35 Years | 50 | 11.7% |
| 35 to 44 Years | 79 | 18.5% |
| 45 to 54 Years | 64 | 15.0% |
| 55 to 64 Years | 85 | 20.0% |
| 65 to 74 Years | 60 | 14.1% |
| 75 to 84 Years | 53 | 12.4% |
| 85 Years and Over | 35 | 8.2% |
| Total | 426 | 100.0% |
Housing Finances in Rossville
Median Income by Occupancy in Rossville
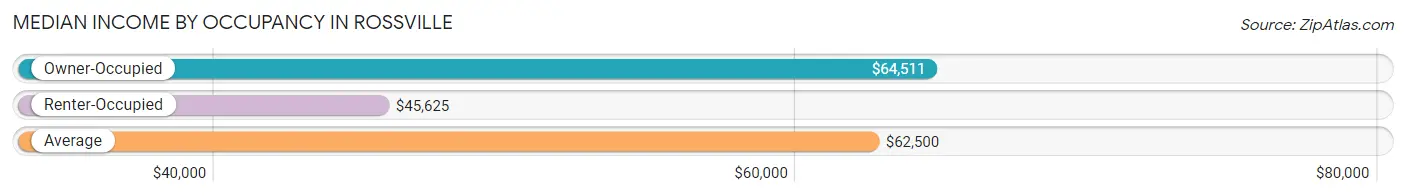
| Occupancy Type | # Households | Median Income |
| Owner-Occupied | 325 (76.3%) | $64,511 |
| Renter-Occupied | 101 (23.7%) | $45,625 |
| Average | 426 (100.0%) | $62,500 |
Occupancy by Householder Income Bracket in Rossville
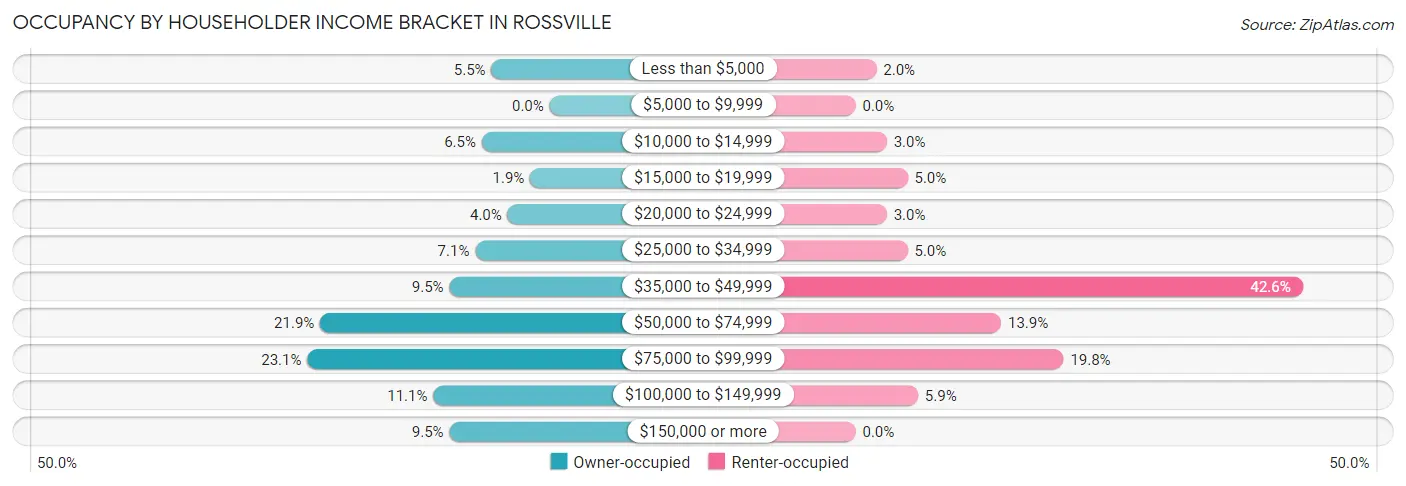
| Income Bracket | Owner-occupied | Renter-occupied |
| Less than $5,000 | 18 (5.5%) | 2 (2.0%) |
| $5,000 to $9,999 | 0 (0.0%) | 0 (0.0%) |
| $10,000 to $14,999 | 21 (6.5%) | 3 (3.0%) |
| $15,000 to $19,999 | 6 (1.8%) | 5 (5.0%) |
| $20,000 to $24,999 | 13 (4.0%) | 3 (3.0%) |
| $25,000 to $34,999 | 23 (7.1%) | 5 (5.0%) |
| $35,000 to $49,999 | 31 (9.5%) | 43 (42.6%) |
| $50,000 to $74,999 | 71 (21.8%) | 14 (13.9%) |
| $75,000 to $99,999 | 75 (23.1%) | 20 (19.8%) |
| $100,000 to $149,999 | 36 (11.1%) | 6 (5.9%) |
| $150,000 or more | 31 (9.5%) | 0 (0.0%) |
| Total | 325 (100.0%) | 101 (100.0%) |
Monthly Housing Cost Tiers in Rossville
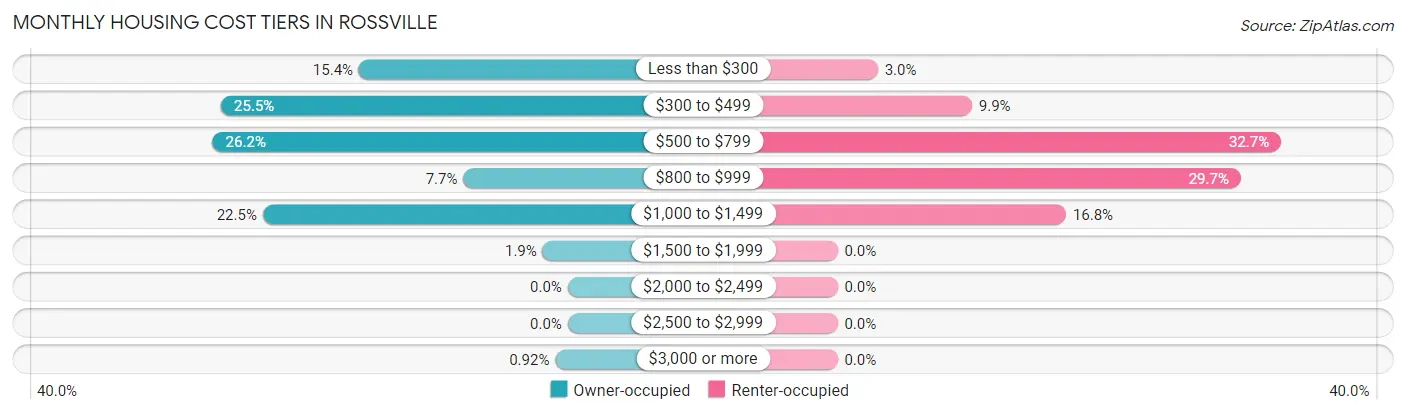
| Monthly Cost | Owner-occupied | Renter-occupied |
| Less than $300 | 50 (15.4%) | 3 (3.0%) |
| $300 to $499 | 83 (25.5%) | 10 (9.9%) |
| $500 to $799 | 85 (26.2%) | 33 (32.7%) |
| $800 to $999 | 25 (7.7%) | 30 (29.7%) |
| $1,000 to $1,499 | 73 (22.5%) | 17 (16.8%) |
| $1,500 to $1,999 | 6 (1.8%) | 0 (0.0%) |
| $2,000 to $2,499 | 0 (0.0%) | 0 (0.0%) |
| $2,500 to $2,999 | 0 (0.0%) | 0 (0.0%) |
| $3,000 or more | 3 (0.9%) | 0 (0.0%) |
| Total | 325 (100.0%) | 101 (100.0%) |
Physical Housing Characteristics in Rossville
Housing Structures in Rossville
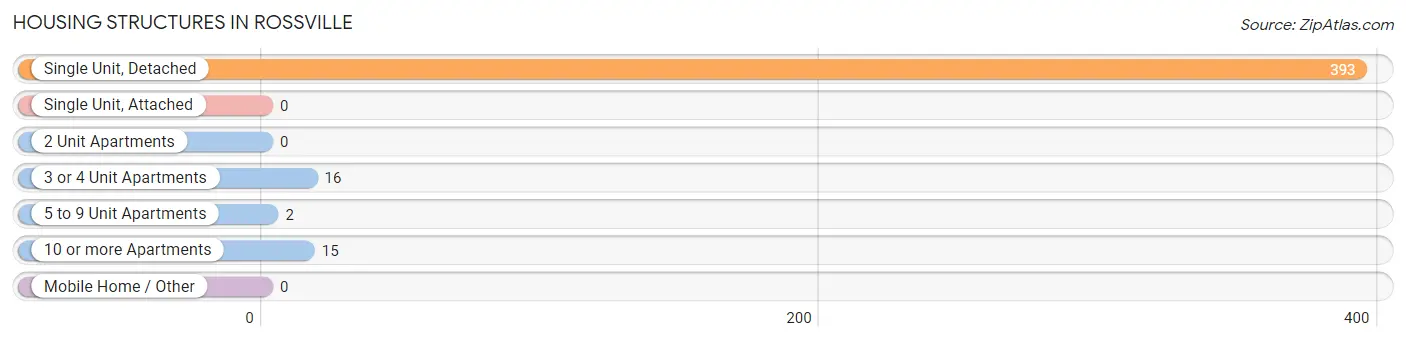
| Structure Type | # Housing Units | % Housing Units |
| Single Unit, Detached | 393 | 92.2% |
| Single Unit, Attached | 0 | 0.0% |
| 2 Unit Apartments | 0 | 0.0% |
| 3 or 4 Unit Apartments | 16 | 3.8% |
| 5 to 9 Unit Apartments | 2 | 0.5% |
| 10 or more Apartments | 15 | 3.5% |
| Mobile Home / Other | 0 | 0.0% |
| Total | 426 | 100.0% |
Housing Structures by Occupancy in Rossville
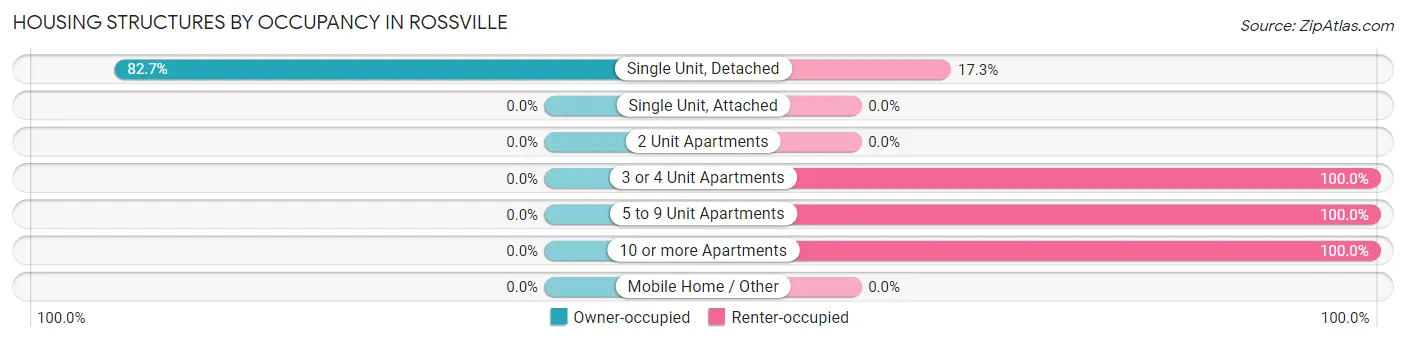
| Structure Type | Owner-occupied | Renter-occupied |
| Single Unit, Detached | 325 (82.7%) | 68 (17.3%) |
| Single Unit, Attached | 0 (0.0%) | 0 (0.0%) |
| 2 Unit Apartments | 0 (0.0%) | 0 (0.0%) |
| 3 or 4 Unit Apartments | 0 (0.0%) | 16 (100.0%) |
| 5 to 9 Unit Apartments | 0 (0.0%) | 2 (100.0%) |
| 10 or more Apartments | 0 (0.0%) | 15 (100.0%) |
| Mobile Home / Other | 0 (0.0%) | 0 (0.0%) |
| Total | 325 (76.3%) | 101 (23.7%) |
Housing Structures by Number of Rooms in Rossville
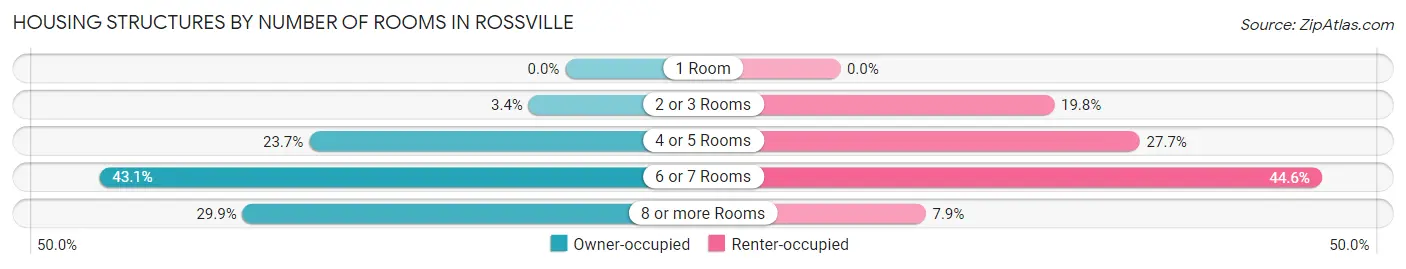
| Number of Rooms | Owner-occupied | Renter-occupied |
| 1 Room | 0 (0.0%) | 0 (0.0%) |
| 2 or 3 Rooms | 11 (3.4%) | 20 (19.8%) |
| 4 or 5 Rooms | 77 (23.7%) | 28 (27.7%) |
| 6 or 7 Rooms | 140 (43.1%) | 45 (44.6%) |
| 8 or more Rooms | 97 (29.8%) | 8 (7.9%) |
| Total | 325 (100.0%) | 101 (100.0%) |
Housing Structure by Heating Type in Rossville
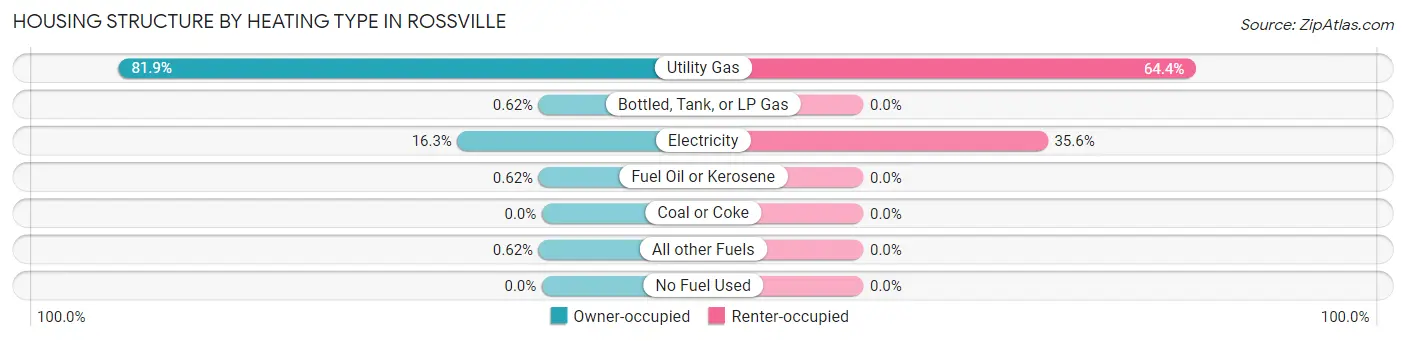
| Heating Type | Owner-occupied | Renter-occupied |
| Utility Gas | 266 (81.9%) | 65 (64.4%) |
| Bottled, Tank, or LP Gas | 2 (0.6%) | 0 (0.0%) |
| Electricity | 53 (16.3%) | 36 (35.6%) |
| Fuel Oil or Kerosene | 2 (0.6%) | 0 (0.0%) |
| Coal or Coke | 0 (0.0%) | 0 (0.0%) |
| All other Fuels | 2 (0.6%) | 0 (0.0%) |
| No Fuel Used | 0 (0.0%) | 0 (0.0%) |
| Total | 325 (100.0%) | 101 (100.0%) |
Household Vehicle Usage in Rossville
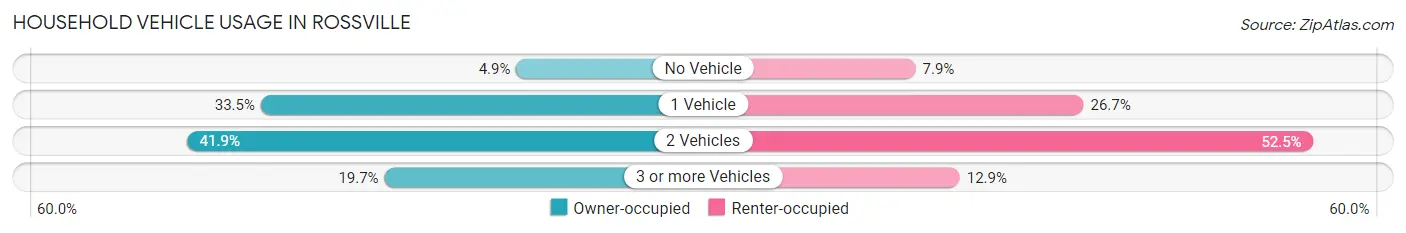
| Vehicles per Household | Owner-occupied | Renter-occupied |
| No Vehicle | 16 (4.9%) | 8 (7.9%) |
| 1 Vehicle | 109 (33.5%) | 27 (26.7%) |
| 2 Vehicles | 136 (41.8%) | 53 (52.5%) |
| 3 or more Vehicles | 64 (19.7%) | 13 (12.9%) |
| Total | 325 (100.0%) | 101 (100.0%) |
Real Estate & Mortgages in Rossville
Real Estate and Mortgage Overview in Rossville
| Characteristic | Without Mortgage | With Mortgage |
| Housing Units | 184 | 141 |
| Median Property Value | $91,400 | $95,200 |
| Median Household Income | $62,647 | $14 |
| Monthly Housing Costs | $412 | $3 |
| Real Estate Taxes | $1,419 | $0 |
Property Value by Mortgage Status in Rossville
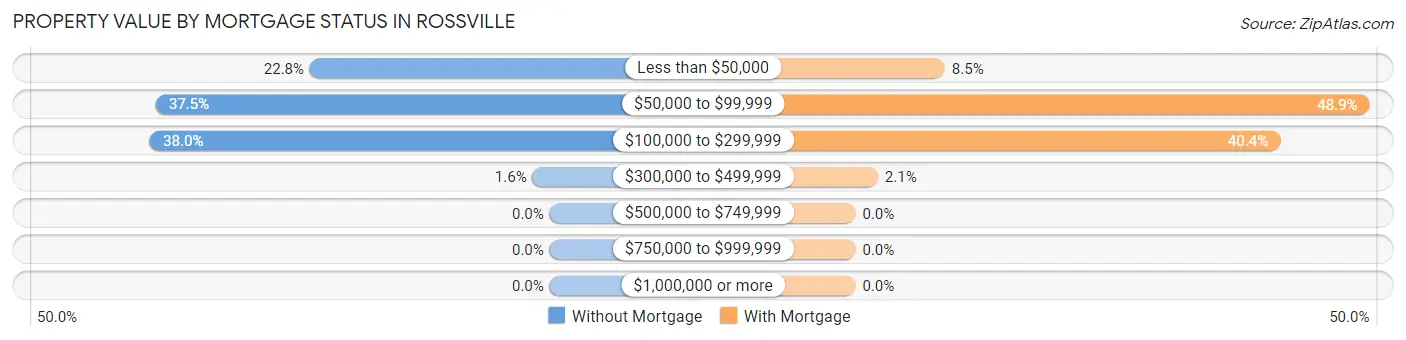
| Property Value | Without Mortgage | With Mortgage |
| Less than $50,000 | 42 (22.8%) | 12 (8.5%) |
| $50,000 to $99,999 | 69 (37.5%) | 69 (48.9%) |
| $100,000 to $299,999 | 70 (38.0%) | 57 (40.4%) |
| $300,000 to $499,999 | 3 (1.6%) | 3 (2.1%) |
| $500,000 to $749,999 | 0 (0.0%) | 0 (0.0%) |
| $750,000 to $999,999 | 0 (0.0%) | 0 (0.0%) |
| $1,000,000 or more | 0 (0.0%) | 0 (0.0%) |
| Total | 184 (100.0%) | 141 (100.0%) |
Household Income by Mortgage Status in Rossville
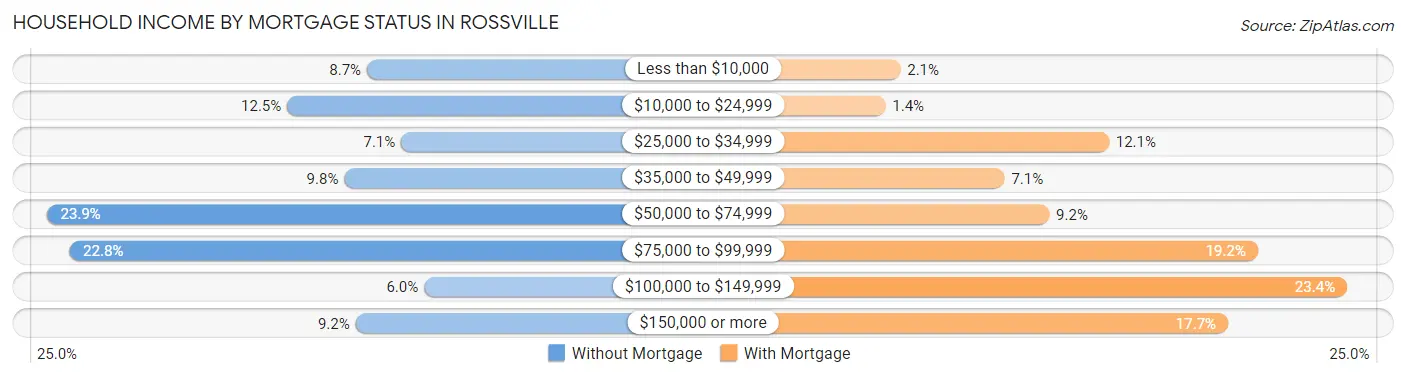
| Household Income | Without Mortgage | With Mortgage |
| Less than $10,000 | 16 (8.7%) | 3 (2.1%) |
| $10,000 to $24,999 | 23 (12.5%) | 2 (1.4%) |
| $25,000 to $34,999 | 13 (7.1%) | 17 (12.1%) |
| $35,000 to $49,999 | 18 (9.8%) | 10 (7.1%) |
| $50,000 to $74,999 | 44 (23.9%) | 13 (9.2%) |
| $75,000 to $99,999 | 42 (22.8%) | 27 (19.2%) |
| $100,000 to $149,999 | 11 (6.0%) | 33 (23.4%) |
| $150,000 or more | 17 (9.2%) | 25 (17.7%) |
| Total | 184 (100.0%) | 141 (100.0%) |
Property Value to Household Income Ratio in Rossville
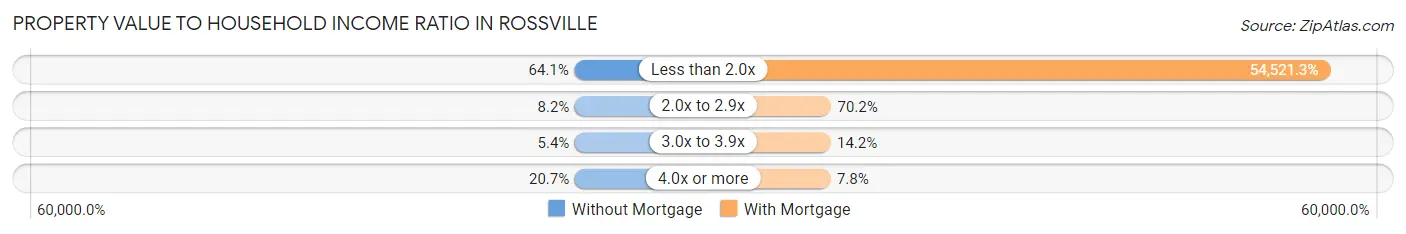
| Value-to-Income Ratio | Without Mortgage | With Mortgage |
| Less than 2.0x | 118 (64.1%) | 76,875 (54,521.3%) |
| 2.0x to 2.9x | 15 (8.2%) | 99 (70.2%) |
| 3.0x to 3.9x | 10 (5.4%) | 20 (14.2%) |
| 4.0x or more | 38 (20.6%) | 11 (7.8%) |
| Total | 184 (100.0%) | 141 (100.0%) |
Real Estate Taxes by Mortgage Status in Rossville
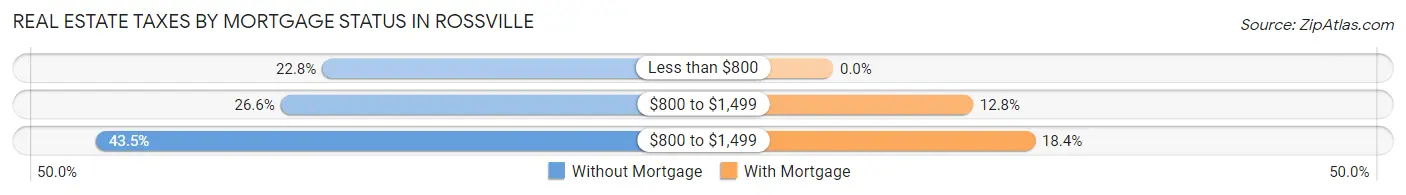
| Property Taxes | Without Mortgage | With Mortgage |
| Less than $800 | 42 (22.8%) | 0 (0.0%) |
| $800 to $1,499 | 49 (26.6%) | 18 (12.8%) |
| $800 to $1,499 | 80 (43.5%) | 26 (18.4%) |
| Total | 184 (100.0%) | 141 (100.0%) |
Health & Disability in Rossville
Health Insurance Coverage by Age in Rossville
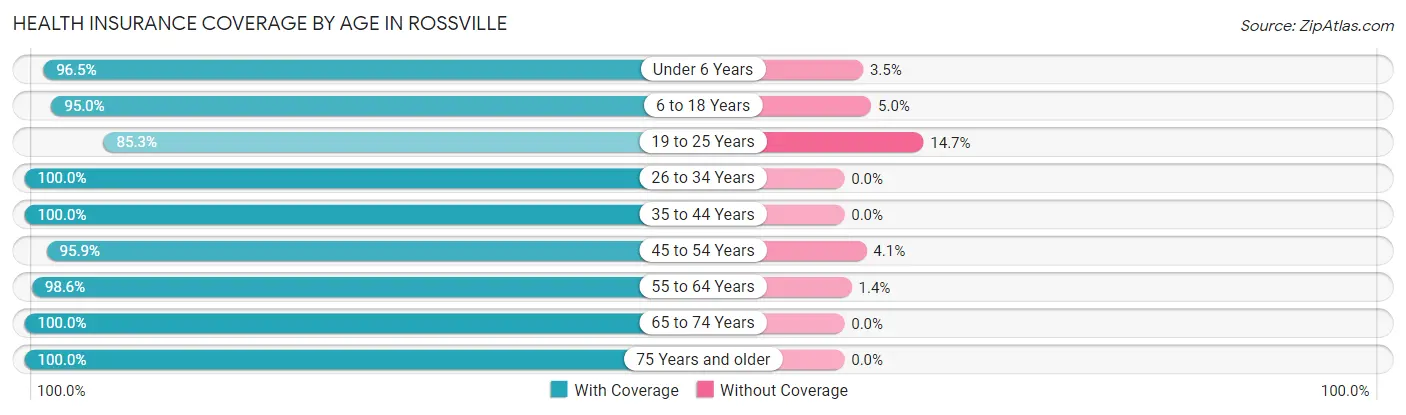
| Age Bracket | With Coverage | Without Coverage |
| Under 6 Years | 111 (96.5%) | 4 (3.5%) |
| 6 to 18 Years | 266 (95.0%) | 14 (5.0%) |
| 19 to 25 Years | 81 (85.3%) | 14 (14.7%) |
| 26 to 34 Years | 73 (100.0%) | 0 (0.0%) |
| 35 to 44 Years | 162 (100.0%) | 0 (0.0%) |
| 45 to 54 Years | 93 (95.9%) | 4 (4.1%) |
| 55 to 64 Years | 145 (98.6%) | 2 (1.4%) |
| 65 to 74 Years | 102 (100.0%) | 0 (0.0%) |
| 75 Years and older | 127 (100.0%) | 0 (0.0%) |
| Total | 1,160 (96.8%) | 38 (3.2%) |
Health Insurance Coverage by Citizenship Status in Rossville
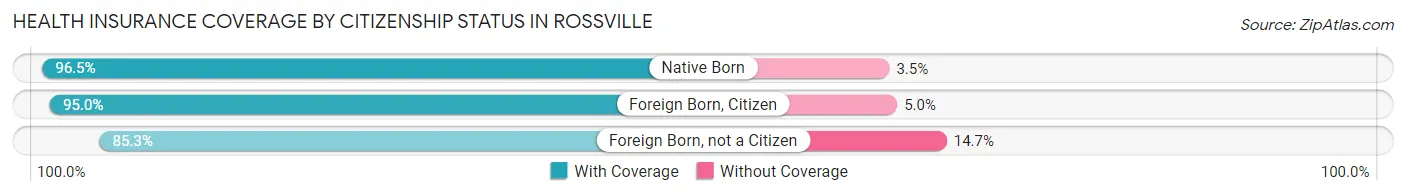
| Citizenship Status | With Coverage | Without Coverage |
| Native Born | 111 (96.5%) | 4 (3.5%) |
| Foreign Born, Citizen | 266 (95.0%) | 14 (5.0%) |
| Foreign Born, not a Citizen | 81 (85.3%) | 14 (14.7%) |
Health Insurance Coverage by Household Income in Rossville
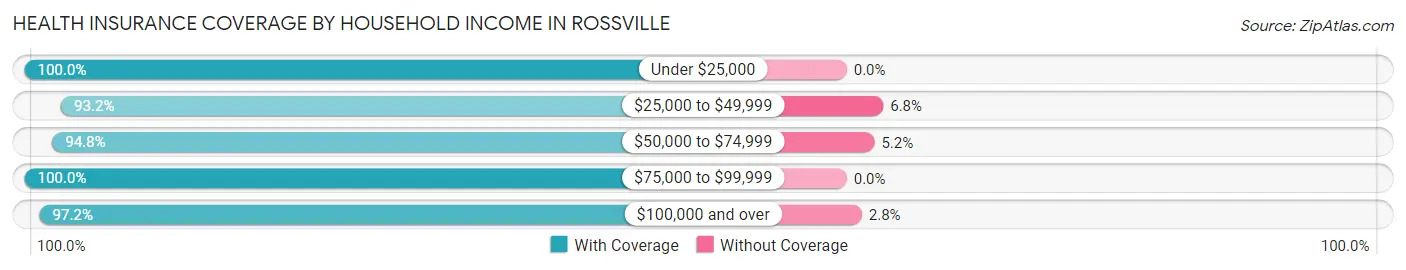
| Household Income | With Coverage | Without Coverage |
| Under $25,000 | 120 (100.0%) | 0 (0.0%) |
| $25,000 to $49,999 | 286 (93.2%) | 21 (6.8%) |
| $50,000 to $74,999 | 201 (94.8%) | 11 (5.2%) |
| $75,000 to $99,999 | 346 (100.0%) | 0 (0.0%) |
| $100,000 and over | 207 (97.2%) | 6 (2.8%) |
Public vs Private Health Insurance Coverage by Age in Rossville
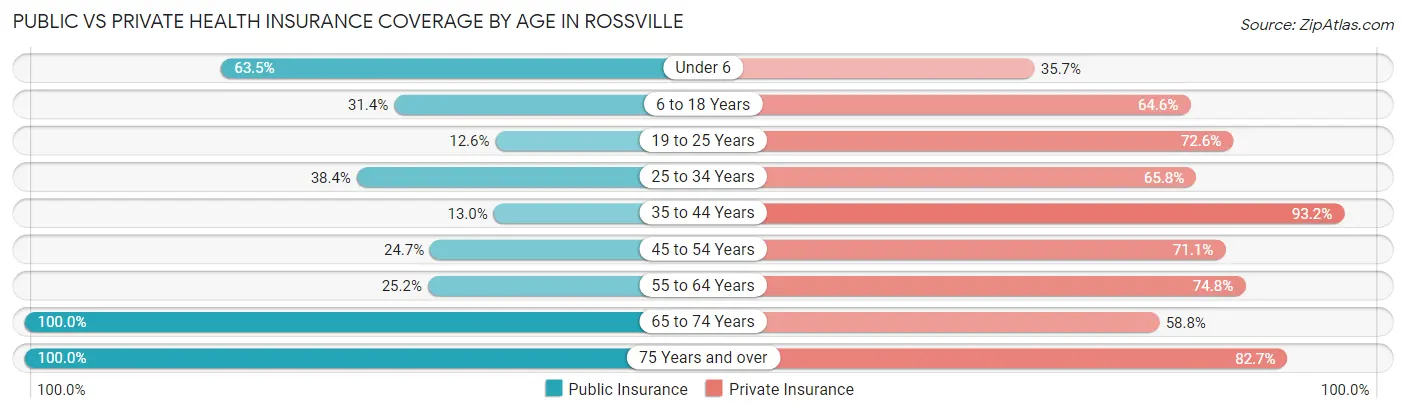
| Age Bracket | Public Insurance | Private Insurance |
| Under 6 | 73 (63.5%) | 41 (35.6%) |
| 6 to 18 Years | 88 (31.4%) | 181 (64.6%) |
| 19 to 25 Years | 12 (12.6%) | 69 (72.6%) |
| 25 to 34 Years | 28 (38.4%) | 48 (65.7%) |
| 35 to 44 Years | 21 (13.0%) | 151 (93.2%) |
| 45 to 54 Years | 24 (24.7%) | 69 (71.1%) |
| 55 to 64 Years | 37 (25.2%) | 110 (74.8%) |
| 65 to 74 Years | 102 (100.0%) | 60 (58.8%) |
| 75 Years and over | 127 (100.0%) | 105 (82.7%) |
| Total | 512 (42.7%) | 834 (69.6%) |
Disability Status by Sex by Age in Rossville
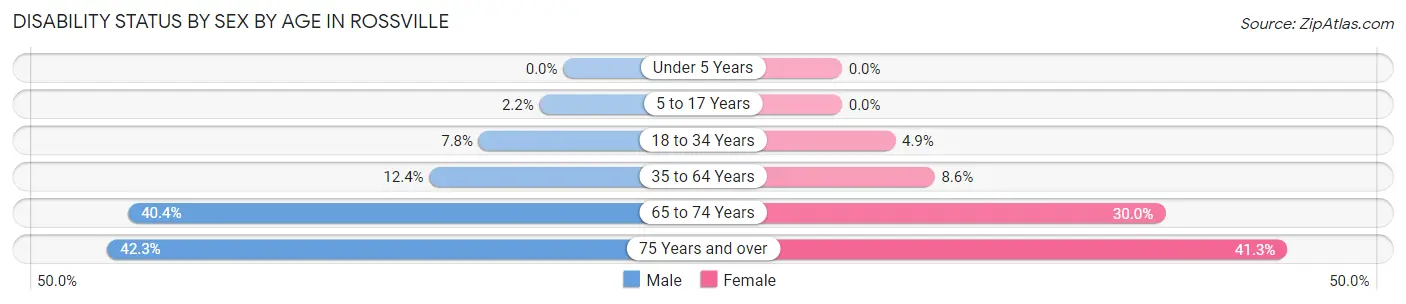
| Age Bracket | Male | Female |
| Under 5 Years | 0 (0.0%) | 0 (0.0%) |
| 5 to 17 Years | 3 (2.2%) | 0 (0.0%) |
| 18 to 34 Years | 8 (7.8%) | 4 (4.9%) |
| 35 to 64 Years | 23 (12.4%) | 19 (8.6%) |
| 65 to 74 Years | 21 (40.4%) | 15 (30.0%) |
| 75 Years and over | 22 (42.3%) | 31 (41.3%) |
Disability Class by Sex by Age in Rossville
Disability Class: Hearing Difficulty
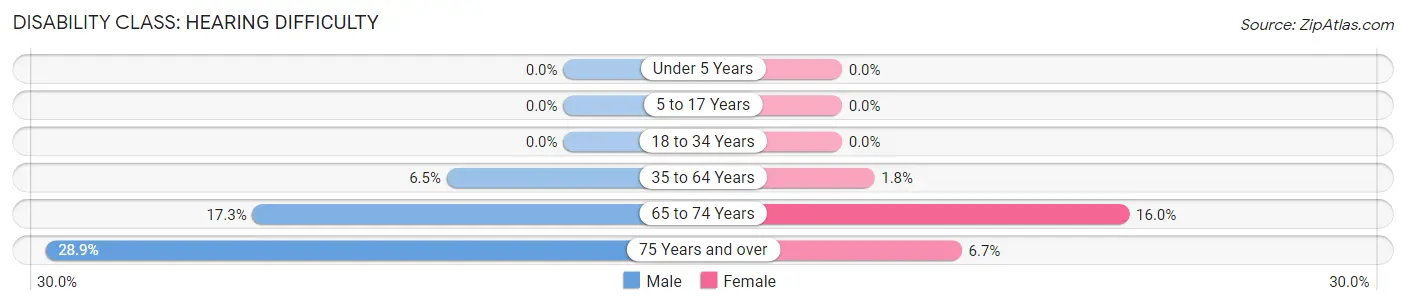
| Age Bracket | Male | Female |
| Under 5 Years | 0 (0.0%) | 0 (0.0%) |
| 5 to 17 Years | 0 (0.0%) | 0 (0.0%) |
| 18 to 34 Years | 0 (0.0%) | 0 (0.0%) |
| 35 to 64 Years | 12 (6.5%) | 4 (1.8%) |
| 65 to 74 Years | 9 (17.3%) | 8 (16.0%) |
| 75 Years and over | 15 (28.8%) | 5 (6.7%) |
Disability Class: Vision Difficulty
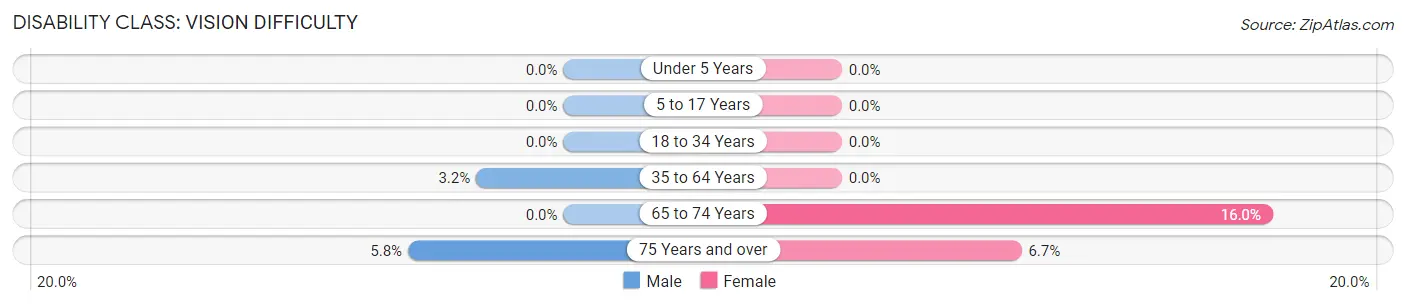
| Age Bracket | Male | Female |
| Under 5 Years | 0 (0.0%) | 0 (0.0%) |
| 5 to 17 Years | 0 (0.0%) | 0 (0.0%) |
| 18 to 34 Years | 0 (0.0%) | 0 (0.0%) |
| 35 to 64 Years | 6 (3.2%) | 0 (0.0%) |
| 65 to 74 Years | 0 (0.0%) | 8 (16.0%) |
| 75 Years and over | 3 (5.8%) | 5 (6.7%) |
Disability Class: Cognitive Difficulty
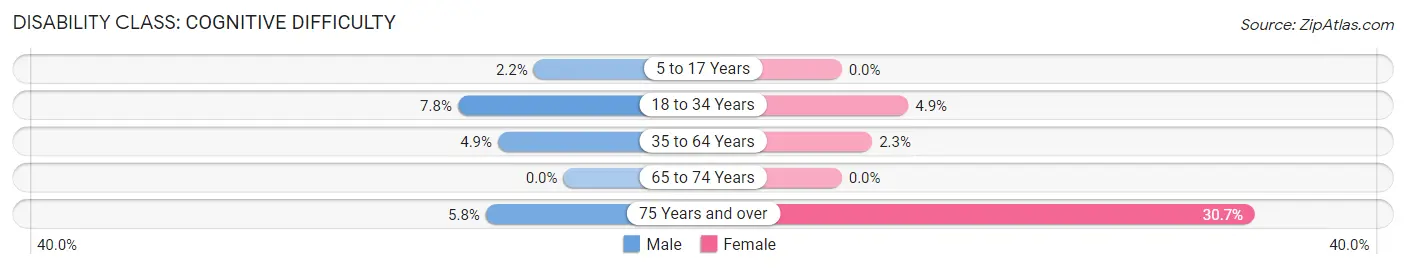
| Age Bracket | Male | Female |
| 5 to 17 Years | 3 (2.2%) | 0 (0.0%) |
| 18 to 34 Years | 8 (7.8%) | 4 (4.9%) |
| 35 to 64 Years | 9 (4.9%) | 5 (2.3%) |
| 65 to 74 Years | 0 (0.0%) | 0 (0.0%) |
| 75 Years and over | 3 (5.8%) | 23 (30.7%) |
Disability Class: Ambulatory Difficulty
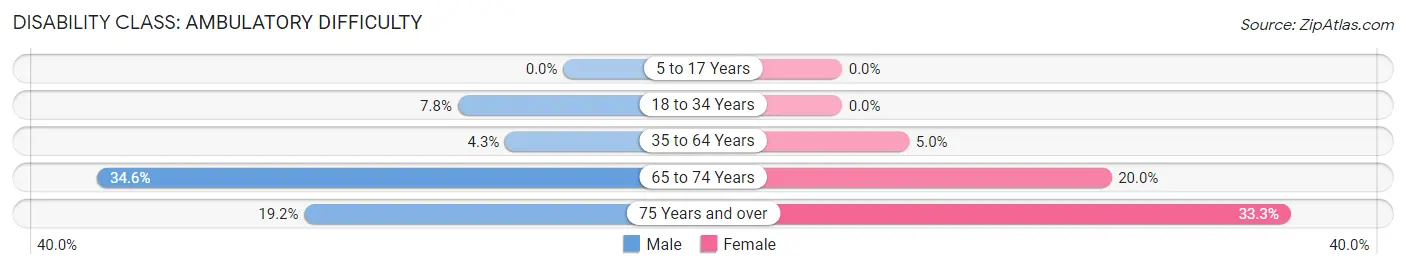
| Age Bracket | Male | Female |
| 5 to 17 Years | 0 (0.0%) | 0 (0.0%) |
| 18 to 34 Years | 8 (7.8%) | 0 (0.0%) |
| 35 to 64 Years | 8 (4.3%) | 11 (5.0%) |
| 65 to 74 Years | 18 (34.6%) | 10 (20.0%) |
| 75 Years and over | 10 (19.2%) | 25 (33.3%) |
Disability Class: Self-Care Difficulty
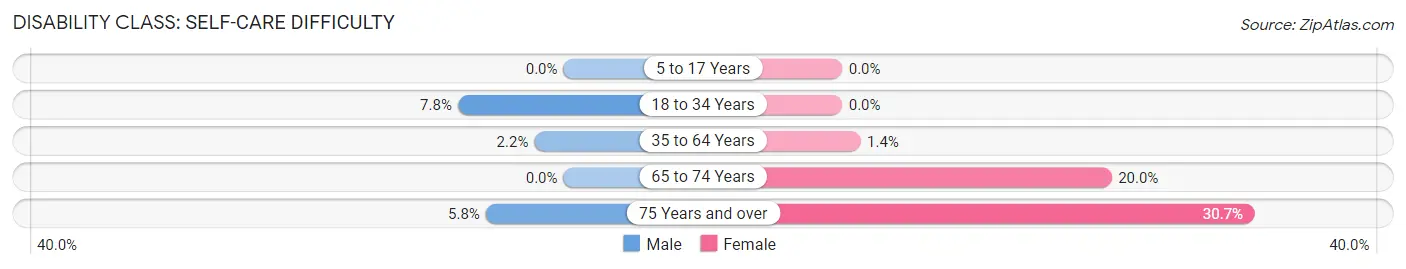
| Age Bracket | Male | Female |
| 5 to 17 Years | 0 (0.0%) | 0 (0.0%) |
| 18 to 34 Years | 8 (7.8%) | 0 (0.0%) |
| 35 to 64 Years | 4 (2.2%) | 3 (1.4%) |
| 65 to 74 Years | 0 (0.0%) | 10 (20.0%) |
| 75 Years and over | 3 (5.8%) | 23 (30.7%) |
Technology Access in Rossville
Computing Device Access in Rossville
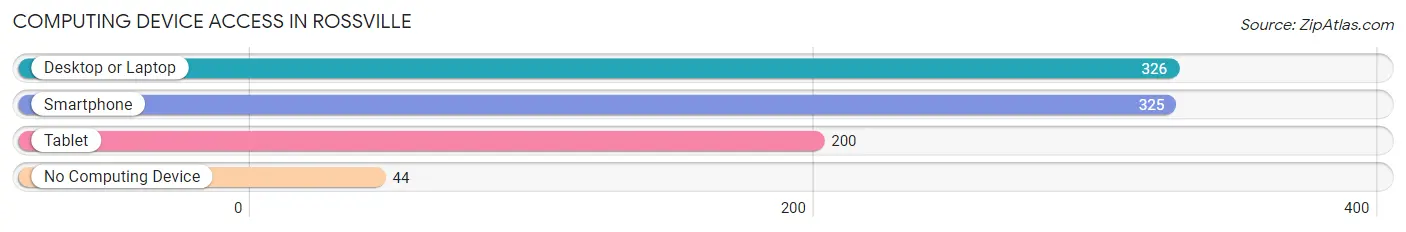
| Device Type | # Households | % Households |
| Desktop or Laptop | 326 | 76.5% |
| Smartphone | 325 | 76.3% |
| Tablet | 200 | 46.9% |
| No Computing Device | 44 | 10.3% |
| Total | 426 | 100.0% |
Internet Access in Rossville
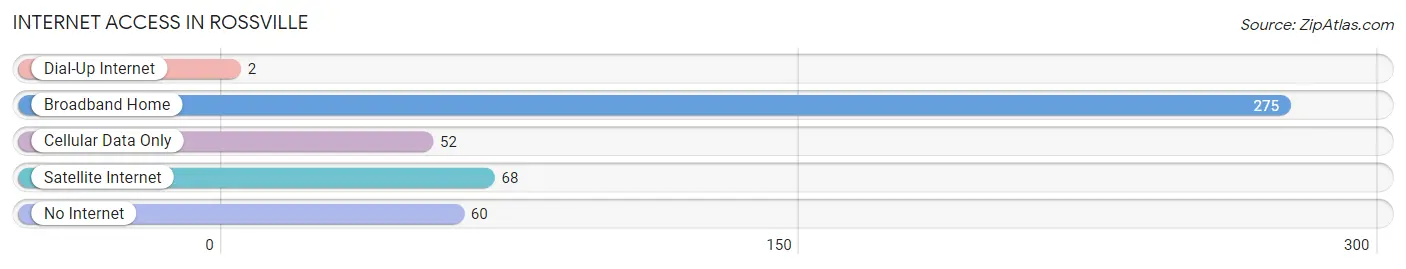
| Internet Type | # Households | % Households |
| Dial-Up Internet | 2 | 0.5% |
| Broadband Home | 275 | 64.5% |
| Cellular Data Only | 52 | 12.2% |
| Satellite Internet | 68 | 16.0% |
| No Internet | 60 | 14.1% |
| Total | 426 | 100.0% |
Rossville Summary
History
The small town of Rossville, Illinois is located in Vermilion County, about 20 miles south of the city of Danville. The town was founded in 1854 by William Ross, a local farmer and businessman. Rossville was originally known as Rossville Station, as it was a stop on the Chicago and Alton Railroad. The town was officially incorporated in 1858.
In the late 19th century, Rossville was a thriving agricultural community. The town was home to several grain elevators, a flour mill, and a creamery. The town also had a number of stores, including a general store, a hardware store, and a drug store.
In the early 20th century, Rossville began to experience a decline in population. This was due to the fact that the railroad had stopped running through the town, and the agricultural industry was in decline. The town’s population dropped from a peak of 1,000 in 1910 to just over 500 by the 1950s.
In the late 20th century, Rossville began to experience a resurgence. The town was revitalized by the construction of a new highway, which brought new businesses and residents to the area. The town’s population has grown steadily since then, and it now stands at around 1,200.
Geography
Rossville is located in the eastern part of Vermilion County, about 20 miles south of the city of Danville. The town is situated on the banks of the Middle Fork of the Vermilion River. The town is surrounded by rolling hills and farmland.
The climate in Rossville is typical of the Midwest, with hot summers and cold winters. The average temperature in the summer is around 75 degrees Fahrenheit, and the average temperature in the winter is around 25 degrees Fahrenheit.
Economy
The economy of Rossville is largely based on agriculture. The town is home to several grain elevators, a flour mill, and a creamery. The town also has a number of stores, including a general store, a hardware store, and a drug store.
The town is also home to a number of small businesses, including a lumber yard, a car dealership, and a restaurant. The town also has a number of churches, a library, and a post office.
Demographics
As of the 2010 census, the population of Rossville was 1,200. The town is predominantly white, with a small African American population. The median household income in the town is $45,000, and the median home value is $90,000.
The town is served by the Rossville-Alvin Community Unit School District, which includes an elementary school, a middle school, and a high school. The town also has a public library and a post office.
Conclusion
Rossville, Illinois is a small town located in Vermilion County. The town was founded in 1854 and was once a thriving agricultural community. In the late 20th century, the town experienced a resurgence due to the construction of a new highway. The town’s economy is largely based on agriculture, and the town is home to a number of small businesses. The population of Rossville is predominantly white, with a small African American population. The town is served by the Rossville-Alvin Community Unit School District, and it has a public library and a post office.
Common Questions
What is Per Capita Income in Rossville?
Per Capita income in Rossville is $28,161.
What is the Median Family Income in Rossville?
Median Family Income in Rossville is $75,625.
What is the Median Household income in Rossville?
Median Household Income in Rossville is $62,500.
What is Income or Wage Gap in Rossville?
Income or Wage Gap in Rossville is 32.3%.
Women in Rossville earn 67.7 cents for every dollar earned by a man.
What is Inequality or Gini Index in Rossville?
Inequality or Gini Index in Rossville is 0.43.
What is the Total Population of Rossville?
Total Population of Rossville is 1,198.
What is the Total Male Population of Rossville?
Total Male Population of Rossville is 587.
What is the Total Female Population of Rossville?
Total Female Population of Rossville is 611.
What is the Ratio of Males per 100 Females in Rossville?
There are 96.07 Males per 100 Females in Rossville.
What is the Ratio of Females per 100 Males in Rossville?
There are 104.09 Females per 100 Males in Rossville.
What is the Median Population Age in Rossville?
Median Population Age in Rossville is 37.2 Years.
What is the Average Family Size in Rossville
Average Family Size in Rossville is 3.4 People.
What is the Average Household Size in Rossville
Average Household Size in Rossville is 2.8 People.
How Large is the Labor Force in Rossville?
There are 506 People in the Labor Forcein in Rossville.
What is the Percentage of People in the Labor Force in Rossville?
60.2% of People are in the Labor Force in Rossville.
What is the Unemployment Rate in Rossville?
Unemployment Rate in Rossville is 2.0%.