Rochester, IL Map & Demographics
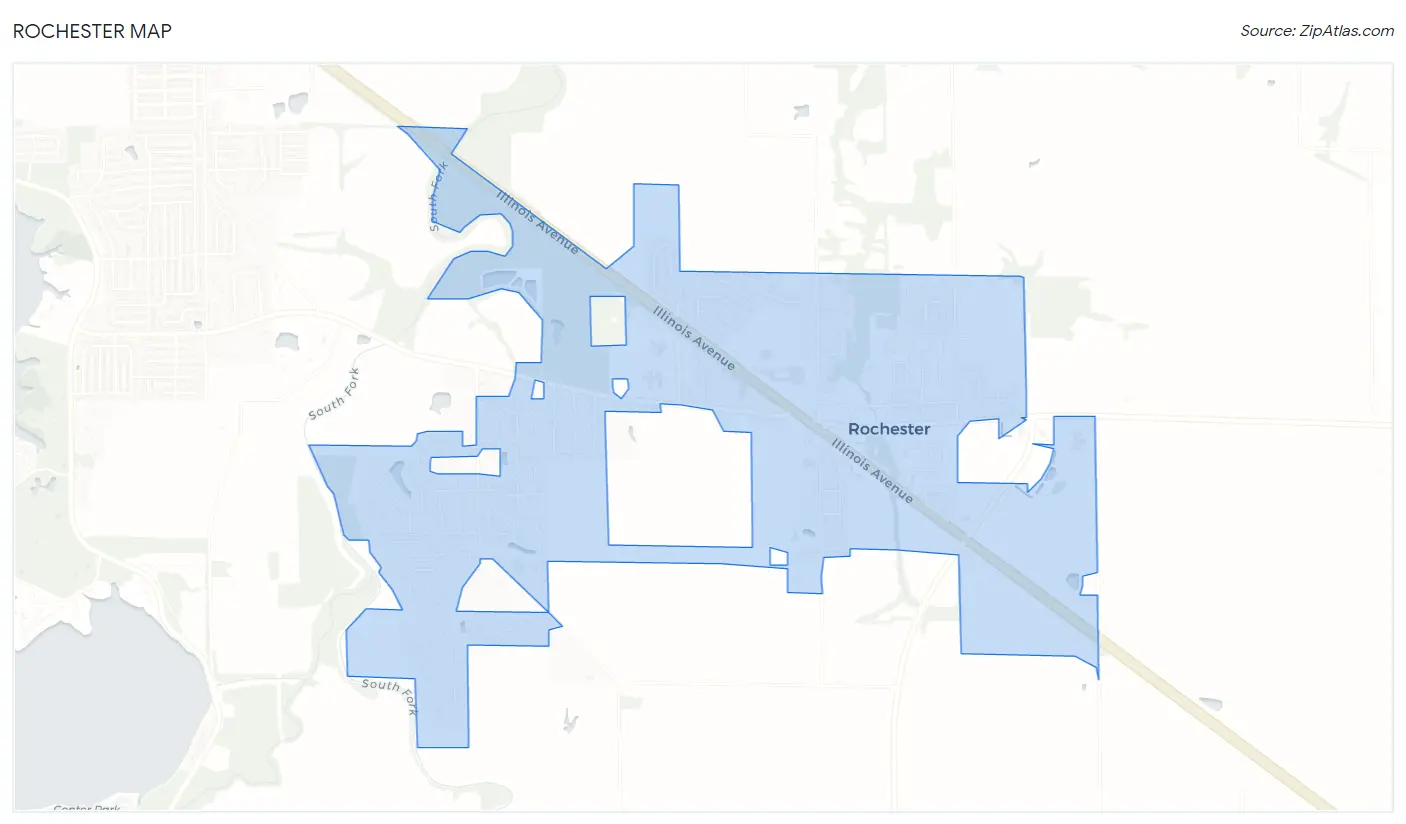
Rochester Map
Rochester Overview
$45,025
PER CAPITA INCOME
$117,000
AVG FAMILY INCOME
$107,800
AVG HOUSEHOLD INCOME
8.8%
WAGE / INCOME GAP [ % ]
91.2¢/ $1
WAGE / INCOME GAP [ $ ]
0.37
INEQUALITY / GINI INDEX
3,752
TOTAL POPULATION
1,745
MALE POPULATION
2,007
FEMALE POPULATION
86.95
MALES / 100 FEMALES
115.01
FEMALES / 100 MALES
39.4
MEDIAN AGE
3.1
AVG FAMILY SIZE
2.7
AVG HOUSEHOLD SIZE
1,644
LABOR FORCE [ PEOPLE ]
57.2%
PERCENT IN LABOR FORCE
3.9%
UNEMPLOYMENT RATE
Rochester Zip Codes
Rochester Area Codes
Income in Rochester
Income Overview in Rochester
Per Capita Income in Rochester is $45,025, while median incomes of families and households are $117,000 and $107,800 respectively.
| Characteristic | Number | Measure |
| Per Capita Income | 3,752 | $45,025 |
| Median Family Income | 1,066 | $117,000 |
| Mean Family Income | 1,066 | $136,584 |
| Median Household Income | 1,372 | $107,800 |
| Mean Household Income | 1,372 | $125,194 |
| Income Deficit | 1,066 | $0 |
| Wage / Income Gap (%) | 3,752 | 8.77% |
| Wage / Income Gap ($) | 3,752 | 91.23¢ per $1 |
| Gini / Inequality Index | 3,752 | 0.37 |
Earnings by Sex in Rochester
Average Earnings in Rochester are $59,246, $61,655 for men and $56,250 for women, a difference of 8.8%.
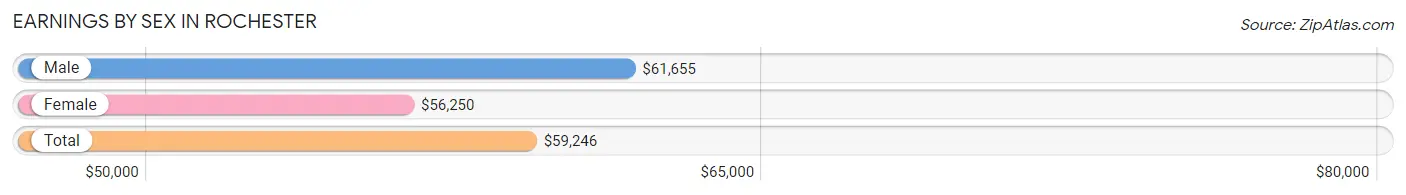
| Sex | Number | Average Earnings |
| Male | 867 (52.0%) | $61,655 |
| Female | 799 (48.0%) | $56,250 |
| Total | 1,666 (100.0%) | $59,246 |
Earnings by Sex by Income Bracket in Rochester
The most common earnings brackets in Rochester are $100,000+ for men (202 | 23.3%) and $75,000 to $99,999 for women (183 | 22.9%).
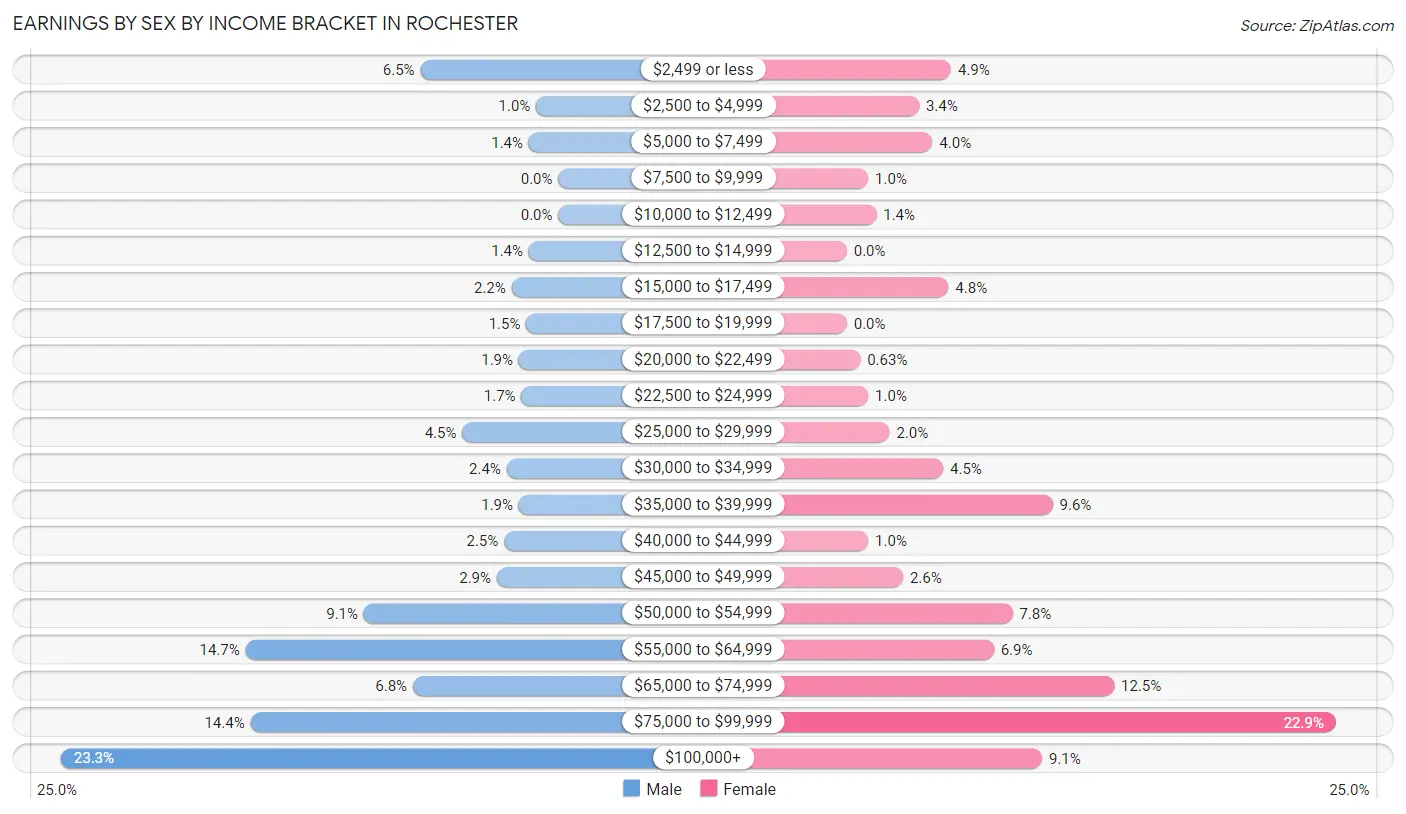
| Income | Male | Female |
| $2,499 or less | 56 (6.5%) | 39 (4.9%) |
| $2,500 to $4,999 | 9 (1.0%) | 27 (3.4%) |
| $5,000 to $7,499 | 12 (1.4%) | 32 (4.0%) |
| $7,500 to $9,999 | 0 (0.0%) | 8 (1.0%) |
| $10,000 to $12,499 | 0 (0.0%) | 11 (1.4%) |
| $12,500 to $14,999 | 12 (1.4%) | 0 (0.0%) |
| $15,000 to $17,499 | 19 (2.2%) | 38 (4.8%) |
| $17,500 to $19,999 | 13 (1.5%) | 0 (0.0%) |
| $20,000 to $22,499 | 16 (1.8%) | 5 (0.6%) |
| $22,500 to $24,999 | 15 (1.7%) | 8 (1.0%) |
| $25,000 to $29,999 | 39 (4.5%) | 16 (2.0%) |
| $30,000 to $34,999 | 21 (2.4%) | 36 (4.5%) |
| $35,000 to $39,999 | 16 (1.8%) | 77 (9.6%) |
| $40,000 to $44,999 | 22 (2.5%) | 8 (1.0%) |
| $45,000 to $49,999 | 25 (2.9%) | 21 (2.6%) |
| $50,000 to $54,999 | 79 (9.1%) | 62 (7.8%) |
| $55,000 to $64,999 | 127 (14.6%) | 55 (6.9%) |
| $65,000 to $74,999 | 59 (6.8%) | 100 (12.5%) |
| $75,000 to $99,999 | 125 (14.4%) | 183 (22.9%) |
| $100,000+ | 202 (23.3%) | 73 (9.1%) |
| Total | 867 (100.0%) | 799 (100.0%) |
Earnings by Sex by Educational Attainment in Rochester
Average earnings in Rochester are $69,028 for men and $65,391 for women, a difference of 5.3%. Men with an educational attainment of graduate degree enjoy the highest average annual earnings of $139,583, while those with high school diploma education earn the least with $44,464. Women with an educational attainment of graduate degree earn the most with the average annual earnings of $81,000, while those with college or associate's degree education have the smallest earnings of $36,744.
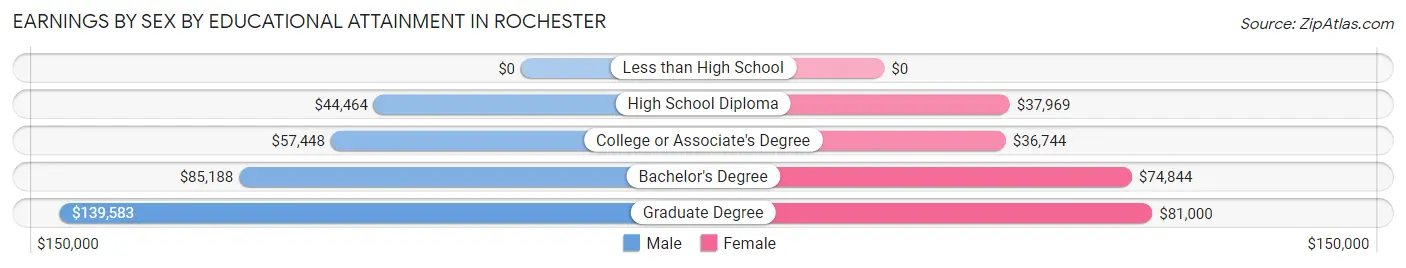
| Educational Attainment | Male Income | Female Income |
| Less than High School | - | - |
| High School Diploma | $44,464 | $37,969 |
| College or Associate's Degree | $57,448 | $36,744 |
| Bachelor's Degree | $85,188 | $74,844 |
| Graduate Degree | $139,583 | $81,000 |
| Total | $69,028 | $65,391 |
Family Income in Rochester
Family Income Brackets in Rochester
According to the Rochester family income data, there are 281 families falling into the $100,000 to $149,999 income range, which is the most common income bracket and makes up 26.4% of all families.
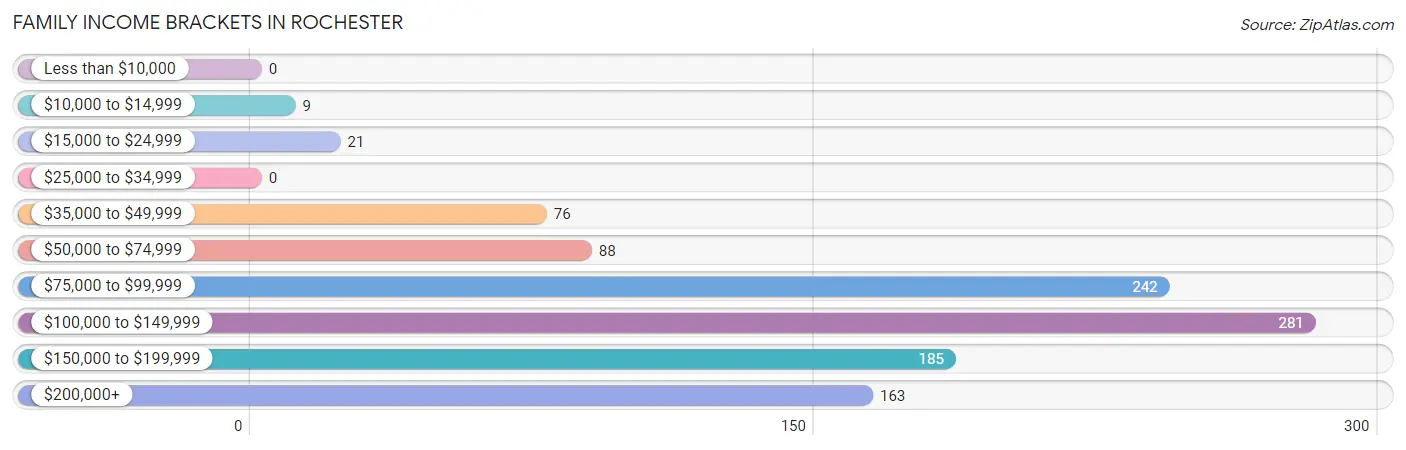
| Income Bracket | # Families | % Families |
| Less than $10,000 | 0 | 0.0% |
| $10,000 to $14,999 | 9 | 0.8% |
| $15,000 to $24,999 | 21 | 2.0% |
| $25,000 to $34,999 | 0 | 0.0% |
| $35,000 to $49,999 | 76 | 7.1% |
| $50,000 to $74,999 | 88 | 8.3% |
| $75,000 to $99,999 | 242 | 22.7% |
| $100,000 to $149,999 | 281 | 26.4% |
| $150,000 to $199,999 | 185 | 17.4% |
| $200,000+ | 163 | 15.3% |
Family Income by Famaliy Size in Rochester
5-person families (108 | 10.1%) account for the highest median family income in Rochester with $186,250 per family, while 2-person families (487 | 45.7%) have the highest median income of $46,032 per family member.
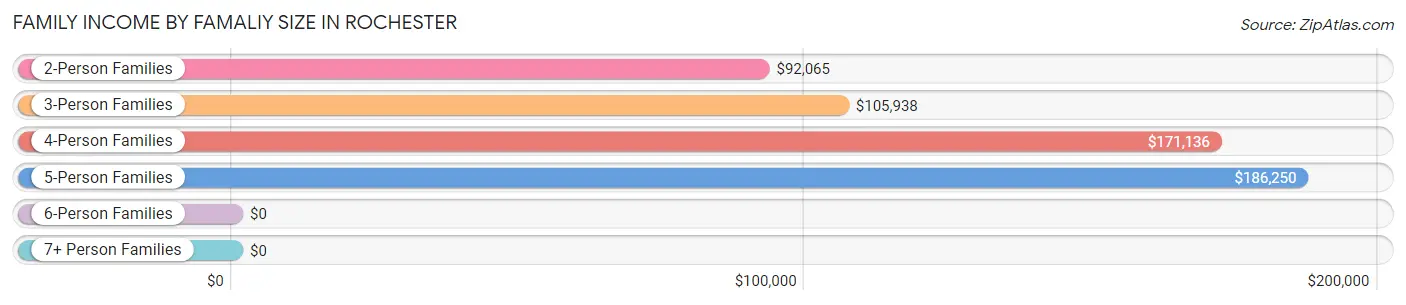
| Income Bracket | # Families | Median Income |
| 2-Person Families | 487 (45.7%) | $92,065 |
| 3-Person Families | 224 (21.0%) | $105,938 |
| 4-Person Families | 210 (19.7%) | $171,136 |
| 5-Person Families | 108 (10.1%) | $186,250 |
| 6-Person Families | 19 (1.8%) | $0 |
| 7+ Person Families | 18 (1.7%) | $0 |
| Total | 1,066 (100.0%) | $117,000 |
Family Income by Number of Earners in Rochester
The median family income in Rochester is $117,000, with families comprising 3+ earners (83) having the highest median family income of $195,917, while families with 1 earner (189) have the lowest median family income of $85,903, accounting for 7.8% and 17.7% of families, respectively.
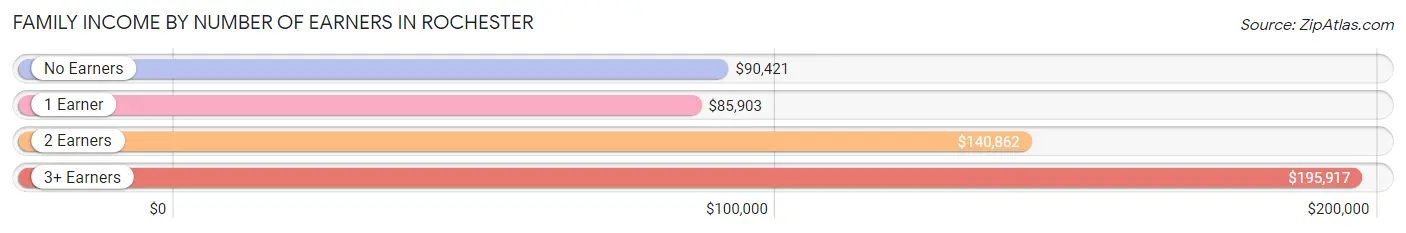
| Number of Earners | # Families | Median Income |
| No Earners | 298 (28.0%) | $90,421 |
| 1 Earner | 189 (17.7%) | $85,903 |
| 2 Earners | 496 (46.5%) | $140,862 |
| 3+ Earners | 83 (7.8%) | $195,917 |
| Total | 1,066 (100.0%) | $117,000 |
Household Income in Rochester
Household Income Brackets in Rochester
With 373 households falling in the category, the $100,000 to $149,999 income range is the most frequent in Rochester, accounting for 27.2% of all households. In contrast, only 8 households (0.6%) fall into the $10,000 to $14,999 income bracket, making it the least populous group.
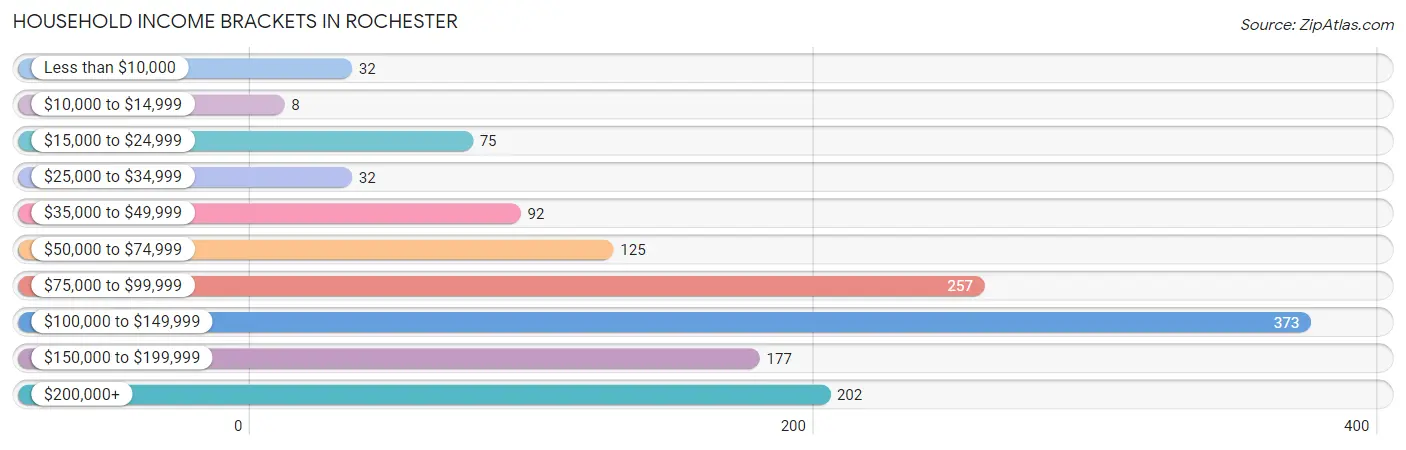
| Income Bracket | # Households | % Households |
| Less than $10,000 | 32 | 2.3% |
| $10,000 to $14,999 | 8 | 0.6% |
| $15,000 to $24,999 | 75 | 5.5% |
| $25,000 to $34,999 | 32 | 2.3% |
| $35,000 to $49,999 | 92 | 6.7% |
| $50,000 to $74,999 | 125 | 9.1% |
| $75,000 to $99,999 | 257 | 18.7% |
| $100,000 to $149,999 | 373 | 27.2% |
| $150,000 to $199,999 | 177 | 12.9% |
| $200,000+ | 202 | 14.7% |
Household Income by Householder Age in Rochester
The median household income in Rochester is $107,800, with the highest median household income of $117,939 found in the 25 to 44 years age bracket for the primary householder. A total of 385 households (28.1%) fall into this category. Meanwhile, the 15 to 24 years age bracket for the primary householder has the lowest median household income of $0, with 22 households (1.6%) in this group.
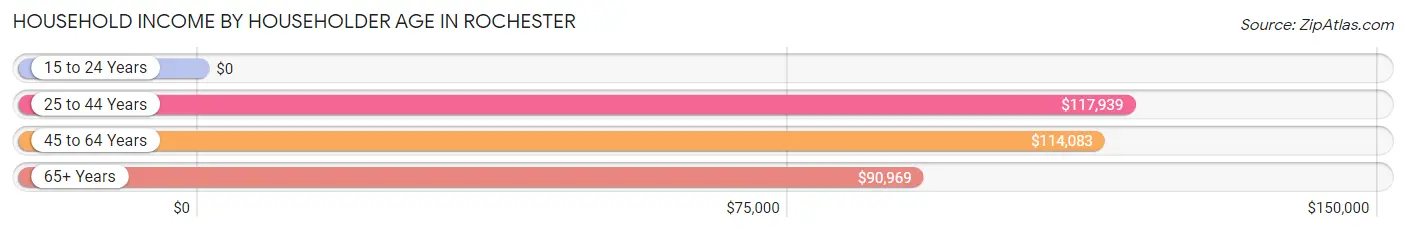
| Income Bracket | # Households | Median Income |
| 15 to 24 Years | 22 (1.6%) | $0 |
| 25 to 44 Years | 385 (28.1%) | $117,939 |
| 45 to 64 Years | 558 (40.7%) | $114,083 |
| 65+ Years | 407 (29.7%) | $90,969 |
| Total | 1,372 (100.0%) | $107,800 |
Poverty in Rochester
Income Below Poverty by Sex and Age in Rochester
With 2.4% poverty level for males and 3.3% for females among the residents of Rochester, 55 to 64 year old males and 16 and 17 year old females are the most vulnerable to poverty, with 23 males (12.6%) and 27 females (35.1%) in their respective age groups living below the poverty level.
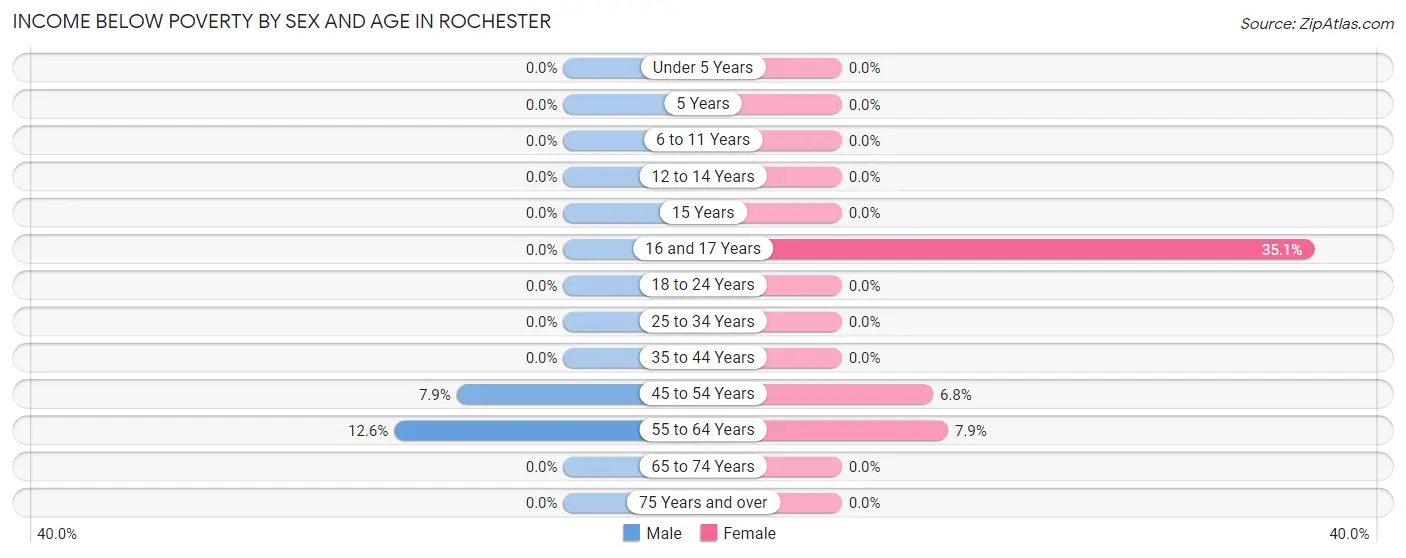
| Age Bracket | Male | Female |
| Under 5 Years | 0 (0.0%) | 0 (0.0%) |
| 5 Years | 0 (0.0%) | 0 (0.0%) |
| 6 to 11 Years | 0 (0.0%) | 0 (0.0%) |
| 12 to 14 Years | 0 (0.0%) | 0 (0.0%) |
| 15 Years | 0 (0.0%) | 0 (0.0%) |
| 16 and 17 Years | 0 (0.0%) | 27 (35.1%) |
| 18 to 24 Years | 0 (0.0%) | 0 (0.0%) |
| 25 to 34 Years | 0 (0.0%) | 0 (0.0%) |
| 35 to 44 Years | 0 (0.0%) | 0 (0.0%) |
| 45 to 54 Years | 18 (7.9%) | 17 (6.8%) |
| 55 to 64 Years | 23 (12.6%) | 21 (7.9%) |
| 65 to 74 Years | 0 (0.0%) | 0 (0.0%) |
| 75 Years and over | 0 (0.0%) | 0 (0.0%) |
| Total | 41 (2.4%) | 65 (3.3%) |
Income Above Poverty by Sex and Age in Rochester
According to the poverty statistics in Rochester, males aged under 5 years and females aged under 5 years are the age groups that are most secure financially, with 100.0% of males and 100.0% of females in these age groups living above the poverty line.
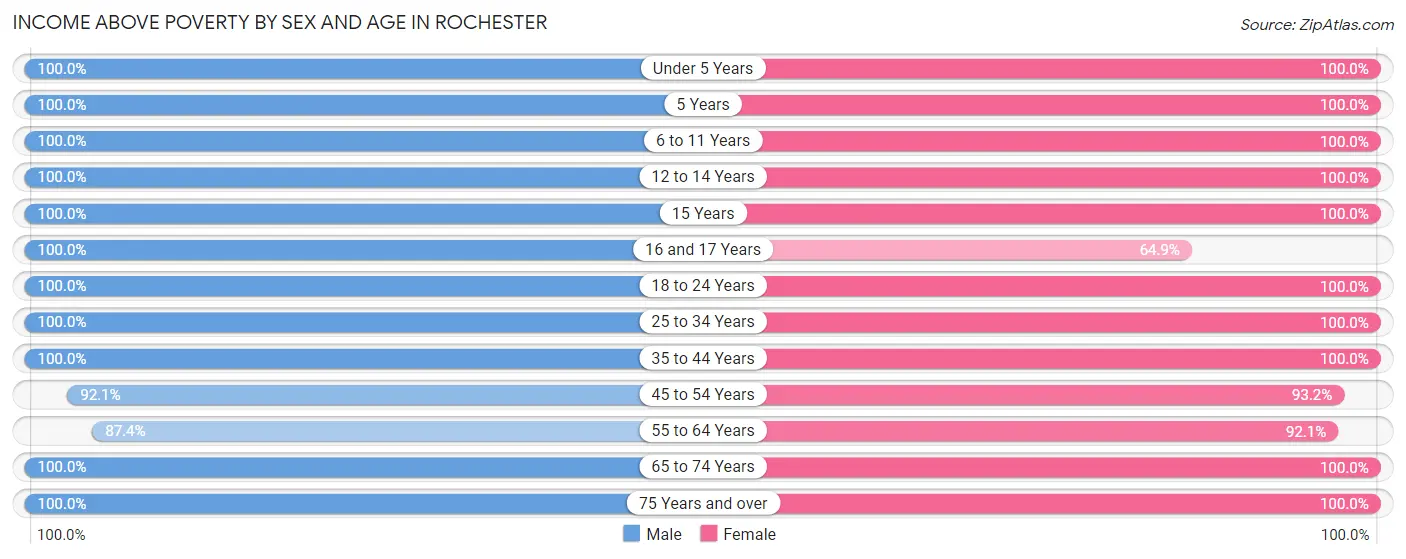
| Age Bracket | Male | Female |
| Under 5 Years | 126 (100.0%) | 92 (100.0%) |
| 5 Years | 7 (100.0%) | 43 (100.0%) |
| 6 to 11 Years | 114 (100.0%) | 174 (100.0%) |
| 12 to 14 Years | 77 (100.0%) | 106 (100.0%) |
| 15 Years | 62 (100.0%) | 52 (100.0%) |
| 16 and 17 Years | 73 (100.0%) | 50 (64.9%) |
| 18 to 24 Years | 131 (100.0%) | 125 (100.0%) |
| 25 to 34 Years | 169 (100.0%) | 118 (100.0%) |
| 35 to 44 Years | 222 (100.0%) | 302 (100.0%) |
| 45 to 54 Years | 209 (92.1%) | 234 (93.2%) |
| 55 to 64 Years | 160 (87.4%) | 245 (92.1%) |
| 65 to 74 Years | 228 (100.0%) | 269 (100.0%) |
| 75 Years and over | 115 (100.0%) | 119 (100.0%) |
| Total | 1,693 (97.6%) | 1,929 (96.7%) |
Income Below Poverty Among Married-Couple Families in Rochester
The poverty statistics for married-couple families in Rochester show that 1.4% or 13 of the total 926 families live below the poverty line. Families with no children have the highest poverty rate of 2.9%, comprising of 13 families. On the other hand, families with 1 or 2 children have the lowest poverty rate of 0.0%, which includes 0 families.
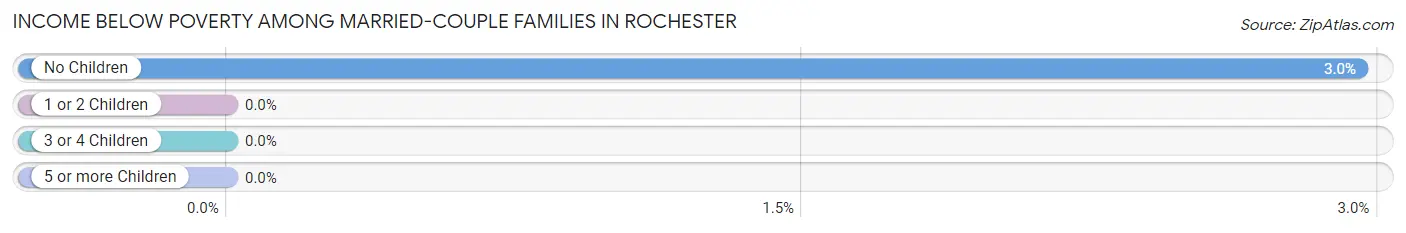
| Children | Above Poverty | Below Poverty |
| No Children | 428 (97.1%) | 13 (2.9%) |
| 1 or 2 Children | 391 (100.0%) | 0 (0.0%) |
| 3 or 4 Children | 84 (100.0%) | 0 (0.0%) |
| 5 or more Children | 10 (100.0%) | 0 (0.0%) |
| Total | 913 (98.6%) | 13 (1.4%) |
Income Below Poverty Among Single-Parent Households in Rochester
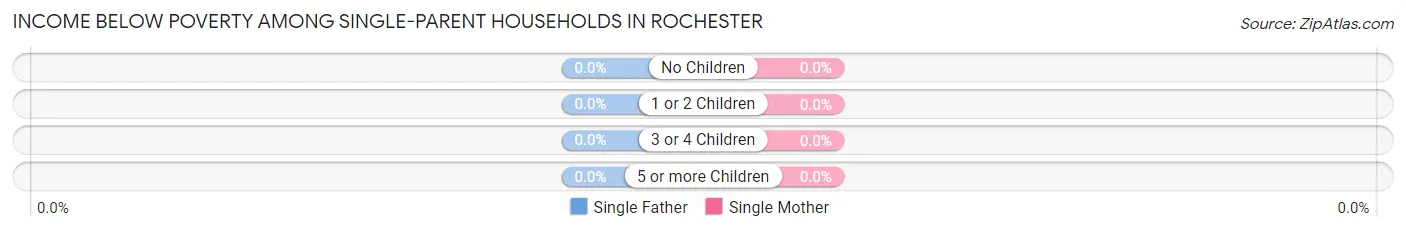
| Children | Single Father | Single Mother |
| No Children | 0 (0.0%) | 0 (0.0%) |
| 1 or 2 Children | 0 (0.0%) | 0 (0.0%) |
| 3 or 4 Children | 0 (0.0%) | 0 (0.0%) |
| 5 or more Children | 0 (0.0%) | 0 (0.0%) |
| Total | 0 (0.0%) | 0 (0.0%) |
Income Below Poverty Among Married-Couple vs Single-Parent Households in Rochester
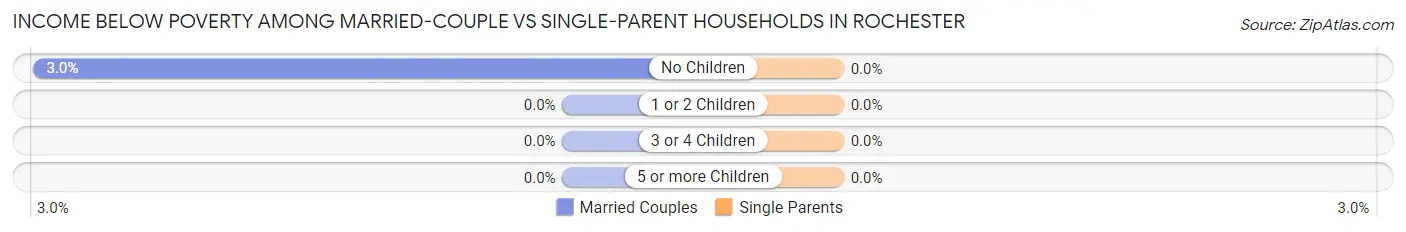
| Children | Married-Couple Families | Single-Parent Households |
| No Children | 13 (2.9%) | 0 (0.0%) |
| 1 or 2 Children | 0 (0.0%) | 0 (0.0%) |
| 3 or 4 Children | 0 (0.0%) | 0 (0.0%) |
| 5 or more Children | 0 (0.0%) | 0 (0.0%) |
| Total | 13 (1.4%) | 0 (0.0%) |
Race in Rochester
The most populous races in Rochester are White / Caucasian (3,564 | 95.0%), Two or more Races (94 | 2.5%), and Asian (78 | 2.1%).
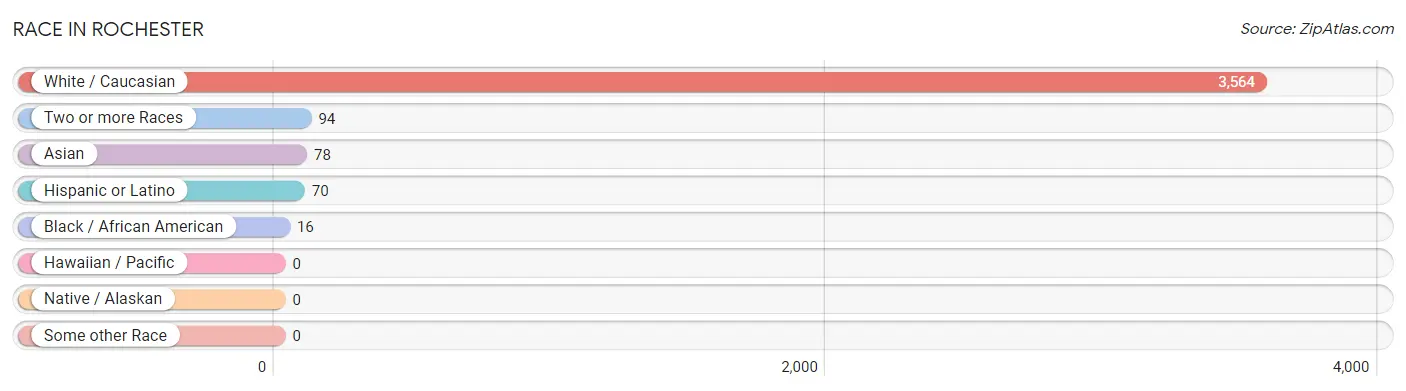
| Race | # Population | % Population |
| Asian | 78 | 2.1% |
| Black / African American | 16 | 0.4% |
| Hawaiian / Pacific | 0 | 0.0% |
| Hispanic or Latino | 70 | 1.9% |
| Native / Alaskan | 0 | 0.0% |
| White / Caucasian | 3,564 | 95.0% |
| Two or more Races | 94 | 2.5% |
| Some other Race | 0 | 0.0% |
| Total | 3,752 | 100.0% |
Ancestry in Rochester
The most populous ancestries reported in Rochester are German (895 | 23.8%), English (707 | 18.8%), Irish (485 | 12.9%), Italian (263 | 7.0%), and American (238 | 6.3%), together accounting for 69.0% of all Rochester residents.
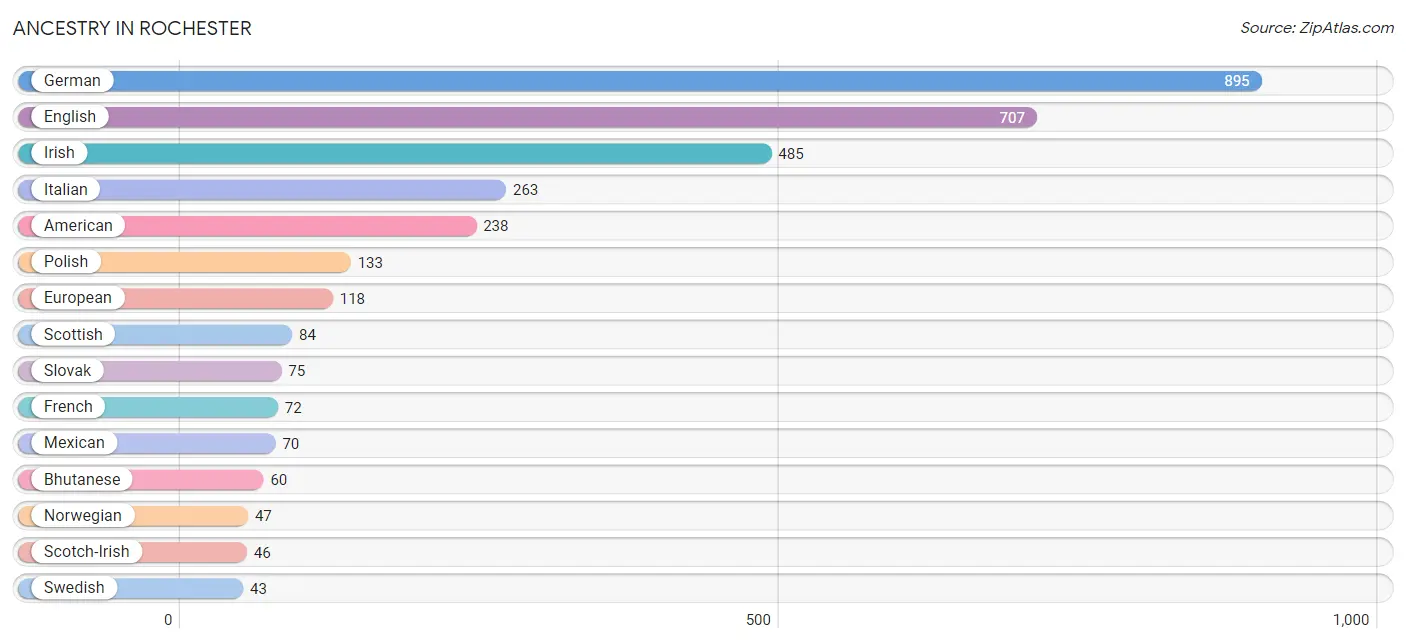
| Ancestry | # Population | % Population |
| African | 27 | 0.7% |
| American | 238 | 6.3% |
| Austrian | 18 | 0.5% |
| Bhutanese | 60 | 1.6% |
| British | 23 | 0.6% |
| Choctaw | 4 | 0.1% |
| Czechoslovakian | 18 | 0.5% |
| Danish | 18 | 0.5% |
| Dutch | 16 | 0.4% |
| Eastern European | 8 | 0.2% |
| English | 707 | 18.8% |
| European | 118 | 3.1% |
| French | 72 | 1.9% |
| French Canadian | 5 | 0.1% |
| German | 895 | 23.8% |
| Greek | 33 | 0.9% |
| Hungarian | 15 | 0.4% |
| Indian (Asian) | 18 | 0.5% |
| Irish | 485 | 12.9% |
| Italian | 263 | 7.0% |
| Lithuanian | 40 | 1.1% |
| Mexican | 70 | 1.9% |
| Navajo | 17 | 0.4% |
| Northern European | 25 | 0.7% |
| Norwegian | 47 | 1.3% |
| Polish | 133 | 3.5% |
| Russian | 27 | 0.7% |
| Scandinavian | 24 | 0.6% |
| Scotch-Irish | 46 | 1.2% |
| Scottish | 84 | 2.2% |
| Seminole | 5 | 0.1% |
| Slovak | 75 | 2.0% |
| Subsaharan African | 27 | 0.7% |
| Swedish | 43 | 1.1% |
| Swiss | 30 | 0.8% |
| Ukrainian | 17 | 0.4% |
| Welsh | 10 | 0.3% |
| Yugoslavian | 10 | 0.3% | View All 38 Rows |
Immigrants in Rochester
The most numerous immigrant groups reported in Rochester came from Asia (9 | 0.2%), China (9 | 0.2%), and Eastern Asia (9 | 0.2%), together accounting for 0.7% of all Rochester residents.
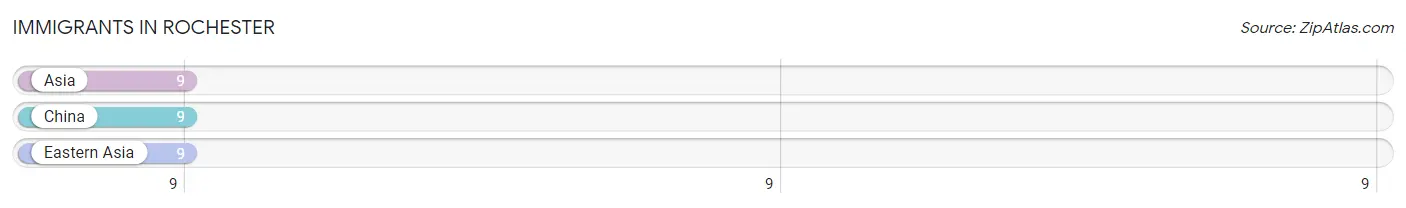
| Immigration Origin | # Population | % Population |
| Asia | 9 | 0.2% |
| China | 9 | 0.2% |
| Eastern Asia | 9 | 0.2% | View All 3 Rows |
Sex and Age in Rochester
Sex and Age in Rochester
The most populous age groups in Rochester are 15 to 19 Years (177 | 10.1%) for men and 35 to 39 Years (203 | 10.1%) for women.
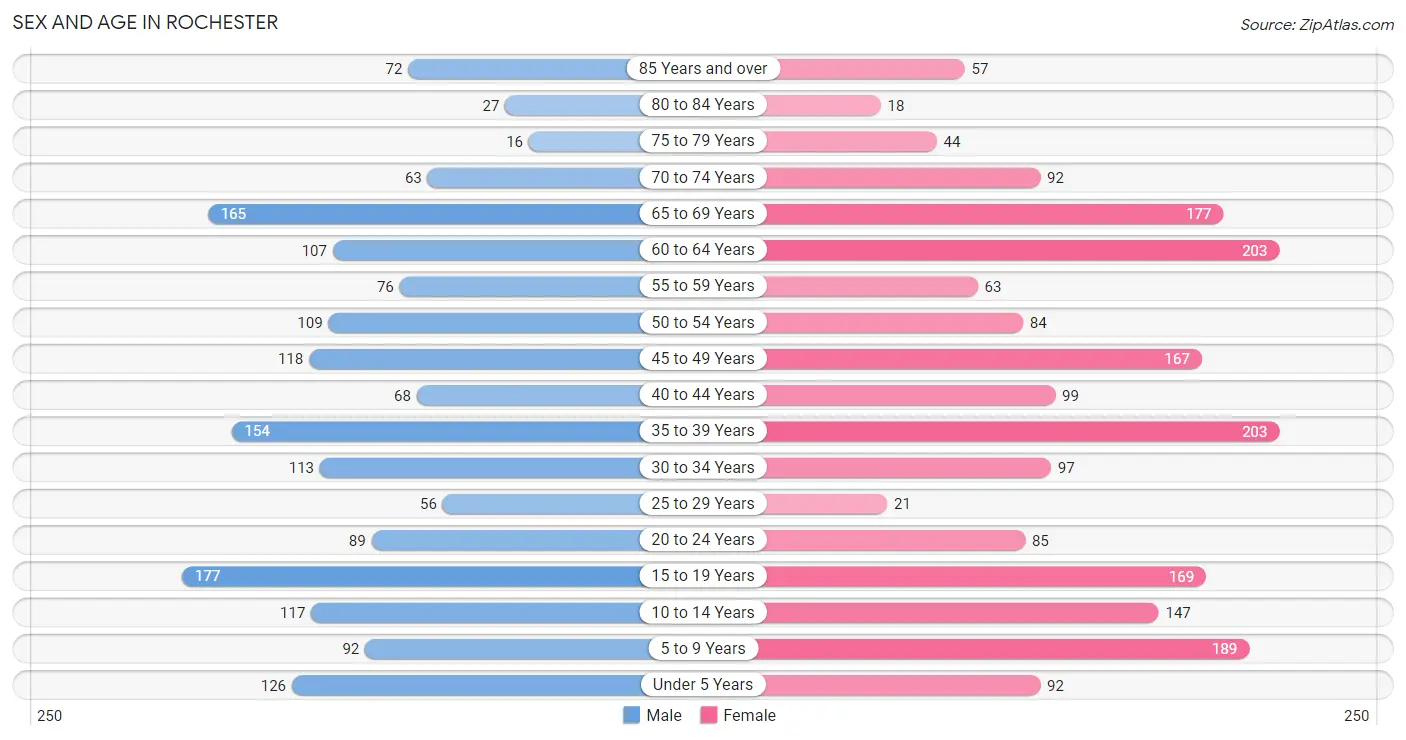
| Age Bracket | Male | Female |
| Under 5 Years | 126 (7.2%) | 92 (4.6%) |
| 5 to 9 Years | 92 (5.3%) | 189 (9.4%) |
| 10 to 14 Years | 117 (6.7%) | 147 (7.3%) |
| 15 to 19 Years | 177 (10.1%) | 169 (8.4%) |
| 20 to 24 Years | 89 (5.1%) | 85 (4.2%) |
| 25 to 29 Years | 56 (3.2%) | 21 (1.1%) |
| 30 to 34 Years | 113 (6.5%) | 97 (4.8%) |
| 35 to 39 Years | 154 (8.8%) | 203 (10.1%) |
| 40 to 44 Years | 68 (3.9%) | 99 (4.9%) |
| 45 to 49 Years | 118 (6.8%) | 167 (8.3%) |
| 50 to 54 Years | 109 (6.2%) | 84 (4.2%) |
| 55 to 59 Years | 76 (4.4%) | 63 (3.1%) |
| 60 to 64 Years | 107 (6.1%) | 203 (10.1%) |
| 65 to 69 Years | 165 (9.5%) | 177 (8.8%) |
| 70 to 74 Years | 63 (3.6%) | 92 (4.6%) |
| 75 to 79 Years | 16 (0.9%) | 44 (2.2%) |
| 80 to 84 Years | 27 (1.5%) | 18 (0.9%) |
| 85 Years and over | 72 (4.1%) | 57 (2.8%) |
| Total | 1,745 (100.0%) | 2,007 (100.0%) |
Families and Households in Rochester
Median Family Size in Rochester
The median family size in Rochester is 3.08 persons per family, with married-couple families (926 | 86.9%) accounting for the largest median family size of 3.1 persons per family. On the other hand, single male/father families (9 | 0.8%) represent the smallest median family size with 2.44 persons per family.
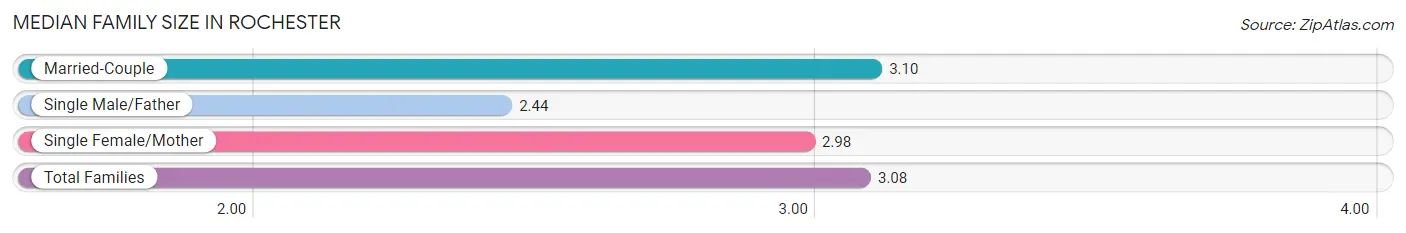
| Family Type | # Families | Family Size |
| Married-Couple | 926 (86.9%) | 3.10 |
| Single Male/Father | 9 (0.8%) | 2.44 |
| Single Female/Mother | 131 (12.3%) | 2.98 |
| Total Families | 1,066 (100.0%) | 3.08 |
Median Household Size in Rochester
The median household size in Rochester is 2.73 persons per household, with married-couple households (926 | 67.5%) accounting for the largest median household size of 3.1 persons per household. non-family households (306 | 22.3%) represent the smallest median household size with 1.49 persons per household.
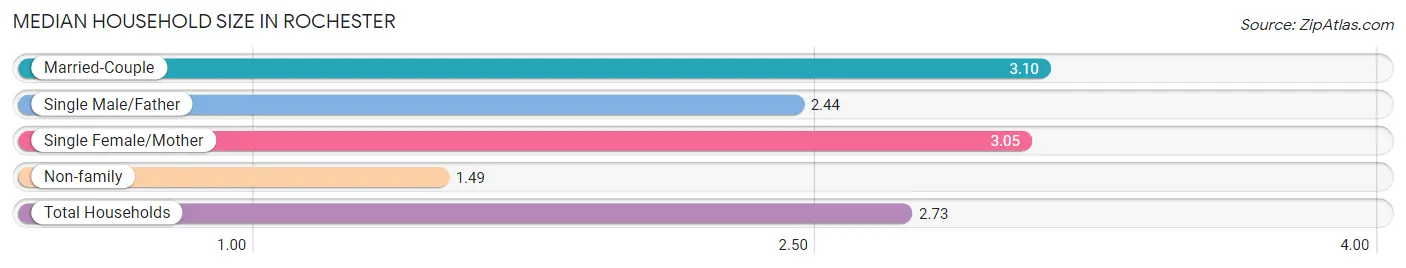
| Household Type | # Households | Household Size |
| Married-Couple | 926 (67.5%) | 3.10 |
| Single Male/Father | 9 (0.7%) | 2.44 |
| Single Female/Mother | 131 (9.6%) | 3.05 |
| Non-family | 306 (22.3%) | 1.49 |
| Total Households | 1,372 (100.0%) | 2.73 |
Household Size by Marriage Status in Rochester
Out of a total of 1,372 households in Rochester, 1,066 (77.7%) are family households, while 306 (22.3%) are nonfamily households. The most numerous type of family households are 2-person households, comprising 487, and the most common type of nonfamily households are 1-person households, comprising 199.
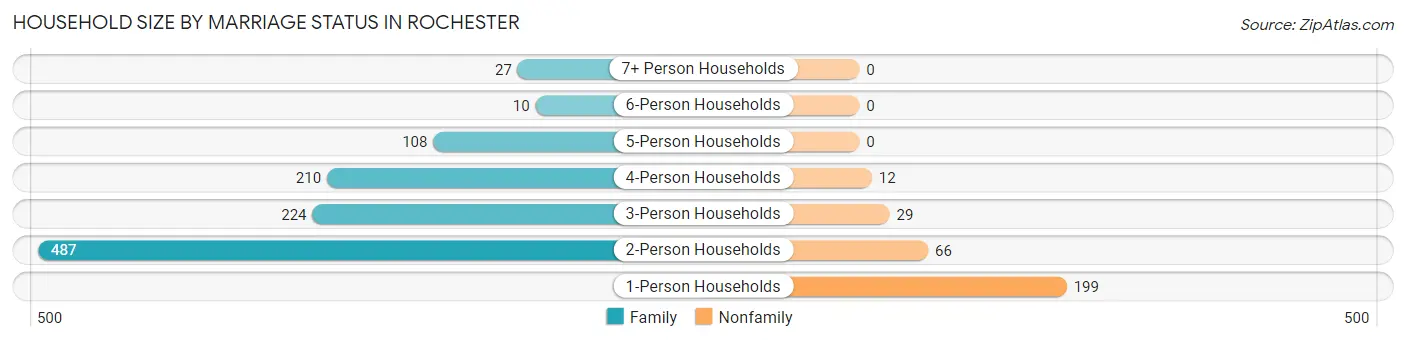
| Household Size | Family Households | Nonfamily Households |
| 1-Person Households | - | 199 (14.5%) |
| 2-Person Households | 487 (35.5%) | 66 (4.8%) |
| 3-Person Households | 224 (16.3%) | 29 (2.1%) |
| 4-Person Households | 210 (15.3%) | 12 (0.9%) |
| 5-Person Households | 108 (7.9%) | 0 (0.0%) |
| 6-Person Households | 10 (0.7%) | 0 (0.0%) |
| 7+ Person Households | 27 (2.0%) | 0 (0.0%) |
| Total | 1,066 (77.7%) | 306 (22.3%) |
Female Fertility in Rochester
Fertility by Age in Rochester
Average fertility rate in Rochester is 67.0 births per 1,000 women. Women in the age bracket of 35 to 50 years have the highest fertility rate with 86.0 births per 1,000 women. Women in the age bracket of 35 to 50 years acount for 74.1% of all women with births.
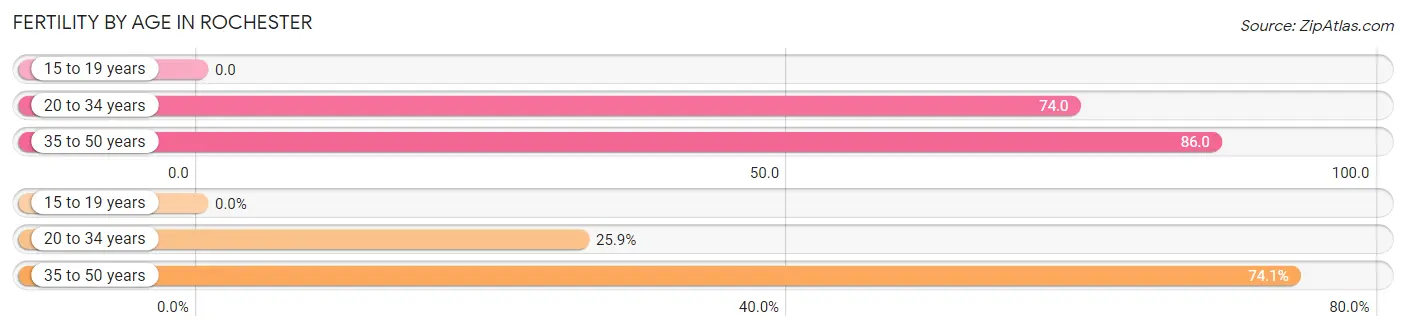
| Age Bracket | Women with Births | Births / 1,000 Women |
| 15 to 19 years | 0 (0.0%) | 0.0 |
| 20 to 34 years | 15 (25.9%) | 74.0 |
| 35 to 50 years | 43 (74.1%) | 86.0 |
| Total | 58 (100.0%) | 67.0 |
Fertility by Age by Marriage Status in Rochester
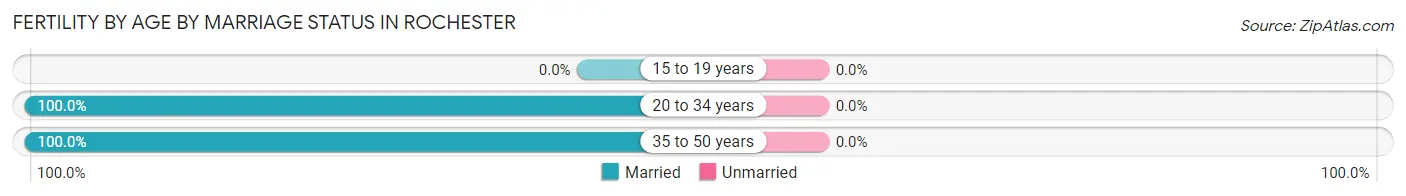
| Age Bracket | Married | Unmarried |
| 15 to 19 years | 0 (0.0%) | 0 (0.0%) |
| 20 to 34 years | 15 (100.0%) | 0 (0.0%) |
| 35 to 50 years | 43 (100.0%) | 0 (0.0%) |
| Total | 58 (100.0%) | 0 (0.0%) |
Fertility by Education in Rochester
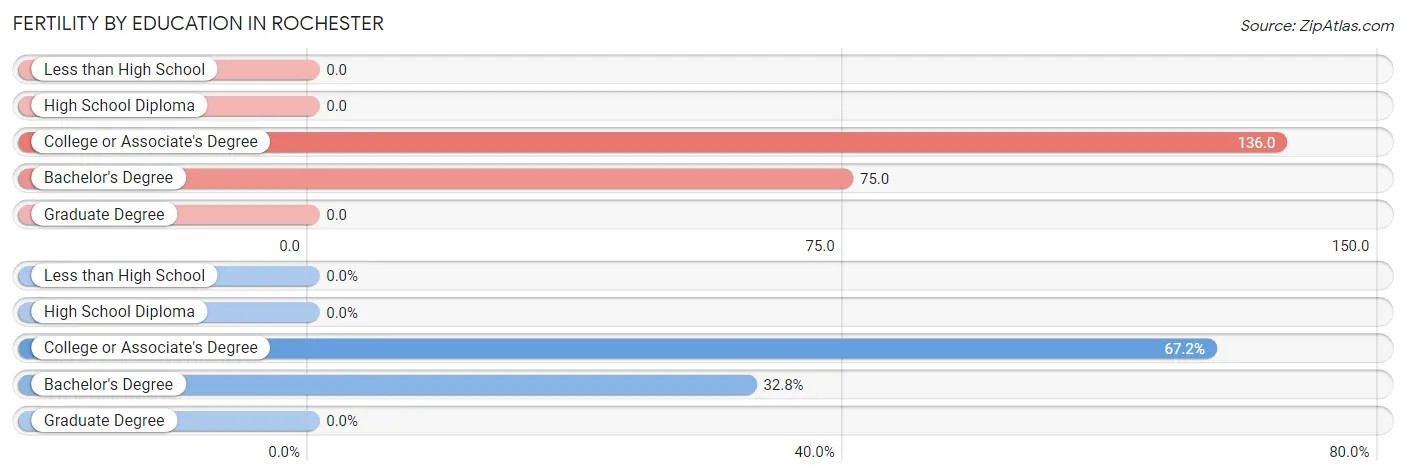
| Educational Attainment | Women with Births | Births / 1,000 Women |
| Less than High School | 0 (0.0%) | 0.0 |
| High School Diploma | 0 (0.0%) | 0.0 |
| College or Associate's Degree | 39 (67.2%) | 136.0 |
| Bachelor's Degree | 19 (32.8%) | 75.0 |
| Graduate Degree | 0 (0.0%) | 0.0 |
| Total | 58 (100.0%) | 67.0 |
Fertility by Education by Marriage Status in Rochester
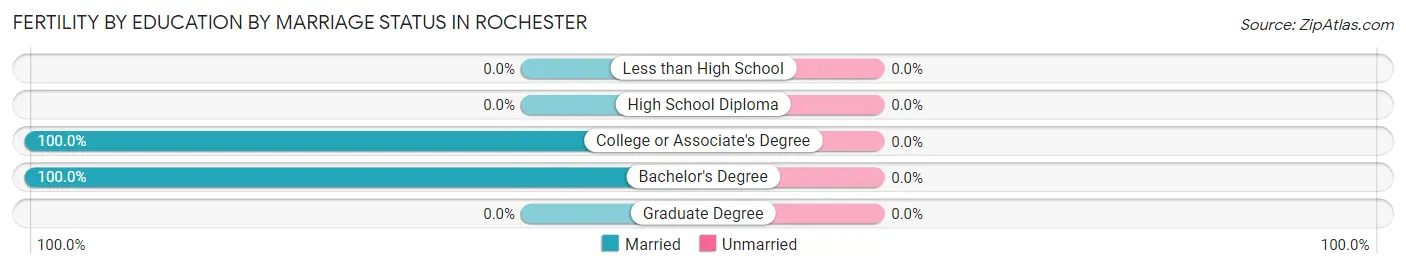
| Educational Attainment | Married | Unmarried |
| Less than High School | 0 (0.0%) | 0 (0.0%) |
| High School Diploma | 0 (0.0%) | 0 (0.0%) |
| College or Associate's Degree | 39 (100.0%) | 0 (0.0%) |
| Bachelor's Degree | 19 (100.0%) | 0 (0.0%) |
| Graduate Degree | 0 (0.0%) | 0 (0.0%) |
| Total | 58 (100.0%) | 0 (0.0%) |
Employment Characteristics in Rochester
Employment by Class of Employer in Rochester
Among the 1,581 employed individuals in Rochester, private company employees (890 | 56.3%), state government employees (286 | 18.1%), and not-for-profit organizations (221 | 14.0%) make up the most common classes of employment.
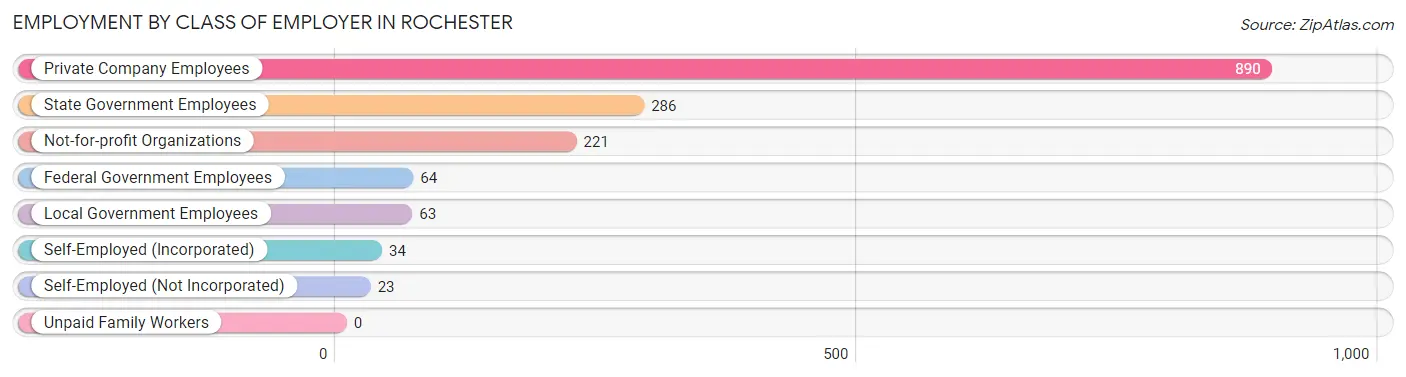
| Employer Class | # Employees | % Employees |
| Private Company Employees | 890 | 56.3% |
| Self-Employed (Incorporated) | 34 | 2.1% |
| Self-Employed (Not Incorporated) | 23 | 1.5% |
| Not-for-profit Organizations | 221 | 14.0% |
| Local Government Employees | 63 | 4.0% |
| State Government Employees | 286 | 18.1% |
| Federal Government Employees | 64 | 4.1% |
| Unpaid Family Workers | 0 | 0.0% |
| Total | 1,581 | 100.0% |
Employment Status by Age in Rochester
According to the labor force statistics for Rochester, out of the total population over 16 years of age (2,875), 57.2% or 1,644 individuals are in the labor force, with 3.9% or 64 of them unemployed. The age group with the highest labor force participation rate is 25 to 29 years, with 100.0% or 77 individuals in the labor force. Within the labor force, the 20 to 24 years age range has the highest percentage of unemployed individuals, with 16.8% or 24 of them being unemployed.
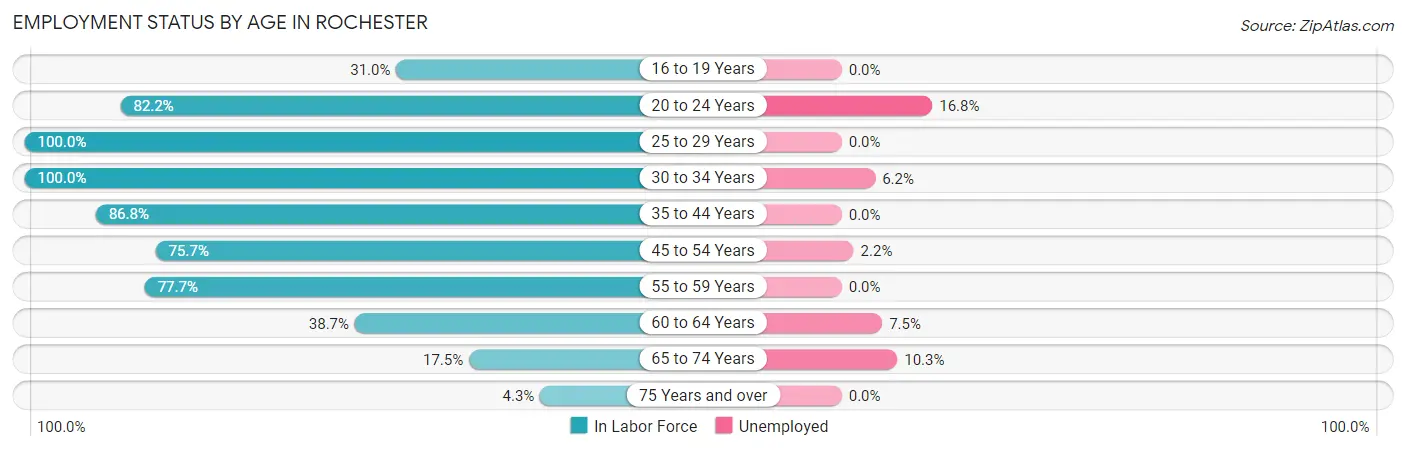
| Age Bracket | In Labor Force | Unemployed |
| 16 to 19 Years | 72 (31.0%) | 0 (0.0%) |
| 20 to 24 Years | 143 (82.2%) | 24 (16.8%) |
| 25 to 29 Years | 77 (100.0%) | 0 (0.0%) |
| 30 to 34 Years | 210 (100.0%) | 13 (6.2%) |
| 35 to 44 Years | 455 (86.8%) | 0 (0.0%) |
| 45 to 54 Years | 362 (75.7%) | 8 (2.2%) |
| 55 to 59 Years | 108 (77.7%) | 0 (0.0%) |
| 60 to 64 Years | 120 (38.7%) | 9 (7.5%) |
| 65 to 74 Years | 87 (17.5%) | 9 (10.3%) |
| 75 Years and over | 10 (4.3%) | 0 (0.0%) |
| Total | 1,644 (57.2%) | 64 (3.9%) |
Employment Status by Educational Attainment in Rochester
According to labor force statistics for Rochester, 76.6% of individuals (1,331) out of the total population between 25 and 64 years of age (1,738) are in the labor force, with 2.3% or 31 of them being unemployed. The group with the highest labor force participation rate are those with the educational attainment of college / associate degree, with 81.9% or 357 individuals in the labor force. Within the labor force, individuals with less than high school education have the highest percentage of unemployment, with 30.8% or 8 of them being unemployed.
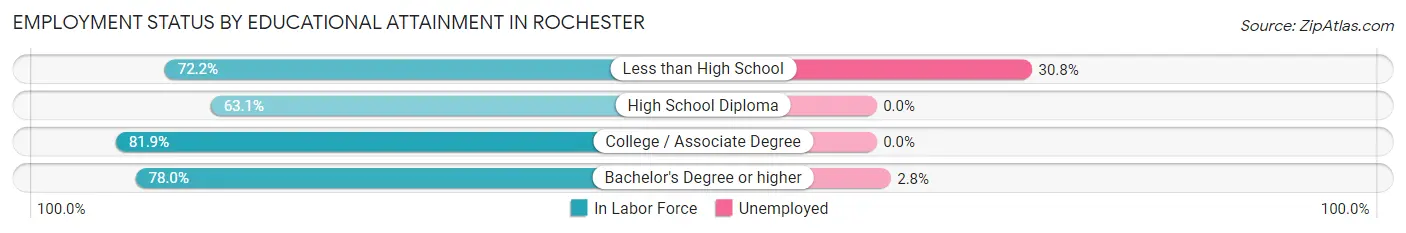
| Educational Attainment | In Labor Force | Unemployed |
| Less than High School | 26 (72.2%) | 11 (30.8%) |
| High School Diploma | 164 (63.1%) | 0 (0.0%) |
| College / Associate Degree | 357 (81.9%) | 0 (0.0%) |
| Bachelor's Degree or higher | 785 (78.0%) | 28 (2.8%) |
| Total | 1,331 (76.6%) | 40 (2.3%) |
Employment Occupations by Sex in Rochester
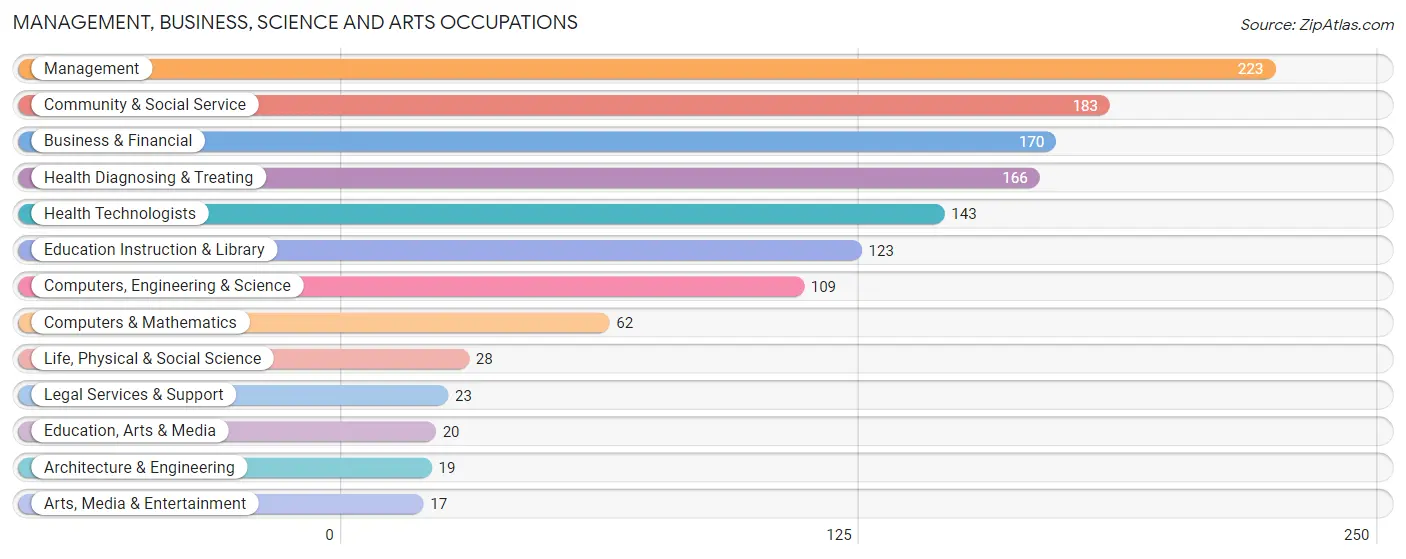
Management, Business, Science and Arts Occupations
The most common Management, Business, Science and Arts occupations in Rochester are Management (223 | 14.5%), Community & Social Service (183 | 11.9%), Business & Financial (170 | 11.1%), Health Diagnosing & Treating (166 | 10.8%), and Health Technologists (143 | 9.3%).
Management, Business, Science and Arts Occupations by Sex
Within the Management, Business, Science and Arts occupations in Rochester, the most male-oriented occupations are Architecture & Engineering (100.0%), Computers & Mathematics (87.1%), and Computers, Engineering & Science (86.2%), while the most female-oriented occupations are Education, Arts & Media (100.0%), Arts, Media & Entertainment (100.0%), and Education Instruction & Library (79.7%).
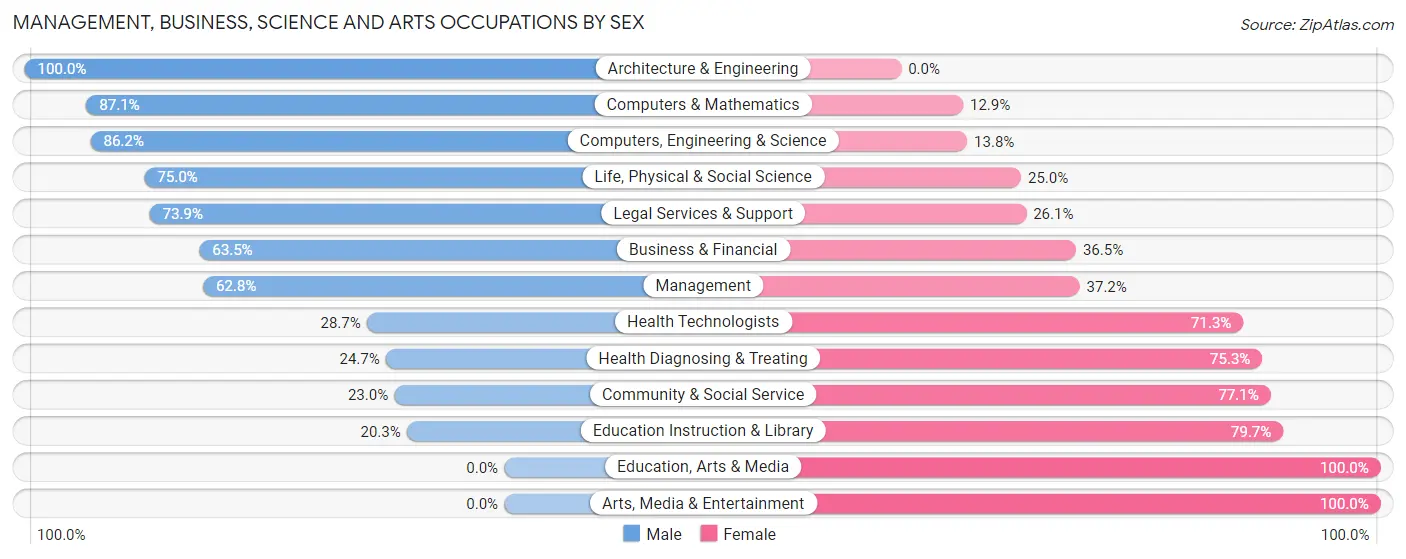
| Occupation | Male | Female |
| Management | 140 (62.8%) | 83 (37.2%) |
| Business & Financial | 108 (63.5%) | 62 (36.5%) |
| Computers, Engineering & Science | 94 (86.2%) | 15 (13.8%) |
| Computers & Mathematics | 54 (87.1%) | 8 (12.9%) |
| Architecture & Engineering | 19 (100.0%) | 0 (0.0%) |
| Life, Physical & Social Science | 21 (75.0%) | 7 (25.0%) |
| Community & Social Service | 42 (23.0%) | 141 (77.0%) |
| Education, Arts & Media | 0 (0.0%) | 20 (100.0%) |
| Legal Services & Support | 17 (73.9%) | 6 (26.1%) |
| Education Instruction & Library | 25 (20.3%) | 98 (79.7%) |
| Arts, Media & Entertainment | 0 (0.0%) | 17 (100.0%) |
| Health Diagnosing & Treating | 41 (24.7%) | 125 (75.3%) |
| Health Technologists | 41 (28.7%) | 102 (71.3%) |
| Total (Category) | 425 (49.9%) | 426 (50.1%) |
| Total (Overall) | 785 (51.1%) | 750 (48.9%) |
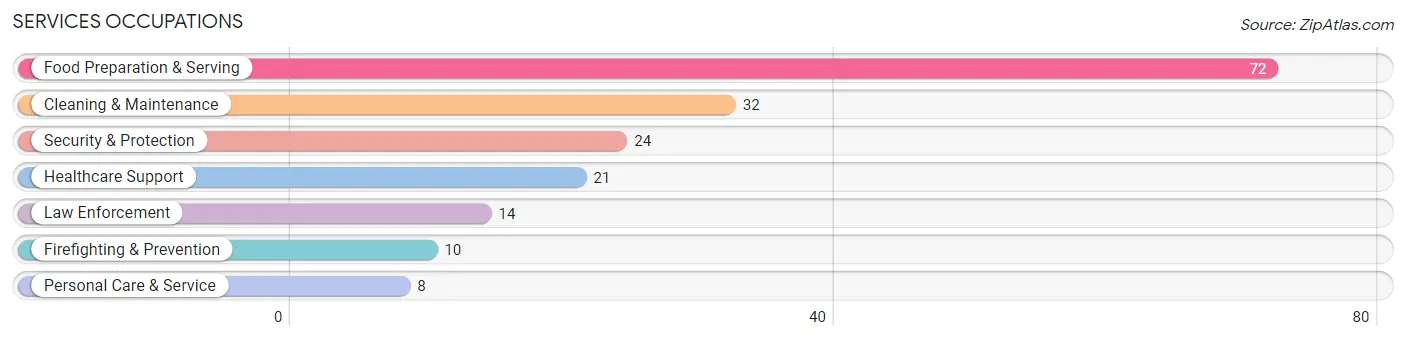
Services Occupations
The most common Services occupations in Rochester are Food Preparation & Serving (72 | 4.7%), Cleaning & Maintenance (32 | 2.1%), Security & Protection (24 | 1.6%), Healthcare Support (21 | 1.4%), and Law Enforcement (14 | 0.9%).
Services Occupations by Sex
Within the Services occupations in Rochester, the most male-oriented occupations are Security & Protection (100.0%), Firefighting & Prevention (100.0%), and Law Enforcement (100.0%), while the most female-oriented occupations are Healthcare Support (100.0%), Personal Care & Service (100.0%), and Food Preparation & Serving (33.3%).
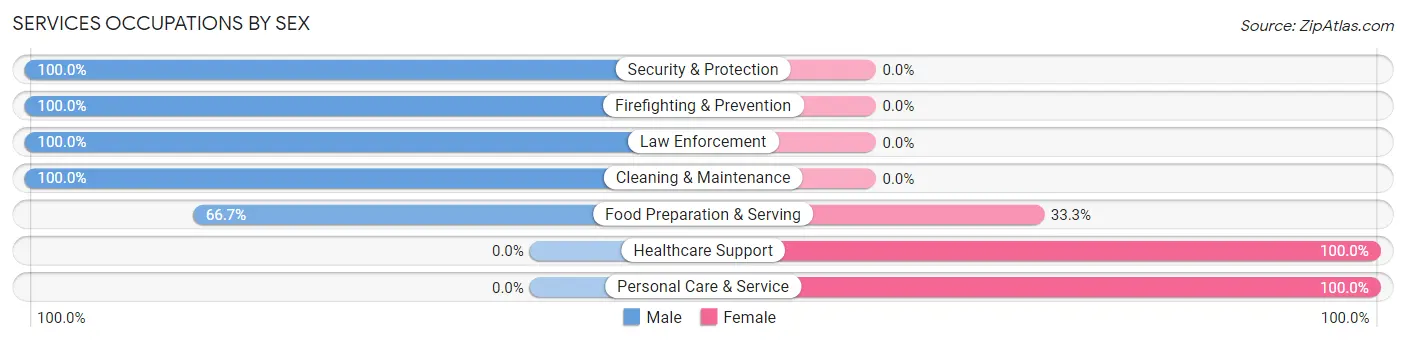
| Occupation | Male | Female |
| Healthcare Support | 0 (0.0%) | 21 (100.0%) |
| Security & Protection | 24 (100.0%) | 0 (0.0%) |
| Firefighting & Prevention | 10 (100.0%) | 0 (0.0%) |
| Law Enforcement | 14 (100.0%) | 0 (0.0%) |
| Food Preparation & Serving | 48 (66.7%) | 24 (33.3%) |
| Cleaning & Maintenance | 32 (100.0%) | 0 (0.0%) |
| Personal Care & Service | 0 (0.0%) | 8 (100.0%) |
| Total (Category) | 104 (66.2%) | 53 (33.8%) |
| Total (Overall) | 785 (51.1%) | 750 (48.9%) |
Sales and Office Occupations
The most common Sales and Office occupations in Rochester are Office & Administration (220 | 14.3%), and Sales & Related (136 | 8.9%).
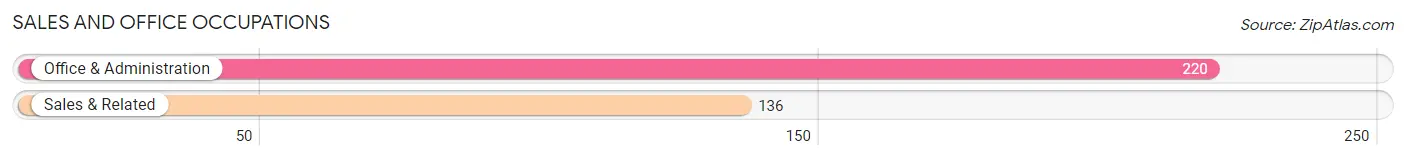
Sales and Office Occupations by Sex
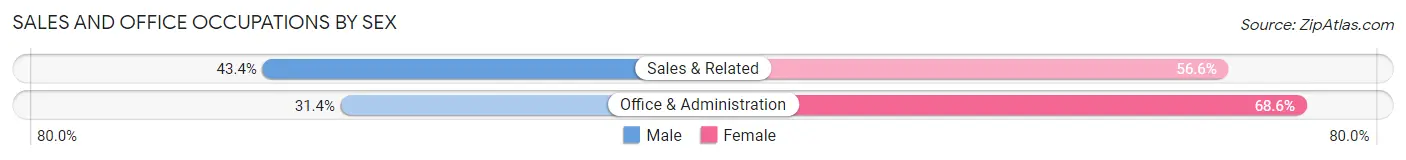
| Occupation | Male | Female |
| Sales & Related | 59 (43.4%) | 77 (56.6%) |
| Office & Administration | 69 (31.4%) | 151 (68.6%) |
| Total (Category) | 128 (36.0%) | 228 (64.0%) |
| Total (Overall) | 785 (51.1%) | 750 (48.9%) |
Natural Resources, Construction and Maintenance Occupations
The most common Natural Resources, Construction and Maintenance occupations in Rochester are Installation, Maintenance & Repair (44 | 2.9%), and Construction & Extraction (16 | 1.0%).
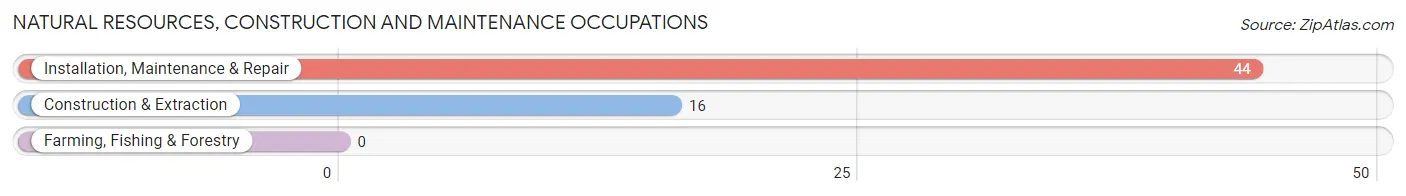
Natural Resources, Construction and Maintenance Occupations by Sex
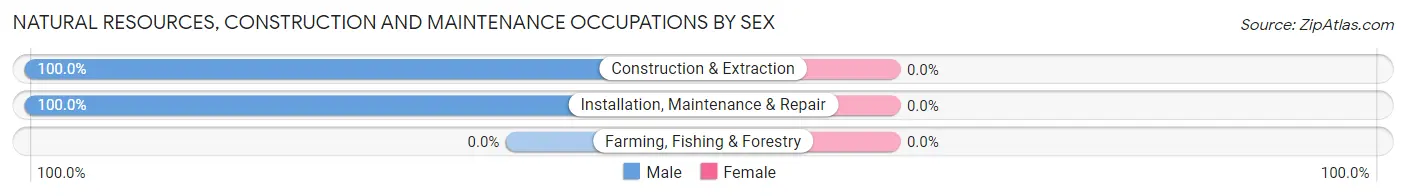
| Occupation | Male | Female |
| Farming, Fishing & Forestry | 0 (0.0%) | 0 (0.0%) |
| Construction & Extraction | 16 (100.0%) | 0 (0.0%) |
| Installation, Maintenance & Repair | 44 (100.0%) | 0 (0.0%) |
| Total (Category) | 60 (100.0%) | 0 (0.0%) |
| Total (Overall) | 785 (51.1%) | 750 (48.9%) |
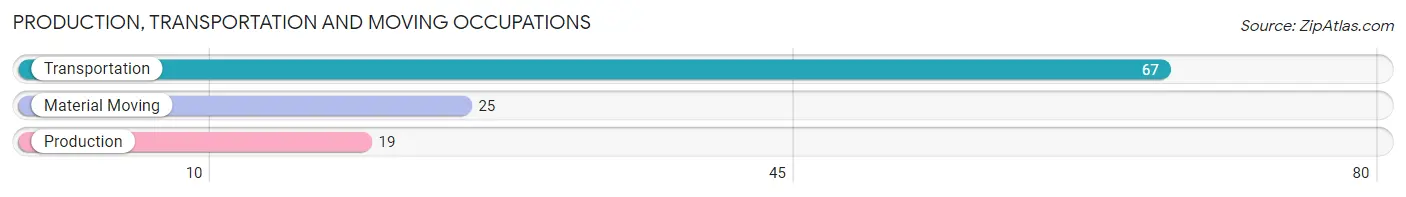
Production, Transportation and Moving Occupations
The most common Production, Transportation and Moving occupations in Rochester are Transportation (67 | 4.4%), Material Moving (25 | 1.6%), and Production (19 | 1.2%).
Production, Transportation and Moving Occupations by Sex
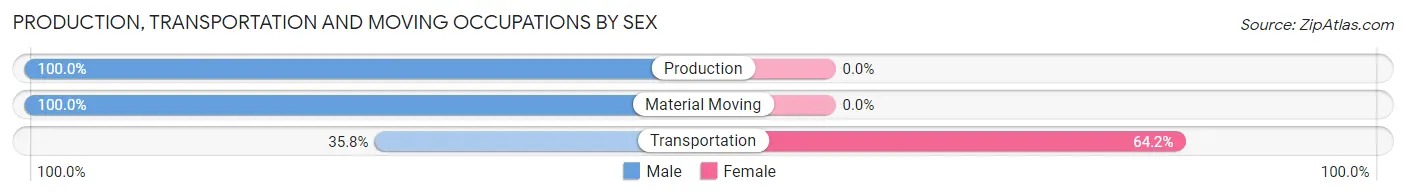
| Occupation | Male | Female |
| Production | 19 (100.0%) | 0 (0.0%) |
| Transportation | 24 (35.8%) | 43 (64.2%) |
| Material Moving | 25 (100.0%) | 0 (0.0%) |
| Total (Category) | 68 (61.3%) | 43 (38.7%) |
| Total (Overall) | 785 (51.1%) | 750 (48.9%) |
Employment Industries by Sex in Rochester
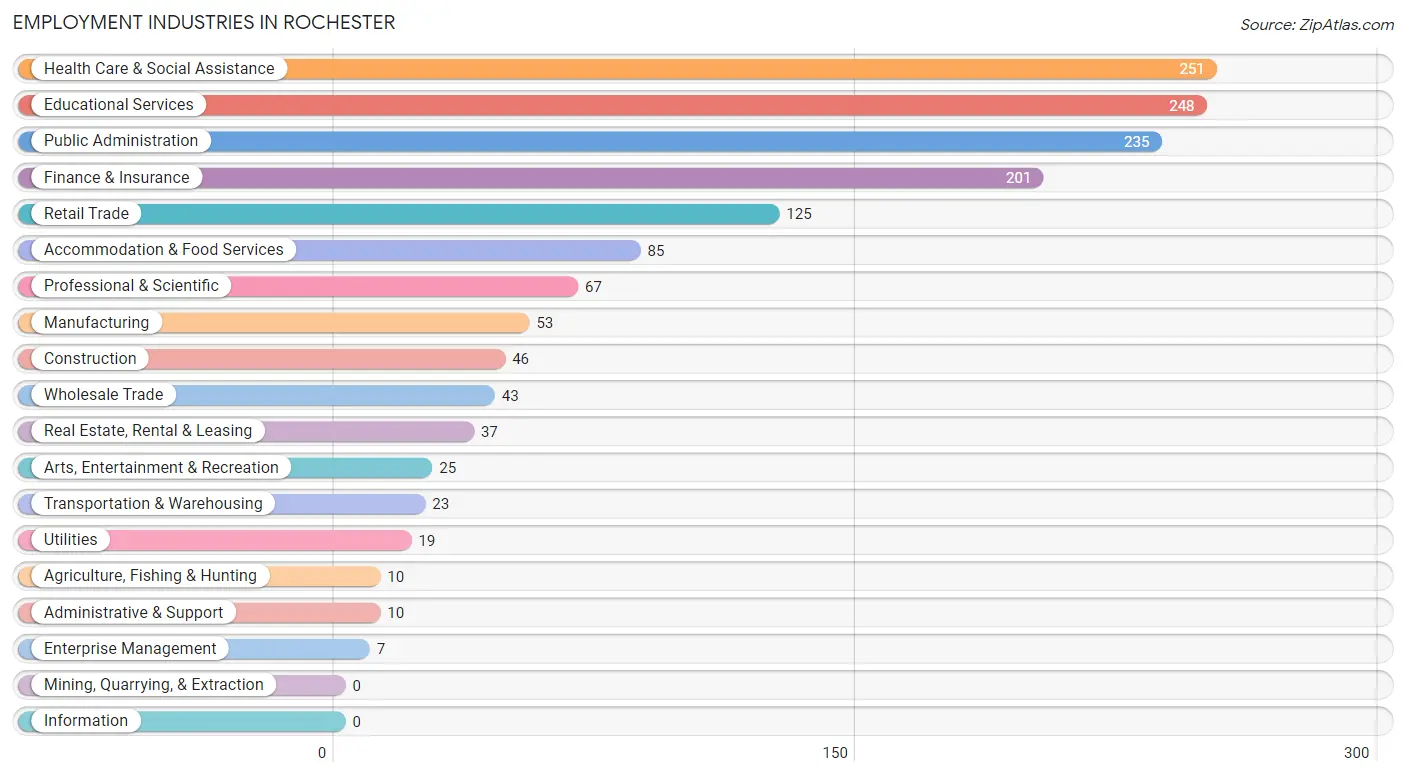
Employment Industries in Rochester
The major employment industries in Rochester include Health Care & Social Assistance (251 | 16.4%), Educational Services (248 | 16.2%), Public Administration (235 | 15.3%), Finance & Insurance (201 | 13.1%), and Retail Trade (125 | 8.1%).
Employment Industries by Sex in Rochester
The Rochester industries that see more men than women are Agriculture, Fishing & Hunting (100.0%), Construction (100.0%), and Wholesale Trade (100.0%), whereas the industries that tend to have a higher number of women are Health Care & Social Assistance (75.3%), Educational Services (69.8%), and Public Administration (59.6%).
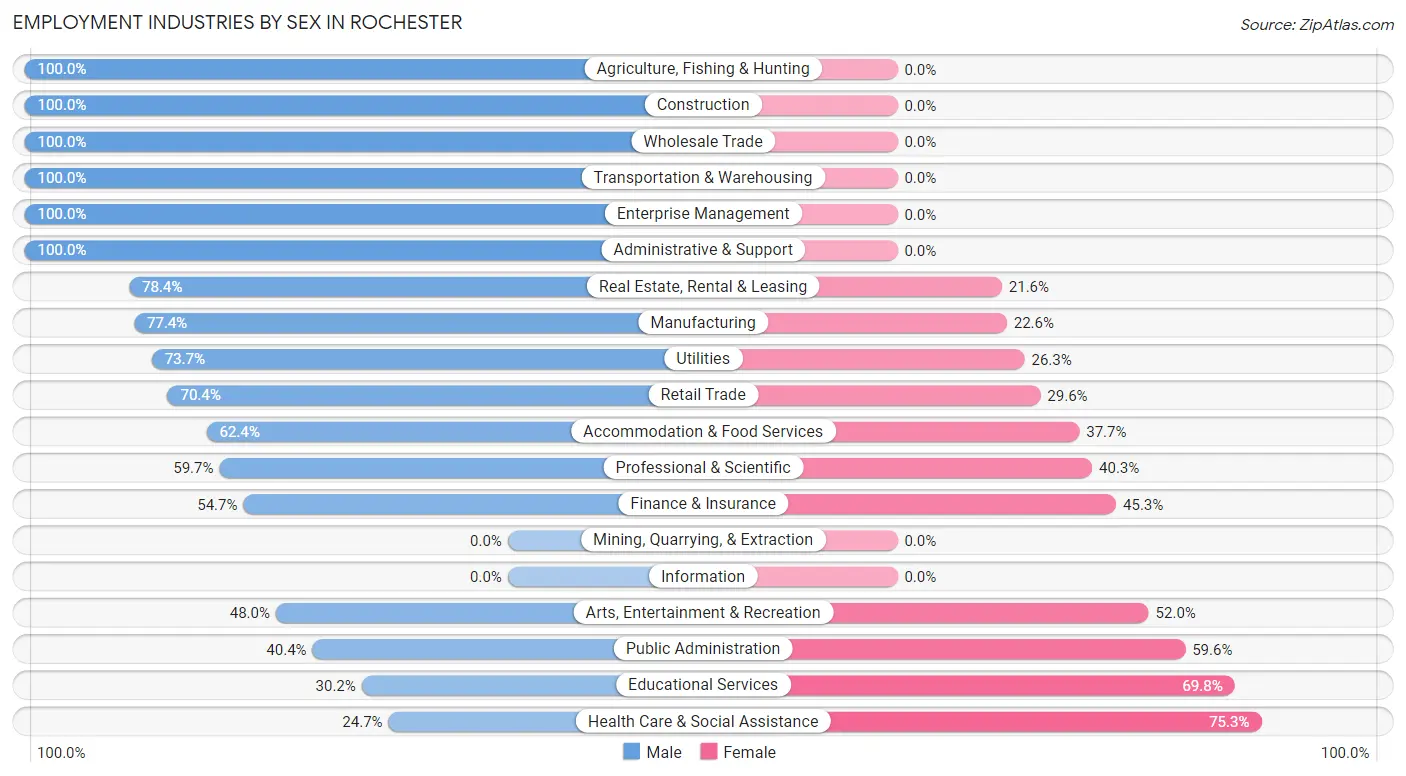
| Industry | Male | Female |
| Agriculture, Fishing & Hunting | 10 (100.0%) | 0 (0.0%) |
| Mining, Quarrying, & Extraction | 0 (0.0%) | 0 (0.0%) |
| Construction | 46 (100.0%) | 0 (0.0%) |
| Manufacturing | 41 (77.4%) | 12 (22.6%) |
| Wholesale Trade | 43 (100.0%) | 0 (0.0%) |
| Retail Trade | 88 (70.4%) | 37 (29.6%) |
| Transportation & Warehousing | 23 (100.0%) | 0 (0.0%) |
| Utilities | 14 (73.7%) | 5 (26.3%) |
| Information | 0 (0.0%) | 0 (0.0%) |
| Finance & Insurance | 110 (54.7%) | 91 (45.3%) |
| Real Estate, Rental & Leasing | 29 (78.4%) | 8 (21.6%) |
| Professional & Scientific | 40 (59.7%) | 27 (40.3%) |
| Enterprise Management | 7 (100.0%) | 0 (0.0%) |
| Administrative & Support | 10 (100.0%) | 0 (0.0%) |
| Educational Services | 75 (30.2%) | 173 (69.8%) |
| Health Care & Social Assistance | 62 (24.7%) | 189 (75.3%) |
| Arts, Entertainment & Recreation | 12 (48.0%) | 13 (52.0%) |
| Accommodation & Food Services | 53 (62.4%) | 32 (37.7%) |
| Public Administration | 95 (40.4%) | 140 (59.6%) |
| Total | 785 (51.1%) | 750 (48.9%) |
Education in Rochester
School Enrollment in Rochester
The most common levels of schooling among the 1,010 students in Rochester are high school (340 | 33.7%), middle school (222 | 22.0%), and elementary school (203 | 20.1%).
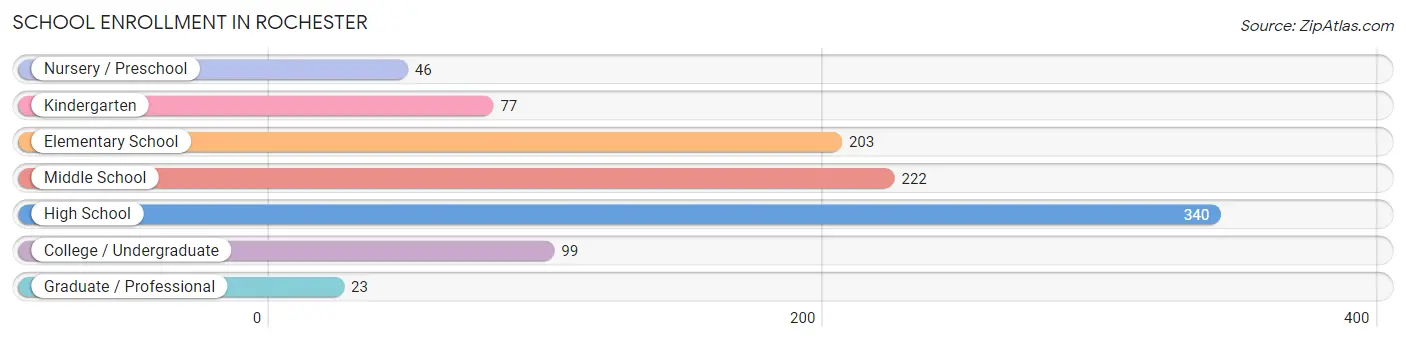
| School Level | # Students | % Students |
| Nursery / Preschool | 46 | 4.5% |
| Kindergarten | 77 | 7.6% |
| Elementary School | 203 | 20.1% |
| Middle School | 222 | 22.0% |
| High School | 340 | 33.7% |
| College / Undergraduate | 99 | 9.8% |
| Graduate / Professional | 23 | 2.3% |
| Total | 1,010 | 100.0% |
School Enrollment by Age by Funding Source in Rochester
Out of a total of 1,010 students who are enrolled in schools in Rochester, 97 (9.6%) attend a private institution, while the remaining 913 (90.4%) are enrolled in public schools. The age group of 3 to 4 year olds has the highest likelihood of being enrolled in private schools, with 27 (100.0% in the age bracket) enrolled. Conversely, the age group of 15 to 17 year olds has the lowest likelihood of being enrolled in a private school, with 264 (100.0% in the age bracket) attending a public institution.
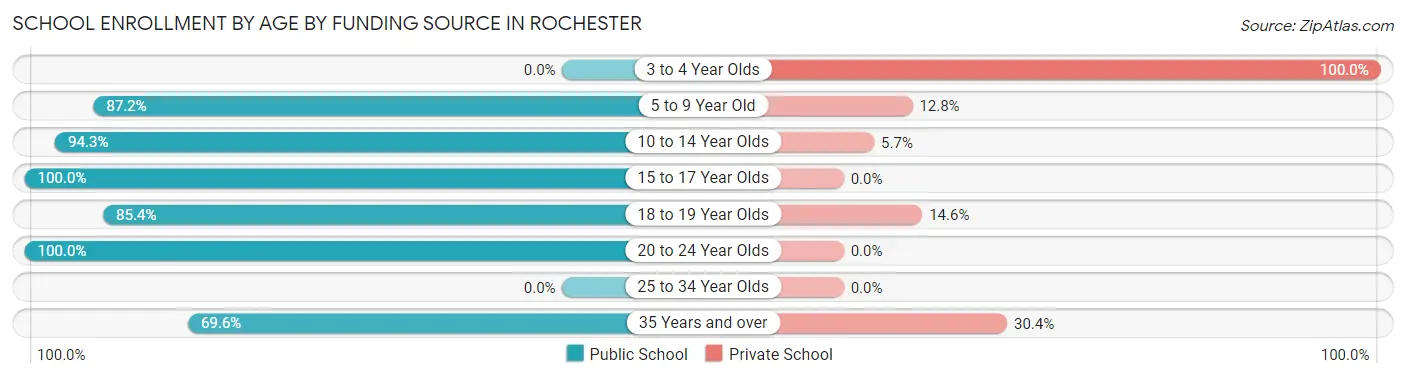
| Age Bracket | Public School | Private School |
| 3 to 4 Year Olds | 0 (0.0%) | 27 (100.0%) |
| 5 to 9 Year Old | 245 (87.2%) | 36 (12.8%) |
| 10 to 14 Year Olds | 249 (94.3%) | 15 (5.7%) |
| 15 to 17 Year Olds | 264 (100.0%) | 0 (0.0%) |
| 18 to 19 Year Olds | 70 (85.4%) | 12 (14.6%) |
| 20 to 24 Year Olds | 69 (100.0%) | 0 (0.0%) |
| 25 to 34 Year Olds | 0 (0.0%) | 0 (0.0%) |
| 35 Years and over | 16 (69.6%) | 7 (30.4%) |
| Total | 913 (90.4%) | 97 (9.6%) |
Educational Attainment by Field of Study in Rochester
Business (298 | 22.3%), education (258 | 19.3%), bio, nature & agricultural (126 | 9.4%), arts & humanities (120 | 9.0%), and social sciences (106 | 7.9%) are the most common fields of study among 1,335 individuals in Rochester who have obtained a bachelor's degree or higher.
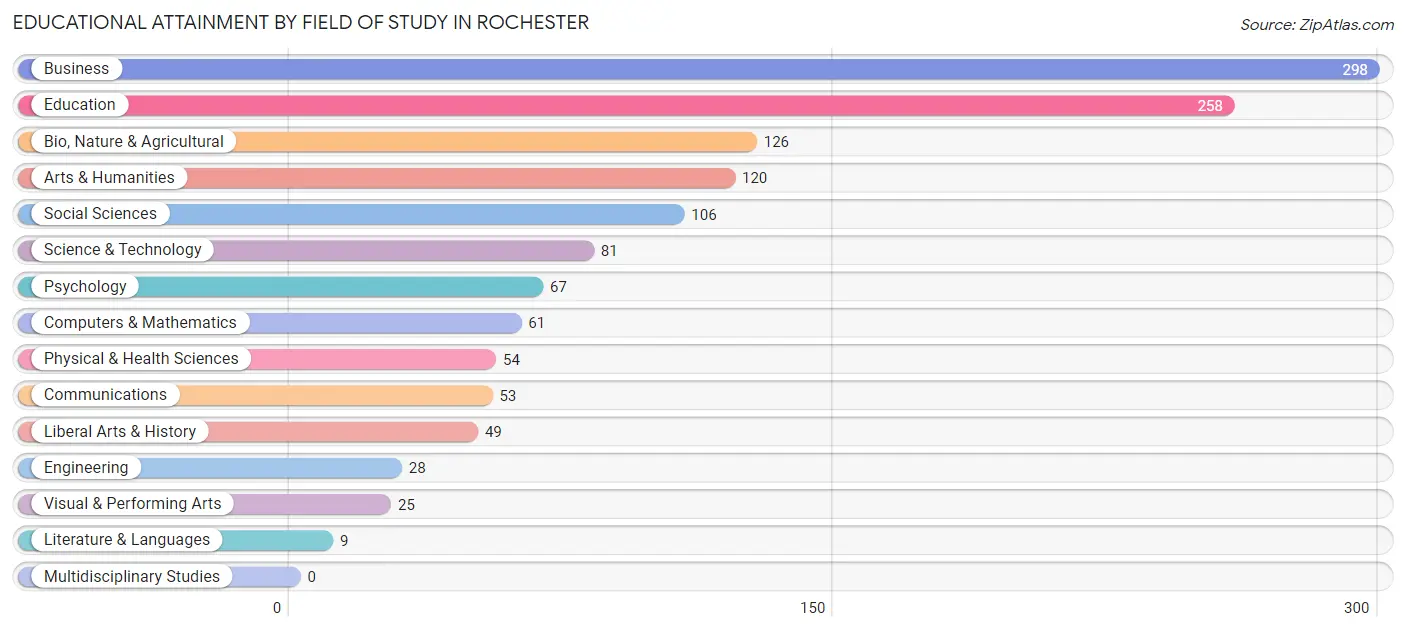
| Field of Study | # Graduates | % Graduates |
| Computers & Mathematics | 61 | 4.6% |
| Bio, Nature & Agricultural | 126 | 9.4% |
| Physical & Health Sciences | 54 | 4.0% |
| Psychology | 67 | 5.0% |
| Social Sciences | 106 | 7.9% |
| Engineering | 28 | 2.1% |
| Multidisciplinary Studies | 0 | 0.0% |
| Science & Technology | 81 | 6.1% |
| Business | 298 | 22.3% |
| Education | 258 | 19.3% |
| Literature & Languages | 9 | 0.7% |
| Liberal Arts & History | 49 | 3.7% |
| Visual & Performing Arts | 25 | 1.9% |
| Communications | 53 | 4.0% |
| Arts & Humanities | 120 | 9.0% |
| Total | 1,335 | 100.0% |
Transportation & Commute in Rochester
Vehicle Availability by Sex in Rochester
The most prevalent vehicle ownership categories in Rochester are males with 2 vehicles (370, accounting for 45.0%) and females with 2 vehicles (342, making up 48.7%).
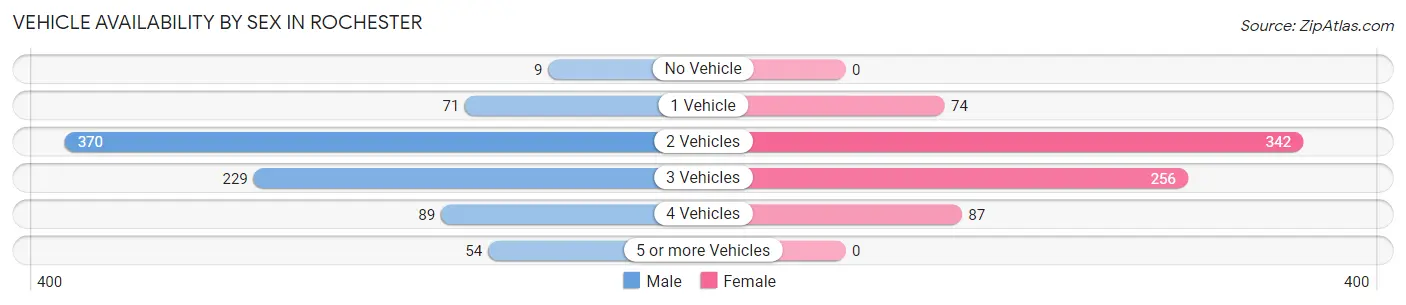
| Vehicles Available | Male | Female |
| No Vehicle | 9 (1.1%) | 0 (0.0%) |
| 1 Vehicle | 71 (8.6%) | 74 (9.8%) |
| 2 Vehicles | 370 (45.0%) | 342 (45.1%) |
| 3 Vehicles | 229 (27.9%) | 256 (33.7%) |
| 4 Vehicles | 89 (10.8%) | 87 (11.5%) |
| 5 or more Vehicles | 54 (6.6%) | 0 (0.0%) |
| Total | 822 (100.0%) | 759 (100.0%) |
Commute Time in Rochester
The most frequently occuring commute durations in Rochester are 15 to 19 minutes (432 commuters, 30.9%), 20 to 24 minutes (390 commuters, 27.9%), and 25 to 29 minutes (156 commuters, 11.2%).
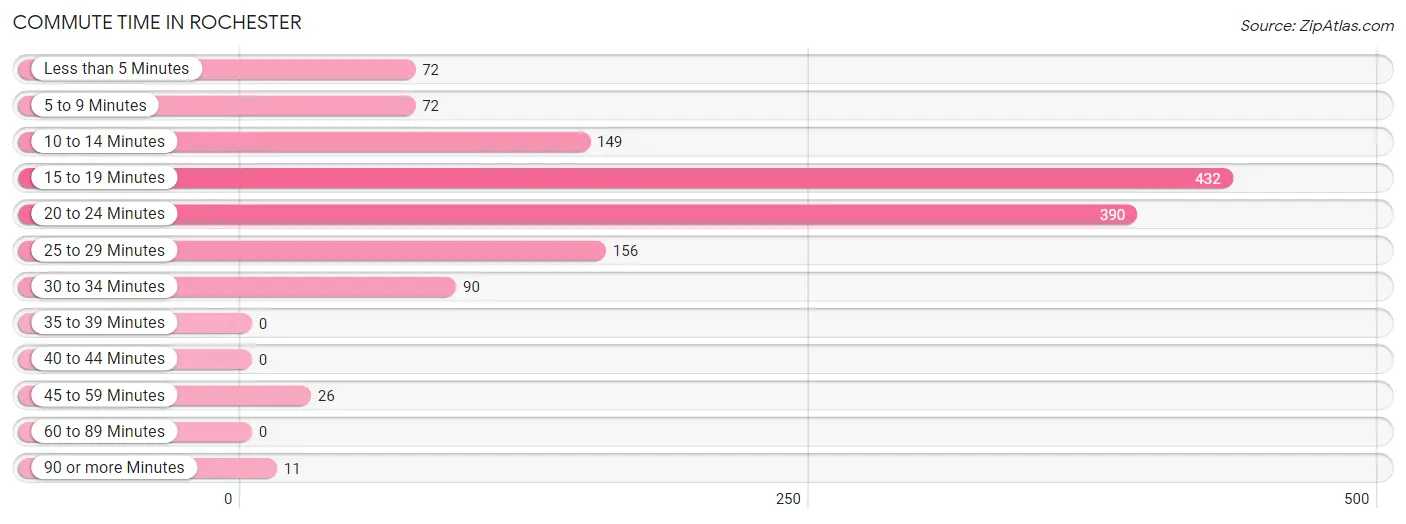
| Commute Time | # Commuters | % Commuters |
| Less than 5 Minutes | 72 | 5.1% |
| 5 to 9 Minutes | 72 | 5.1% |
| 10 to 14 Minutes | 149 | 10.7% |
| 15 to 19 Minutes | 432 | 30.9% |
| 20 to 24 Minutes | 390 | 27.9% |
| 25 to 29 Minutes | 156 | 11.2% |
| 30 to 34 Minutes | 90 | 6.4% |
| 35 to 39 Minutes | 0 | 0.0% |
| 40 to 44 Minutes | 0 | 0.0% |
| 45 to 59 Minutes | 26 | 1.9% |
| 60 to 89 Minutes | 0 | 0.0% |
| 90 or more Minutes | 11 | 0.8% |
Commute Time by Sex in Rochester
The most common commute times in Rochester are 15 to 19 minutes (224 commuters, 30.8%) for males and 20 to 24 minutes (211 commuters, 31.5%) for females.
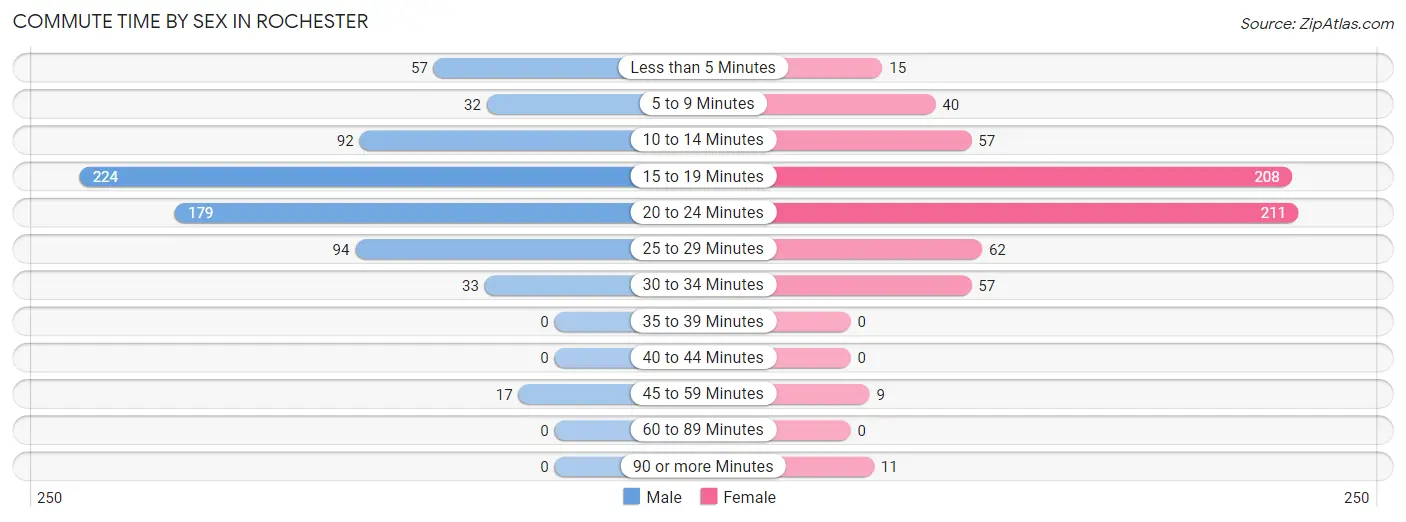
| Commute Time | Male | Female |
| Less than 5 Minutes | 57 (7.8%) | 15 (2.2%) |
| 5 to 9 Minutes | 32 (4.4%) | 40 (6.0%) |
| 10 to 14 Minutes | 92 (12.6%) | 57 (8.5%) |
| 15 to 19 Minutes | 224 (30.8%) | 208 (31.0%) |
| 20 to 24 Minutes | 179 (24.6%) | 211 (31.5%) |
| 25 to 29 Minutes | 94 (12.9%) | 62 (9.2%) |
| 30 to 34 Minutes | 33 (4.5%) | 57 (8.5%) |
| 35 to 39 Minutes | 0 (0.0%) | 0 (0.0%) |
| 40 to 44 Minutes | 0 (0.0%) | 0 (0.0%) |
| 45 to 59 Minutes | 17 (2.3%) | 9 (1.3%) |
| 60 to 89 Minutes | 0 (0.0%) | 0 (0.0%) |
| 90 or more Minutes | 0 (0.0%) | 11 (1.6%) |
Time of Departure to Work by Sex in Rochester
The most frequent times of departure to work in Rochester are 7:30 AM to 7:59 AM (220, 30.2%) for males and 7:30 AM to 7:59 AM (184, 27.5%) for females.
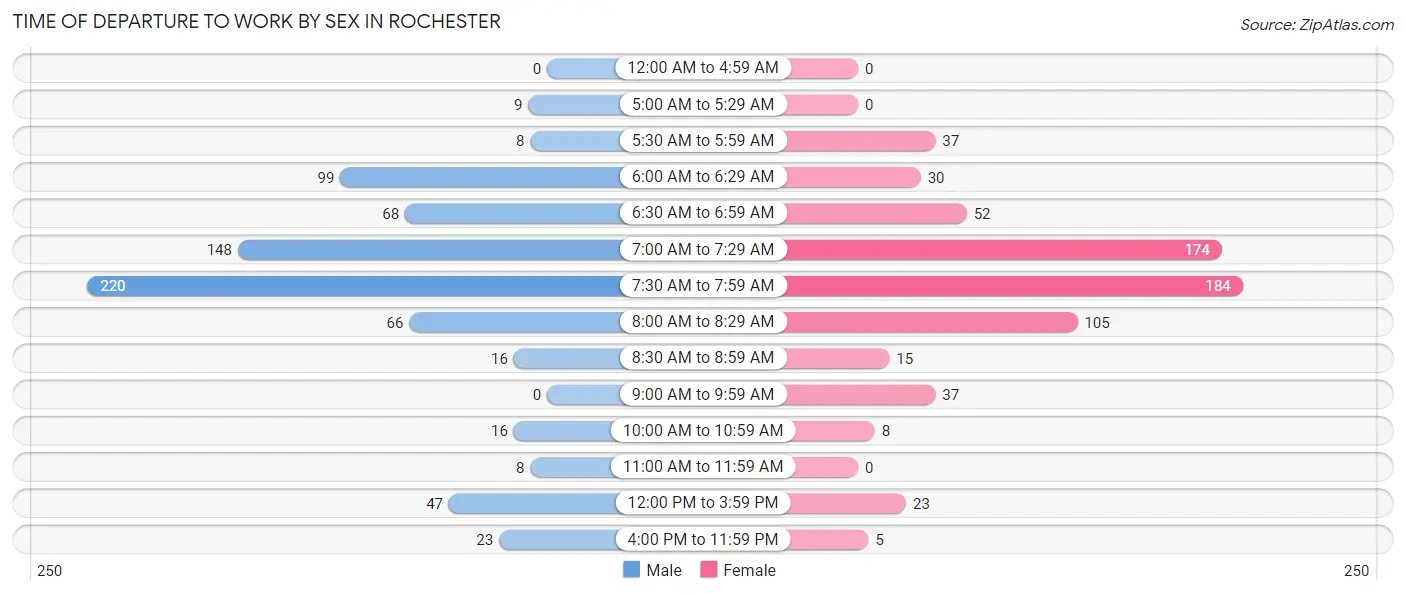
| Time of Departure | Male | Female |
| 12:00 AM to 4:59 AM | 0 (0.0%) | 0 (0.0%) |
| 5:00 AM to 5:29 AM | 9 (1.2%) | 0 (0.0%) |
| 5:30 AM to 5:59 AM | 8 (1.1%) | 37 (5.5%) |
| 6:00 AM to 6:29 AM | 99 (13.6%) | 30 (4.5%) |
| 6:30 AM to 6:59 AM | 68 (9.3%) | 52 (7.8%) |
| 7:00 AM to 7:29 AM | 148 (20.3%) | 174 (26.0%) |
| 7:30 AM to 7:59 AM | 220 (30.2%) | 184 (27.5%) |
| 8:00 AM to 8:29 AM | 66 (9.1%) | 105 (15.7%) |
| 8:30 AM to 8:59 AM | 16 (2.2%) | 15 (2.2%) |
| 9:00 AM to 9:59 AM | 0 (0.0%) | 37 (5.5%) |
| 10:00 AM to 10:59 AM | 16 (2.2%) | 8 (1.2%) |
| 11:00 AM to 11:59 AM | 8 (1.1%) | 0 (0.0%) |
| 12:00 PM to 3:59 PM | 47 (6.5%) | 23 (3.4%) |
| 4:00 PM to 11:59 PM | 23 (3.2%) | 5 (0.7%) |
| Total | 728 (100.0%) | 670 (100.0%) |
Housing Occupancy in Rochester
Occupancy by Ownership in Rochester
Of the total 1,372 dwellings in Rochester, owner-occupied units account for 1,290 (94.0%), while renter-occupied units make up 82 (6.0%).
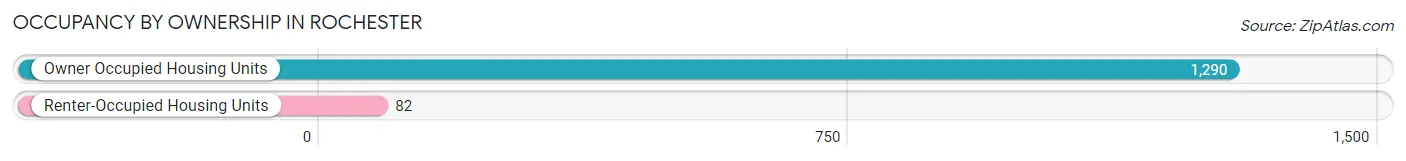
| Occupancy | # Housing Units | % Housing Units |
| Owner Occupied Housing Units | 1,290 | 94.0% |
| Renter-Occupied Housing Units | 82 | 6.0% |
| Total Occupied Housing Units | 1,372 | 100.0% |
Occupancy by Household Size in Rochester
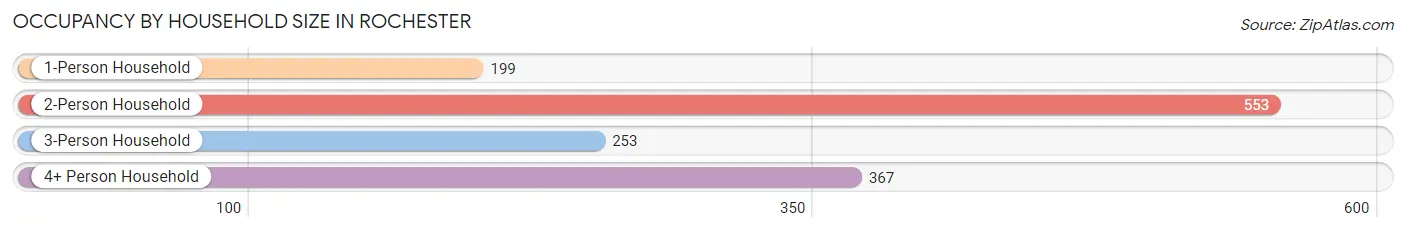
| Household Size | # Housing Units | % Housing Units |
| 1-Person Household | 199 | 14.5% |
| 2-Person Household | 553 | 40.3% |
| 3-Person Household | 253 | 18.4% |
| 4+ Person Household | 367 | 26.8% |
| Total Housing Units | 1,372 | 100.0% |
Occupancy by Ownership by Household Size in Rochester
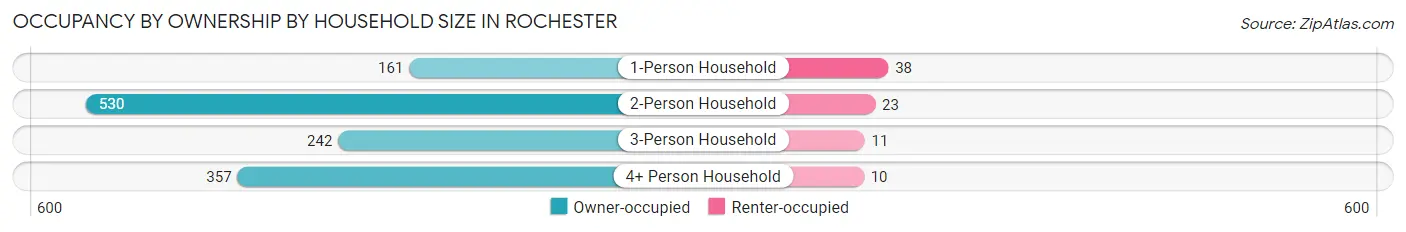
| Household Size | Owner-occupied | Renter-occupied |
| 1-Person Household | 161 (80.9%) | 38 (19.1%) |
| 2-Person Household | 530 (95.8%) | 23 (4.2%) |
| 3-Person Household | 242 (95.7%) | 11 (4.3%) |
| 4+ Person Household | 357 (97.3%) | 10 (2.7%) |
| Total Housing Units | 1,290 (94.0%) | 82 (6.0%) |
Occupancy by Educational Attainment in Rochester
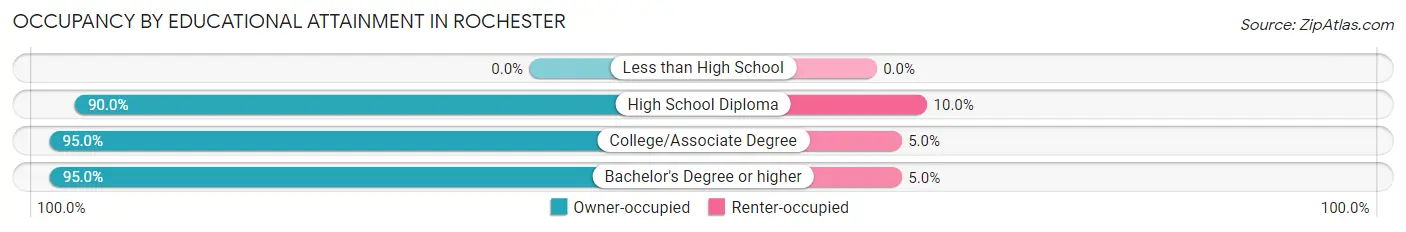
| Household Size | Owner-occupied | Renter-occupied |
| Less than High School | 0 (0.0%) | 0 (0.0%) |
| High School Diploma | 243 (90.0%) | 27 (10.0%) |
| College/Associate Degree | 287 (95.0%) | 15 (5.0%) |
| Bachelor's Degree or higher | 760 (95.0%) | 40 (5.0%) |
Occupancy by Age of Householder in Rochester
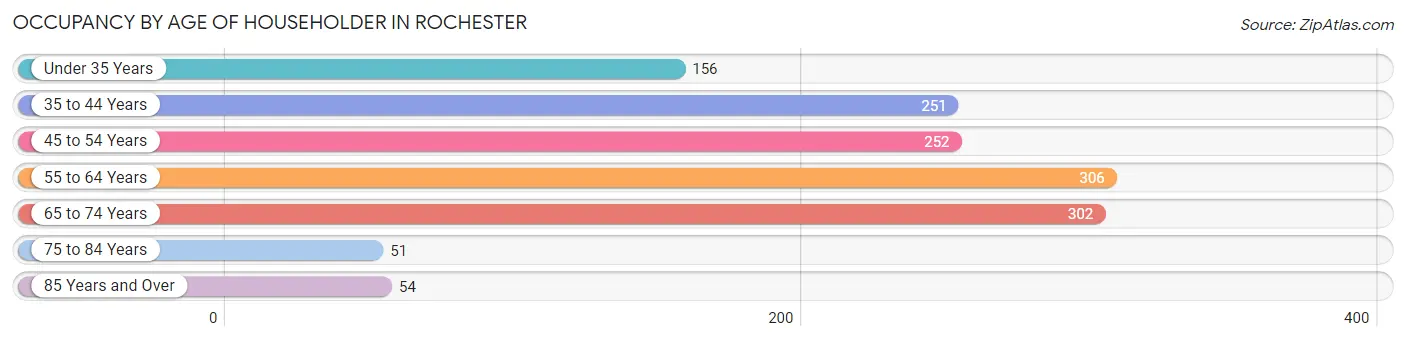
| Age Bracket | # Households | % Households |
| Under 35 Years | 156 | 11.4% |
| 35 to 44 Years | 251 | 18.3% |
| 45 to 54 Years | 252 | 18.4% |
| 55 to 64 Years | 306 | 22.3% |
| 65 to 74 Years | 302 | 22.0% |
| 75 to 84 Years | 51 | 3.7% |
| 85 Years and Over | 54 | 3.9% |
| Total | 1,372 | 100.0% |
Housing Finances in Rochester
Median Income by Occupancy in Rochester
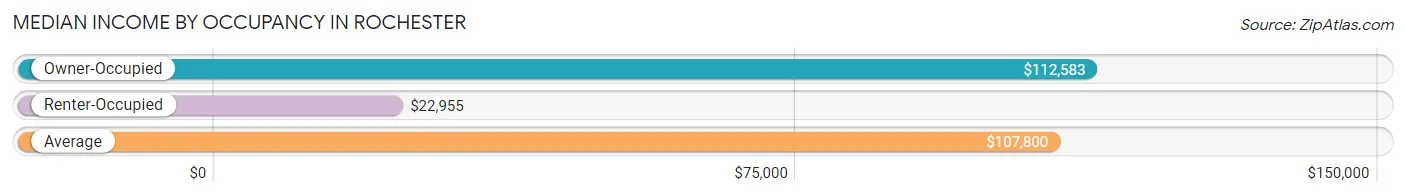
| Occupancy Type | # Households | Median Income |
| Owner-Occupied | 1,290 (94.0%) | $112,583 |
| Renter-Occupied | 82 (6.0%) | $22,955 |
| Average | 1,372 (100.0%) | $107,800 |
Occupancy by Householder Income Bracket in Rochester
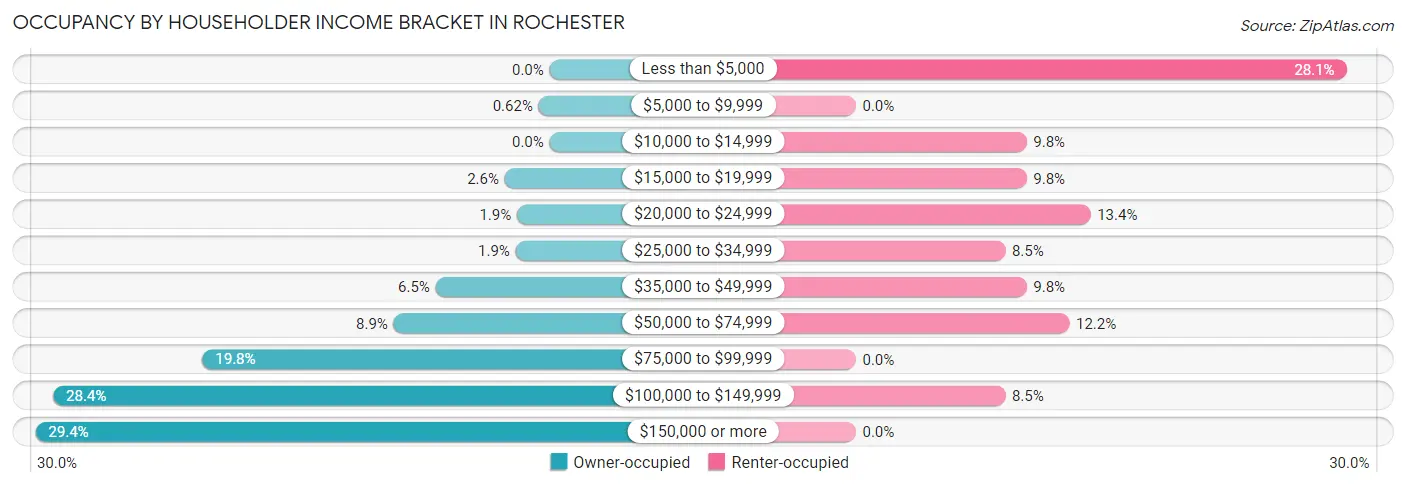
| Income Bracket | Owner-occupied | Renter-occupied |
| Less than $5,000 | 0 (0.0%) | 23 (28.1%) |
| $5,000 to $9,999 | 8 (0.6%) | 0 (0.0%) |
| $10,000 to $14,999 | 0 (0.0%) | 8 (9.8%) |
| $15,000 to $19,999 | 33 (2.6%) | 8 (9.8%) |
| $20,000 to $24,999 | 24 (1.9%) | 11 (13.4%) |
| $25,000 to $34,999 | 25 (1.9%) | 7 (8.5%) |
| $35,000 to $49,999 | 84 (6.5%) | 8 (9.8%) |
| $50,000 to $74,999 | 115 (8.9%) | 10 (12.2%) |
| $75,000 to $99,999 | 256 (19.8%) | 0 (0.0%) |
| $100,000 to $149,999 | 366 (28.4%) | 7 (8.5%) |
| $150,000 or more | 379 (29.4%) | 0 (0.0%) |
| Total | 1,290 (100.0%) | 82 (100.0%) |
Monthly Housing Cost Tiers in Rochester
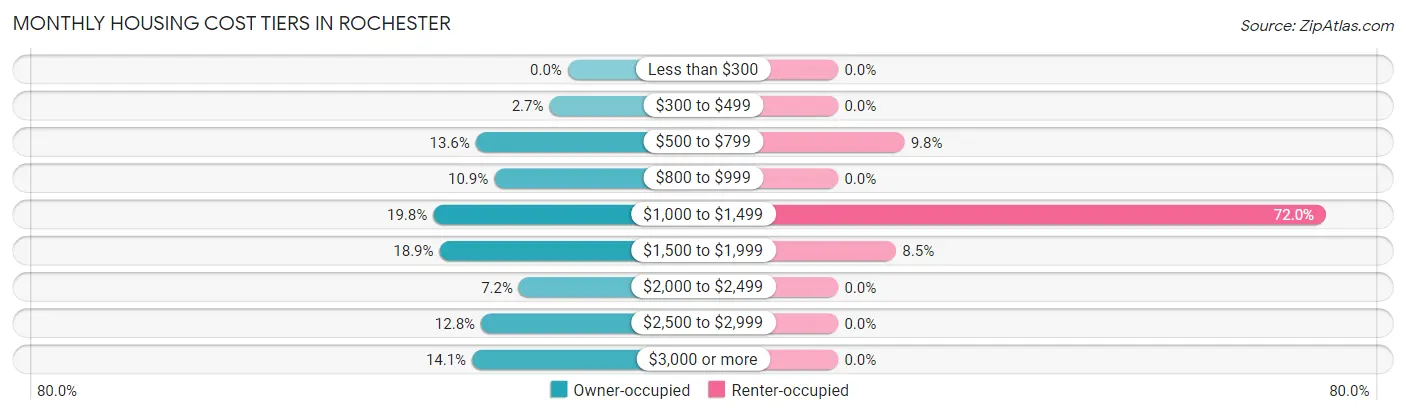
| Monthly Cost | Owner-occupied | Renter-occupied |
| Less than $300 | 0 (0.0%) | 0 (0.0%) |
| $300 to $499 | 35 (2.7%) | 0 (0.0%) |
| $500 to $799 | 175 (13.6%) | 8 (9.8%) |
| $800 to $999 | 140 (10.8%) | 0 (0.0%) |
| $1,000 to $1,499 | 256 (19.8%) | 59 (72.0%) |
| $1,500 to $1,999 | 244 (18.9%) | 7 (8.5%) |
| $2,000 to $2,499 | 93 (7.2%) | 0 (0.0%) |
| $2,500 to $2,999 | 165 (12.8%) | 0 (0.0%) |
| $3,000 or more | 182 (14.1%) | 0 (0.0%) |
| Total | 1,290 (100.0%) | 82 (100.0%) |
Physical Housing Characteristics in Rochester
Housing Structures in Rochester
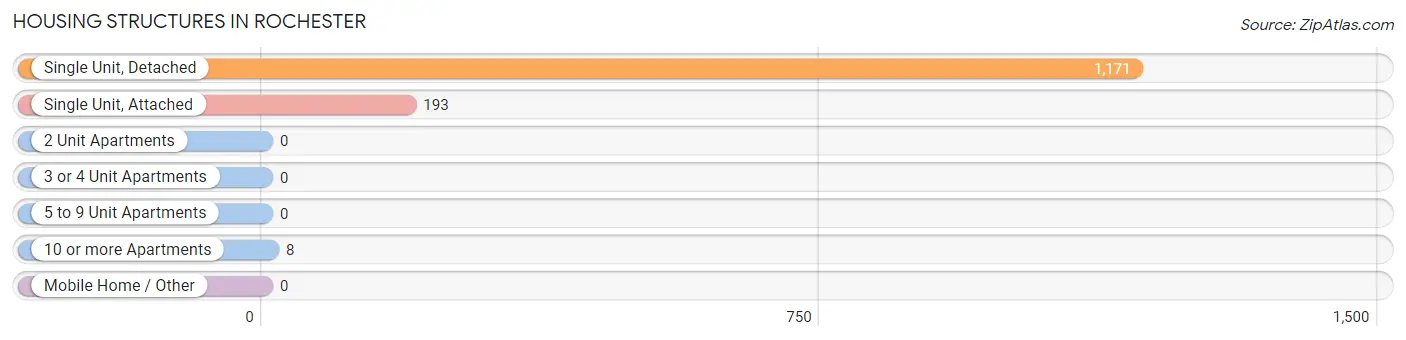
| Structure Type | # Housing Units | % Housing Units |
| Single Unit, Detached | 1,171 | 85.4% |
| Single Unit, Attached | 193 | 14.1% |
| 2 Unit Apartments | 0 | 0.0% |
| 3 or 4 Unit Apartments | 0 | 0.0% |
| 5 to 9 Unit Apartments | 0 | 0.0% |
| 10 or more Apartments | 8 | 0.6% |
| Mobile Home / Other | 0 | 0.0% |
| Total | 1,372 | 100.0% |
Housing Structures by Occupancy in Rochester
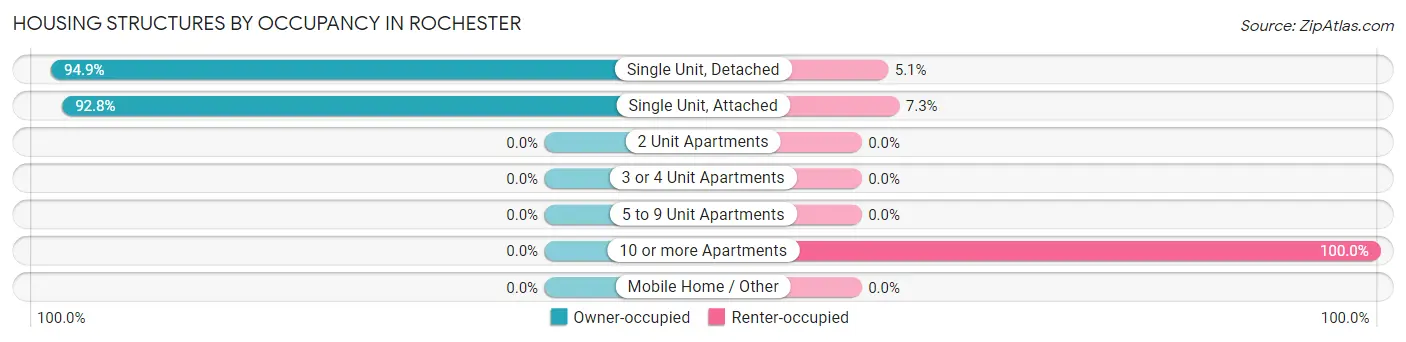
| Structure Type | Owner-occupied | Renter-occupied |
| Single Unit, Detached | 1,111 (94.9%) | 60 (5.1%) |
| Single Unit, Attached | 179 (92.7%) | 14 (7.2%) |
| 2 Unit Apartments | 0 (0.0%) | 0 (0.0%) |
| 3 or 4 Unit Apartments | 0 (0.0%) | 0 (0.0%) |
| 5 to 9 Unit Apartments | 0 (0.0%) | 0 (0.0%) |
| 10 or more Apartments | 0 (0.0%) | 8 (100.0%) |
| Mobile Home / Other | 0 (0.0%) | 0 (0.0%) |
| Total | 1,290 (94.0%) | 82 (6.0%) |
Housing Structures by Number of Rooms in Rochester
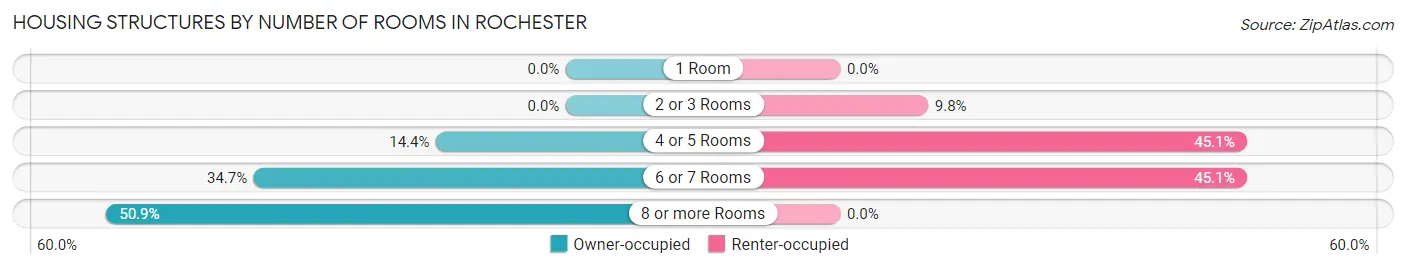
| Number of Rooms | Owner-occupied | Renter-occupied |
| 1 Room | 0 (0.0%) | 0 (0.0%) |
| 2 or 3 Rooms | 0 (0.0%) | 8 (9.8%) |
| 4 or 5 Rooms | 186 (14.4%) | 37 (45.1%) |
| 6 or 7 Rooms | 447 (34.6%) | 37 (45.1%) |
| 8 or more Rooms | 657 (50.9%) | 0 (0.0%) |
| Total | 1,290 (100.0%) | 82 (100.0%) |
Housing Structure by Heating Type in Rochester
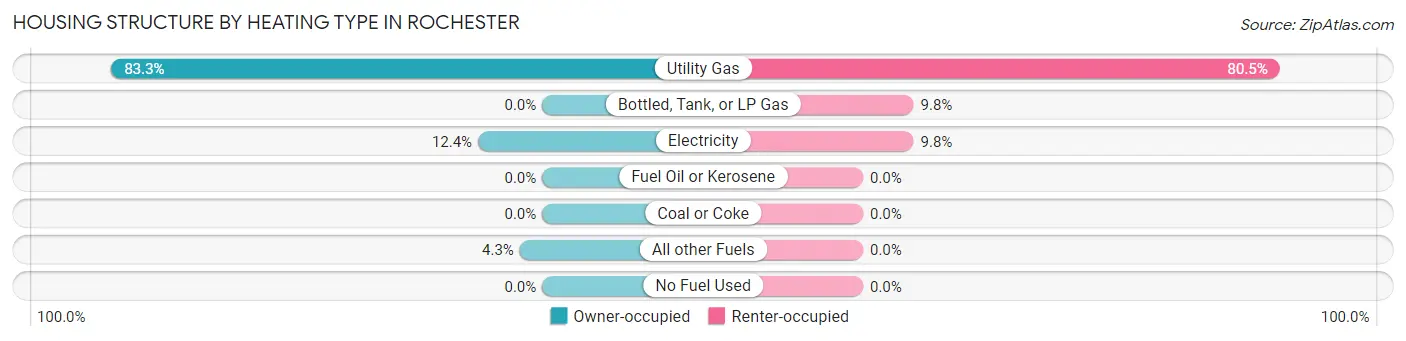
| Heating Type | Owner-occupied | Renter-occupied |
| Utility Gas | 1,074 (83.3%) | 66 (80.5%) |
| Bottled, Tank, or LP Gas | 0 (0.0%) | 8 (9.8%) |
| Electricity | 160 (12.4%) | 8 (9.8%) |
| Fuel Oil or Kerosene | 0 (0.0%) | 0 (0.0%) |
| Coal or Coke | 0 (0.0%) | 0 (0.0%) |
| All other Fuels | 56 (4.3%) | 0 (0.0%) |
| No Fuel Used | 0 (0.0%) | 0 (0.0%) |
| Total | 1,290 (100.0%) | 82 (100.0%) |
Household Vehicle Usage in Rochester
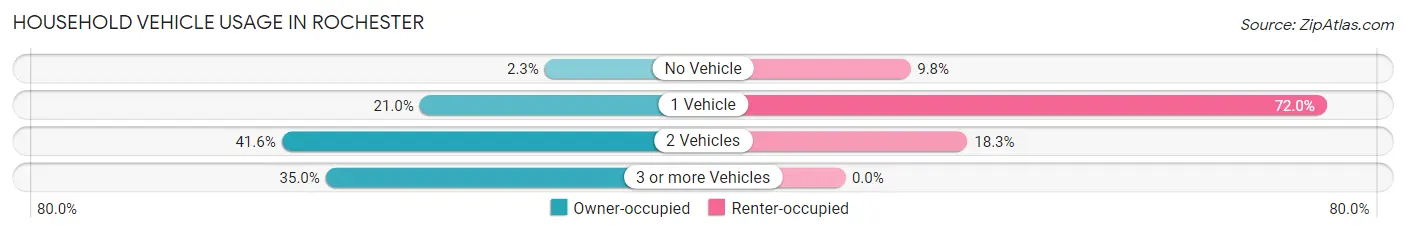
| Vehicles per Household | Owner-occupied | Renter-occupied |
| No Vehicle | 30 (2.3%) | 8 (9.8%) |
| 1 Vehicle | 271 (21.0%) | 59 (72.0%) |
| 2 Vehicles | 537 (41.6%) | 15 (18.3%) |
| 3 or more Vehicles | 452 (35.0%) | 0 (0.0%) |
| Total | 1,290 (100.0%) | 82 (100.0%) |
Real Estate & Mortgages in Rochester
Real Estate and Mortgage Overview in Rochester
| Characteristic | Without Mortgage | With Mortgage |
| Housing Units | 406 | 884 |
| Median Property Value | $192,000 | $240,200 |
| Median Household Income | $104,821 | $285 |
| Monthly Housing Costs | $779 | $182 |
| Real Estate Taxes | $3,471 | $0 |
Property Value by Mortgage Status in Rochester
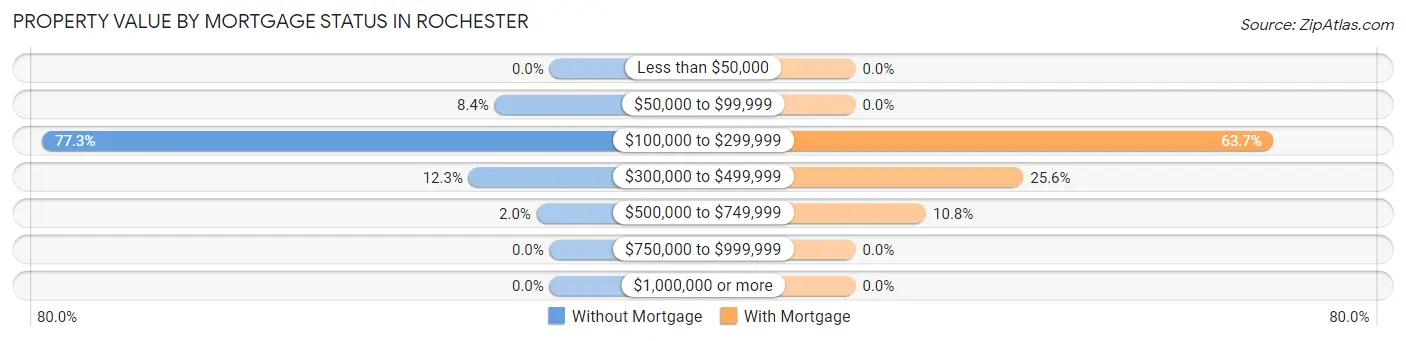
| Property Value | Without Mortgage | With Mortgage |
| Less than $50,000 | 0 (0.0%) | 0 (0.0%) |
| $50,000 to $99,999 | 34 (8.4%) | 0 (0.0%) |
| $100,000 to $299,999 | 314 (77.3%) | 563 (63.7%) |
| $300,000 to $499,999 | 50 (12.3%) | 226 (25.6%) |
| $500,000 to $749,999 | 8 (2.0%) | 95 (10.7%) |
| $750,000 to $999,999 | 0 (0.0%) | 0 (0.0%) |
| $1,000,000 or more | 0 (0.0%) | 0 (0.0%) |
| Total | 406 (100.0%) | 884 (100.0%) |
Household Income by Mortgage Status in Rochester
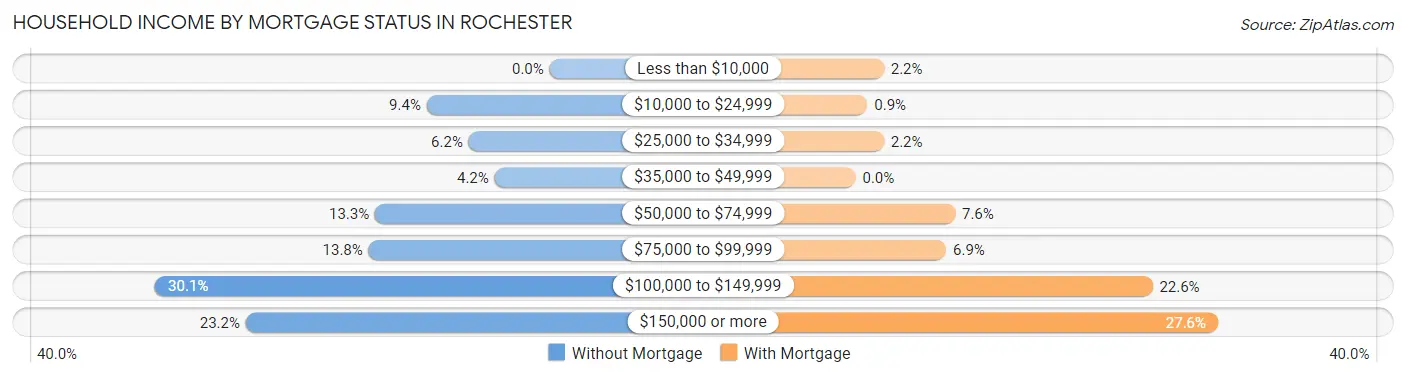
| Household Income | Without Mortgage | With Mortgage |
| Less than $10,000 | 0 (0.0%) | 19 (2.1%) |
| $10,000 to $24,999 | 38 (9.4%) | 8 (0.9%) |
| $25,000 to $34,999 | 25 (6.2%) | 19 (2.1%) |
| $35,000 to $49,999 | 17 (4.2%) | 0 (0.0%) |
| $50,000 to $74,999 | 54 (13.3%) | 67 (7.6%) |
| $75,000 to $99,999 | 56 (13.8%) | 61 (6.9%) |
| $100,000 to $149,999 | 122 (30.0%) | 200 (22.6%) |
| $150,000 or more | 94 (23.2%) | 244 (27.6%) |
| Total | 406 (100.0%) | 884 (100.0%) |
Property Value to Household Income Ratio in Rochester
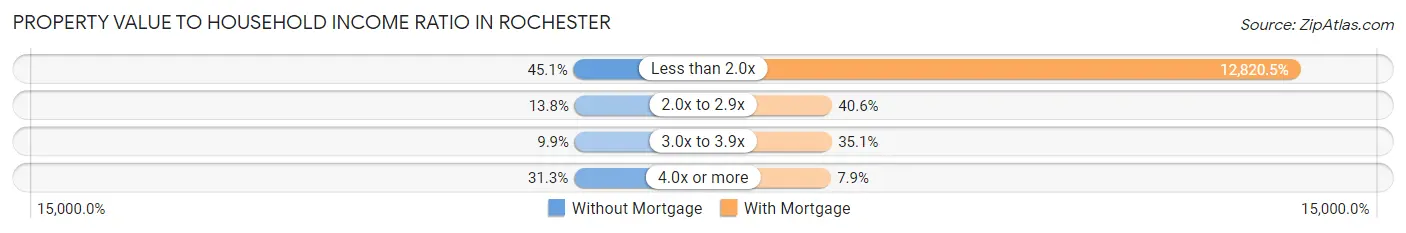
| Value-to-Income Ratio | Without Mortgage | With Mortgage |
| Less than 2.0x | 183 (45.1%) | 113,333 (12,820.5%) |
| 2.0x to 2.9x | 56 (13.8%) | 359 (40.6%) |
| 3.0x to 3.9x | 40 (9.9%) | 310 (35.1%) |
| 4.0x or more | 127 (31.3%) | 70 (7.9%) |
| Total | 406 (100.0%) | 884 (100.0%) |
Real Estate Taxes by Mortgage Status in Rochester
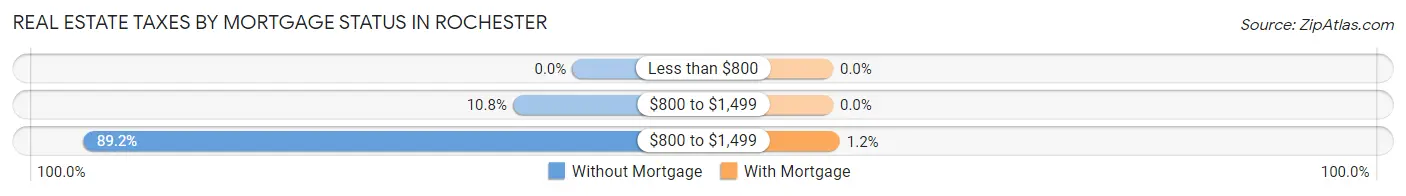
| Property Taxes | Without Mortgage | With Mortgage |
| Less than $800 | 0 (0.0%) | 0 (0.0%) |
| $800 to $1,499 | 44 (10.8%) | 0 (0.0%) |
| $800 to $1,499 | 362 (89.2%) | 11 (1.2%) |
| Total | 406 (100.0%) | 884 (100.0%) |
Health & Disability in Rochester
Health Insurance Coverage by Age in Rochester
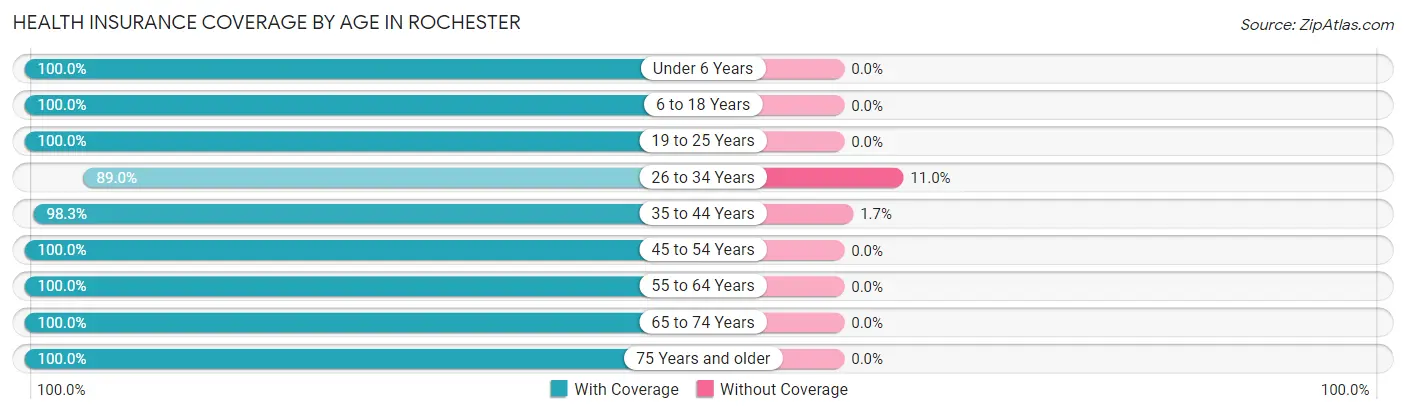
| Age Bracket | With Coverage | Without Coverage |
| Under 6 Years | 279 (100.0%) | 0 (0.0%) |
| 6 to 18 Years | 800 (100.0%) | 0 (0.0%) |
| 19 to 25 Years | 237 (100.0%) | 0 (0.0%) |
| 26 to 34 Years | 226 (89.0%) | 28 (11.0%) |
| 35 to 44 Years | 470 (98.3%) | 8 (1.7%) |
| 45 to 54 Years | 478 (100.0%) | 0 (0.0%) |
| 55 to 64 Years | 449 (100.0%) | 0 (0.0%) |
| 65 to 74 Years | 497 (100.0%) | 0 (0.0%) |
| 75 Years and older | 234 (100.0%) | 0 (0.0%) |
| Total | 3,670 (99.0%) | 36 (1.0%) |
Health Insurance Coverage by Citizenship Status in Rochester
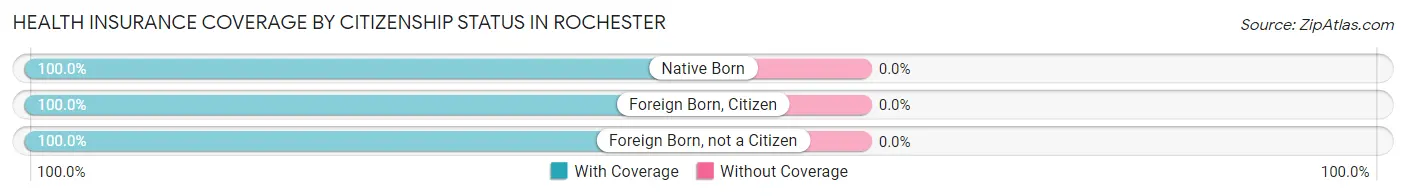
| Citizenship Status | With Coverage | Without Coverage |
| Native Born | 279 (100.0%) | 0 (0.0%) |
| Foreign Born, Citizen | 800 (100.0%) | 0 (0.0%) |
| Foreign Born, not a Citizen | 237 (100.0%) | 0 (0.0%) |
Health Insurance Coverage by Household Income in Rochester
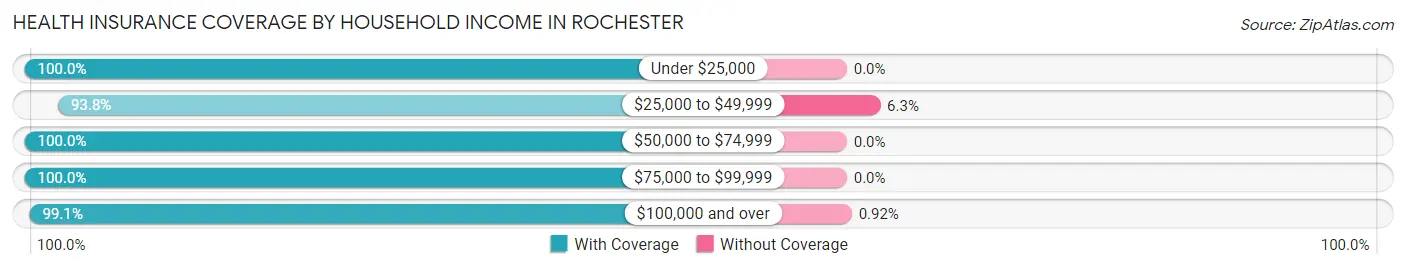
| Household Income | With Coverage | Without Coverage |
| Under $25,000 | 228 (100.0%) | 0 (0.0%) |
| $25,000 to $49,999 | 225 (93.8%) | 15 (6.2%) |
| $50,000 to $74,999 | 352 (100.0%) | 0 (0.0%) |
| $75,000 to $99,999 | 612 (100.0%) | 0 (0.0%) |
| $100,000 and over | 2,253 (99.1%) | 21 (0.9%) |
Public vs Private Health Insurance Coverage by Age in Rochester
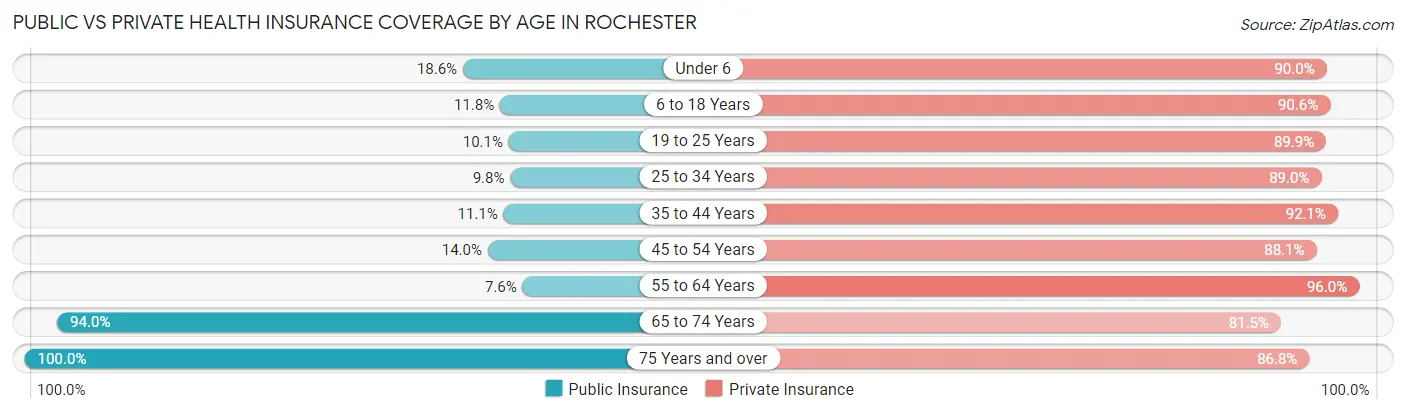
| Age Bracket | Public Insurance | Private Insurance |
| Under 6 | 52 (18.6%) | 251 (90.0%) |
| 6 to 18 Years | 94 (11.7%) | 725 (90.6%) |
| 19 to 25 Years | 24 (10.1%) | 213 (89.9%) |
| 25 to 34 Years | 25 (9.8%) | 226 (89.0%) |
| 35 to 44 Years | 53 (11.1%) | 440 (92.0%) |
| 45 to 54 Years | 67 (14.0%) | 421 (88.1%) |
| 55 to 64 Years | 34 (7.6%) | 431 (96.0%) |
| 65 to 74 Years | 467 (94.0%) | 405 (81.5%) |
| 75 Years and over | 234 (100.0%) | 203 (86.8%) |
| Total | 1,050 (28.3%) | 3,315 (89.4%) |
Disability Status by Sex by Age in Rochester
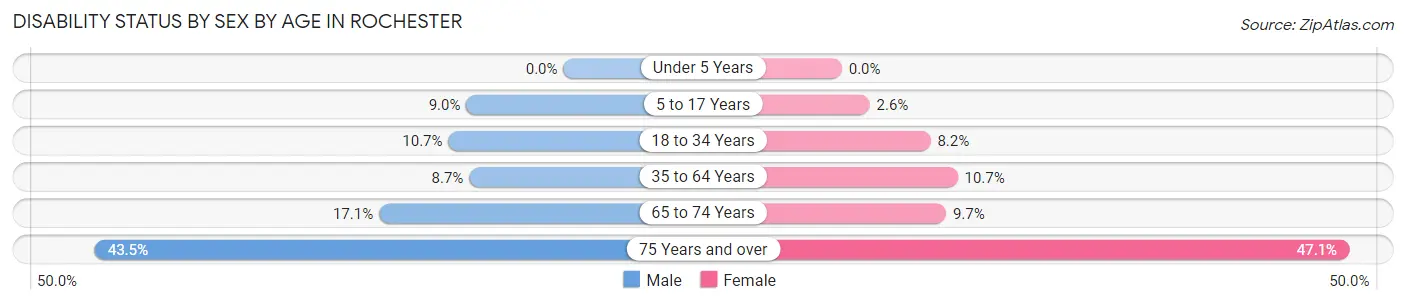
| Age Bracket | Male | Female |
| Under 5 Years | 0 (0.0%) | 0 (0.0%) |
| 5 to 17 Years | 31 (9.0%) | 12 (2.6%) |
| 18 to 34 Years | 32 (10.7%) | 20 (8.2%) |
| 35 to 64 Years | 52 (8.7%) | 87 (10.7%) |
| 65 to 74 Years | 39 (17.1%) | 26 (9.7%) |
| 75 Years and over | 50 (43.5%) | 56 (47.1%) |
Disability Class by Sex by Age in Rochester
Disability Class: Hearing Difficulty
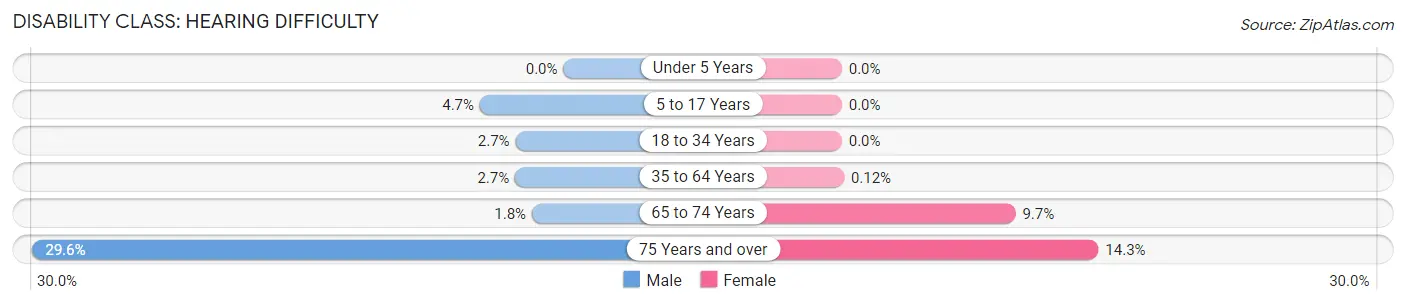
| Age Bracket | Male | Female |
| Under 5 Years | 0 (0.0%) | 0 (0.0%) |
| 5 to 17 Years | 16 (4.6%) | 0 (0.0%) |
| 18 to 34 Years | 8 (2.7%) | 0 (0.0%) |
| 35 to 64 Years | 16 (2.7%) | 1 (0.1%) |
| 65 to 74 Years | 4 (1.8%) | 26 (9.7%) |
| 75 Years and over | 34 (29.6%) | 17 (14.3%) |
Disability Class: Vision Difficulty
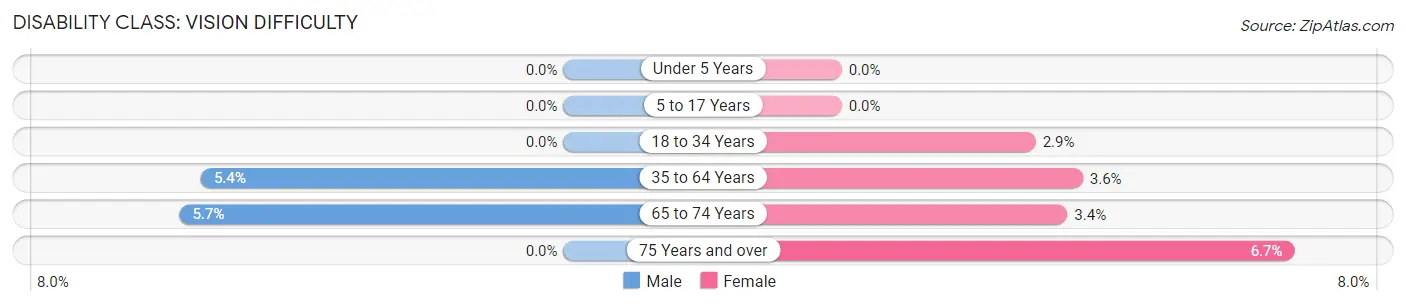
| Age Bracket | Male | Female |
| Under 5 Years | 0 (0.0%) | 0 (0.0%) |
| 5 to 17 Years | 0 (0.0%) | 0 (0.0%) |
| 18 to 34 Years | 0 (0.0%) | 7 (2.9%) |
| 35 to 64 Years | 32 (5.4%) | 29 (3.6%) |
| 65 to 74 Years | 13 (5.7%) | 9 (3.4%) |
| 75 Years and over | 0 (0.0%) | 8 (6.7%) |
Disability Class: Cognitive Difficulty
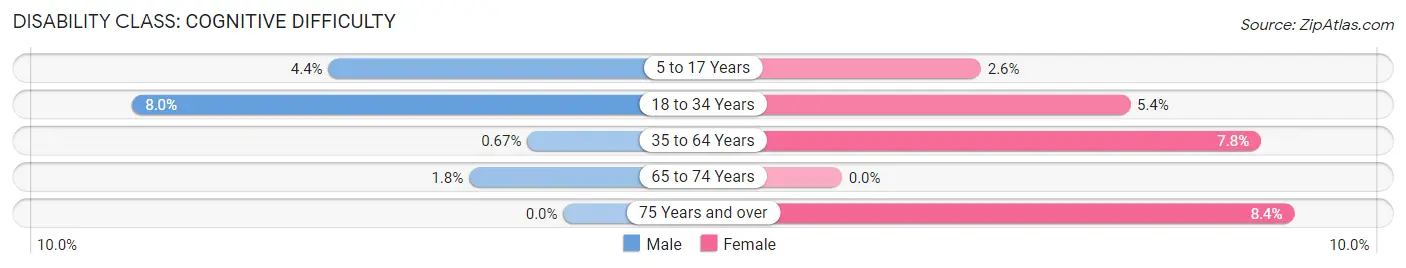
| Age Bracket | Male | Female |
| 5 to 17 Years | 15 (4.4%) | 12 (2.6%) |
| 18 to 34 Years | 24 (8.0%) | 13 (5.3%) |
| 35 to 64 Years | 4 (0.7%) | 63 (7.8%) |
| 65 to 74 Years | 4 (1.8%) | 0 (0.0%) |
| 75 Years and over | 0 (0.0%) | 10 (8.4%) |
Disability Class: Ambulatory Difficulty
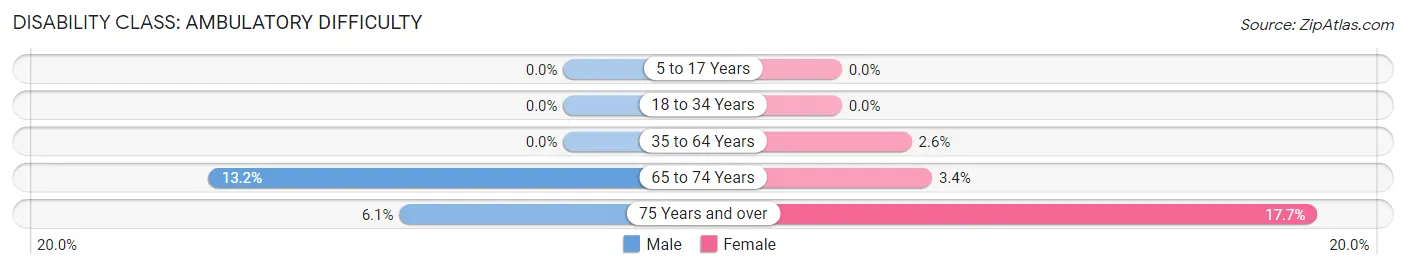
| Age Bracket | Male | Female |
| 5 to 17 Years | 0 (0.0%) | 0 (0.0%) |
| 18 to 34 Years | 0 (0.0%) | 0 (0.0%) |
| 35 to 64 Years | 0 (0.0%) | 21 (2.6%) |
| 65 to 74 Years | 30 (13.2%) | 9 (3.4%) |
| 75 Years and over | 7 (6.1%) | 21 (17.6%) |
Disability Class: Self-Care Difficulty
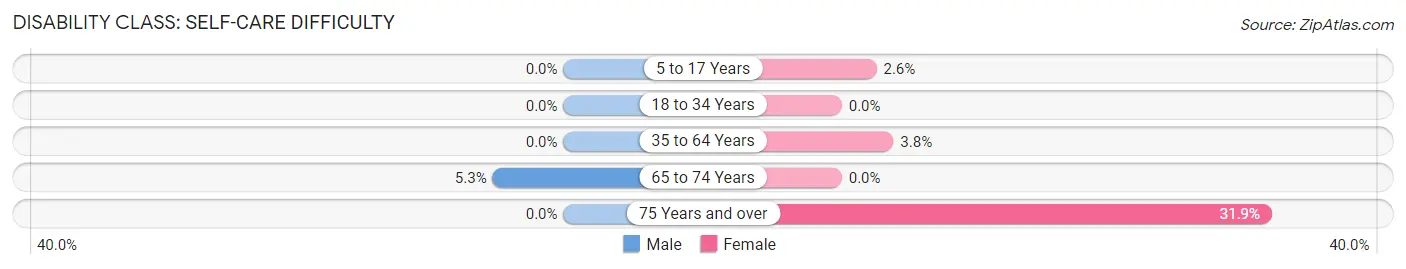
| Age Bracket | Male | Female |
| 5 to 17 Years | 0 (0.0%) | 12 (2.6%) |
| 18 to 34 Years | 0 (0.0%) | 0 (0.0%) |
| 35 to 64 Years | 0 (0.0%) | 31 (3.8%) |
| 65 to 74 Years | 12 (5.3%) | 0 (0.0%) |
| 75 Years and over | 0 (0.0%) | 38 (31.9%) |
Technology Access in Rochester
Computing Device Access in Rochester
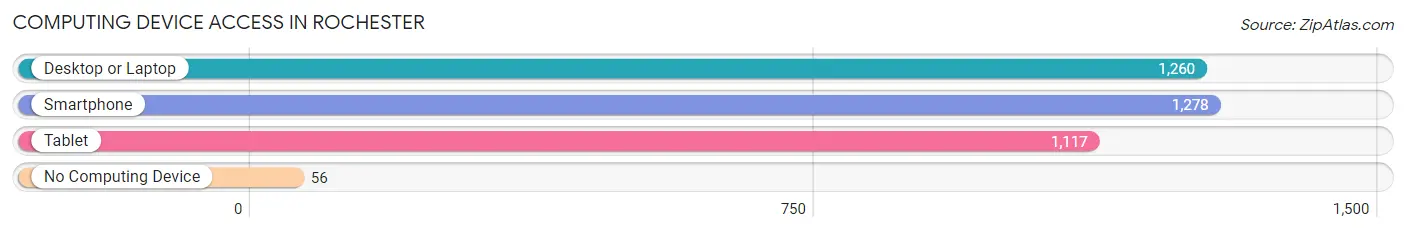
| Device Type | # Households | % Households |
| Desktop or Laptop | 1,260 | 91.8% |
| Smartphone | 1,278 | 93.1% |
| Tablet | 1,117 | 81.4% |
| No Computing Device | 56 | 4.1% |
| Total | 1,372 | 100.0% |
Internet Access in Rochester
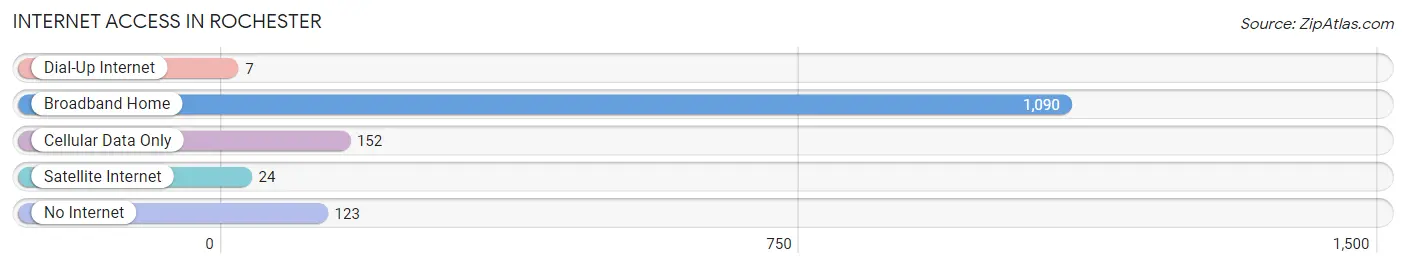
| Internet Type | # Households | % Households |
| Dial-Up Internet | 7 | 0.5% |
| Broadband Home | 1,090 | 79.4% |
| Cellular Data Only | 152 | 11.1% |
| Satellite Internet | 24 | 1.8% |
| No Internet | 123 | 9.0% |
| Total | 1,372 | 100.0% |
Rochester Summary
Rochester, Illinois is a small city located in Sangamon County, Illinois. It is situated on the banks of the Sangamon River, about 20 miles northwest of Springfield, the state capital. The city has a population of approximately 2,500 people and is part of the Springfield Metropolitan Statistical Area.
History
Rochester was founded in 1836 by a group of settlers from New York. The city was named after Rochester, New York, the hometown of many of the settlers. The city was incorporated in 1854 and has since grown to become a thriving community.
Rochester was an important stop on the Underground Railroad, a network of secret routes and safe houses used by African-American slaves to escape to freedom in the northern United States and Canada. The city was also home to the first African-American church in Sangamon County, the First African Methodist Episcopal Church, which was founded in 1867.
Geography
Rochester is located in central Illinois, about 20 miles northwest of Springfield. The city is situated on the banks of the Sangamon River, which flows through the city. The city is surrounded by rolling hills and farmland, and is located in the heart of the Midwest.
The climate in Rochester is typical of the Midwest, with hot summers and cold winters. The average temperature in the summer is around 80 degrees Fahrenheit, and the average temperature in the winter is around 30 degrees Fahrenheit.
Economy
Rochester’s economy is largely based on agriculture and manufacturing. The city is home to several large farms, as well as several factories and manufacturing plants. The city is also home to several small businesses, including restaurants, retail stores, and service providers.
The city is also home to several educational institutions, including Lincoln Land Community College and the University of Illinois at Springfield.
Demographics
As of the 2010 census, the population of Rochester was 2,500. The racial makeup of the city was 95.2% White, 1.2% African American, 0.4% Native American, 0.8% Asian, 0.1% Pacific Islander, 0.8% from other races, and 1.5% from two or more races. Hispanic or Latino of any race were 2.2% of the population.
The median income for a household in the city was $41,250, and the median income for a family was $50,000. The per capita income for the city was $20,845. About 11.2% of families and 14.2% of the population were below the poverty line, including 19.2% of those under age 18 and 8.2% of those age 65 or over.
Rochester is a small city with a rich history and a vibrant economy. The city is home to several educational institutions, as well as several farms and factories. The city is also home to a diverse population, with a variety of racial and ethnic backgrounds. Rochester is a great place to live, work, and raise a family.
Common Questions
What is Per Capita Income in Rochester?
Per Capita income in Rochester is $45,025.
What is the Median Family Income in Rochester?
Median Family Income in Rochester is $117,000.
What is the Median Household income in Rochester?
Median Household Income in Rochester is $107,800.
What is Income or Wage Gap in Rochester?
Income or Wage Gap in Rochester is 8.8%.
Women in Rochester earn 91.2 cents for every dollar earned by a man.
What is Inequality or Gini Index in Rochester?
Inequality or Gini Index in Rochester is 0.37.
What is the Total Population of Rochester?
Total Population of Rochester is 3,752.
What is the Total Male Population of Rochester?
Total Male Population of Rochester is 1,745.
What is the Total Female Population of Rochester?
Total Female Population of Rochester is 2,007.
What is the Ratio of Males per 100 Females in Rochester?
There are 86.95 Males per 100 Females in Rochester.
What is the Ratio of Females per 100 Males in Rochester?
There are 115.01 Females per 100 Males in Rochester.
What is the Median Population Age in Rochester?
Median Population Age in Rochester is 39.4 Years.
What is the Average Family Size in Rochester
Average Family Size in Rochester is 3.1 People.
What is the Average Household Size in Rochester
Average Household Size in Rochester is 2.7 People.
How Large is the Labor Force in Rochester?
There are 1,644 People in the Labor Forcein in Rochester.
What is the Percentage of People in the Labor Force in Rochester?
57.2% of People are in the Labor Force in Rochester.
What is the Unemployment Rate in Rochester?
Unemployment Rate in Rochester is 3.9%.