Princeton, IL Map & Demographics
Princeton Map
Princeton Overview
$36,286
PER CAPITA INCOME
$80,591
AVG FAMILY INCOME
$55,926
AVG HOUSEHOLD INCOME
41.0%
WAGE / INCOME GAP [ % ]
59.0¢/ $1
WAGE / INCOME GAP [ $ ]
0.46
INEQUALITY / GINI INDEX
7,749
TOTAL POPULATION
3,574
MALE POPULATION
4,175
FEMALE POPULATION
85.60
MALES / 100 FEMALES
116.82
FEMALES / 100 MALES
46.5
MEDIAN AGE
2.9
AVG FAMILY SIZE
2.1
AVG HOUSEHOLD SIZE
3,635
LABOR FORCE [ PEOPLE ]
57.0%
PERCENT IN LABOR FORCE
6.2%
UNEMPLOYMENT RATE
Princeton Zip Codes
Princeton Area Codes
Income in Princeton
Income Overview in Princeton
Per Capita Income in Princeton is $36,286, while median incomes of families and households are $80,591 and $55,926 respectively.
| Characteristic | Number | Measure |
| Per Capita Income | 7,749 | $36,286 |
| Median Family Income | 1,914 | $80,591 |
| Mean Family Income | 1,914 | $99,305 |
| Median Household Income | 3,488 | $55,926 |
| Mean Household Income | 3,488 | $78,920 |
| Income Deficit | 1,914 | $0 |
| Wage / Income Gap (%) | 7,749 | 41.01% |
| Wage / Income Gap ($) | 7,749 | 58.99¢ per $1 |
| Gini / Inequality Index | 7,749 | 0.46 |
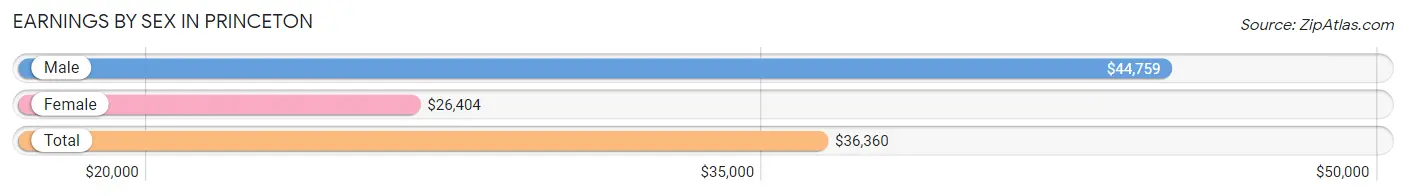
Earnings by Sex in Princeton
Average Earnings in Princeton are $36,360, $44,759 for men and $26,404 for women, a difference of 41.0%.
| Sex | Number | Average Earnings |
| Male | 1,948 (50.2%) | $44,759 |
| Female | 1,935 (49.8%) | $26,404 |
| Total | 3,883 (100.0%) | $36,360 |
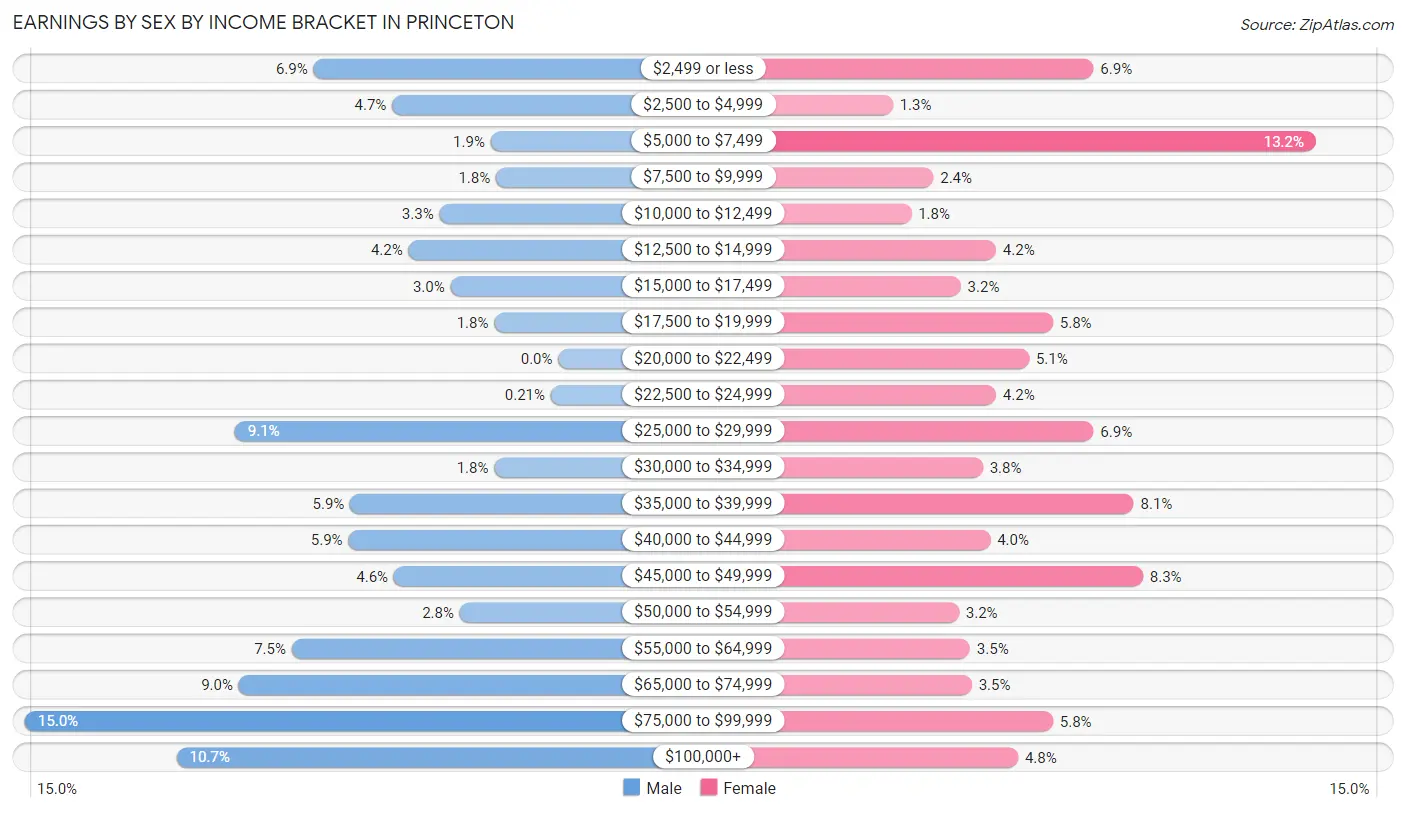
Earnings by Sex by Income Bracket in Princeton
The most common earnings brackets in Princeton are $75,000 to $99,999 for men (292 | 15.0%) and $5,000 to $7,499 for women (255 | 13.2%).
| Income | Male | Female |
| $2,499 or less | 134 (6.9%) | 134 (6.9%) |
| $2,500 to $4,999 | 91 (4.7%) | 25 (1.3%) |
| $5,000 to $7,499 | 37 (1.9%) | 255 (13.2%) |
| $7,500 to $9,999 | 34 (1.8%) | 47 (2.4%) |
| $10,000 to $12,499 | 65 (3.3%) | 35 (1.8%) |
| $12,500 to $14,999 | 82 (4.2%) | 81 (4.2%) |
| $15,000 to $17,499 | 59 (3.0%) | 62 (3.2%) |
| $17,500 to $19,999 | 35 (1.8%) | 112 (5.8%) |
| $20,000 to $22,499 | 0 (0.0%) | 99 (5.1%) |
| $22,500 to $24,999 | 4 (0.2%) | 81 (4.2%) |
| $25,000 to $29,999 | 177 (9.1%) | 134 (6.9%) |
| $30,000 to $34,999 | 35 (1.8%) | 74 (3.8%) |
| $35,000 to $39,999 | 114 (5.9%) | 156 (8.1%) |
| $40,000 to $44,999 | 115 (5.9%) | 78 (4.0%) |
| $45,000 to $49,999 | 90 (4.6%) | 161 (8.3%) |
| $50,000 to $54,999 | 54 (2.8%) | 61 (3.2%) |
| $55,000 to $64,999 | 146 (7.5%) | 67 (3.5%) |
| $65,000 to $74,999 | 175 (9.0%) | 68 (3.5%) |
| $75,000 to $99,999 | 292 (15.0%) | 112 (5.8%) |
| $100,000+ | 209 (10.7%) | 93 (4.8%) |
| Total | 1,948 (100.0%) | 1,935 (100.0%) |
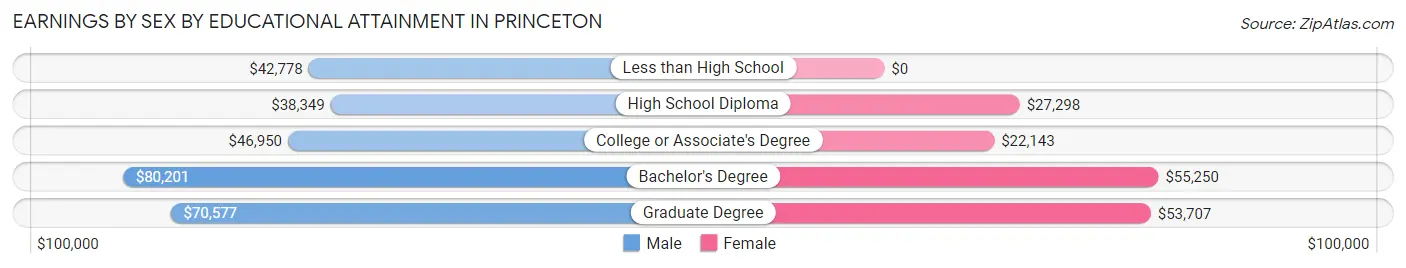
Earnings by Sex by Educational Attainment in Princeton
Average earnings in Princeton are $49,630 for men and $31,987 for women, a difference of 35.5%. Men with an educational attainment of bachelor's degree enjoy the highest average annual earnings of $80,201, while those with high school diploma education earn the least with $38,349. Women with an educational attainment of bachelor's degree earn the most with the average annual earnings of $55,250, while those with college or associate's degree education have the smallest earnings of $22,143.
| Educational Attainment | Male Income | Female Income |
| Less than High School | $42,778 | $0 |
| High School Diploma | $38,349 | $27,298 |
| College or Associate's Degree | $46,950 | $22,143 |
| Bachelor's Degree | $80,201 | $55,250 |
| Graduate Degree | $70,577 | $53,707 |
| Total | $49,630 | $31,987 |
Family Income in Princeton
Family Income Brackets in Princeton
According to the Princeton family income data, there are 572 families falling into the $100,000 to $149,999 income range, which is the most common income bracket and makes up 29.9% of all families. Conversely, the $10,000 to $14,999 income bracket is the least frequent group with only 57 families (3.0%) belonging to this category.
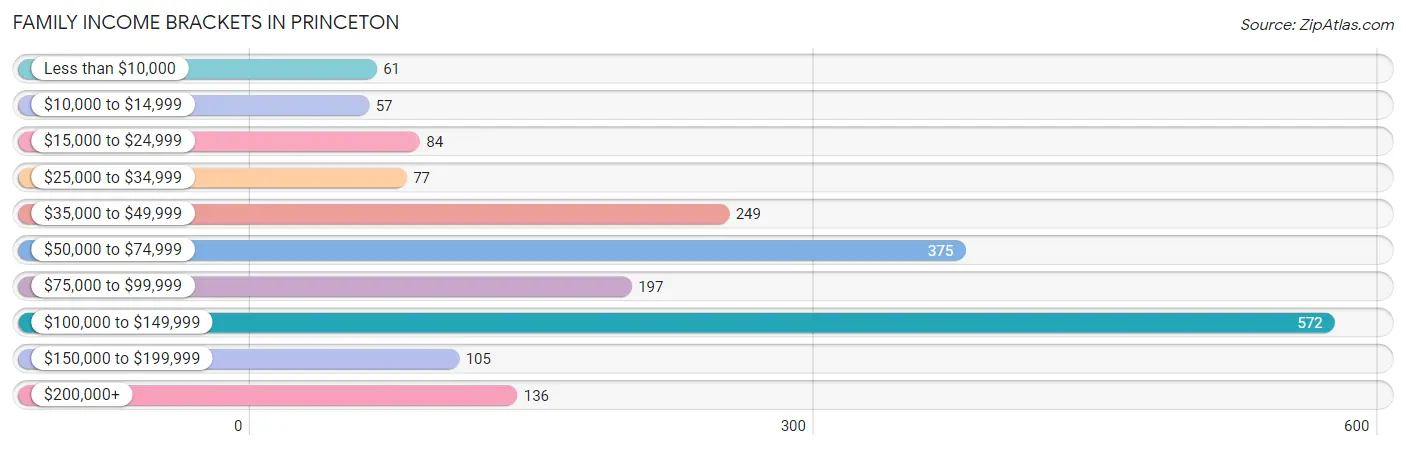
| Income Bracket | # Families | % Families |
| Less than $10,000 | 61 | 3.2% |
| $10,000 to $14,999 | 57 | 3.0% |
| $15,000 to $24,999 | 84 | 4.4% |
| $25,000 to $34,999 | 77 | 4.0% |
| $35,000 to $49,999 | 249 | 13.0% |
| $50,000 to $74,999 | 375 | 19.6% |
| $75,000 to $99,999 | 197 | 10.3% |
| $100,000 to $149,999 | 572 | 29.9% |
| $150,000 to $199,999 | 105 | 5.5% |
| $200,000+ | 136 | 7.1% |
Family Income by Famaliy Size in Princeton
2-person families (1,041 | 54.4%) account for the highest median family income in Princeton with $92,847 per family, while 2-person families (1,041 | 54.4%) have the highest median income of $46,424 per family member.
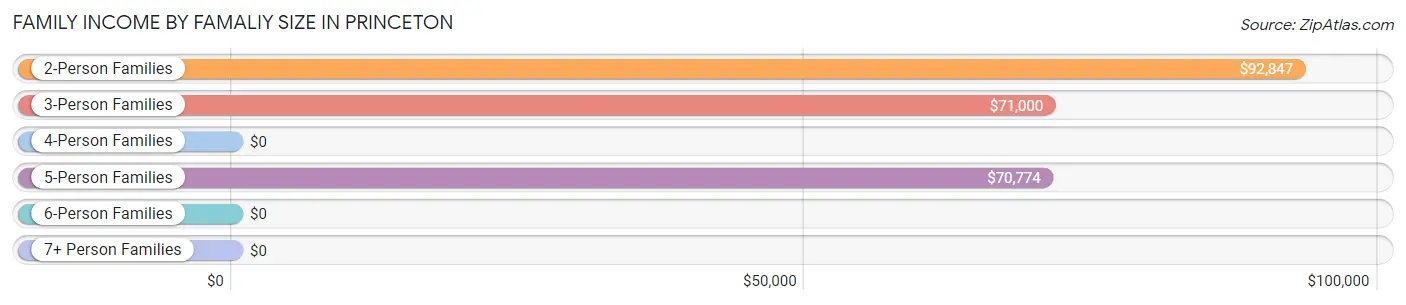
| Income Bracket | # Families | Median Income |
| 2-Person Families | 1,041 (54.4%) | $92,847 |
| 3-Person Families | 390 (20.4%) | $71,000 |
| 4-Person Families | 221 (11.6%) | $0 |
| 5-Person Families | 257 (13.4%) | $70,774 |
| 6-Person Families | 5 (0.3%) | $0 |
| 7+ Person Families | 0 (0.0%) | $0 |
| Total | 1,914 (100.0%) | $80,591 |
Family Income by Number of Earners in Princeton
The median family income in Princeton is $80,591, with families comprising 2 earners (877) having the highest median family income of $100,773, while families with no earners (339) have the lowest median family income of $48,785, accounting for 45.8% and 17.7% of families, respectively.
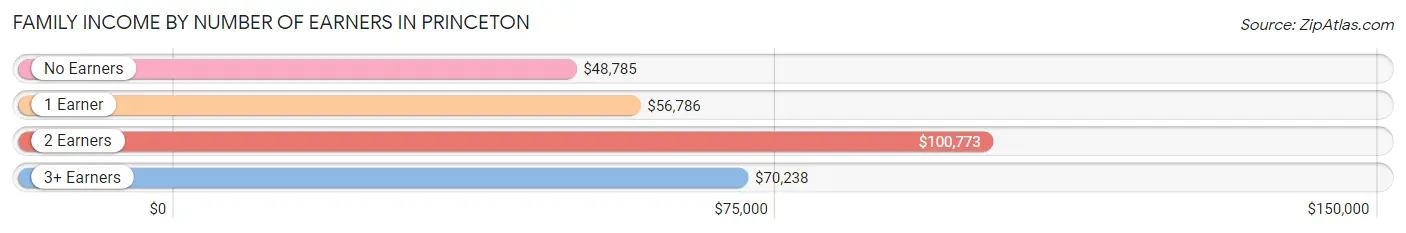
| Number of Earners | # Families | Median Income |
| No Earners | 339 (17.7%) | $48,785 |
| 1 Earner | 548 (28.6%) | $56,786 |
| 2 Earners | 877 (45.8%) | $100,773 |
| 3+ Earners | 150 (7.8%) | $70,238 |
| Total | 1,914 (100.0%) | $80,591 |
Household Income in Princeton
Household Income Brackets in Princeton
With 677 households falling in the category, the $100,000 to $149,999 income range is the most frequent in Princeton, accounting for 19.4% of all households. In contrast, only 105 households (3.0%) fall into the $150,000 to $199,999 income bracket, making it the least populous group.
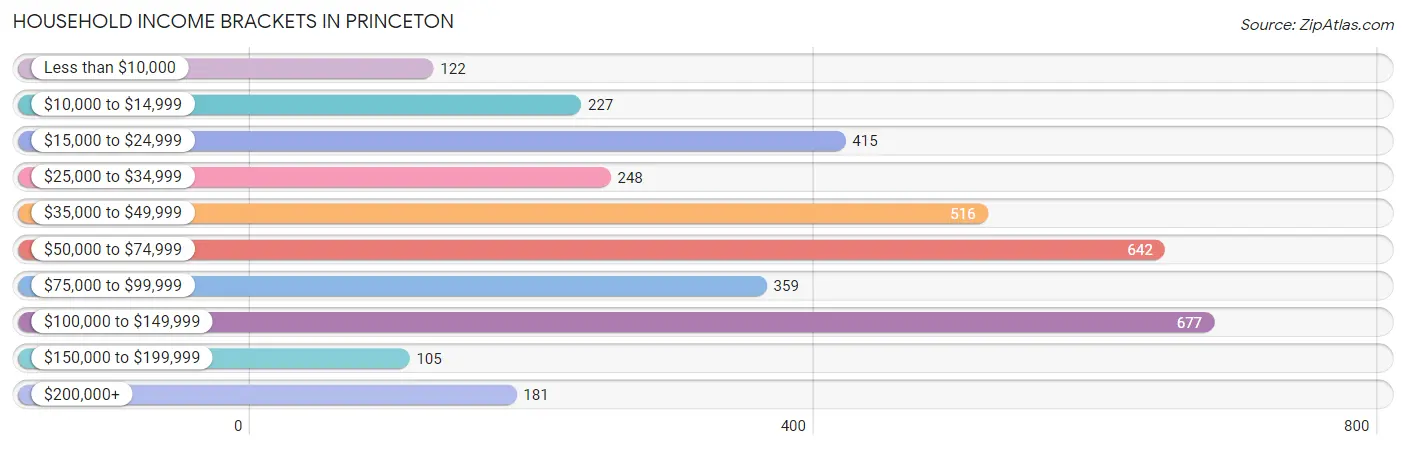
| Income Bracket | # Households | % Households |
| Less than $10,000 | 122 | 3.5% |
| $10,000 to $14,999 | 227 | 6.5% |
| $15,000 to $24,999 | 415 | 11.9% |
| $25,000 to $34,999 | 248 | 7.1% |
| $35,000 to $49,999 | 516 | 14.8% |
| $50,000 to $74,999 | 642 | 18.4% |
| $75,000 to $99,999 | 359 | 10.3% |
| $100,000 to $149,999 | 677 | 19.4% |
| $150,000 to $199,999 | 105 | 3.0% |
| $200,000+ | 181 | 5.2% |
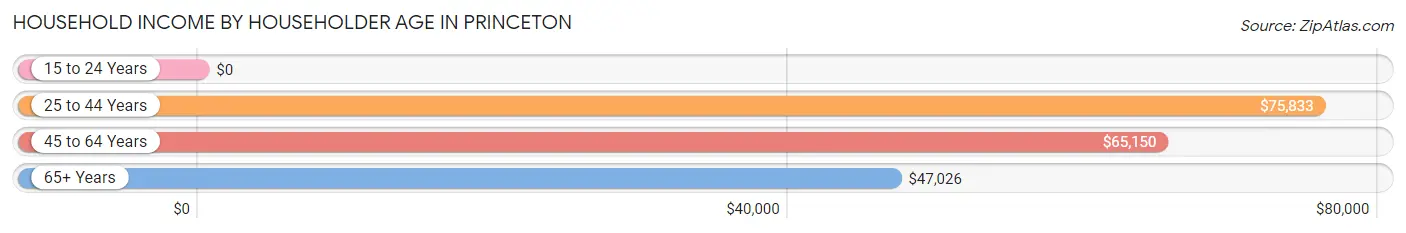
Household Income by Householder Age in Princeton
The median household income in Princeton is $55,926, with the highest median household income of $75,833 found in the 25 to 44 years age bracket for the primary householder. A total of 886 households (25.4%) fall into this category. Meanwhile, the 15 to 24 years age bracket for the primary householder has the lowest median household income of $0, with 106 households (3.0%) in this group.
| Income Bracket | # Households | Median Income |
| 15 to 24 Years | 106 (3.0%) | $0 |
| 25 to 44 Years | 886 (25.4%) | $75,833 |
| 45 to 64 Years | 1,049 (30.1%) | $65,150 |
| 65+ Years | 1,447 (41.5%) | $47,026 |
| Total | 3,488 (100.0%) | $55,926 |
Poverty in Princeton
Income Below Poverty by Sex and Age in Princeton
With 12.9% poverty level for males and 16.3% for females among the residents of Princeton, 5 year old males and 16 and 17 year old females are the most vulnerable to poverty, with 33 males (82.5%) and 27 females (47.4%) in their respective age groups living below the poverty level.
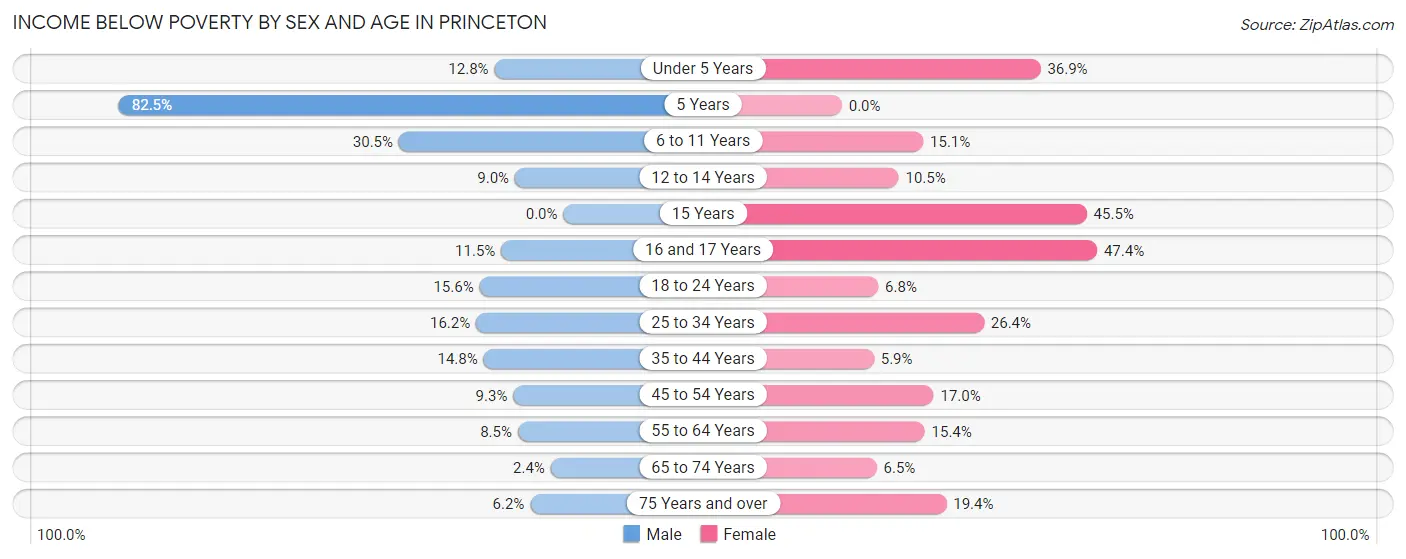
| Age Bracket | Male | Female |
| Under 5 Years | 21 (12.8%) | 73 (36.9%) |
| 5 Years | 33 (82.5%) | 0 (0.0%) |
| 6 to 11 Years | 98 (30.5%) | 32 (15.1%) |
| 12 to 14 Years | 15 (9.0%) | 10 (10.5%) |
| 15 Years | 0 (0.0%) | 15 (45.5%) |
| 16 and 17 Years | 6 (11.5%) | 27 (47.4%) |
| 18 to 24 Years | 33 (15.6%) | 21 (6.8%) |
| 25 to 34 Years | 86 (16.2%) | 149 (26.4%) |
| 35 to 44 Years | 55 (14.8%) | 18 (5.9%) |
| 45 to 54 Years | 36 (9.3%) | 79 (17.0%) |
| 55 to 64 Years | 35 (8.5%) | 83 (15.4%) |
| 65 to 74 Years | 11 (2.4%) | 37 (6.5%) |
| 75 Years and over | 19 (6.1%) | 116 (19.4%) |
| Total | 448 (12.9%) | 660 (16.3%) |
Income Above Poverty by Sex and Age in Princeton
According to the poverty statistics in Princeton, males aged 15 years and females aged 5 years are the age groups that are most secure financially, with 100.0% of males and 100.0% of females in these age groups living above the poverty line.
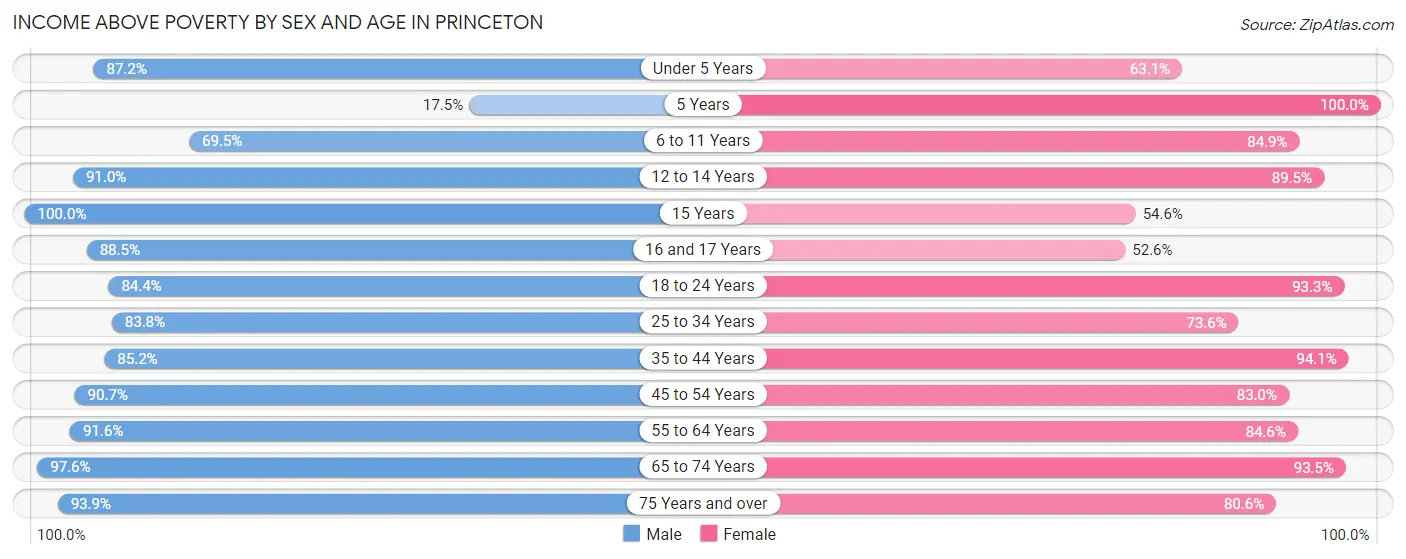
| Age Bracket | Male | Female |
| Under 5 Years | 143 (87.2%) | 125 (63.1%) |
| 5 Years | 7 (17.5%) | 93 (100.0%) |
| 6 to 11 Years | 223 (69.5%) | 180 (84.9%) |
| 12 to 14 Years | 152 (91.0%) | 85 (89.5%) |
| 15 Years | 36 (100.0%) | 18 (54.5%) |
| 16 and 17 Years | 46 (88.5%) | 30 (52.6%) |
| 18 to 24 Years | 179 (84.4%) | 290 (93.2%) |
| 25 to 34 Years | 445 (83.8%) | 416 (73.6%) |
| 35 to 44 Years | 316 (85.2%) | 285 (94.1%) |
| 45 to 54 Years | 351 (90.7%) | 385 (83.0%) |
| 55 to 64 Years | 379 (91.5%) | 457 (84.6%) |
| 65 to 74 Years | 456 (97.6%) | 536 (93.5%) |
| 75 Years and over | 290 (93.9%) | 482 (80.6%) |
| Total | 3,023 (87.1%) | 3,382 (83.7%) |
Income Below Poverty Among Married-Couple Families in Princeton
The poverty statistics for married-couple families in Princeton show that 1.2% or 18 of the total 1,491 families live below the poverty line. Families with 1 or 2 children have the highest poverty rate of 4.8%, comprising of 18 families. On the other hand, families with no children have the lowest poverty rate of 0.0%, which includes 0 families.
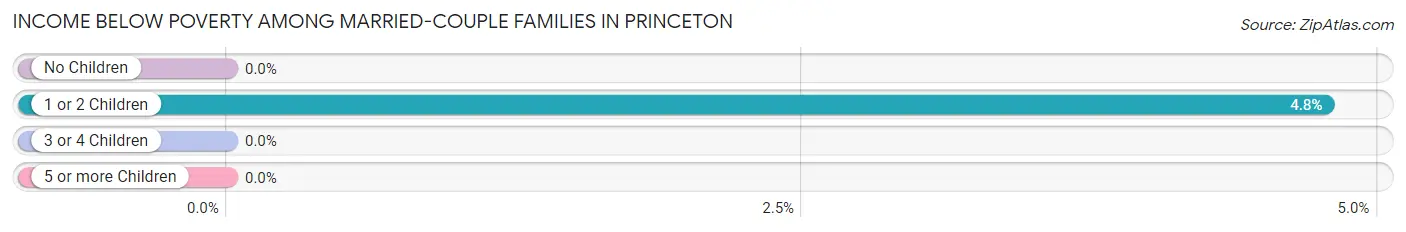
| Children | Above Poverty | Below Poverty |
| No Children | 980 (100.0%) | 0 (0.0%) |
| 1 or 2 Children | 359 (95.2%) | 18 (4.8%) |
| 3 or 4 Children | 134 (100.0%) | 0 (0.0%) |
| 5 or more Children | 0 (0.0%) | 0 (0.0%) |
| Total | 1,473 (98.8%) | 18 (1.2%) |
Income Below Poverty Among Single-Parent Households in Princeton
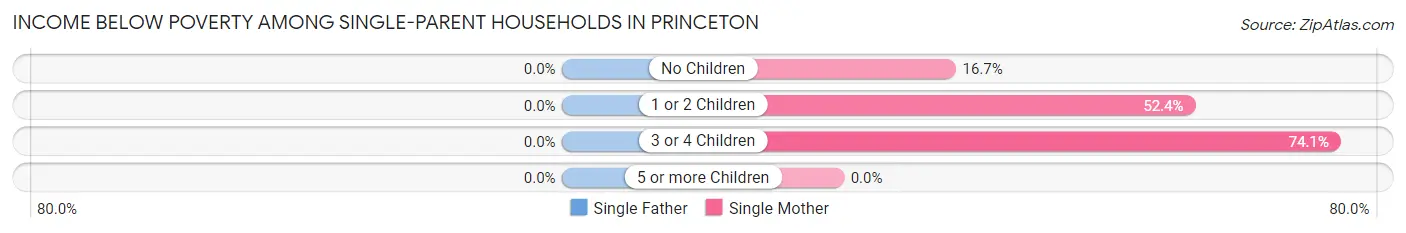
| Children | Single Father | Single Mother |
| No Children | 0 (0.0%) | 17 (16.7%) |
| 1 or 2 Children | 0 (0.0%) | 87 (52.4%) |
| 3 or 4 Children | 0 (0.0%) | 60 (74.1%) |
| 5 or more Children | 0 (0.0%) | 0 (0.0%) |
| Total | 0 (0.0%) | 164 (47.0%) |
Income Below Poverty Among Married-Couple vs Single-Parent Households in Princeton
The poverty data for Princeton shows that 18 of the married-couple family households (1.2%) and 164 of the single-parent households (38.8%) are living below the poverty level. Within the married-couple family households, those with 1 or 2 children have the highest poverty rate, with 18 households (4.8%) falling below the poverty line. Among the single-parent households, those with 3 or 4 children have the highest poverty rate, with 60 household (74.1%) living below poverty.
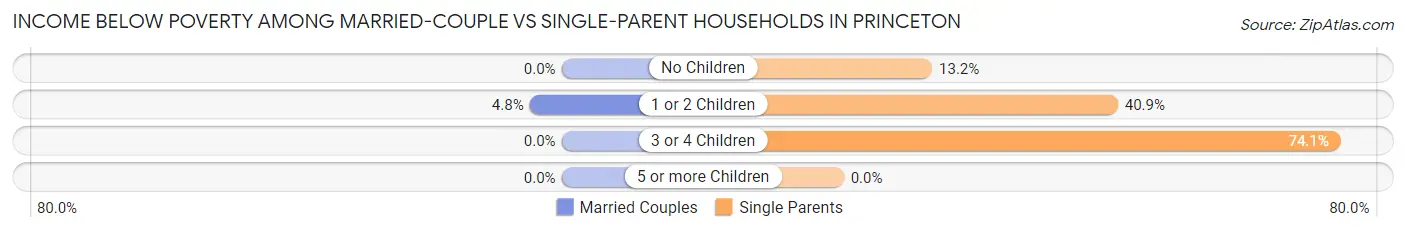
| Children | Married-Couple Families | Single-Parent Households |
| No Children | 0 (0.0%) | 17 (13.2%) |
| 1 or 2 Children | 18 (4.8%) | 87 (40.8%) |
| 3 or 4 Children | 0 (0.0%) | 60 (74.1%) |
| 5 or more Children | 0 (0.0%) | 0 (0.0%) |
| Total | 18 (1.2%) | 164 (38.8%) |
Race in Princeton
The most populous races in Princeton are White / Caucasian (7,157 | 92.4%), Two or more Races (326 | 4.2%), and Hispanic or Latino (283 | 3.6%).
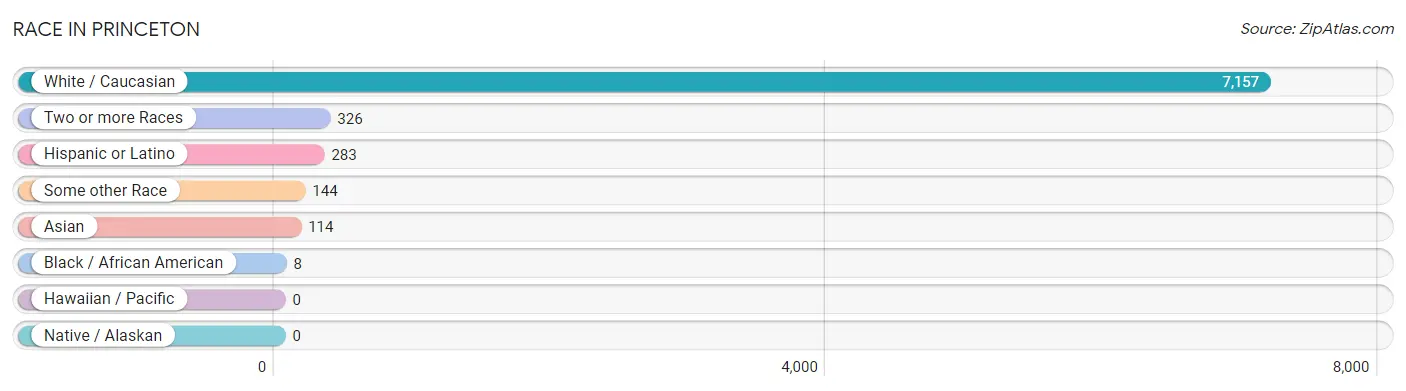
| Race | # Population | % Population |
| Asian | 114 | 1.5% |
| Black / African American | 8 | 0.1% |
| Hawaiian / Pacific | 0 | 0.0% |
| Hispanic or Latino | 283 | 3.6% |
| Native / Alaskan | 0 | 0.0% |
| White / Caucasian | 7,157 | 92.4% |
| Two or more Races | 326 | 4.2% |
| Some other Race | 144 | 1.9% |
| Total | 7,749 | 100.0% |
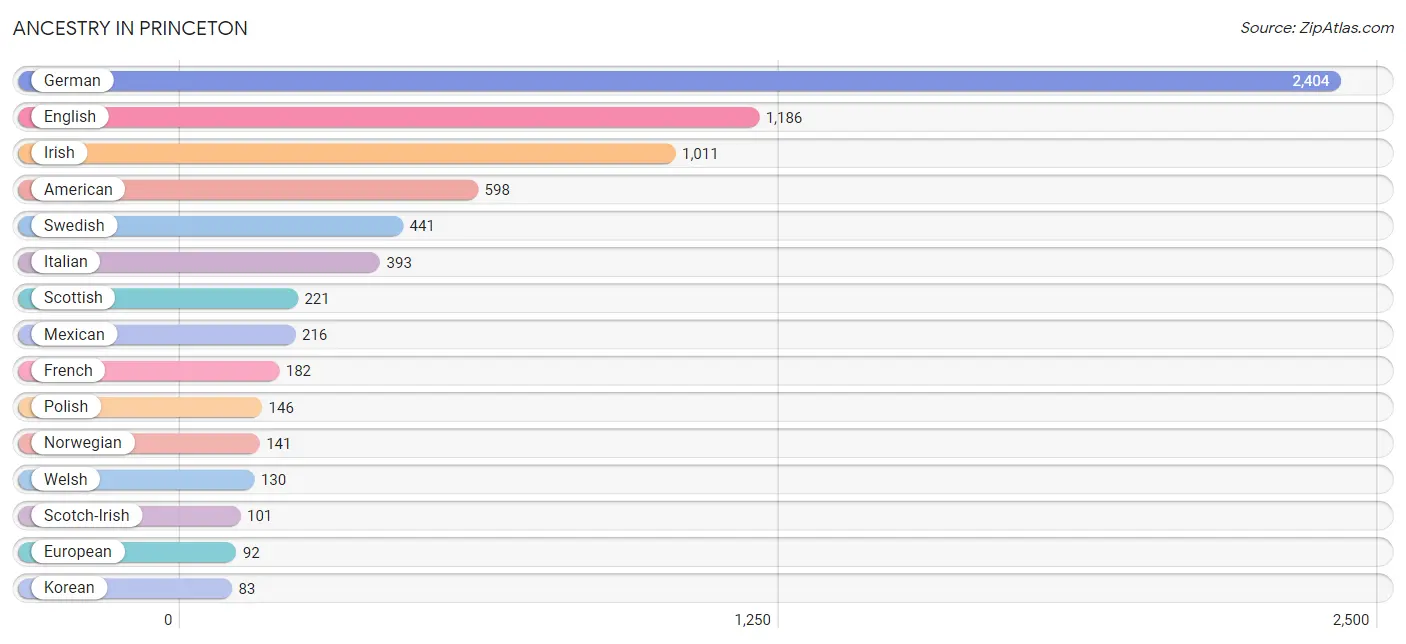
Ancestry in Princeton
The most populous ancestries reported in Princeton are German (2,404 | 31.0%), English (1,186 | 15.3%), Irish (1,011 | 13.1%), American (598 | 7.7%), and Swedish (441 | 5.7%), together accounting for 72.8% of all Princeton residents.
| Ancestry | # Population | % Population |
| American | 598 | 7.7% |
| Apache | 12 | 0.2% |
| Arab | 46 | 0.6% |
| Austrian | 4 | 0.1% |
| Belgian | 9 | 0.1% |
| Bhutanese | 9 | 0.1% |
| Blackfeet | 9 | 0.1% |
| British | 48 | 0.6% |
| Canadian | 9 | 0.1% |
| Cherokee | 19 | 0.3% |
| Colombian | 15 | 0.2% |
| Croatian | 12 | 0.2% |
| Czech | 26 | 0.3% |
| Czechoslovakian | 12 | 0.2% |
| Danish | 66 | 0.9% |
| Dutch | 71 | 0.9% |
| Eastern European | 10 | 0.1% |
| English | 1,186 | 15.3% |
| European | 92 | 1.2% |
| Finnish | 7 | 0.1% |
| French | 182 | 2.4% |
| French Canadian | 45 | 0.6% |
| German | 2,404 | 31.0% |
| Greek | 79 | 1.0% |
| Hungarian | 18 | 0.2% |
| Irish | 1,011 | 13.1% |
| Italian | 393 | 5.1% |
| Korean | 83 | 1.1% |
| Lithuanian | 7 | 0.1% |
| Macedonian | 8 | 0.1% |
| Malaysian | 1 | 0.0% |
| Mexican | 216 | 2.8% |
| Norwegian | 141 | 1.8% |
| Pennsylvania German | 12 | 0.2% |
| Polish | 146 | 1.9% |
| Puerto Rican | 26 | 0.3% |
| Romanian | 7 | 0.1% |
| Russian | 47 | 0.6% |
| Scandinavian | 72 | 0.9% |
| Scotch-Irish | 101 | 1.3% |
| Scottish | 221 | 2.9% |
| Slavic | 8 | 0.1% |
| Slovak | 46 | 0.6% |
| Slovene | 20 | 0.3% |
| South American | 15 | 0.2% |
| Spanish | 8 | 0.1% |
| Swedish | 441 | 5.7% |
| Syrian | 46 | 0.6% |
| Thai | 56 | 0.7% |
| Welsh | 130 | 1.7% | View All 50 Rows |
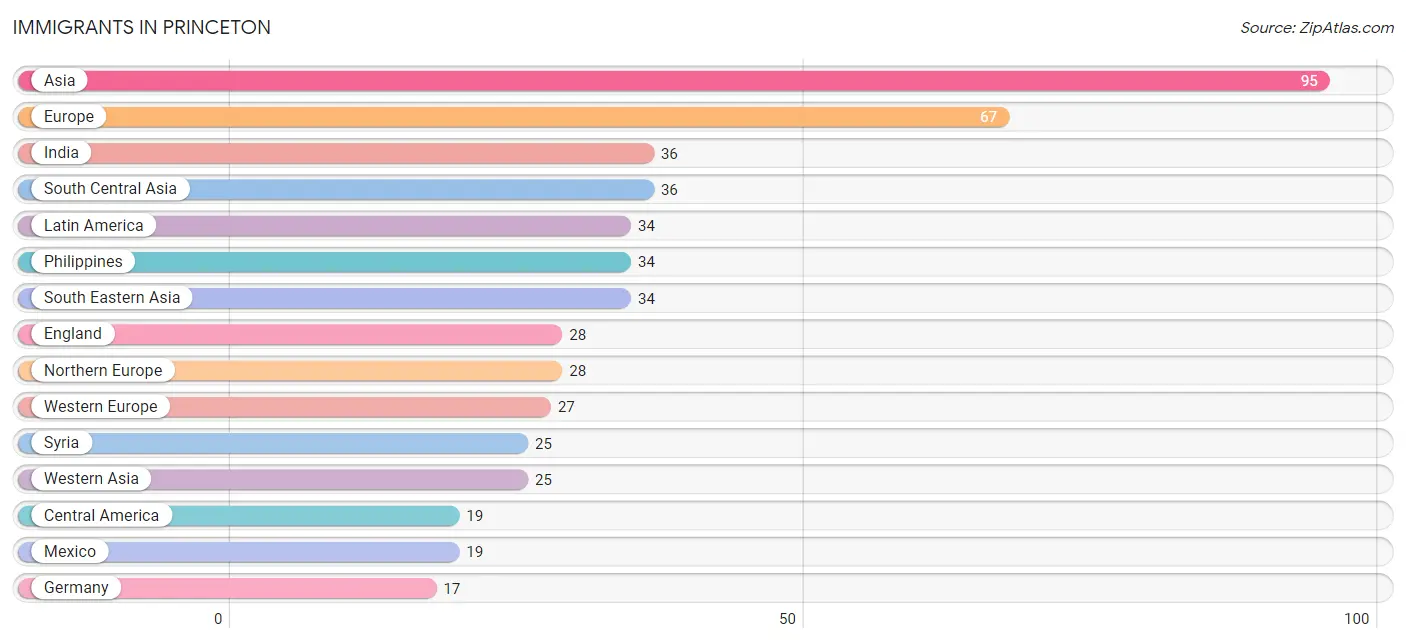
Immigrants in Princeton
The most numerous immigrant groups reported in Princeton came from Asia (95 | 1.2%), Europe (67 | 0.9%), India (36 | 0.5%), South Central Asia (36 | 0.5%), and Latin America (34 | 0.4%), together accounting for 3.5% of all Princeton residents.
| Immigration Origin | # Population | % Population |
| Asia | 95 | 1.2% |
| Austria | 10 | 0.1% |
| Central America | 19 | 0.3% |
| Colombia | 15 | 0.2% |
| Eastern Europe | 12 | 0.2% |
| England | 28 | 0.4% |
| Europe | 67 | 0.9% |
| Germany | 17 | 0.2% |
| India | 36 | 0.5% |
| Latin America | 34 | 0.4% |
| Mexico | 19 | 0.3% |
| Northern Europe | 28 | 0.4% |
| Philippines | 34 | 0.4% |
| Poland | 5 | 0.1% |
| Romania | 7 | 0.1% |
| South America | 15 | 0.2% |
| South Central Asia | 36 | 0.5% |
| South Eastern Asia | 34 | 0.4% |
| Syria | 25 | 0.3% |
| Western Asia | 25 | 0.3% |
| Western Europe | 27 | 0.4% | View All 21 Rows |
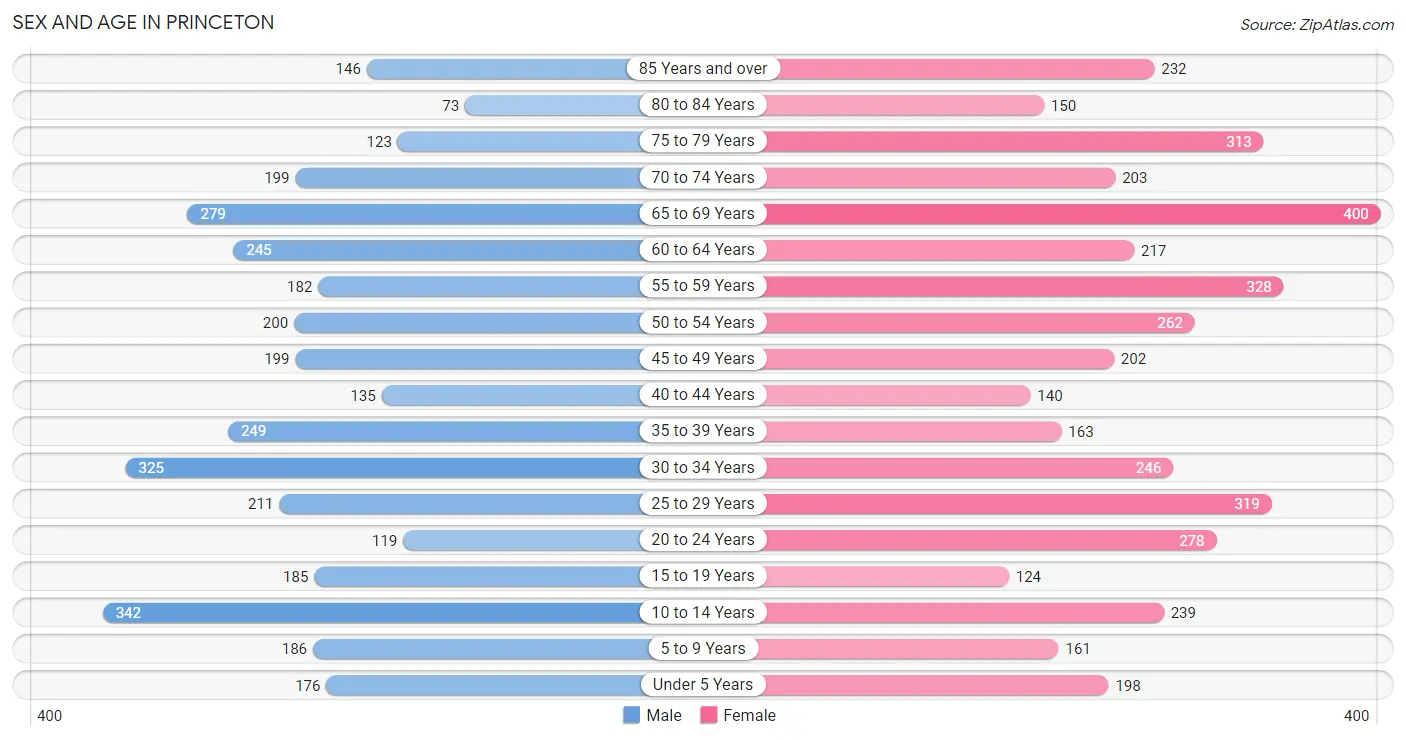
Sex and Age in Princeton
Sex and Age in Princeton
The most populous age groups in Princeton are 10 to 14 Years (342 | 9.6%) for men and 65 to 69 Years (400 | 9.6%) for women.
| Age Bracket | Male | Female |
| Under 5 Years | 176 (4.9%) | 198 (4.7%) |
| 5 to 9 Years | 186 (5.2%) | 161 (3.9%) |
| 10 to 14 Years | 342 (9.6%) | 239 (5.7%) |
| 15 to 19 Years | 185 (5.2%) | 124 (3.0%) |
| 20 to 24 Years | 119 (3.3%) | 278 (6.7%) |
| 25 to 29 Years | 211 (5.9%) | 319 (7.6%) |
| 30 to 34 Years | 325 (9.1%) | 246 (5.9%) |
| 35 to 39 Years | 249 (7.0%) | 163 (3.9%) |
| 40 to 44 Years | 135 (3.8%) | 140 (3.4%) |
| 45 to 49 Years | 199 (5.6%) | 202 (4.8%) |
| 50 to 54 Years | 200 (5.6%) | 262 (6.3%) |
| 55 to 59 Years | 182 (5.1%) | 328 (7.9%) |
| 60 to 64 Years | 245 (6.9%) | 217 (5.2%) |
| 65 to 69 Years | 279 (7.8%) | 400 (9.6%) |
| 70 to 74 Years | 199 (5.6%) | 203 (4.9%) |
| 75 to 79 Years | 123 (3.4%) | 313 (7.5%) |
| 80 to 84 Years | 73 (2.0%) | 150 (3.6%) |
| 85 Years and over | 146 (4.1%) | 232 (5.6%) |
| Total | 3,574 (100.0%) | 4,175 (100.0%) |
Families and Households in Princeton
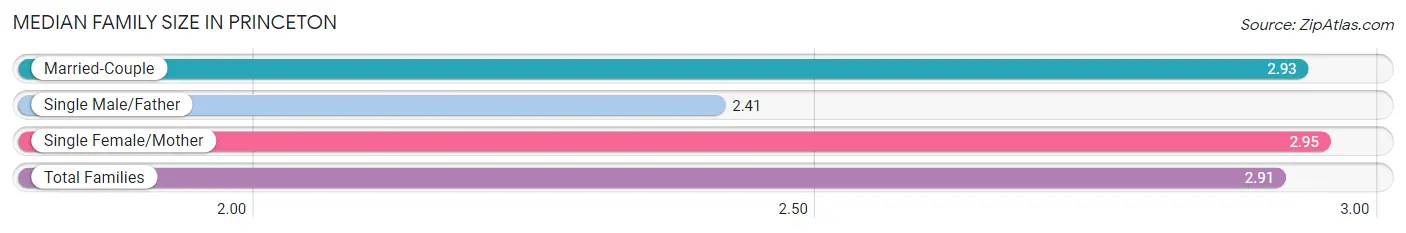
Median Family Size in Princeton
The median family size in Princeton is 2.91 persons per family, with single female/mother families (349 | 18.2%) accounting for the largest median family size of 2.95 persons per family. On the other hand, single male/father families (74 | 3.9%) represent the smallest median family size with 2.41 persons per family.
| Family Type | # Families | Family Size |
| Married-Couple | 1,491 (77.9%) | 2.93 |
| Single Male/Father | 74 (3.9%) | 2.41 |
| Single Female/Mother | 349 (18.2%) | 2.95 |
| Total Families | 1,914 (100.0%) | 2.91 |
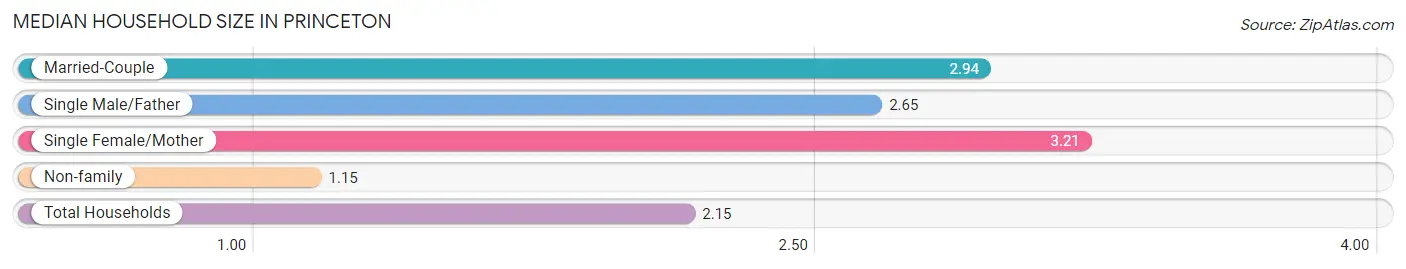
Median Household Size in Princeton
The median household size in Princeton is 2.15 persons per household, with single female/mother households (349 | 10.0%) accounting for the largest median household size of 3.21 persons per household. non-family households (1,574 | 45.1%) represent the smallest median household size with 1.15 persons per household.
| Household Type | # Households | Household Size |
| Married-Couple | 1,491 (42.7%) | 2.94 |
| Single Male/Father | 74 (2.1%) | 2.65 |
| Single Female/Mother | 349 (10.0%) | 3.21 |
| Non-family | 1,574 (45.1%) | 1.15 |
| Total Households | 3,488 (100.0%) | 2.15 |
Household Size by Marriage Status in Princeton
Out of a total of 3,488 households in Princeton, 1,914 (54.9%) are family households, while 1,574 (45.1%) are nonfamily households. The most numerous type of family households are 2-person households, comprising 1,028, and the most common type of nonfamily households are 1-person households, comprising 1,370.
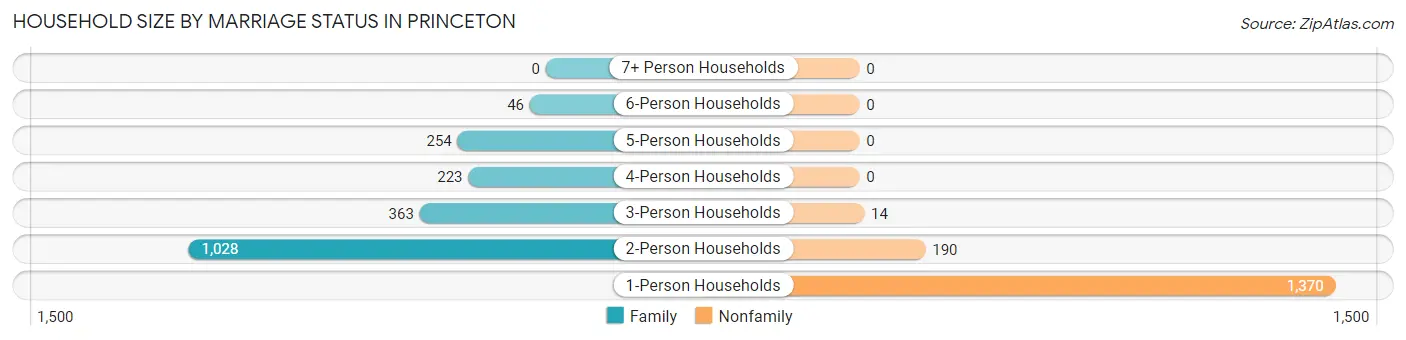
| Household Size | Family Households | Nonfamily Households |
| 1-Person Households | - | 1,370 (39.3%) |
| 2-Person Households | 1,028 (29.5%) | 190 (5.4%) |
| 3-Person Households | 363 (10.4%) | 14 (0.4%) |
| 4-Person Households | 223 (6.4%) | 0 (0.0%) |
| 5-Person Households | 254 (7.3%) | 0 (0.0%) |
| 6-Person Households | 46 (1.3%) | 0 (0.0%) |
| 7+ Person Households | 0 (0.0%) | 0 (0.0%) |
| Total | 1,914 (54.9%) | 1,574 (45.1%) |
Female Fertility in Princeton
Fertility by Age in Princeton
Average fertility rate in Princeton is 56.0 births per 1,000 women. Women in the age bracket of 20 to 34 years have the highest fertility rate with 101.0 births per 1,000 women. Women in the age bracket of 20 to 34 years acount for 100.0% of all women with births.
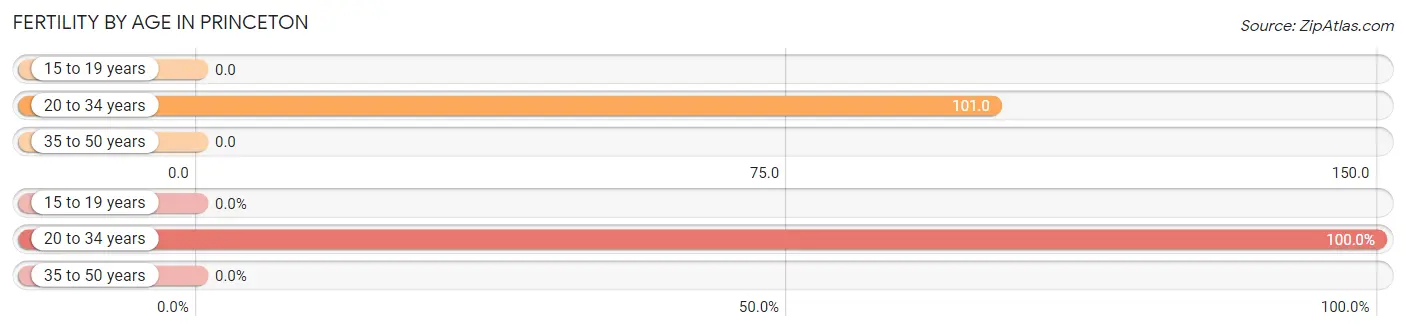
| Age Bracket | Women with Births | Births / 1,000 Women |
| 15 to 19 years | 0 (0.0%) | 0.0 |
| 20 to 34 years | 85 (100.0%) | 101.0 |
| 35 to 50 years | 0 (0.0%) | 0.0 |
| Total | 85 (100.0%) | 56.0 |
Fertility by Age by Marriage Status in Princeton
65.9% of women with births (85) in Princeton are married. The highest percentage of unmarried women with births falls into 20 to 34 years age bracket with 34.1% of them unmarried at the time of birth, while the lowest percentage of unmarried women with births belong to 20 to 34 years age bracket with 34.1% of them unmarried.
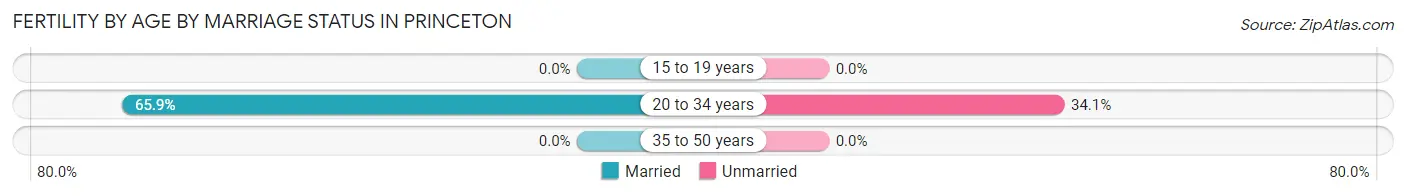
| Age Bracket | Married | Unmarried |
| 15 to 19 years | 0 (0.0%) | 0 (0.0%) |
| 20 to 34 years | 56 (65.9%) | 29 (34.1%) |
| 35 to 50 years | 0 (0.0%) | 0 (0.0%) |
| Total | 56 (65.9%) | 29 (34.1%) |
Fertility by Education in Princeton
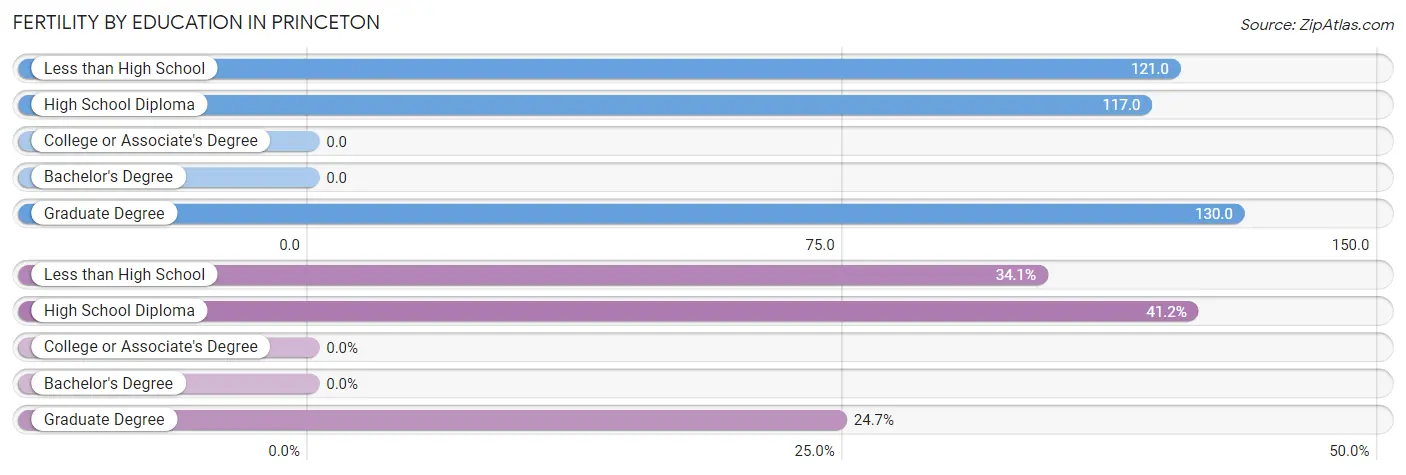
| Educational Attainment | Women with Births | Births / 1,000 Women |
| Less than High School | 29 (34.1%) | 121.0 |
| High School Diploma | 35 (41.2%) | 117.0 |
| College or Associate's Degree | 0 (0.0%) | 0.0 |
| Bachelor's Degree | 0 (0.0%) | 0.0 |
| Graduate Degree | 21 (24.7%) | 130.0 |
| Total | 85 (100.0%) | 56.0 |
Fertility by Education by Marriage Status in Princeton
34.1% of women with births in Princeton are unmarried. Women with the educational attainment of high school diploma are most likely to be married with 100.0% of them married at childbirth, while women with the educational attainment of less than high school are least likely to be married with 100.0% of them unmarried at childbirth.
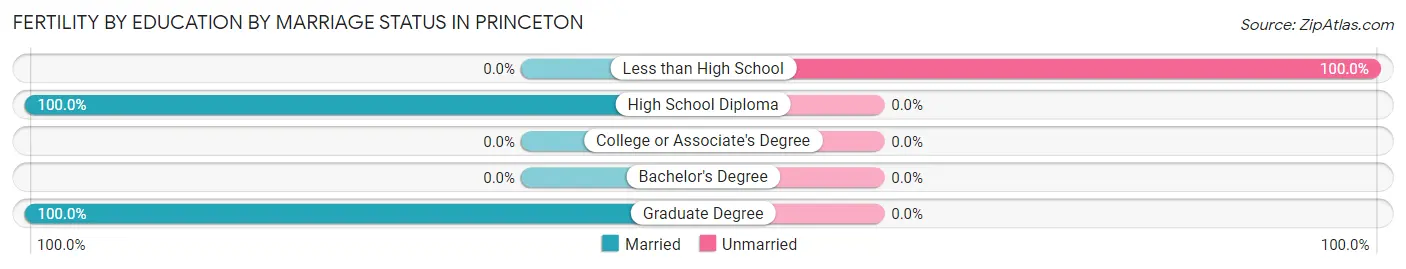
| Educational Attainment | Married | Unmarried |
| Less than High School | 0 (0.0%) | 29 (100.0%) |
| High School Diploma | 35 (100.0%) | 0 (0.0%) |
| College or Associate's Degree | 0 (0.0%) | 0 (0.0%) |
| Bachelor's Degree | 0 (0.0%) | 0 (0.0%) |
| Graduate Degree | 21 (100.0%) | 0 (0.0%) |
| Total | 56 (65.9%) | 29 (34.1%) |
Employment Characteristics in Princeton
Employment by Class of Employer in Princeton
Among the 3,329 employed individuals in Princeton, private company employees (2,180 | 65.5%), not-for-profit organizations (335 | 10.1%), and local government employees (270 | 8.1%) make up the most common classes of employment.
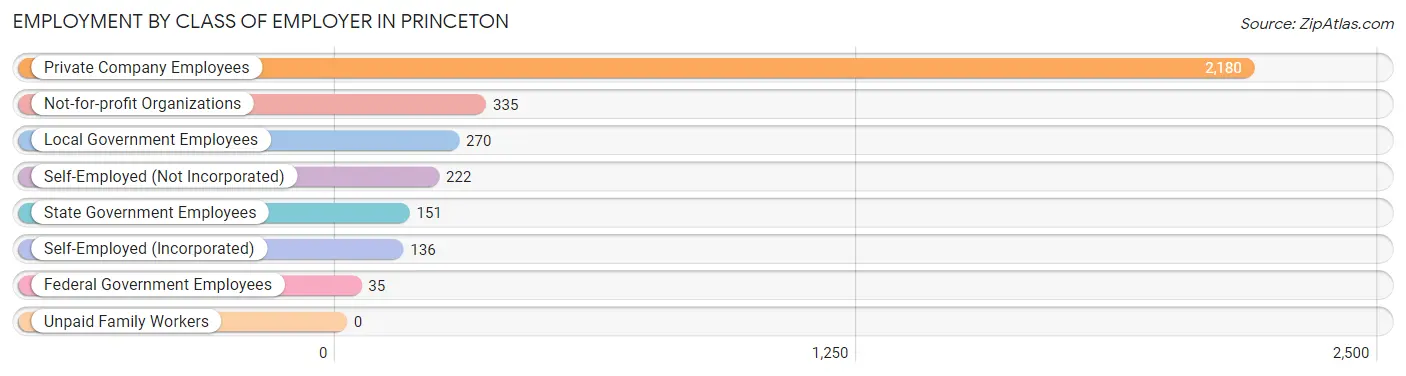
| Employer Class | # Employees | % Employees |
| Private Company Employees | 2,180 | 65.5% |
| Self-Employed (Incorporated) | 136 | 4.1% |
| Self-Employed (Not Incorporated) | 222 | 6.7% |
| Not-for-profit Organizations | 335 | 10.1% |
| Local Government Employees | 270 | 8.1% |
| State Government Employees | 151 | 4.5% |
| Federal Government Employees | 35 | 1.1% |
| Unpaid Family Workers | 0 | 0.0% |
| Total | 3,329 | 100.0% |
Employment Status by Age in Princeton
According to the labor force statistics for Princeton, out of the total population over 16 years of age (6,378), 57.0% or 3,635 individuals are in the labor force, with 6.2% or 225 of them unemployed. The age group with the highest labor force participation rate is 30 to 34 years, with 89.7% or 512 individuals in the labor force. Within the labor force, the 16 to 19 years age range has the highest percentage of unemployed individuals, with 25.4% or 34 of them being unemployed.
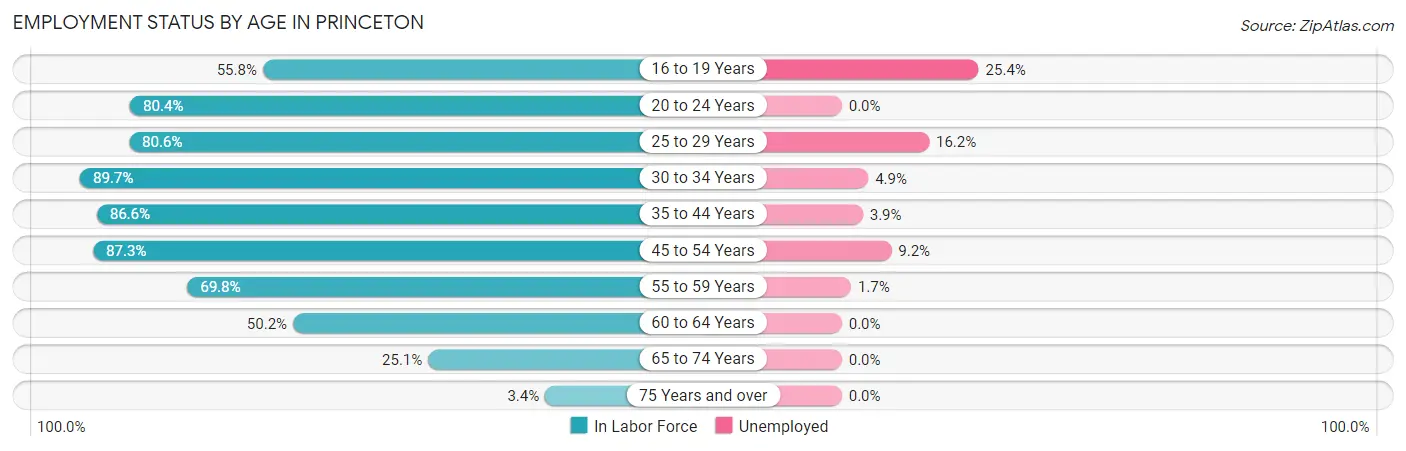
| Age Bracket | In Labor Force | Unemployed |
| 16 to 19 Years | 134 (55.8%) | 34 (25.4%) |
| 20 to 24 Years | 319 (80.4%) | 0 (0.0%) |
| 25 to 29 Years | 427 (80.6%) | 69 (16.2%) |
| 30 to 34 Years | 512 (89.7%) | 25 (4.9%) |
| 35 to 44 Years | 595 (86.6%) | 23 (3.9%) |
| 45 to 54 Years | 753 (87.3%) | 69 (9.2%) |
| 55 to 59 Years | 356 (69.8%) | 6 (1.7%) |
| 60 to 64 Years | 232 (50.2%) | 0 (0.0%) |
| 65 to 74 Years | 271 (25.1%) | 0 (0.0%) |
| 75 Years and over | 35 (3.4%) | 0 (0.0%) |
| Total | 3,635 (57.0%) | 225 (6.2%) |
Employment Status by Educational Attainment in Princeton
According to labor force statistics for Princeton, 79.4% of individuals (2,877) out of the total population between 25 and 64 years of age (3,623) are in the labor force, with 6.7% or 193 of them being unemployed. The group with the highest labor force participation rate are those with the educational attainment of bachelor's degree or higher, with 89.0% or 873 individuals in the labor force. Within the labor force, individuals with less than high school education have the highest percentage of unemployment, with 25.0% or 48 of them being unemployed.
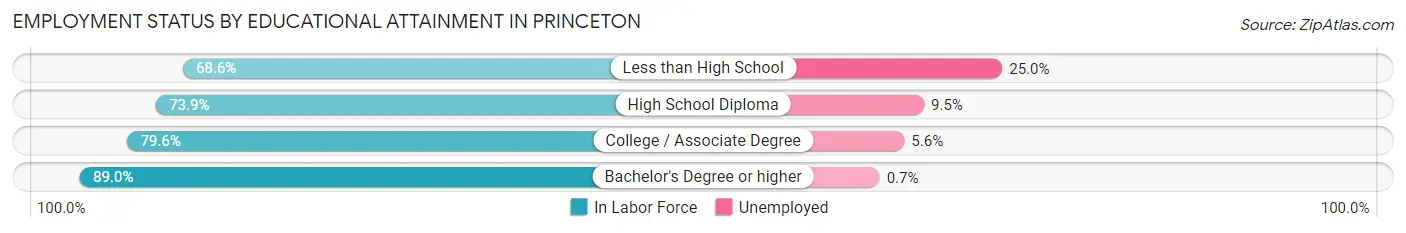
| Educational Attainment | In Labor Force | Unemployed |
| Less than High School | 192 (68.6%) | 70 (25.0%) |
| High School Diploma | 922 (73.9%) | 118 (9.5%) |
| College / Associate Degree | 888 (79.6%) | 62 (5.6%) |
| Bachelor's Degree or higher | 873 (89.0%) | 7 (0.7%) |
| Total | 2,877 (79.4%) | 243 (6.7%) |
Employment Occupations by Sex in Princeton
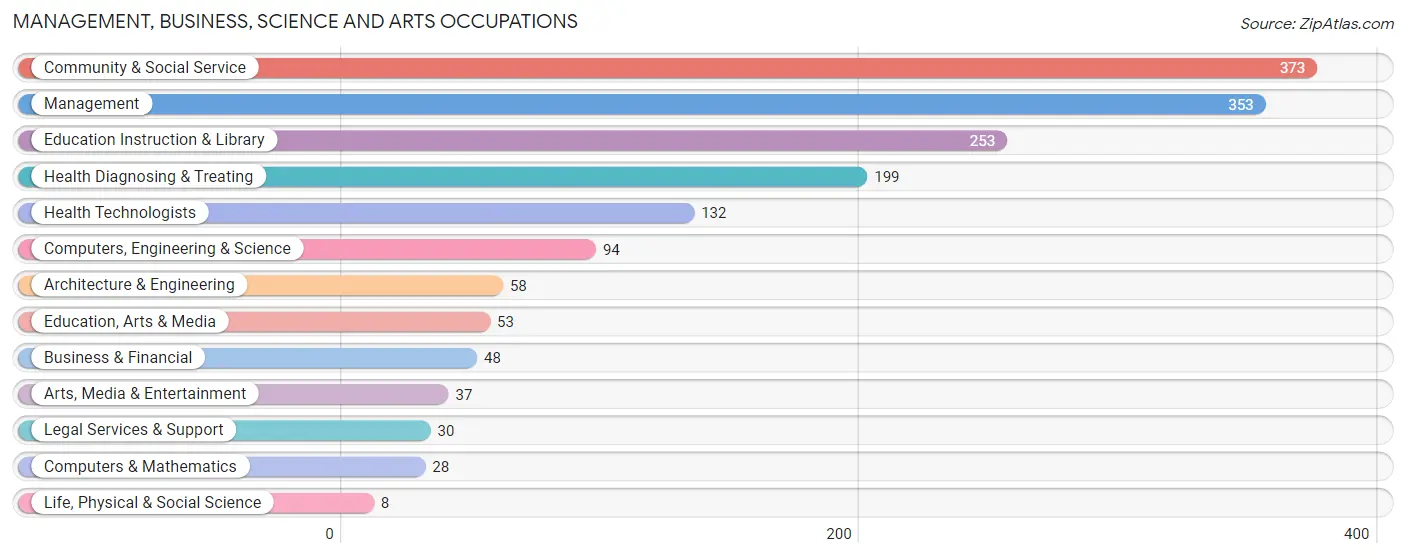
Management, Business, Science and Arts Occupations
The most common Management, Business, Science and Arts occupations in Princeton are Community & Social Service (373 | 10.9%), Management (353 | 10.4%), Education Instruction & Library (253 | 7.4%), Health Diagnosing & Treating (199 | 5.8%), and Health Technologists (132 | 3.9%).
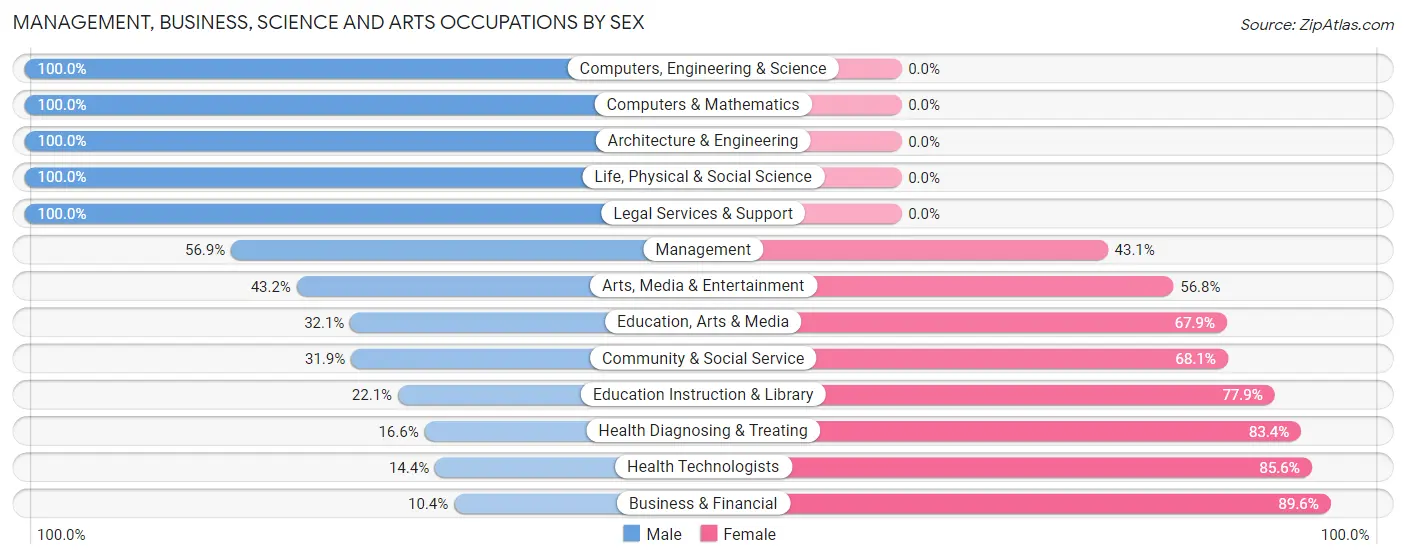
Management, Business, Science and Arts Occupations by Sex
Within the Management, Business, Science and Arts occupations in Princeton, the most male-oriented occupations are Computers, Engineering & Science (100.0%), Computers & Mathematics (100.0%), and Architecture & Engineering (100.0%), while the most female-oriented occupations are Business & Financial (89.6%), Health Technologists (85.6%), and Health Diagnosing & Treating (83.4%).
| Occupation | Male | Female |
| Management | 201 (56.9%) | 152 (43.1%) |
| Business & Financial | 5 (10.4%) | 43 (89.6%) |
| Computers, Engineering & Science | 94 (100.0%) | 0 (0.0%) |
| Computers & Mathematics | 28 (100.0%) | 0 (0.0%) |
| Architecture & Engineering | 58 (100.0%) | 0 (0.0%) |
| Life, Physical & Social Science | 8 (100.0%) | 0 (0.0%) |
| Community & Social Service | 119 (31.9%) | 254 (68.1%) |
| Education, Arts & Media | 17 (32.1%) | 36 (67.9%) |
| Legal Services & Support | 30 (100.0%) | 0 (0.0%) |
| Education Instruction & Library | 56 (22.1%) | 197 (77.9%) |
| Arts, Media & Entertainment | 16 (43.2%) | 21 (56.8%) |
| Health Diagnosing & Treating | 33 (16.6%) | 166 (83.4%) |
| Health Technologists | 19 (14.4%) | 113 (85.6%) |
| Total (Category) | 452 (42.4%) | 615 (57.6%) |
| Total (Overall) | 1,723 (50.6%) | 1,685 (49.4%) |
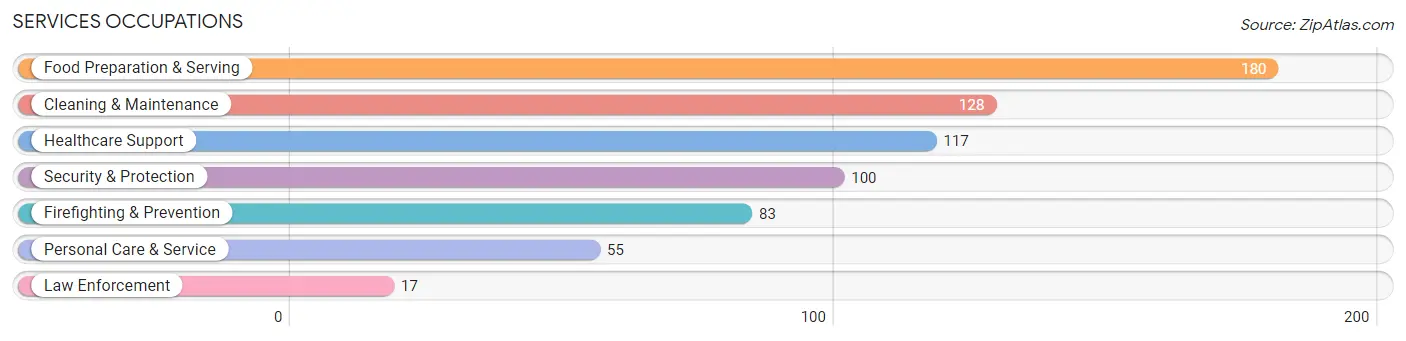
Services Occupations
The most common Services occupations in Princeton are Food Preparation & Serving (180 | 5.3%), Cleaning & Maintenance (128 | 3.8%), Healthcare Support (117 | 3.4%), Security & Protection (100 | 2.9%), and Firefighting & Prevention (83 | 2.4%).
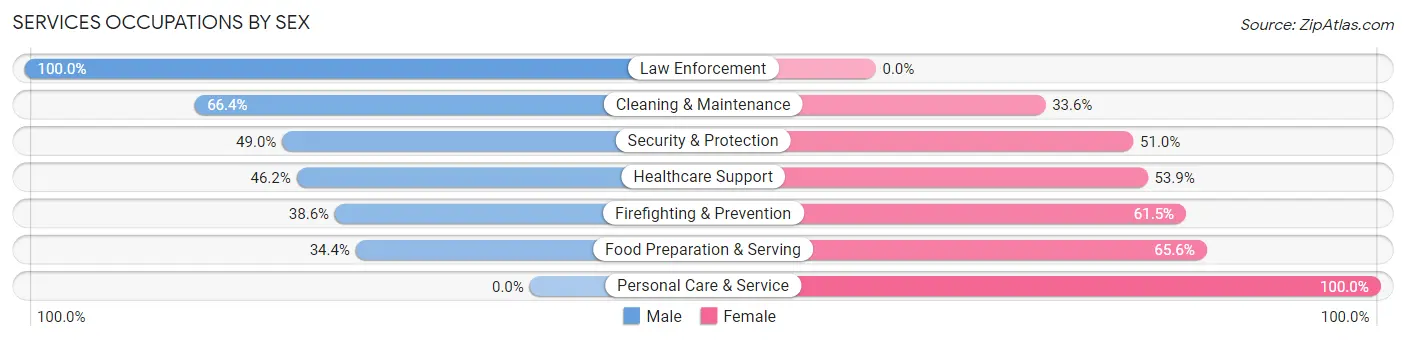
Services Occupations by Sex
Within the Services occupations in Princeton, the most male-oriented occupations are Law Enforcement (100.0%), Cleaning & Maintenance (66.4%), and Security & Protection (49.0%), while the most female-oriented occupations are Personal Care & Service (100.0%), Food Preparation & Serving (65.6%), and Firefighting & Prevention (61.5%).
| Occupation | Male | Female |
| Healthcare Support | 54 (46.2%) | 63 (53.8%) |
| Security & Protection | 49 (49.0%) | 51 (51.0%) |
| Firefighting & Prevention | 32 (38.6%) | 51 (61.5%) |
| Law Enforcement | 17 (100.0%) | 0 (0.0%) |
| Food Preparation & Serving | 62 (34.4%) | 118 (65.6%) |
| Cleaning & Maintenance | 85 (66.4%) | 43 (33.6%) |
| Personal Care & Service | 0 (0.0%) | 55 (100.0%) |
| Total (Category) | 250 (43.1%) | 330 (56.9%) |
| Total (Overall) | 1,723 (50.6%) | 1,685 (49.4%) |
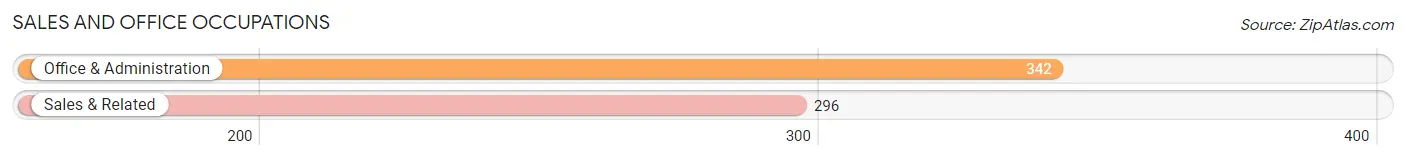
Sales and Office Occupations
The most common Sales and Office occupations in Princeton are Office & Administration (342 | 10.0%), and Sales & Related (296 | 8.7%).
Sales and Office Occupations by Sex
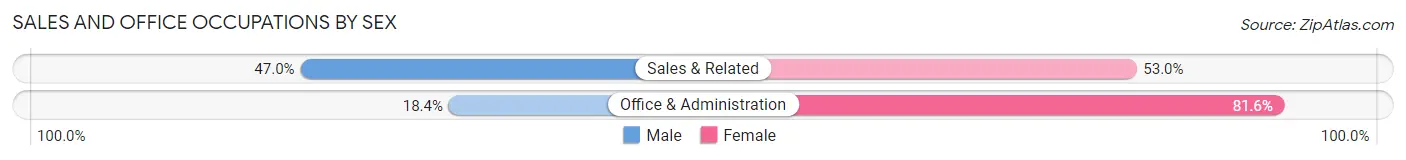
| Occupation | Male | Female |
| Sales & Related | 139 (47.0%) | 157 (53.0%) |
| Office & Administration | 63 (18.4%) | 279 (81.6%) |
| Total (Category) | 202 (31.7%) | 436 (68.3%) |
| Total (Overall) | 1,723 (50.6%) | 1,685 (49.4%) |
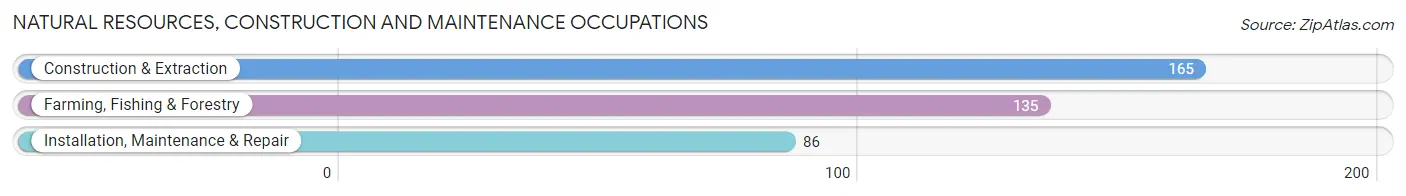
Natural Resources, Construction and Maintenance Occupations
The most common Natural Resources, Construction and Maintenance occupations in Princeton are Construction & Extraction (165 | 4.8%), Farming, Fishing & Forestry (135 | 4.0%), and Installation, Maintenance & Repair (86 | 2.5%).
Natural Resources, Construction and Maintenance Occupations by Sex
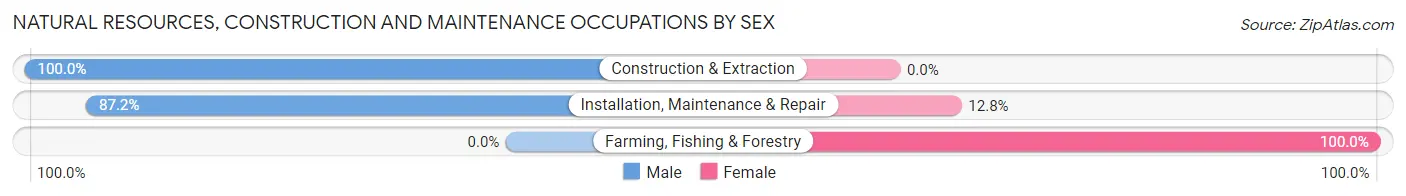
| Occupation | Male | Female |
| Farming, Fishing & Forestry | 0 (0.0%) | 135 (100.0%) |
| Construction & Extraction | 165 (100.0%) | 0 (0.0%) |
| Installation, Maintenance & Repair | 75 (87.2%) | 11 (12.8%) |
| Total (Category) | 240 (62.2%) | 146 (37.8%) |
| Total (Overall) | 1,723 (50.6%) | 1,685 (49.4%) |
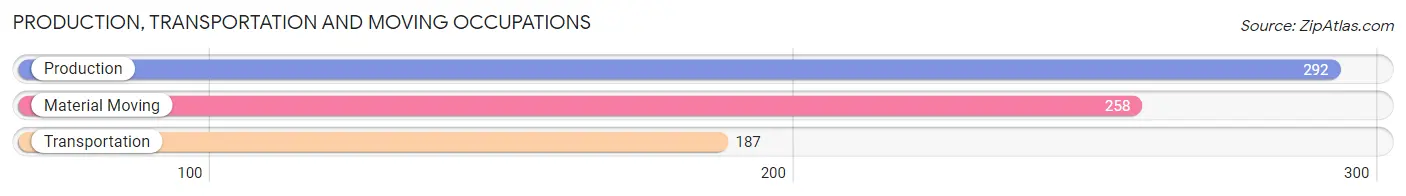
Production, Transportation and Moving Occupations
The most common Production, Transportation and Moving occupations in Princeton are Production (292 | 8.6%), Material Moving (258 | 7.6%), and Transportation (187 | 5.5%).
Production, Transportation and Moving Occupations by Sex
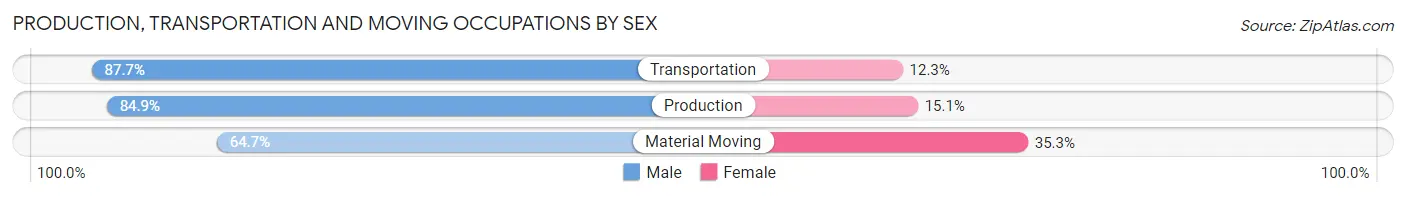
| Occupation | Male | Female |
| Production | 248 (84.9%) | 44 (15.1%) |
| Transportation | 164 (87.7%) | 23 (12.3%) |
| Material Moving | 167 (64.7%) | 91 (35.3%) |
| Total (Category) | 579 (78.6%) | 158 (21.4%) |
| Total (Overall) | 1,723 (50.6%) | 1,685 (49.4%) |
Employment Industries by Sex in Princeton
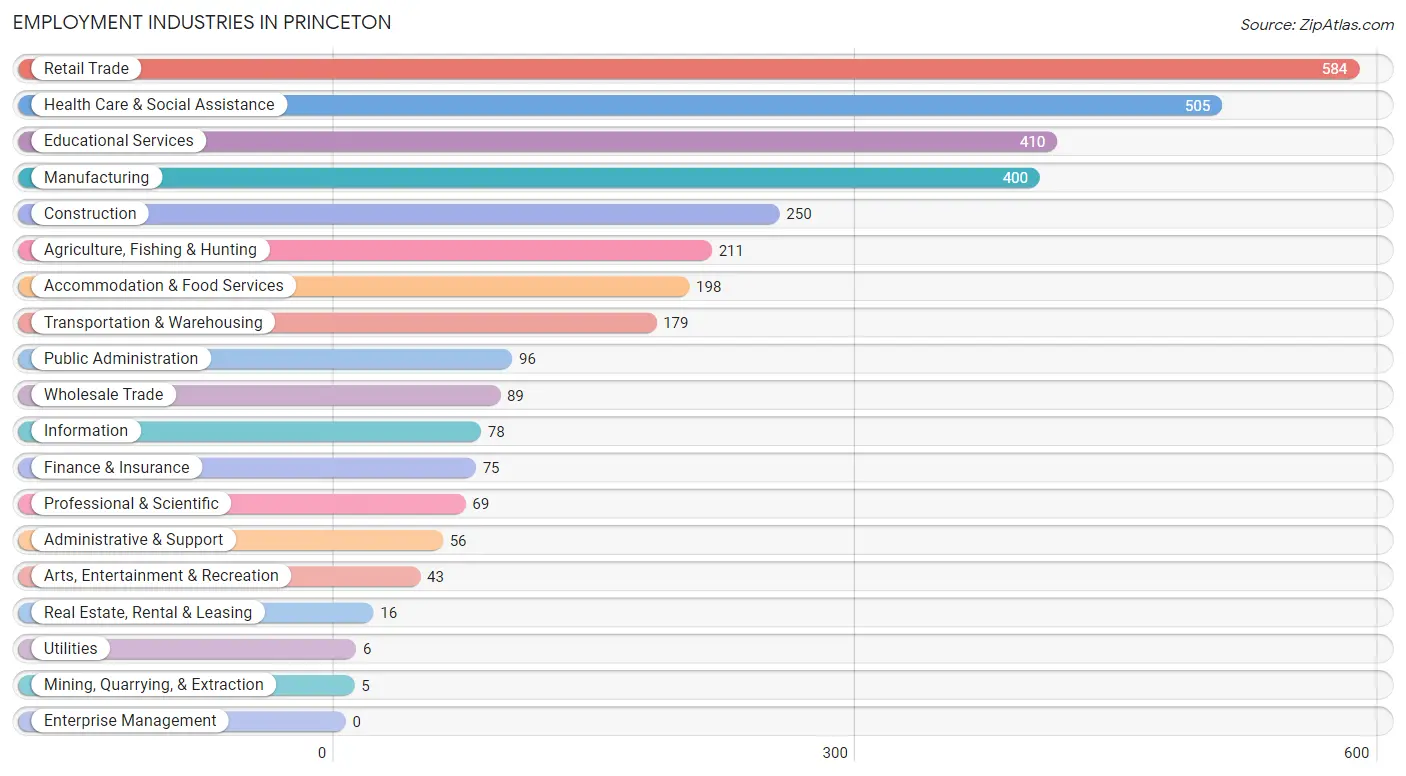
Employment Industries in Princeton
The major employment industries in Princeton include Retail Trade (584 | 17.1%), Health Care & Social Assistance (505 | 14.8%), Educational Services (410 | 12.0%), Manufacturing (400 | 11.7%), and Construction (250 | 7.3%).
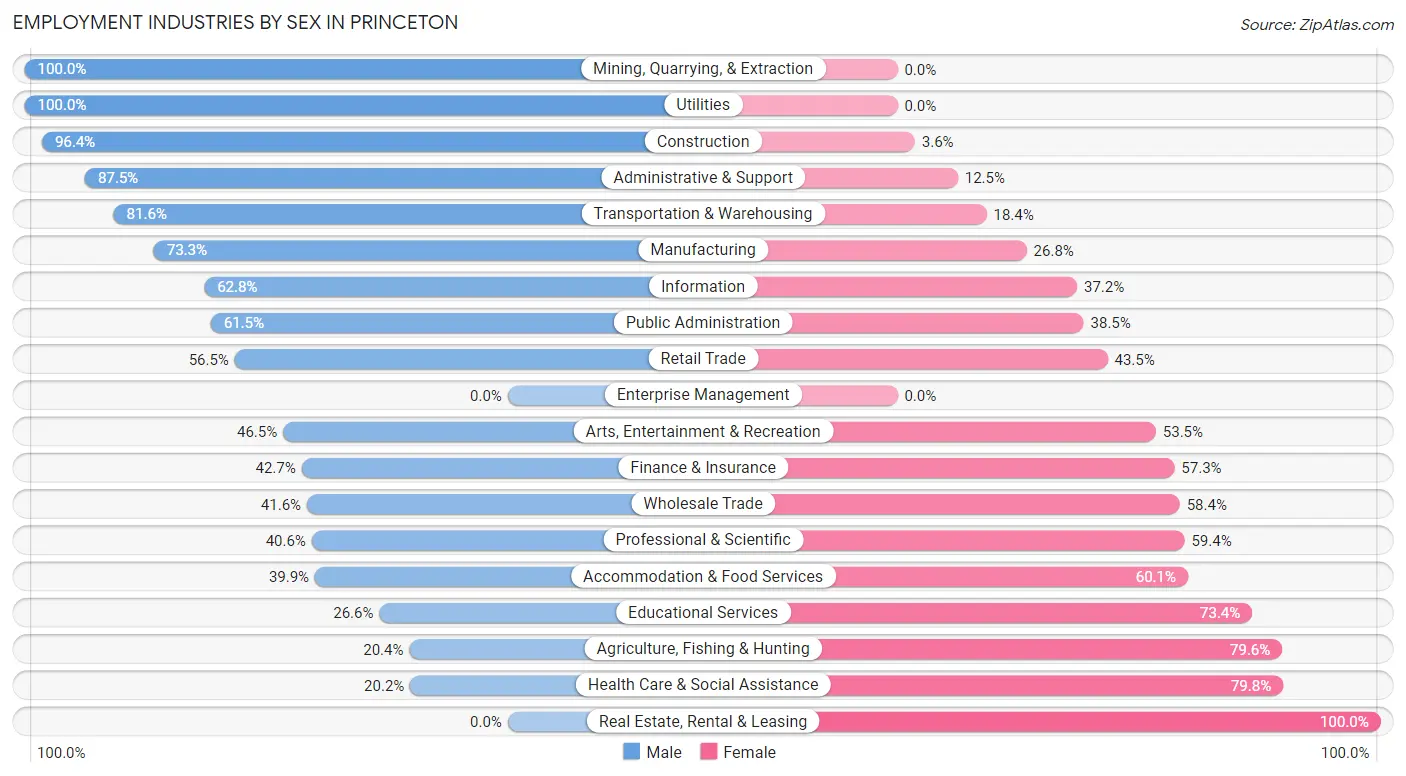
Employment Industries by Sex in Princeton
The Princeton industries that see more men than women are Mining, Quarrying, & Extraction (100.0%), Utilities (100.0%), and Construction (96.4%), whereas the industries that tend to have a higher number of women are Real Estate, Rental & Leasing (100.0%), Health Care & Social Assistance (79.8%), and Agriculture, Fishing & Hunting (79.6%).
| Industry | Male | Female |
| Agriculture, Fishing & Hunting | 43 (20.4%) | 168 (79.6%) |
| Mining, Quarrying, & Extraction | 5 (100.0%) | 0 (0.0%) |
| Construction | 241 (96.4%) | 9 (3.6%) |
| Manufacturing | 293 (73.3%) | 107 (26.8%) |
| Wholesale Trade | 37 (41.6%) | 52 (58.4%) |
| Retail Trade | 330 (56.5%) | 254 (43.5%) |
| Transportation & Warehousing | 146 (81.6%) | 33 (18.4%) |
| Utilities | 6 (100.0%) | 0 (0.0%) |
| Information | 49 (62.8%) | 29 (37.2%) |
| Finance & Insurance | 32 (42.7%) | 43 (57.3%) |
| Real Estate, Rental & Leasing | 0 (0.0%) | 16 (100.0%) |
| Professional & Scientific | 28 (40.6%) | 41 (59.4%) |
| Enterprise Management | 0 (0.0%) | 0 (0.0%) |
| Administrative & Support | 49 (87.5%) | 7 (12.5%) |
| Educational Services | 109 (26.6%) | 301 (73.4%) |
| Health Care & Social Assistance | 102 (20.2%) | 403 (79.8%) |
| Arts, Entertainment & Recreation | 20 (46.5%) | 23 (53.5%) |
| Accommodation & Food Services | 79 (39.9%) | 119 (60.1%) |
| Public Administration | 59 (61.5%) | 37 (38.5%) |
| Total | 1,723 (50.6%) | 1,685 (49.4%) |
Education in Princeton
School Enrollment in Princeton
The most common levels of schooling among the 1,510 students in Princeton are middle school (477 | 31.6%), high school (265 | 17.5%), and college / undergraduate (251 | 16.6%).
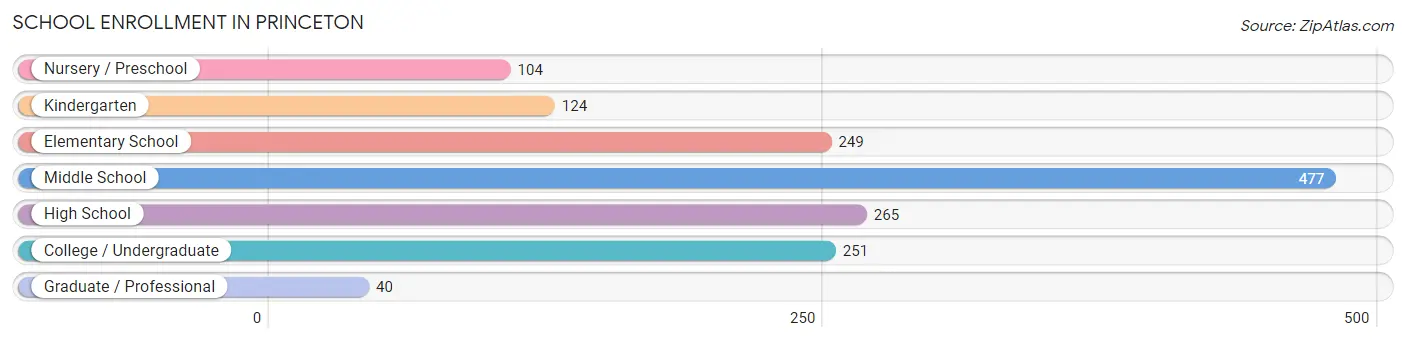
| School Level | # Students | % Students |
| Nursery / Preschool | 104 | 6.9% |
| Kindergarten | 124 | 8.2% |
| Elementary School | 249 | 16.5% |
| Middle School | 477 | 31.6% |
| High School | 265 | 17.5% |
| College / Undergraduate | 251 | 16.6% |
| Graduate / Professional | 40 | 2.6% |
| Total | 1,510 | 100.0% |
School Enrollment by Age by Funding Source in Princeton
Out of a total of 1,510 students who are enrolled in schools in Princeton, 347 (23.0%) attend a private institution, while the remaining 1,163 (77.0%) are enrolled in public schools. The age group of 35 years and over has the highest likelihood of being enrolled in private schools, with 9 (40.9% in the age bracket) enrolled. Conversely, the age group of 18 to 19 year olds has the lowest likelihood of being enrolled in a private school, with 111 (100.0% in the age bracket) attending a public institution.
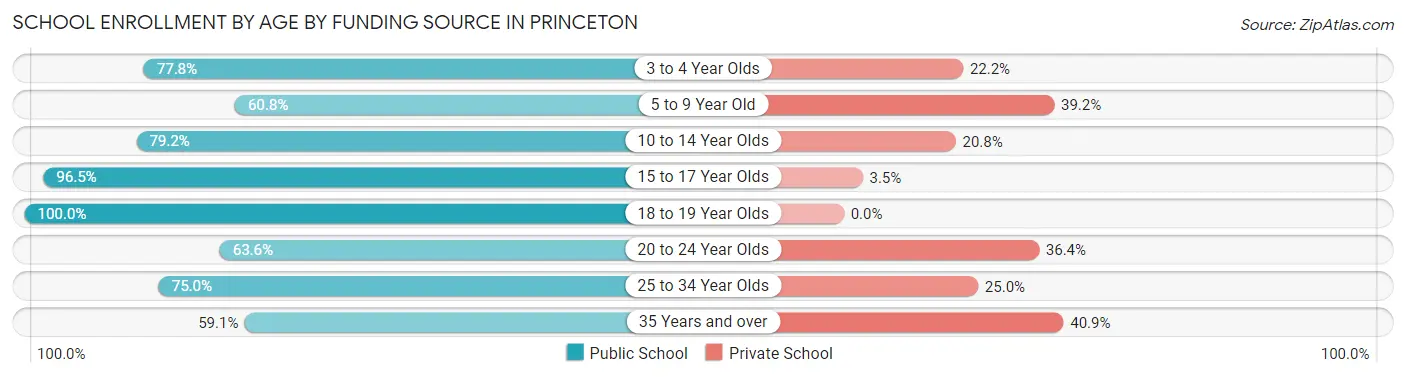
| Age Bracket | Public School | Private School |
| 3 to 4 Year Olds | 70 (77.8%) | 20 (22.2%) |
| 5 to 9 Year Old | 211 (60.8%) | 136 (39.2%) |
| 10 to 14 Year Olds | 452 (79.2%) | 119 (20.8%) |
| 15 to 17 Year Olds | 165 (96.5%) | 6 (3.5%) |
| 18 to 19 Year Olds | 111 (100.0%) | 0 (0.0%) |
| 20 to 24 Year Olds | 42 (63.6%) | 24 (36.4%) |
| 25 to 34 Year Olds | 99 (75.0%) | 33 (25.0%) |
| 35 Years and over | 13 (59.1%) | 9 (40.9%) |
| Total | 1,163 (77.0%) | 347 (23.0%) |
Educational Attainment by Field of Study in Princeton
Education (527 | 30.5%), business (177 | 10.2%), bio, nature & agricultural (144 | 8.3%), arts & humanities (126 | 7.3%), and psychology (122 | 7.1%) are the most common fields of study among 1,726 individuals in Princeton who have obtained a bachelor's degree or higher.
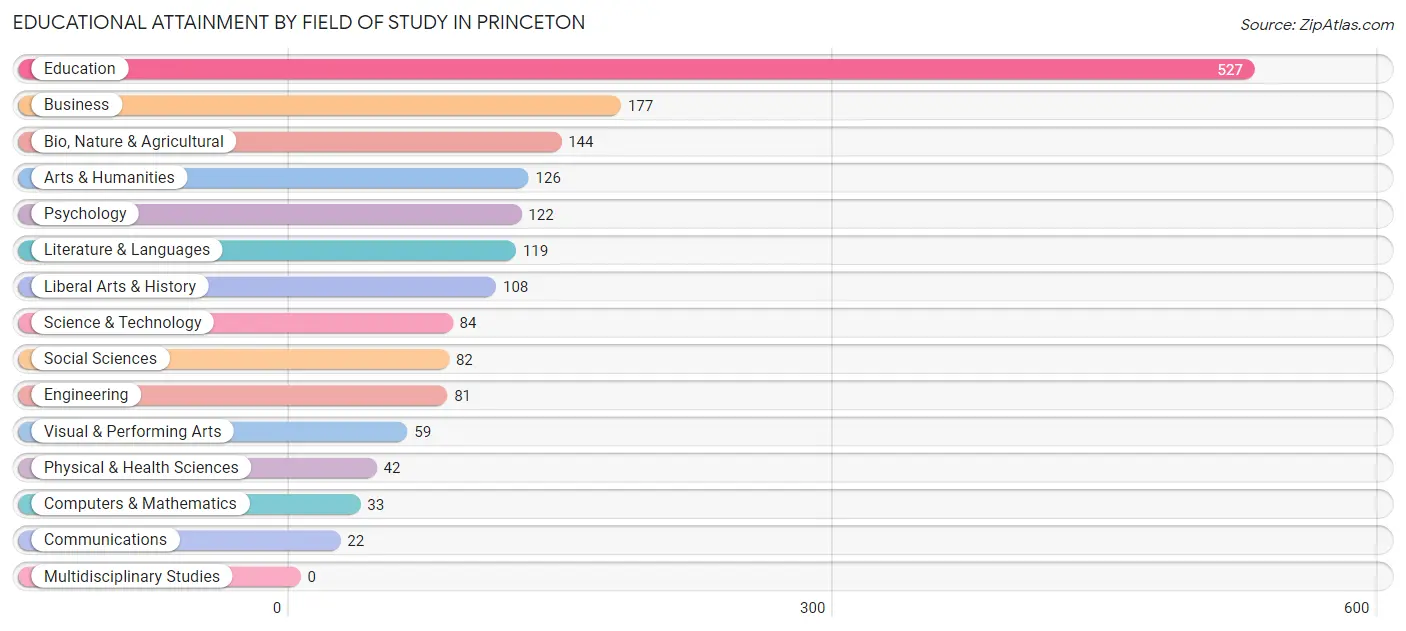
| Field of Study | # Graduates | % Graduates |
| Computers & Mathematics | 33 | 1.9% |
| Bio, Nature & Agricultural | 144 | 8.3% |
| Physical & Health Sciences | 42 | 2.4% |
| Psychology | 122 | 7.1% |
| Social Sciences | 82 | 4.8% |
| Engineering | 81 | 4.7% |
| Multidisciplinary Studies | 0 | 0.0% |
| Science & Technology | 84 | 4.9% |
| Business | 177 | 10.2% |
| Education | 527 | 30.5% |
| Literature & Languages | 119 | 6.9% |
| Liberal Arts & History | 108 | 6.3% |
| Visual & Performing Arts | 59 | 3.4% |
| Communications | 22 | 1.3% |
| Arts & Humanities | 126 | 7.3% |
| Total | 1,726 | 100.0% |
Transportation & Commute in Princeton
Vehicle Availability by Sex in Princeton
The most prevalent vehicle ownership categories in Princeton are males with 2 vehicles (858, accounting for 50.5%) and females with 2 vehicles (766, making up 52.6%).
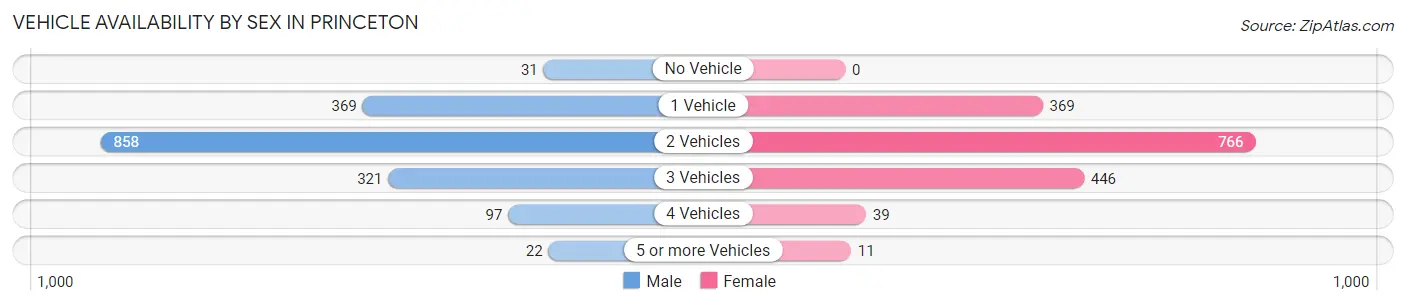
| Vehicles Available | Male | Female |
| No Vehicle | 31 (1.8%) | 0 (0.0%) |
| 1 Vehicle | 369 (21.7%) | 369 (22.6%) |
| 2 Vehicles | 858 (50.5%) | 766 (47.0%) |
| 3 Vehicles | 321 (18.9%) | 446 (27.4%) |
| 4 Vehicles | 97 (5.7%) | 39 (2.4%) |
| 5 or more Vehicles | 22 (1.3%) | 11 (0.7%) |
| Total | 1,698 (100.0%) | 1,631 (100.0%) |
Commute Time in Princeton
The most frequently occuring commute durations in Princeton are 5 to 9 minutes (1,091 commuters, 35.5%), 10 to 14 minutes (519 commuters, 16.9%), and 20 to 24 minutes (507 commuters, 16.5%).
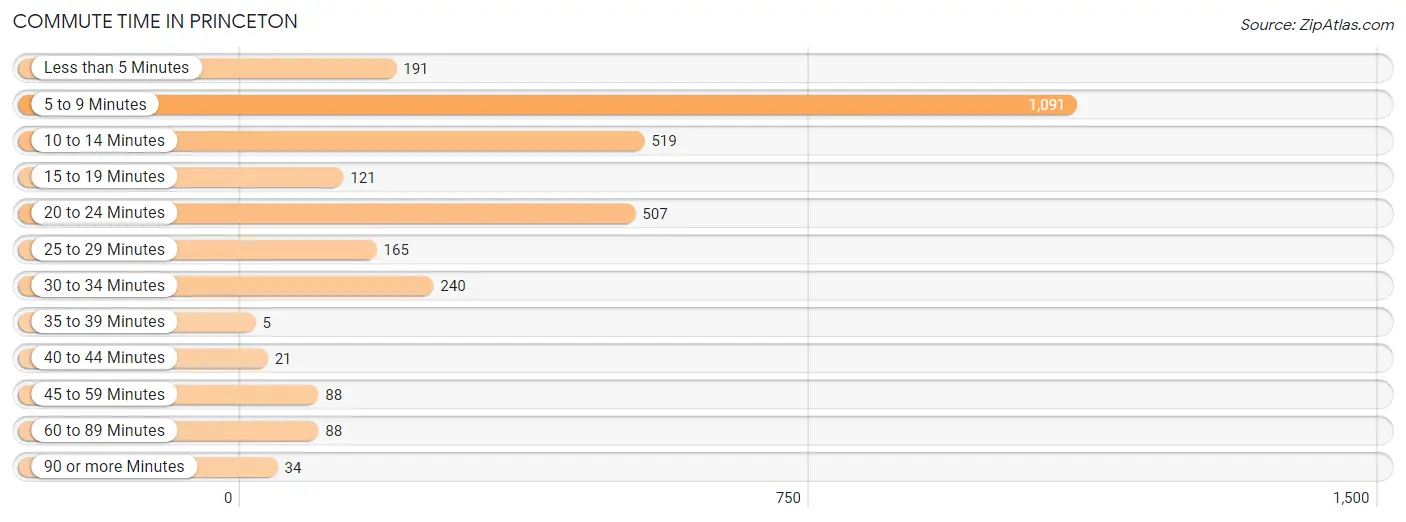
| Commute Time | # Commuters | % Commuters |
| Less than 5 Minutes | 191 | 6.2% |
| 5 to 9 Minutes | 1,091 | 35.5% |
| 10 to 14 Minutes | 519 | 16.9% |
| 15 to 19 Minutes | 121 | 3.9% |
| 20 to 24 Minutes | 507 | 16.5% |
| 25 to 29 Minutes | 165 | 5.4% |
| 30 to 34 Minutes | 240 | 7.8% |
| 35 to 39 Minutes | 5 | 0.2% |
| 40 to 44 Minutes | 21 | 0.7% |
| 45 to 59 Minutes | 88 | 2.9% |
| 60 to 89 Minutes | 88 | 2.9% |
| 90 or more Minutes | 34 | 1.1% |
Commute Time by Sex in Princeton
The most common commute times in Princeton are 5 to 9 minutes (444 commuters, 29.8%) for males and 5 to 9 minutes (647 commuters, 40.9%) for females.
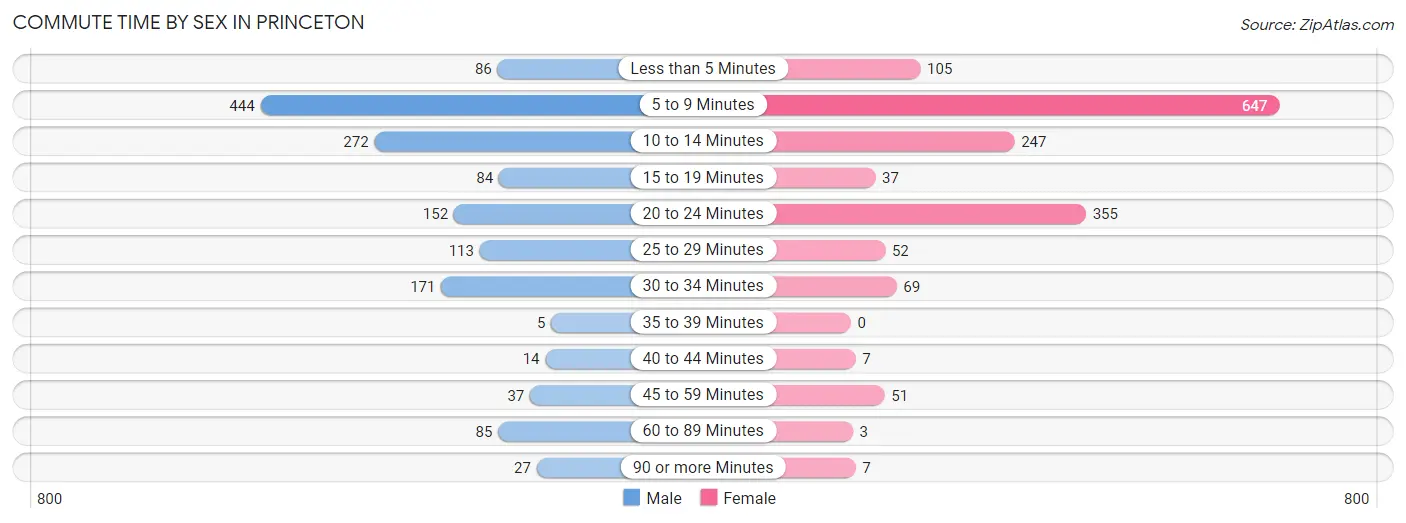
| Commute Time | Male | Female |
| Less than 5 Minutes | 86 (5.8%) | 105 (6.7%) |
| 5 to 9 Minutes | 444 (29.8%) | 647 (40.9%) |
| 10 to 14 Minutes | 272 (18.3%) | 247 (15.6%) |
| 15 to 19 Minutes | 84 (5.6%) | 37 (2.3%) |
| 20 to 24 Minutes | 152 (10.2%) | 355 (22.5%) |
| 25 to 29 Minutes | 113 (7.6%) | 52 (3.3%) |
| 30 to 34 Minutes | 171 (11.5%) | 69 (4.4%) |
| 35 to 39 Minutes | 5 (0.3%) | 0 (0.0%) |
| 40 to 44 Minutes | 14 (0.9%) | 7 (0.4%) |
| 45 to 59 Minutes | 37 (2.5%) | 51 (3.2%) |
| 60 to 89 Minutes | 85 (5.7%) | 3 (0.2%) |
| 90 or more Minutes | 27 (1.8%) | 7 (0.4%) |
Time of Departure to Work by Sex in Princeton
The most frequent times of departure to work in Princeton are 7:00 AM to 7:29 AM (262, 17.6%) for males and 7:30 AM to 7:59 AM (331, 20.9%) for females.
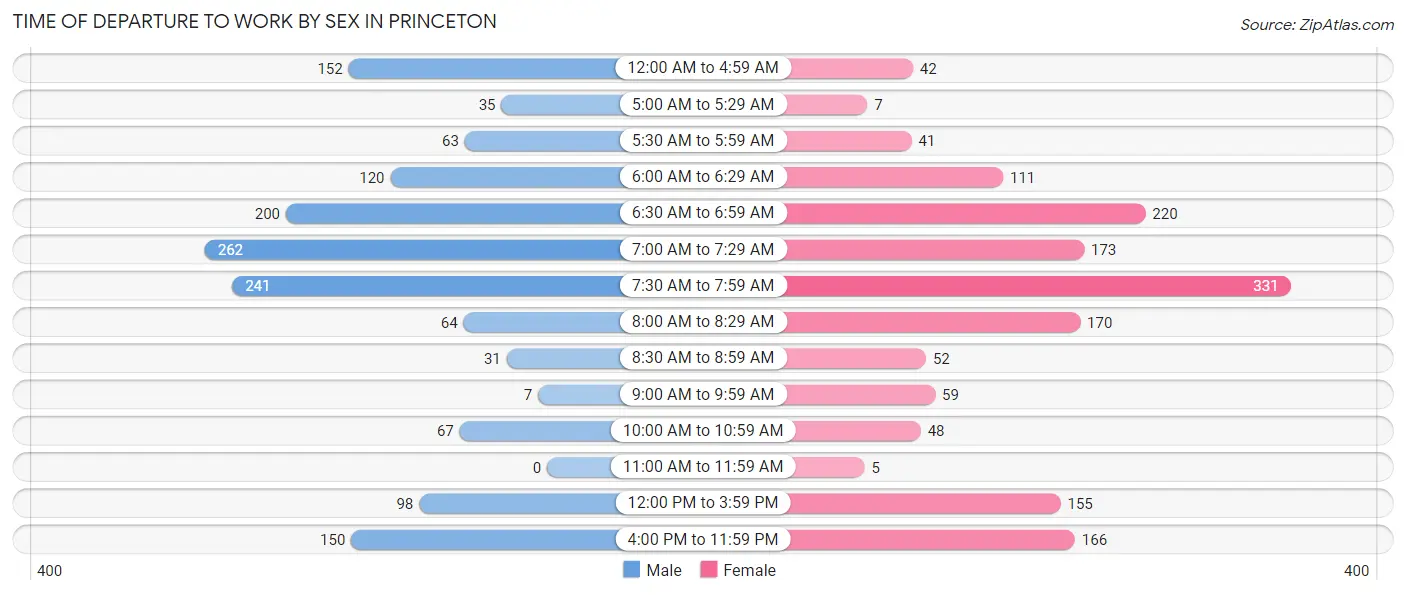
| Time of Departure | Male | Female |
| 12:00 AM to 4:59 AM | 152 (10.2%) | 42 (2.7%) |
| 5:00 AM to 5:29 AM | 35 (2.4%) | 7 (0.4%) |
| 5:30 AM to 5:59 AM | 63 (4.2%) | 41 (2.6%) |
| 6:00 AM to 6:29 AM | 120 (8.1%) | 111 (7.0%) |
| 6:30 AM to 6:59 AM | 200 (13.4%) | 220 (13.9%) |
| 7:00 AM to 7:29 AM | 262 (17.6%) | 173 (11.0%) |
| 7:30 AM to 7:59 AM | 241 (16.2%) | 331 (20.9%) |
| 8:00 AM to 8:29 AM | 64 (4.3%) | 170 (10.8%) |
| 8:30 AM to 8:59 AM | 31 (2.1%) | 52 (3.3%) |
| 9:00 AM to 9:59 AM | 7 (0.5%) | 59 (3.7%) |
| 10:00 AM to 10:59 AM | 67 (4.5%) | 48 (3.0%) |
| 11:00 AM to 11:59 AM | 0 (0.0%) | 5 (0.3%) |
| 12:00 PM to 3:59 PM | 98 (6.6%) | 155 (9.8%) |
| 4:00 PM to 11:59 PM | 150 (10.1%) | 166 (10.5%) |
| Total | 1,490 (100.0%) | 1,580 (100.0%) |
Housing Occupancy in Princeton
Occupancy by Ownership in Princeton
Of the total 3,488 dwellings in Princeton, owner-occupied units account for 2,495 (71.5%), while renter-occupied units make up 993 (28.5%).
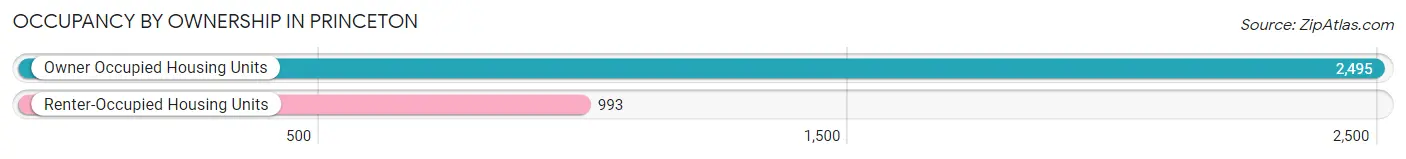
| Occupancy | # Housing Units | % Housing Units |
| Owner Occupied Housing Units | 2,495 | 71.5% |
| Renter-Occupied Housing Units | 993 | 28.5% |
| Total Occupied Housing Units | 3,488 | 100.0% |
Occupancy by Household Size in Princeton
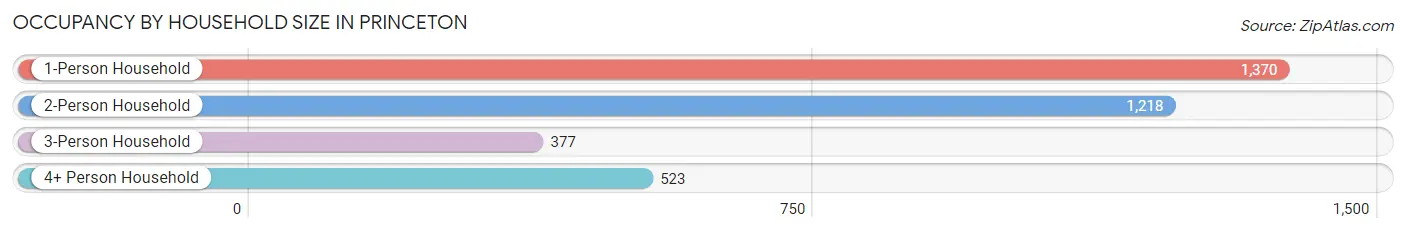
| Household Size | # Housing Units | % Housing Units |
| 1-Person Household | 1,370 | 39.3% |
| 2-Person Household | 1,218 | 34.9% |
| 3-Person Household | 377 | 10.8% |
| 4+ Person Household | 523 | 15.0% |
| Total Housing Units | 3,488 | 100.0% |
Occupancy by Ownership by Household Size in Princeton
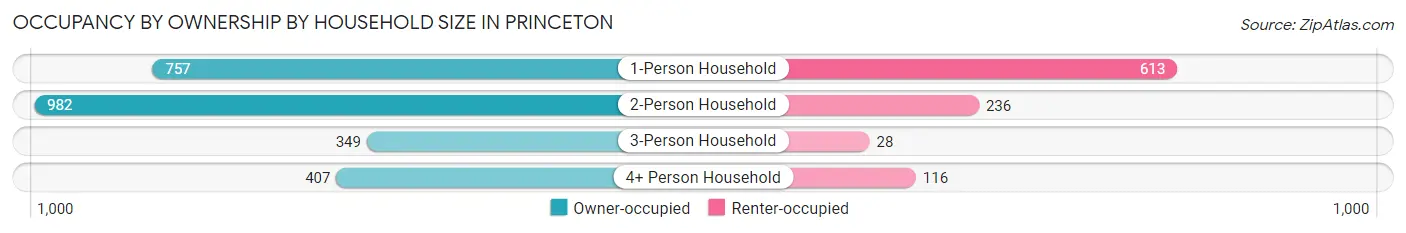
| Household Size | Owner-occupied | Renter-occupied |
| 1-Person Household | 757 (55.3%) | 613 (44.7%) |
| 2-Person Household | 982 (80.6%) | 236 (19.4%) |
| 3-Person Household | 349 (92.6%) | 28 (7.4%) |
| 4+ Person Household | 407 (77.8%) | 116 (22.2%) |
| Total Housing Units | 2,495 (71.5%) | 993 (28.5%) |
Occupancy by Educational Attainment in Princeton
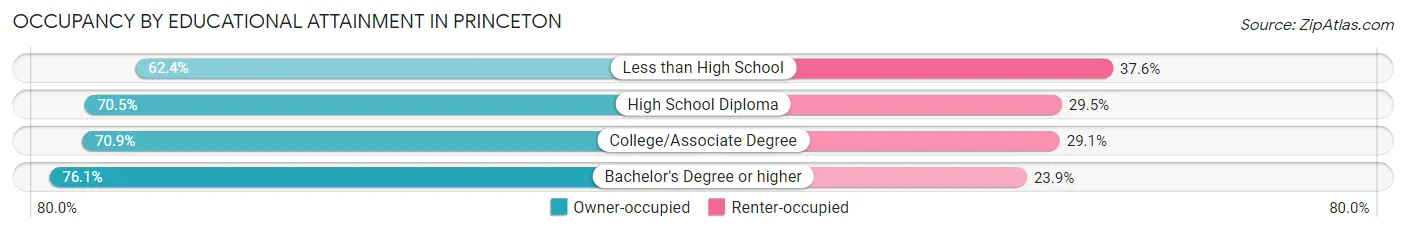
| Household Size | Owner-occupied | Renter-occupied |
| Less than High School | 196 (62.4%) | 118 (37.6%) |
| High School Diploma | 723 (70.5%) | 302 (29.5%) |
| College/Associate Degree | 803 (70.9%) | 330 (29.1%) |
| Bachelor's Degree or higher | 773 (76.1%) | 243 (23.9%) |
Occupancy by Age of Householder in Princeton
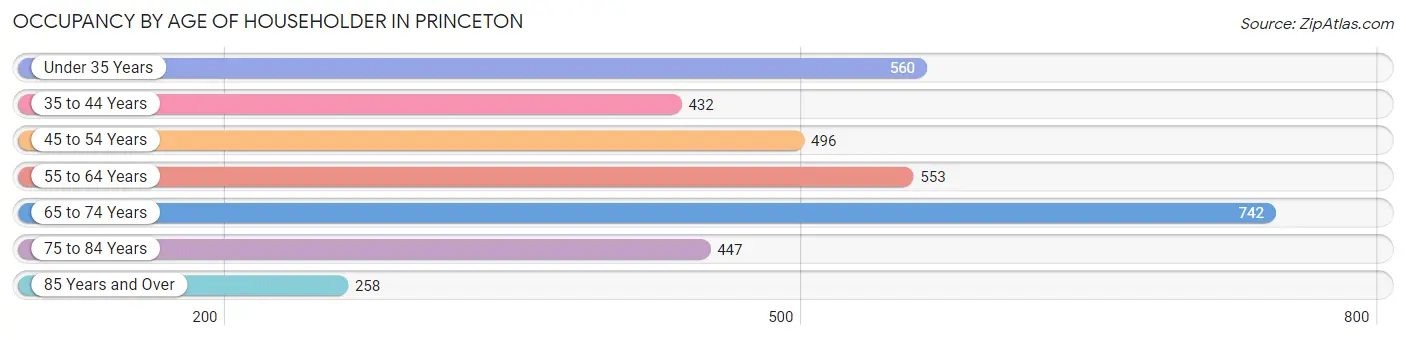
| Age Bracket | # Households | % Households |
| Under 35 Years | 560 | 16.1% |
| 35 to 44 Years | 432 | 12.4% |
| 45 to 54 Years | 496 | 14.2% |
| 55 to 64 Years | 553 | 15.9% |
| 65 to 74 Years | 742 | 21.3% |
| 75 to 84 Years | 447 | 12.8% |
| 85 Years and Over | 258 | 7.4% |
| Total | 3,488 | 100.0% |
Housing Finances in Princeton
Median Income by Occupancy in Princeton
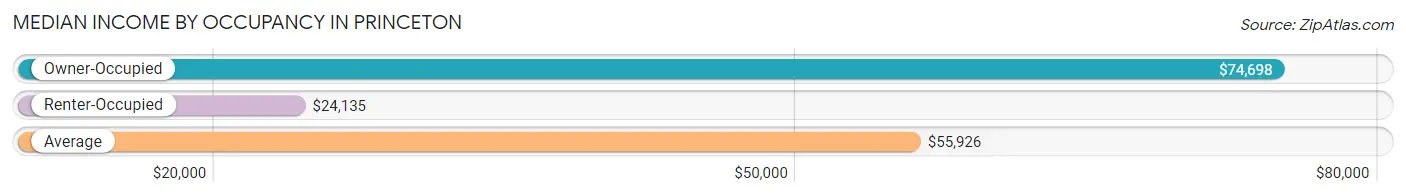
| Occupancy Type | # Households | Median Income |
| Owner-Occupied | 2,495 (71.5%) | $74,698 |
| Renter-Occupied | 993 (28.5%) | $24,135 |
| Average | 3,488 (100.0%) | $55,926 |
Occupancy by Householder Income Bracket in Princeton
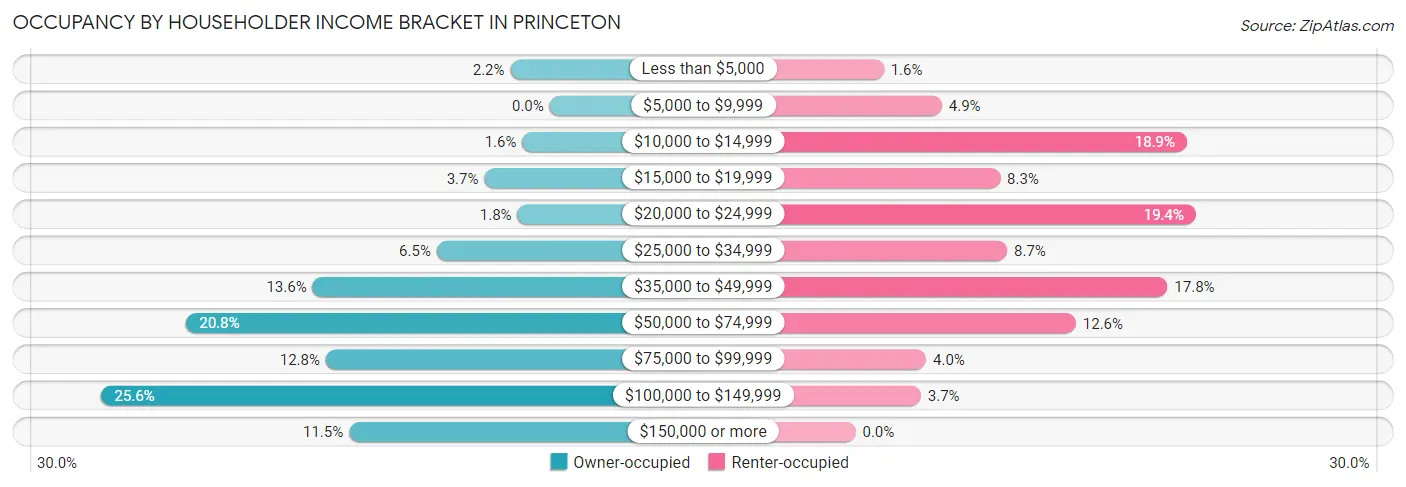
| Income Bracket | Owner-occupied | Renter-occupied |
| Less than $5,000 | 56 (2.2%) | 16 (1.6%) |
| $5,000 to $9,999 | 0 (0.0%) | 49 (4.9%) |
| $10,000 to $14,999 | 39 (1.6%) | 188 (18.9%) |
| $15,000 to $19,999 | 93 (3.7%) | 82 (8.3%) |
| $20,000 to $24,999 | 46 (1.8%) | 193 (19.4%) |
| $25,000 to $34,999 | 161 (6.5%) | 86 (8.7%) |
| $35,000 to $49,999 | 338 (13.6%) | 177 (17.8%) |
| $50,000 to $74,999 | 518 (20.8%) | 125 (12.6%) |
| $75,000 to $99,999 | 319 (12.8%) | 40 (4.0%) |
| $100,000 to $149,999 | 639 (25.6%) | 37 (3.7%) |
| $150,000 or more | 286 (11.5%) | 0 (0.0%) |
| Total | 2,495 (100.0%) | 993 (100.0%) |
Monthly Housing Cost Tiers in Princeton
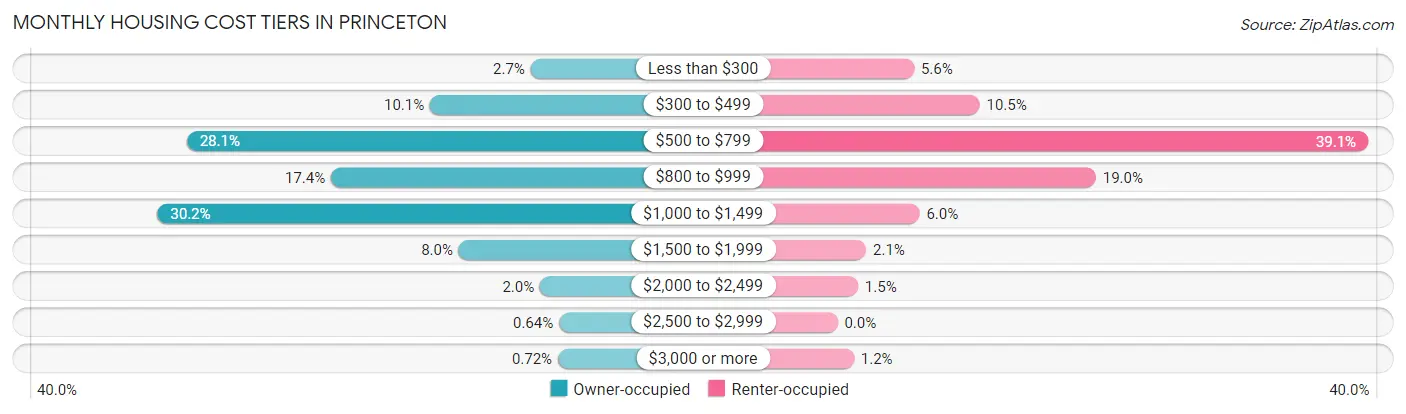
| Monthly Cost | Owner-occupied | Renter-occupied |
| Less than $300 | 68 (2.7%) | 56 (5.6%) |
| $300 to $499 | 253 (10.1%) | 104 (10.5%) |
| $500 to $799 | 700 (28.1%) | 388 (39.1%) |
| $800 to $999 | 435 (17.4%) | 189 (19.0%) |
| $1,000 to $1,499 | 754 (30.2%) | 60 (6.0%) |
| $1,500 to $1,999 | 200 (8.0%) | 21 (2.1%) |
| $2,000 to $2,499 | 51 (2.0%) | 15 (1.5%) |
| $2,500 to $2,999 | 16 (0.6%) | 0 (0.0%) |
| $3,000 or more | 18 (0.7%) | 12 (1.2%) |
| Total | 2,495 (100.0%) | 993 (100.0%) |
Physical Housing Characteristics in Princeton
Housing Structures in Princeton
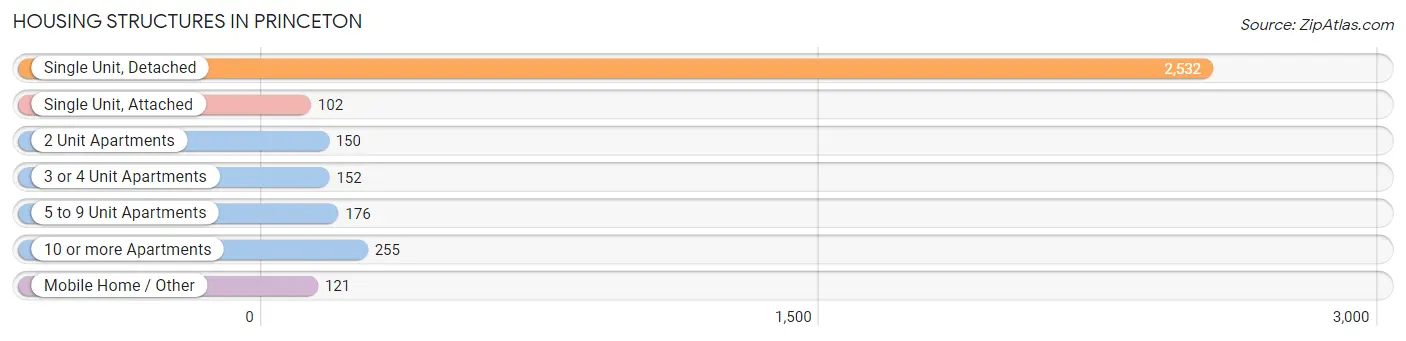
| Structure Type | # Housing Units | % Housing Units |
| Single Unit, Detached | 2,532 | 72.6% |
| Single Unit, Attached | 102 | 2.9% |
| 2 Unit Apartments | 150 | 4.3% |
| 3 or 4 Unit Apartments | 152 | 4.4% |
| 5 to 9 Unit Apartments | 176 | 5.1% |
| 10 or more Apartments | 255 | 7.3% |
| Mobile Home / Other | 121 | 3.5% |
| Total | 3,488 | 100.0% |
Housing Structures by Occupancy in Princeton
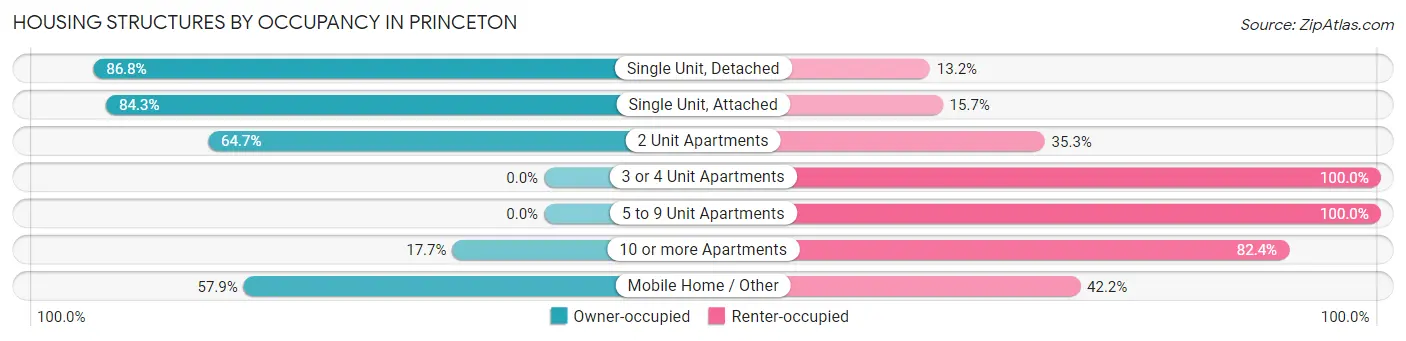
| Structure Type | Owner-occupied | Renter-occupied |
| Single Unit, Detached | 2,197 (86.8%) | 335 (13.2%) |
| Single Unit, Attached | 86 (84.3%) | 16 (15.7%) |
| 2 Unit Apartments | 97 (64.7%) | 53 (35.3%) |
| 3 or 4 Unit Apartments | 0 (0.0%) | 152 (100.0%) |
| 5 to 9 Unit Apartments | 0 (0.0%) | 176 (100.0%) |
| 10 or more Apartments | 45 (17.6%) | 210 (82.4%) |
| Mobile Home / Other | 70 (57.9%) | 51 (42.1%) |
| Total | 2,495 (71.5%) | 993 (28.5%) |
Housing Structures by Number of Rooms in Princeton
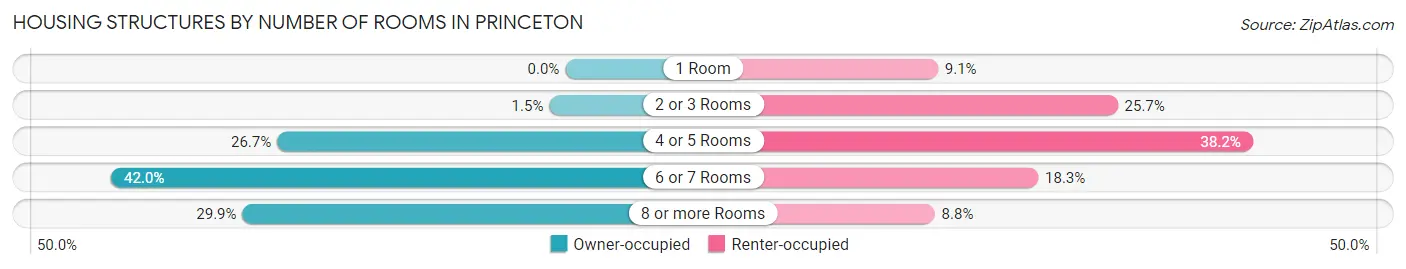
| Number of Rooms | Owner-occupied | Renter-occupied |
| 1 Room | 0 (0.0%) | 90 (9.1%) |
| 2 or 3 Rooms | 37 (1.5%) | 255 (25.7%) |
| 4 or 5 Rooms | 665 (26.7%) | 379 (38.2%) |
| 6 or 7 Rooms | 1,048 (42.0%) | 182 (18.3%) |
| 8 or more Rooms | 745 (29.9%) | 87 (8.8%) |
| Total | 2,495 (100.0%) | 993 (100.0%) |
Housing Structure by Heating Type in Princeton
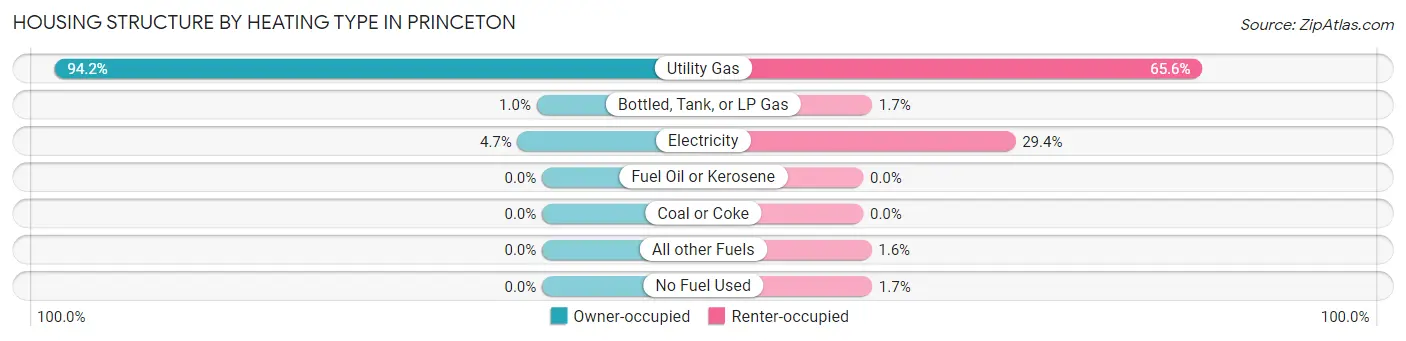
| Heating Type | Owner-occupied | Renter-occupied |
| Utility Gas | 2,351 (94.2%) | 651 (65.6%) |
| Bottled, Tank, or LP Gas | 26 (1.0%) | 17 (1.7%) |
| Electricity | 118 (4.7%) | 292 (29.4%) |
| Fuel Oil or Kerosene | 0 (0.0%) | 0 (0.0%) |
| Coal or Coke | 0 (0.0%) | 0 (0.0%) |
| All other Fuels | 0 (0.0%) | 16 (1.6%) |
| No Fuel Used | 0 (0.0%) | 17 (1.7%) |
| Total | 2,495 (100.0%) | 993 (100.0%) |
Household Vehicle Usage in Princeton
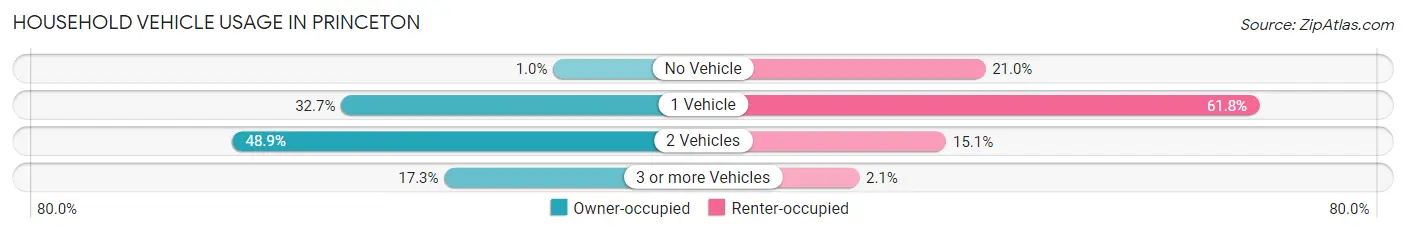
| Vehicles per Household | Owner-occupied | Renter-occupied |
| No Vehicle | 26 (1.0%) | 208 (20.9%) |
| 1 Vehicle | 816 (32.7%) | 614 (61.8%) |
| 2 Vehicles | 1,221 (48.9%) | 150 (15.1%) |
| 3 or more Vehicles | 432 (17.3%) | 21 (2.1%) |
| Total | 2,495 (100.0%) | 993 (100.0%) |
Real Estate & Mortgages in Princeton
Real Estate and Mortgage Overview in Princeton
| Characteristic | Without Mortgage | With Mortgage |
| Housing Units | 1,012 | 1,483 |
| Median Property Value | $157,400 | $126,100 |
| Median Household Income | $58,654 | $136 |
| Monthly Housing Costs | $591 | $18 |
| Real Estate Taxes | $2,886 | $7 |
Property Value by Mortgage Status in Princeton
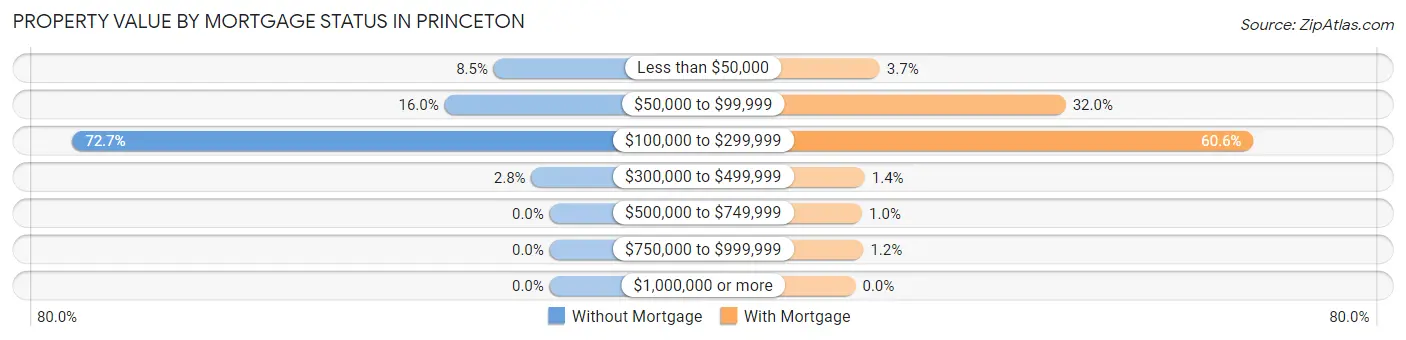
| Property Value | Without Mortgage | With Mortgage |
| Less than $50,000 | 86 (8.5%) | 55 (3.7%) |
| $50,000 to $99,999 | 162 (16.0%) | 475 (32.0%) |
| $100,000 to $299,999 | 736 (72.7%) | 899 (60.6%) |
| $300,000 to $499,999 | 28 (2.8%) | 21 (1.4%) |
| $500,000 to $749,999 | 0 (0.0%) | 15 (1.0%) |
| $750,000 to $999,999 | 0 (0.0%) | 18 (1.2%) |
| $1,000,000 or more | 0 (0.0%) | 0 (0.0%) |
| Total | 1,012 (100.0%) | 1,483 (100.0%) |
Household Income by Mortgage Status in Princeton
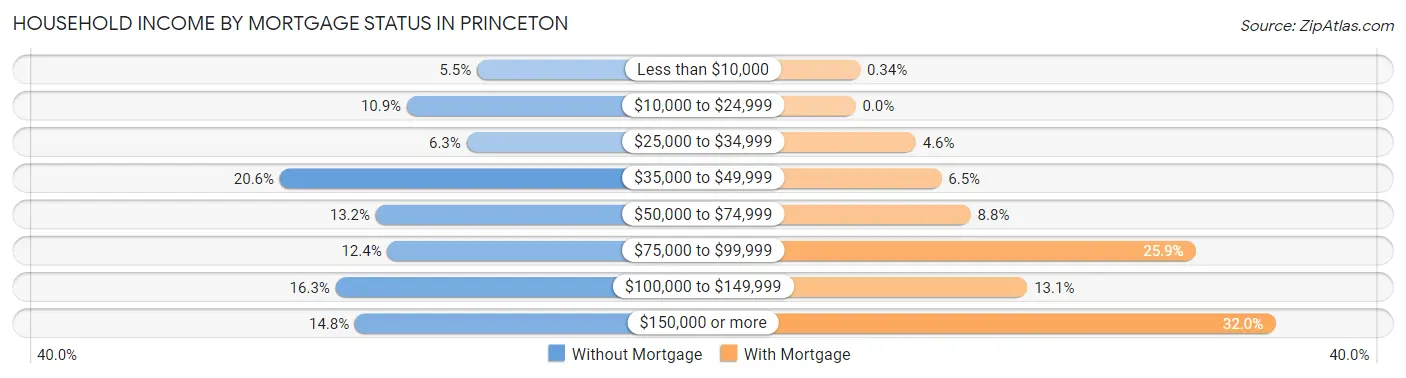
| Household Income | Without Mortgage | With Mortgage |
| Less than $10,000 | 56 (5.5%) | 5 (0.3%) |
| $10,000 to $24,999 | 110 (10.9%) | 0 (0.0%) |
| $25,000 to $34,999 | 64 (6.3%) | 68 (4.6%) |
| $35,000 to $49,999 | 208 (20.5%) | 97 (6.5%) |
| $50,000 to $74,999 | 134 (13.2%) | 130 (8.8%) |
| $75,000 to $99,999 | 125 (12.3%) | 384 (25.9%) |
| $100,000 to $149,999 | 165 (16.3%) | 194 (13.1%) |
| $150,000 or more | 150 (14.8%) | 474 (32.0%) |
| Total | 1,012 (100.0%) | 1,483 (100.0%) |
Property Value to Household Income Ratio in Princeton
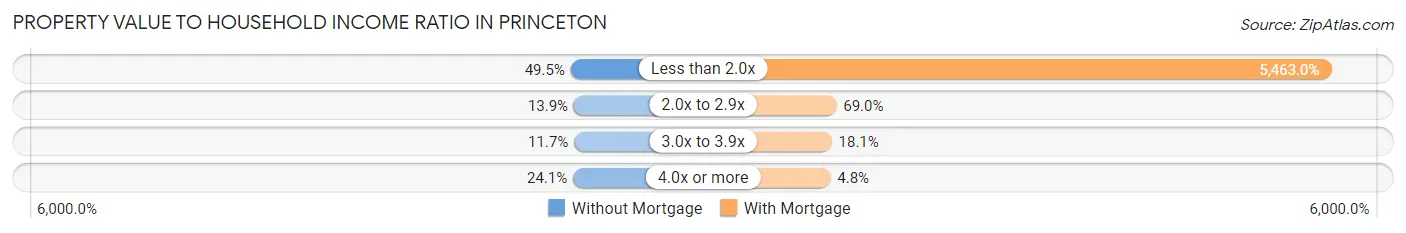
| Value-to-Income Ratio | Without Mortgage | With Mortgage |
| Less than 2.0x | 501 (49.5%) | 81,016 (5,463.0%) |
| 2.0x to 2.9x | 141 (13.9%) | 1,023 (69.0%) |
| 3.0x to 3.9x | 118 (11.7%) | 269 (18.1%) |
| 4.0x or more | 244 (24.1%) | 71 (4.8%) |
| Total | 1,012 (100.0%) | 1,483 (100.0%) |
Real Estate Taxes by Mortgage Status in Princeton
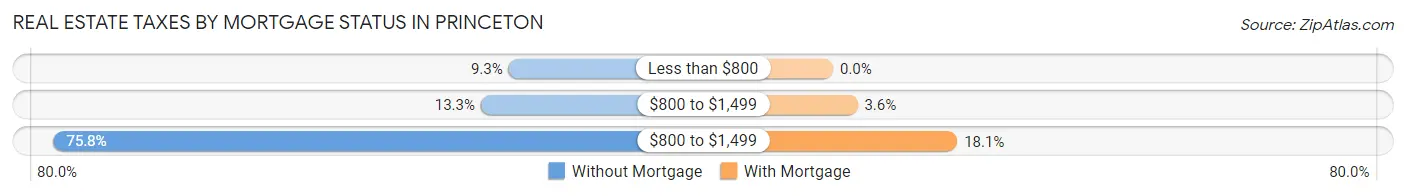
| Property Taxes | Without Mortgage | With Mortgage |
| Less than $800 | 94 (9.3%) | 0 (0.0%) |
| $800 to $1,499 | 135 (13.3%) | 53 (3.6%) |
| $800 to $1,499 | 767 (75.8%) | 269 (18.1%) |
| Total | 1,012 (100.0%) | 1,483 (100.0%) |
Health & Disability in Princeton
Health Insurance Coverage by Age in Princeton
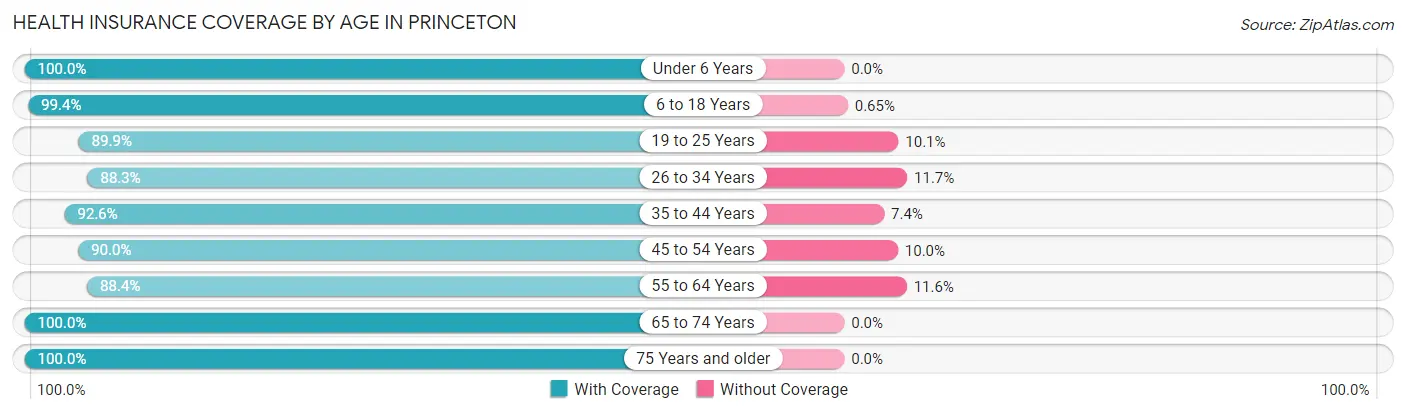
| Age Bracket | With Coverage | Without Coverage |
| Under 6 Years | 507 (100.0%) | 0 (0.0%) |
| 6 to 18 Years | 1,077 (99.4%) | 7 (0.6%) |
| 19 to 25 Years | 473 (89.9%) | 53 (10.1%) |
| 26 to 34 Years | 867 (88.3%) | 115 (11.7%) |
| 35 to 44 Years | 624 (92.6%) | 50 (7.4%) |
| 45 to 54 Years | 766 (90.0%) | 85 (10.0%) |
| 55 to 64 Years | 843 (88.4%) | 111 (11.6%) |
| 65 to 74 Years | 1,040 (100.0%) | 0 (0.0%) |
| 75 Years and older | 907 (100.0%) | 0 (0.0%) |
| Total | 7,104 (94.4%) | 421 (5.6%) |
Health Insurance Coverage by Citizenship Status in Princeton
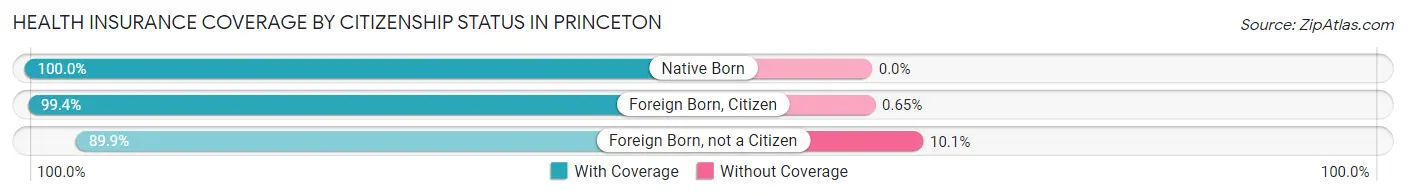
| Citizenship Status | With Coverage | Without Coverage |
| Native Born | 507 (100.0%) | 0 (0.0%) |
| Foreign Born, Citizen | 1,077 (99.4%) | 7 (0.6%) |
| Foreign Born, not a Citizen | 473 (89.9%) | 53 (10.1%) |
Health Insurance Coverage by Household Income in Princeton
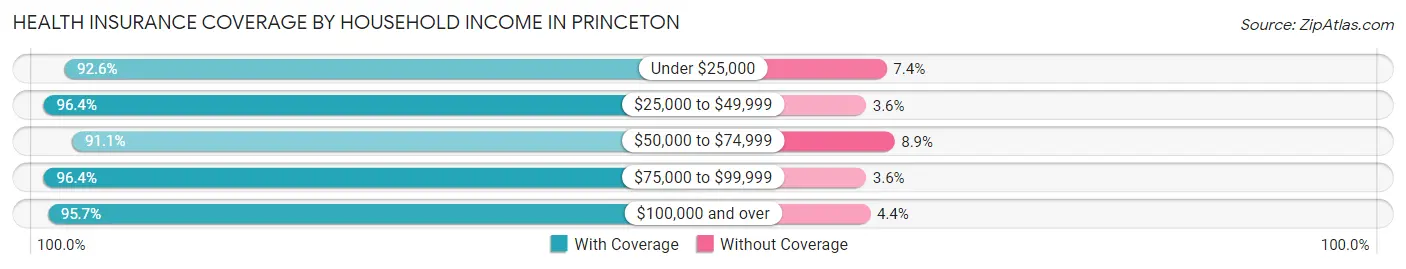
| Household Income | With Coverage | Without Coverage |
| Under $25,000 | 1,160 (92.6%) | 93 (7.4%) |
| $25,000 to $49,999 | 1,246 (96.4%) | 46 (3.6%) |
| $50,000 to $74,999 | 1,444 (91.1%) | 141 (8.9%) |
| $75,000 to $99,999 | 756 (96.4%) | 28 (3.6%) |
| $100,000 and over | 2,484 (95.7%) | 113 (4.3%) |
Public vs Private Health Insurance Coverage by Age in Princeton
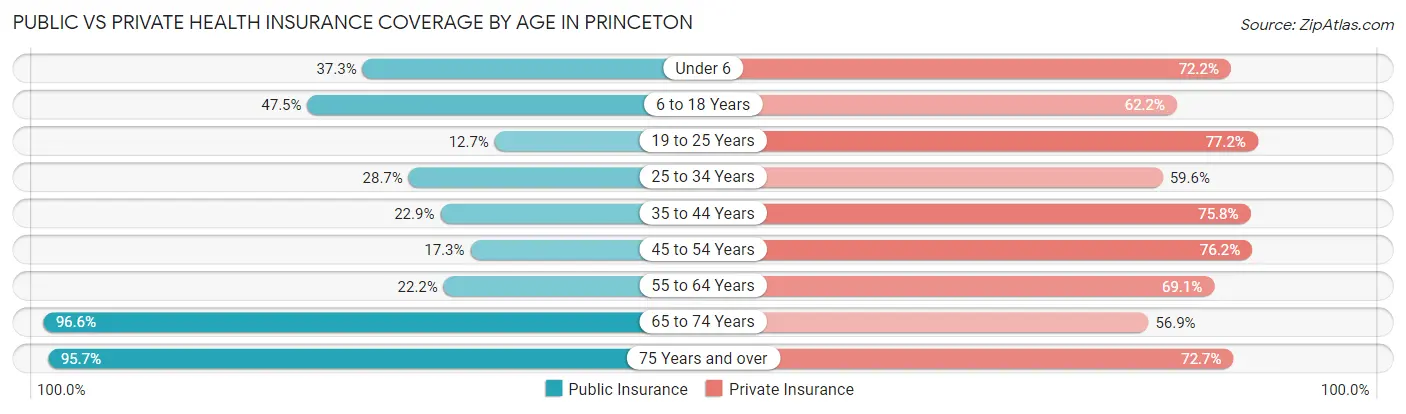
| Age Bracket | Public Insurance | Private Insurance |
| Under 6 | 189 (37.3%) | 366 (72.2%) |
| 6 to 18 Years | 515 (47.5%) | 674 (62.2%) |
| 19 to 25 Years | 67 (12.7%) | 406 (77.2%) |
| 25 to 34 Years | 282 (28.7%) | 585 (59.6%) |
| 35 to 44 Years | 154 (22.9%) | 511 (75.8%) |
| 45 to 54 Years | 147 (17.3%) | 648 (76.1%) |
| 55 to 64 Years | 212 (22.2%) | 659 (69.1%) |
| 65 to 74 Years | 1,005 (96.6%) | 592 (56.9%) |
| 75 Years and over | 868 (95.7%) | 659 (72.7%) |
| Total | 3,439 (45.7%) | 5,100 (67.8%) |
Disability Status by Sex by Age in Princeton
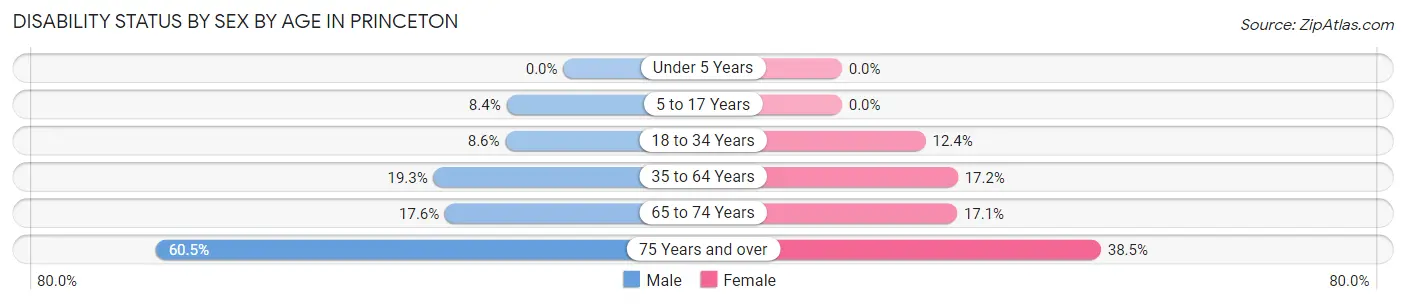
| Age Bracket | Male | Female |
| Under 5 Years | 0 (0.0%) | 0 (0.0%) |
| 5 to 17 Years | 52 (8.4%) | 0 (0.0%) |
| 18 to 34 Years | 64 (8.6%) | 109 (12.4%) |
| 35 to 64 Years | 226 (19.3%) | 225 (17.2%) |
| 65 to 74 Years | 82 (17.6%) | 98 (17.1%) |
| 75 Years and over | 187 (60.5%) | 230 (38.5%) |
Disability Class by Sex by Age in Princeton
Disability Class: Hearing Difficulty
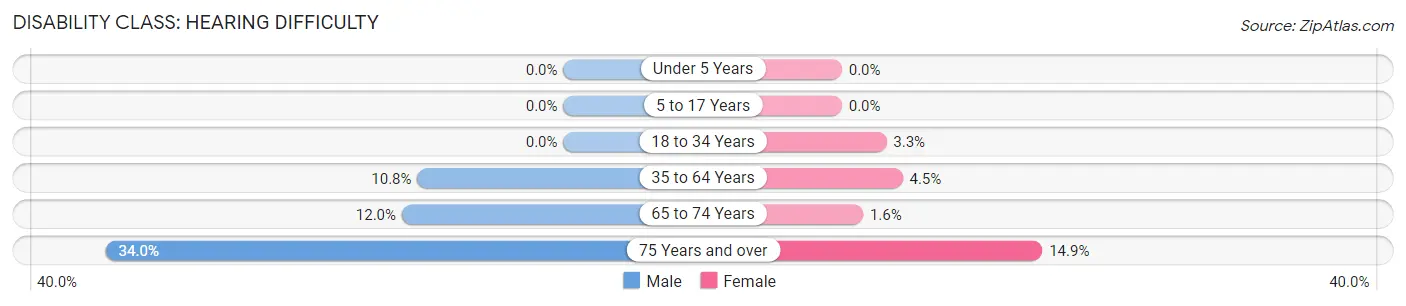
| Age Bracket | Male | Female |
| Under 5 Years | 0 (0.0%) | 0 (0.0%) |
| 5 to 17 Years | 0 (0.0%) | 0 (0.0%) |
| 18 to 34 Years | 0 (0.0%) | 29 (3.3%) |
| 35 to 64 Years | 127 (10.8%) | 59 (4.5%) |
| 65 to 74 Years | 56 (12.0%) | 9 (1.6%) |
| 75 Years and over | 105 (34.0%) | 89 (14.9%) |
Disability Class: Vision Difficulty
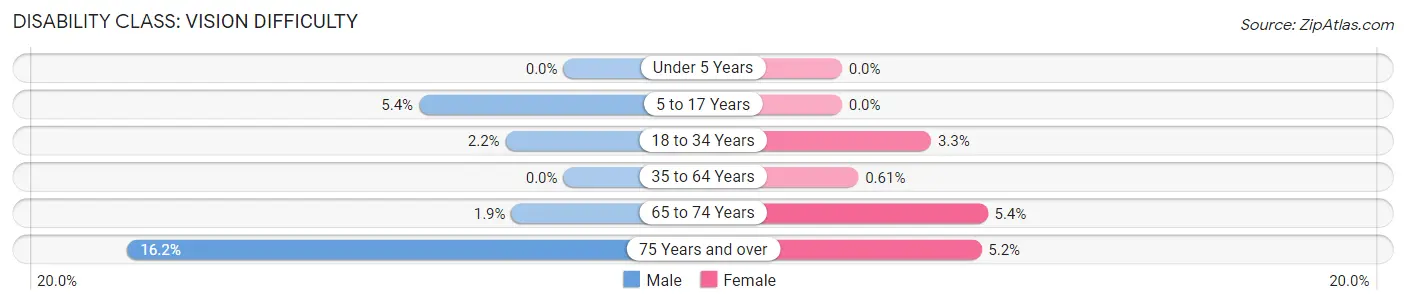
| Age Bracket | Male | Female |
| Under 5 Years | 0 (0.0%) | 0 (0.0%) |
| 5 to 17 Years | 33 (5.4%) | 0 (0.0%) |
| 18 to 34 Years | 16 (2.1%) | 29 (3.3%) |
| 35 to 64 Years | 0 (0.0%) | 8 (0.6%) |
| 65 to 74 Years | 9 (1.9%) | 31 (5.4%) |
| 75 Years and over | 50 (16.2%) | 31 (5.2%) |
Disability Class: Cognitive Difficulty
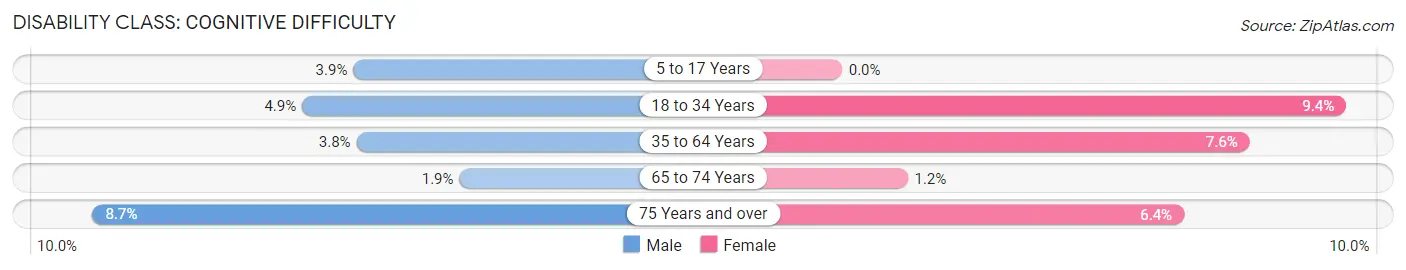
| Age Bracket | Male | Female |
| 5 to 17 Years | 24 (3.9%) | 0 (0.0%) |
| 18 to 34 Years | 36 (4.9%) | 82 (9.4%) |
| 35 to 64 Years | 45 (3.8%) | 99 (7.6%) |
| 65 to 74 Years | 9 (1.9%) | 7 (1.2%) |
| 75 Years and over | 27 (8.7%) | 38 (6.4%) |
Disability Class: Ambulatory Difficulty
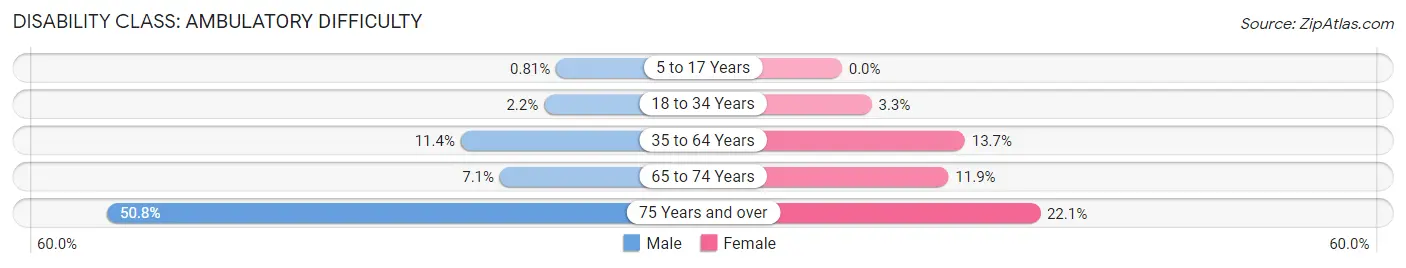
| Age Bracket | Male | Female |
| 5 to 17 Years | 5 (0.8%) | 0 (0.0%) |
| 18 to 34 Years | 16 (2.1%) | 29 (3.3%) |
| 35 to 64 Years | 134 (11.4%) | 179 (13.7%) |
| 65 to 74 Years | 33 (7.1%) | 68 (11.9%) |
| 75 Years and over | 157 (50.8%) | 132 (22.1%) |
Disability Class: Self-Care Difficulty
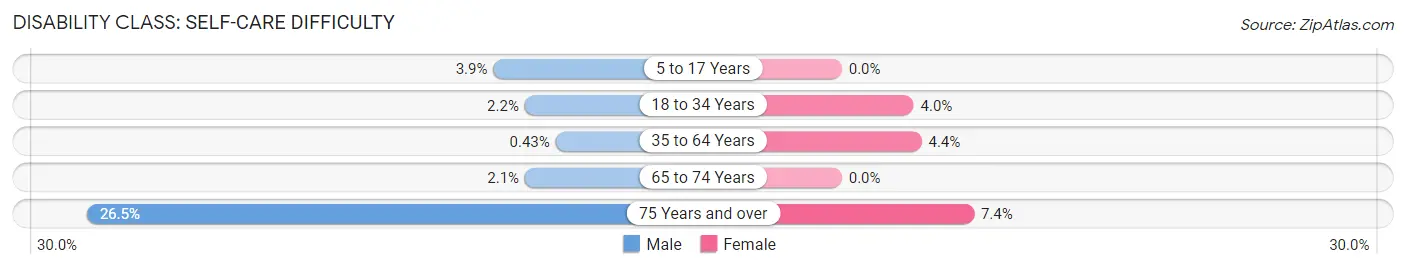
| Age Bracket | Male | Female |
| 5 to 17 Years | 24 (3.9%) | 0 (0.0%) |
| 18 to 34 Years | 16 (2.1%) | 35 (4.0%) |
| 35 to 64 Years | 5 (0.4%) | 58 (4.4%) |
| 65 to 74 Years | 10 (2.1%) | 0 (0.0%) |
| 75 Years and over | 82 (26.5%) | 44 (7.4%) |
Technology Access in Princeton
Computing Device Access in Princeton
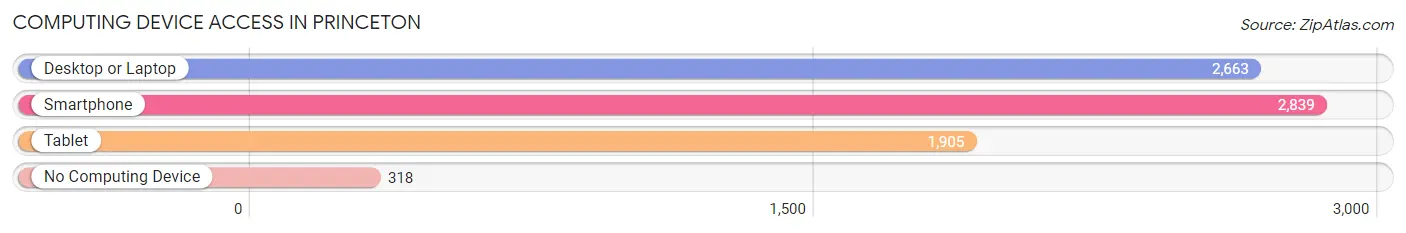
| Device Type | # Households | % Households |
| Desktop or Laptop | 2,663 | 76.3% |
| Smartphone | 2,839 | 81.4% |
| Tablet | 1,905 | 54.6% |
| No Computing Device | 318 | 9.1% |
| Total | 3,488 | 100.0% |
Internet Access in Princeton
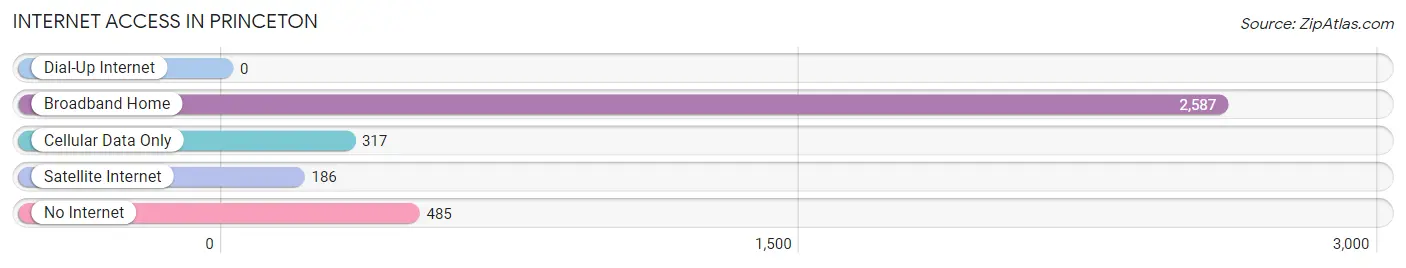
| Internet Type | # Households | % Households |
| Dial-Up Internet | 0 | 0.0% |
| Broadband Home | 2,587 | 74.2% |
| Cellular Data Only | 317 | 9.1% |
| Satellite Internet | 186 | 5.3% |
| No Internet | 485 | 13.9% |
| Total | 3,488 | 100.0% |
Princeton Summary
Princeton, Illinois is a small city located in Bureau County, Illinois. It is situated on the banks of the Illinois River, approximately 90 miles southwest of Chicago. The city has a population of 8,631 as of the 2010 census, making it the largest city in Bureau County.
History
The area that is now Princeton was first settled in 1834 by a group of settlers from New York. The settlement was originally known as “The Rapids” due to its location on the Illinois River. In 1837, the settlement was renamed Princeton after Princeton, New Jersey. The city was officially incorporated in 1851.
In the late 19th century, Princeton was a major hub for the railroad industry. The city was home to several major railroads, including the Chicago, Burlington and Quincy Railroad, the Chicago and North Western Railway, and the Illinois Central Railroad. The railroads brought a great deal of economic prosperity to the city, and it quickly became a major center for industry and commerce.
Geography
Princeton is located in the northern part of Bureau County, Illinois. It is situated on the banks of the Illinois River, approximately 90 miles southwest of Chicago. The city has a total area of 4.2 square miles, all of which is land.
The city is located in a flat, low-lying area, with an elevation of 645 feet above sea level. The climate is humid continental, with hot, humid summers and cold, snowy winters.
Economy
The economy of Princeton is largely based on manufacturing and agriculture. The city is home to several major manufacturing companies, including Caterpillar, Inc., which produces construction and mining equipment, and the Princeton Foundry, which produces cast iron products.
Agriculture is also an important part of the local economy. The area is home to several large farms, which produce corn, soybeans, and other crops.
Demographics
As of the 2010 census, the population of Princeton was 8,631. The racial makeup of the city was 92.3% White, 2.2% African American, 0.3% Native American, 0.7% Asian, 0.1% Pacific Islander, 2.3% from other races, and 2.3% from two or more races. Hispanic or Latino of any race were 5.2% of the population.
The median household income in Princeton was $45,945, and the median family income was $54,945. The per capita income was $21,945. About 8.3% of families and 10.2% of the population were below the poverty line, including 14.2% of those under age 18 and 6.2% of those age 65 or over.
Common Questions
What is Per Capita Income in Princeton?
Per Capita income in Princeton is $36,286.
What is the Median Family Income in Princeton?
Median Family Income in Princeton is $80,591.
What is the Median Household income in Princeton?
Median Household Income in Princeton is $55,926.
What is Income or Wage Gap in Princeton?
Income or Wage Gap in Princeton is 41.0%.
Women in Princeton earn 59.0 cents for every dollar earned by a man.
What is Inequality or Gini Index in Princeton?
Inequality or Gini Index in Princeton is 0.46.
What is the Total Population of Princeton?
Total Population of Princeton is 7,749.
What is the Total Male Population of Princeton?
Total Male Population of Princeton is 3,574.
What is the Total Female Population of Princeton?
Total Female Population of Princeton is 4,175.
What is the Ratio of Males per 100 Females in Princeton?
There are 85.60 Males per 100 Females in Princeton.
What is the Ratio of Females per 100 Males in Princeton?
There are 116.82 Females per 100 Males in Princeton.
What is the Median Population Age in Princeton?
Median Population Age in Princeton is 46.5 Years.
What is the Average Family Size in Princeton
Average Family Size in Princeton is 2.9 People.
What is the Average Household Size in Princeton
Average Household Size in Princeton is 2.1 People.
How Large is the Labor Force in Princeton?
There are 3,635 People in the Labor Forcein in Princeton.
What is the Percentage of People in the Labor Force in Princeton?
57.0% of People are in the Labor Force in Princeton.
What is the Unemployment Rate in Princeton?
Unemployment Rate in Princeton is 6.2%.