Pittsfield, IL Map & Demographics
Pittsfield Map
Pittsfield Overview
$28,896
PER CAPITA INCOME
$77,063
AVG FAMILY INCOME
$47,950
AVG HOUSEHOLD INCOME
33.8%
WAGE / INCOME GAP [ % ]
66.2¢/ $1
WAGE / INCOME GAP [ $ ]
0.43
INEQUALITY / GINI INDEX
4,152
TOTAL POPULATION
1,889
MALE POPULATION
2,263
FEMALE POPULATION
83.47
MALES / 100 FEMALES
119.80
FEMALES / 100 MALES
42.0
MEDIAN AGE
2.9
AVG FAMILY SIZE
2.2
AVG HOUSEHOLD SIZE
1,755
LABOR FORCE [ PEOPLE ]
52.5%
PERCENT IN LABOR FORCE
8.3%
UNEMPLOYMENT RATE
Pittsfield Zip Codes
Pittsfield Area Codes
Income in Pittsfield
Income Overview in Pittsfield
Per Capita Income in Pittsfield is $28,896, while median incomes of families and households are $77,063 and $47,950 respectively.
| Characteristic | Number | Measure |
| Per Capita Income | 4,152 | $28,896 |
| Median Family Income | 991 | $77,063 |
| Mean Family Income | 991 | $83,383 |
| Median Household Income | 1,759 | $47,950 |
| Mean Household Income | 1,759 | $63,624 |
| Income Deficit | 991 | $0 |
| Wage / Income Gap (%) | 4,152 | 33.79% |
| Wage / Income Gap ($) | 4,152 | 66.21¢ per $1 |
| Gini / Inequality Index | 4,152 | 0.43 |
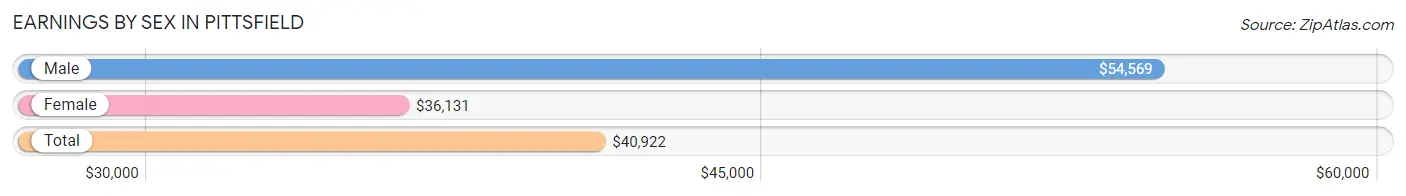
Earnings by Sex in Pittsfield
Average Earnings in Pittsfield are $40,922, $54,569 for men and $36,131 for women, a difference of 33.8%.
| Sex | Number | Average Earnings |
| Male | 904 (51.0%) | $54,569 |
| Female | 867 (49.0%) | $36,131 |
| Total | 1,771 (100.0%) | $40,922 |
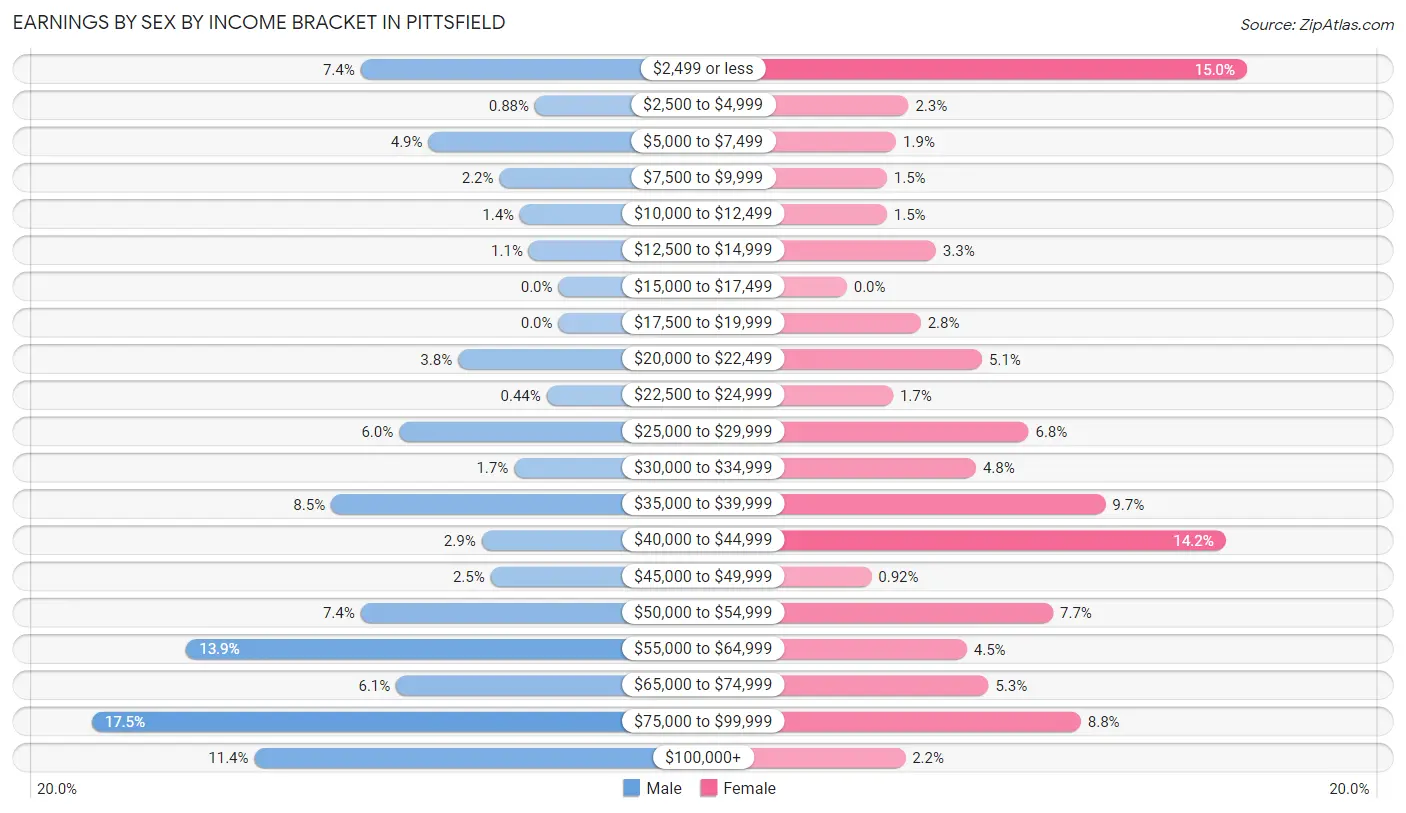
Earnings by Sex by Income Bracket in Pittsfield
The most common earnings brackets in Pittsfield are $75,000 to $99,999 for men (158 | 17.5%) and $2,499 or less for women (130 | 15.0%).
| Income | Male | Female |
| $2,499 or less | 67 (7.4%) | 130 (15.0%) |
| $2,500 to $4,999 | 8 (0.9%) | 20 (2.3%) |
| $5,000 to $7,499 | 44 (4.9%) | 16 (1.8%) |
| $7,500 to $9,999 | 20 (2.2%) | 13 (1.5%) |
| $10,000 to $12,499 | 13 (1.4%) | 13 (1.5%) |
| $12,500 to $14,999 | 10 (1.1%) | 29 (3.3%) |
| $15,000 to $17,499 | 0 (0.0%) | 0 (0.0%) |
| $17,500 to $19,999 | 0 (0.0%) | 24 (2.8%) |
| $20,000 to $22,499 | 34 (3.8%) | 44 (5.1%) |
| $22,500 to $24,999 | 4 (0.4%) | 15 (1.7%) |
| $25,000 to $29,999 | 54 (6.0%) | 59 (6.8%) |
| $30,000 to $34,999 | 15 (1.7%) | 42 (4.8%) |
| $35,000 to $39,999 | 77 (8.5%) | 84 (9.7%) |
| $40,000 to $44,999 | 26 (2.9%) | 123 (14.2%) |
| $45,000 to $49,999 | 23 (2.5%) | 8 (0.9%) |
| $50,000 to $54,999 | 67 (7.4%) | 67 (7.7%) |
| $55,000 to $64,999 | 126 (13.9%) | 39 (4.5%) |
| $65,000 to $74,999 | 55 (6.1%) | 46 (5.3%) |
| $75,000 to $99,999 | 158 (17.5%) | 76 (8.8%) |
| $100,000+ | 103 (11.4%) | 19 (2.2%) |
| Total | 904 (100.0%) | 867 (100.0%) |
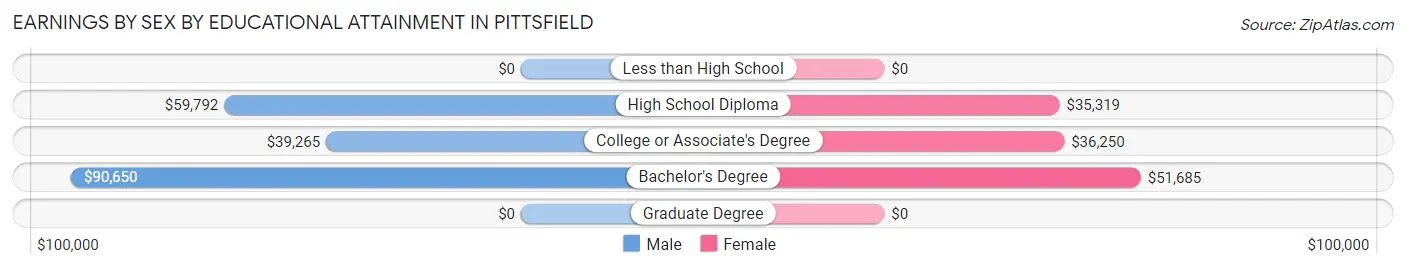
Earnings by Sex by Educational Attainment in Pittsfield
Average earnings in Pittsfield are $54,655 for men and $37,421 for women, a difference of 31.5%. Men with an educational attainment of bachelor's degree enjoy the highest average annual earnings of $90,650, while those with college or associate's degree education earn the least with $39,265. Women with an educational attainment of bachelor's degree earn the most with the average annual earnings of $51,685, while those with high school diploma education have the smallest earnings of $35,319.
| Educational Attainment | Male Income | Female Income |
| Less than High School | - | - |
| High School Diploma | $59,792 | $35,319 |
| College or Associate's Degree | $39,265 | $36,250 |
| Bachelor's Degree | $90,650 | $51,685 |
| Graduate Degree | - | - |
| Total | $54,655 | $37,421 |
Family Income in Pittsfield
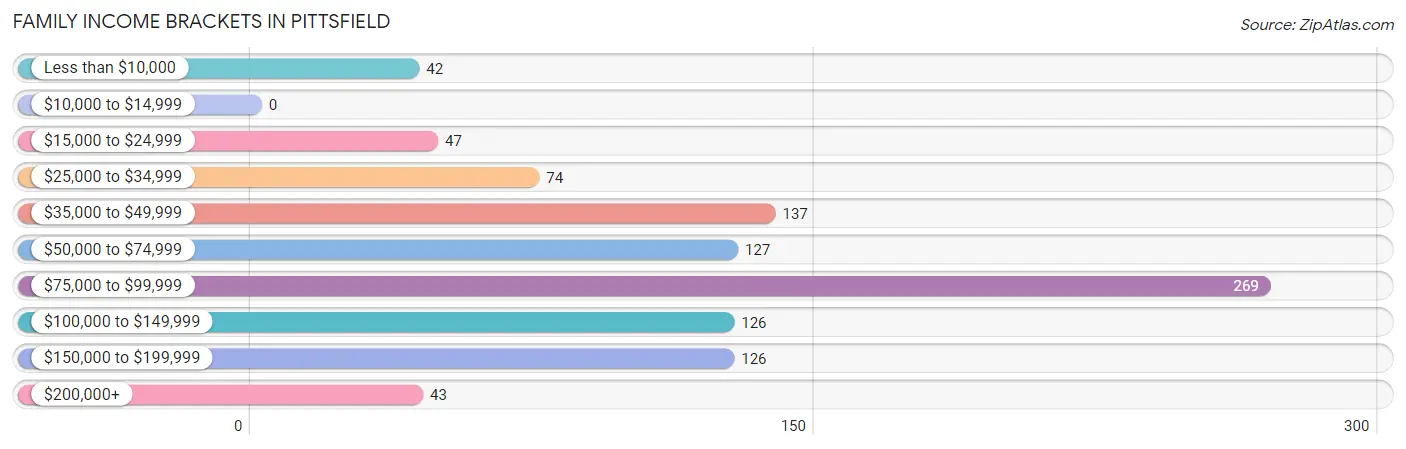
Family Income Brackets in Pittsfield
According to the Pittsfield family income data, there are 269 families falling into the $75,000 to $99,999 income range, which is the most common income bracket and makes up 27.1% of all families.
| Income Bracket | # Families | % Families |
| Less than $10,000 | 42 | 4.2% |
| $10,000 to $14,999 | 0 | 0.0% |
| $15,000 to $24,999 | 47 | 4.7% |
| $25,000 to $34,999 | 74 | 7.5% |
| $35,000 to $49,999 | 137 | 13.8% |
| $50,000 to $74,999 | 127 | 12.8% |
| $75,000 to $99,999 | 269 | 27.1% |
| $100,000 to $149,999 | 126 | 12.7% |
| $150,000 to $199,999 | 126 | 12.7% |
| $200,000+ | 43 | 4.3% |
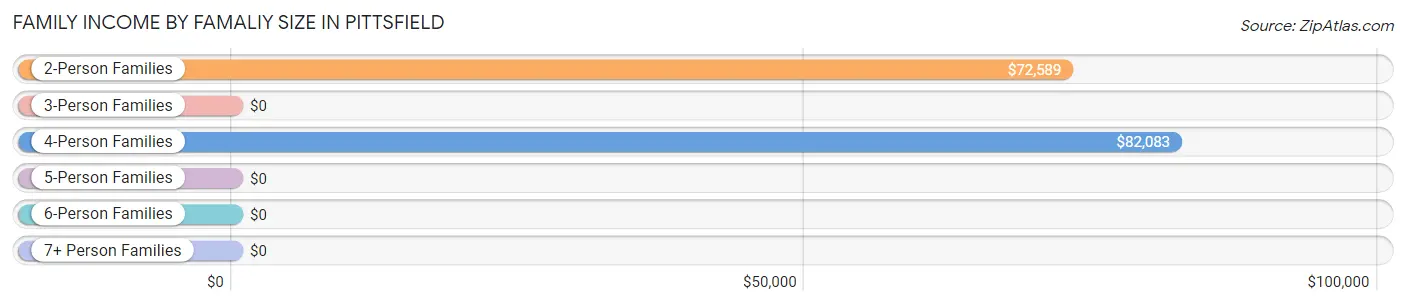
Family Income by Famaliy Size in Pittsfield
4-person families (328 | 33.1%) account for the highest median family income in Pittsfield with $82,083 per family, while 2-person families (603 | 60.9%) have the highest median income of $36,294 per family member.
| Income Bracket | # Families | Median Income |
| 2-Person Families | 603 (60.9%) | $72,589 |
| 3-Person Families | 60 (6.0%) | $0 |
| 4-Person Families | 328 (33.1%) | $82,083 |
| 5-Person Families | 0 (0.0%) | $0 |
| 6-Person Families | 0 (0.0%) | $0 |
| 7+ Person Families | 0 (0.0%) | $0 |
| Total | 991 (100.0%) | $77,063 |
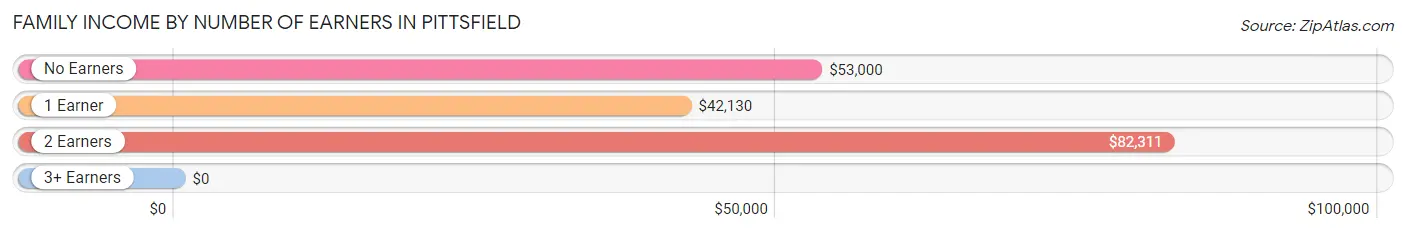
Family Income by Number of Earners in Pittsfield
| Number of Earners | # Families | Median Income |
| No Earners | 244 (24.6%) | $53,000 |
| 1 Earner | 216 (21.8%) | $42,130 |
| 2 Earners | 488 (49.2%) | $82,311 |
| 3+ Earners | 43 (4.3%) | $0 |
| Total | 991 (100.0%) | $77,063 |
Household Income in Pittsfield
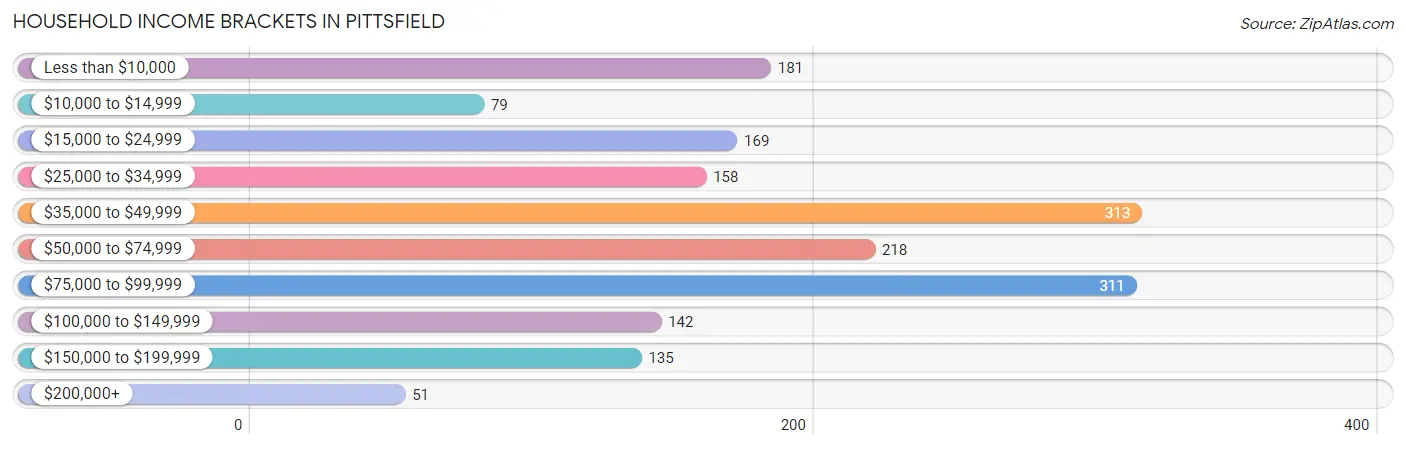
Household Income Brackets in Pittsfield
With 313 households falling in the category, the $35,000 to $49,999 income range is the most frequent in Pittsfield, accounting for 17.8% of all households. In contrast, only 51 households (2.9%) fall into the $200,000+ income bracket, making it the least populous group.
| Income Bracket | # Households | % Households |
| Less than $10,000 | 181 | 10.3% |
| $10,000 to $14,999 | 79 | 4.5% |
| $15,000 to $24,999 | 169 | 9.6% |
| $25,000 to $34,999 | 158 | 9.0% |
| $35,000 to $49,999 | 313 | 17.8% |
| $50,000 to $74,999 | 218 | 12.4% |
| $75,000 to $99,999 | 311 | 17.7% |
| $100,000 to $149,999 | 142 | 8.1% |
| $150,000 to $199,999 | 135 | 7.7% |
| $200,000+ | 51 | 2.9% |
Household Income by Householder Age in Pittsfield
The median household income in Pittsfield is $47,950, with the highest median household income of $75,379 found in the 45 to 64 years age bracket for the primary householder. A total of 450 households (25.6%) fall into this category. Meanwhile, the 65+ years age bracket for the primary householder has the lowest median household income of $39,861, with 705 households (40.1%) in this group.
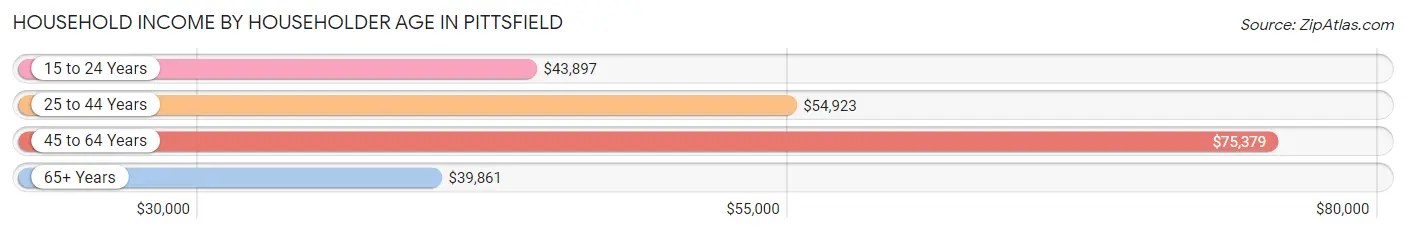
| Income Bracket | # Households | Median Income |
| 15 to 24 Years | 33 (1.9%) | $43,897 |
| 25 to 44 Years | 571 (32.5%) | $54,923 |
| 45 to 64 Years | 450 (25.6%) | $75,379 |
| 65+ Years | 705 (40.1%) | $39,861 |
| Total | 1,759 (100.0%) | $47,950 |
Poverty in Pittsfield
Income Below Poverty by Sex and Age in Pittsfield
With 8.9% poverty level for males and 10.3% for females among the residents of Pittsfield, 55 to 64 year old males and 65 to 74 year old females are the most vulnerable to poverty, with 46 males (18.9%) and 64 females (30.3%) in their respective age groups living below the poverty level.
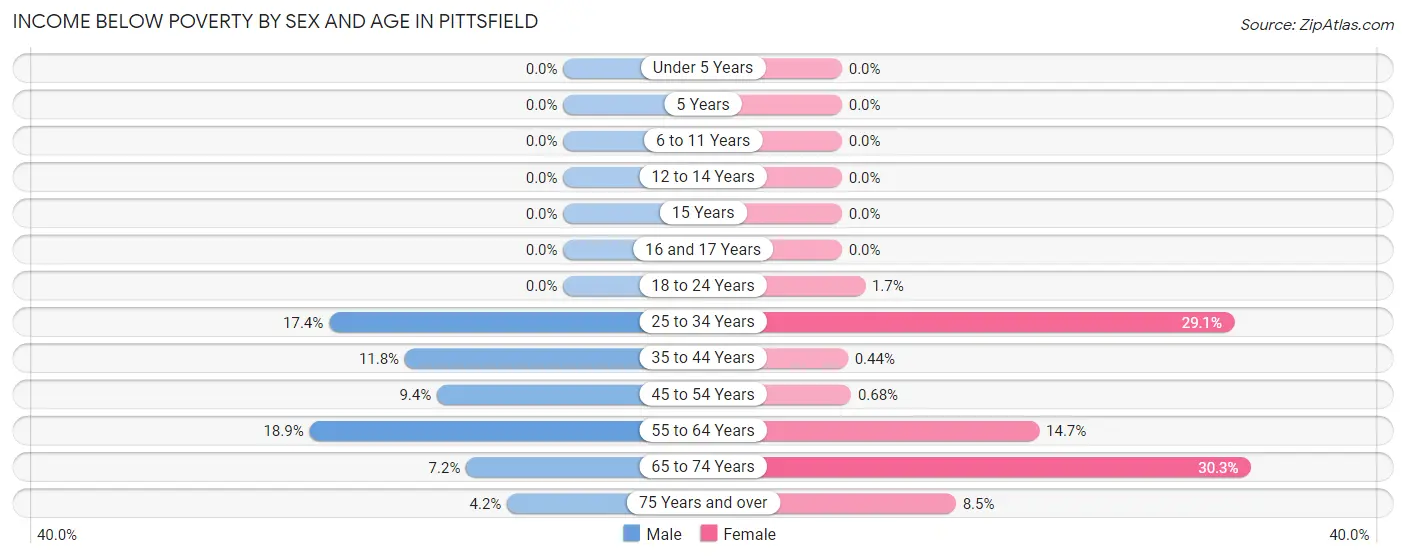
| Age Bracket | Male | Female |
| Under 5 Years | 0 (0.0%) | 0 (0.0%) |
| 5 Years | 0 (0.0%) | 0 (0.0%) |
| 6 to 11 Years | 0 (0.0%) | 0 (0.0%) |
| 12 to 14 Years | 0 (0.0%) | 0 (0.0%) |
| 15 Years | 0 (0.0%) | 0 (0.0%) |
| 16 and 17 Years | 0 (0.0%) | 0 (0.0%) |
| 18 to 24 Years | 0 (0.0%) | 1 (1.7%) |
| 25 to 34 Years | 36 (17.4%) | 78 (29.1%) |
| 35 to 44 Years | 34 (11.8%) | 1 (0.4%) |
| 45 to 54 Years | 9 (9.4%) | 1 (0.7%) |
| 55 to 64 Years | 46 (18.9%) | 52 (14.6%) |
| 65 to 74 Years | 16 (7.2%) | 64 (30.3%) |
| 75 Years and over | 9 (4.2%) | 28 (8.5%) |
| Total | 150 (8.9%) | 225 (10.3%) |
Income Above Poverty by Sex and Age in Pittsfield
According to the poverty statistics in Pittsfield, males aged under 5 years and females aged under 5 years are the age groups that are most secure financially, with 100.0% of males and 100.0% of females in these age groups living above the poverty line.
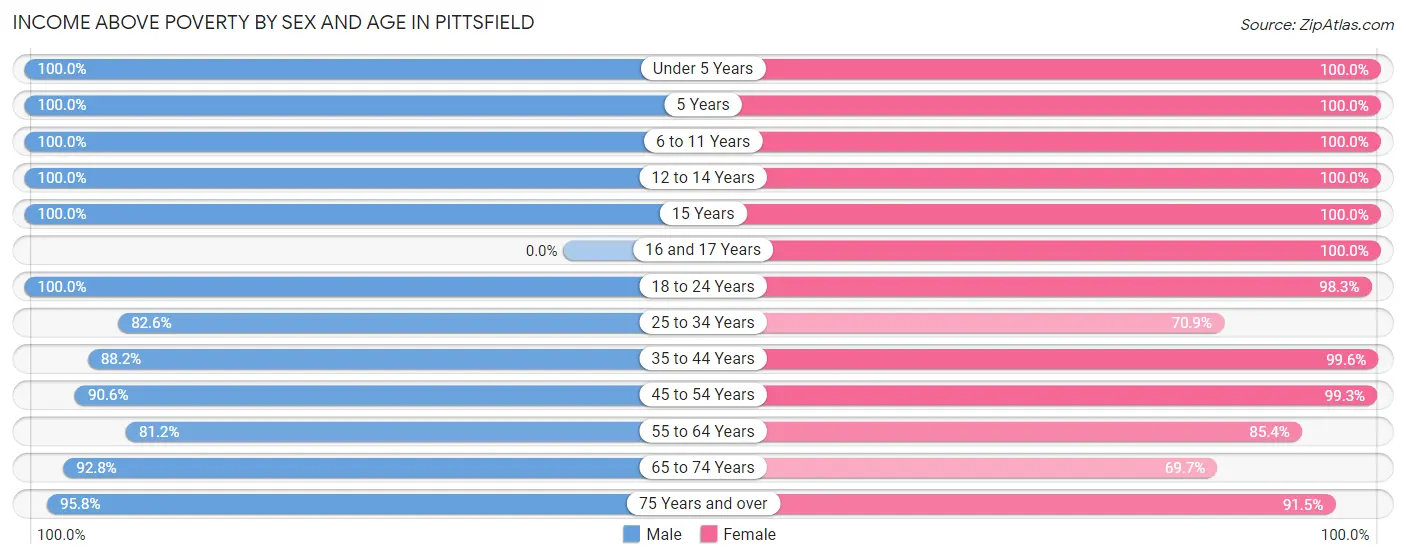
| Age Bracket | Male | Female |
| Under 5 Years | 50 (100.0%) | 113 (100.0%) |
| 5 Years | 44 (100.0%) | 65 (100.0%) |
| 6 to 11 Years | 99 (100.0%) | 266 (100.0%) |
| 12 to 14 Years | 102 (100.0%) | 10 (100.0%) |
| 15 Years | 12 (100.0%) | 49 (100.0%) |
| 16 and 17 Years | 0 (0.0%) | 80 (100.0%) |
| 18 to 24 Years | 111 (100.0%) | 57 (98.3%) |
| 25 to 34 Years | 171 (82.6%) | 190 (70.9%) |
| 35 to 44 Years | 255 (88.2%) | 227 (99.6%) |
| 45 to 54 Years | 87 (90.6%) | 147 (99.3%) |
| 55 to 64 Years | 198 (81.1%) | 303 (85.4%) |
| 65 to 74 Years | 206 (92.8%) | 147 (69.7%) |
| 75 Years and over | 207 (95.8%) | 303 (91.5%) |
| Total | 1,542 (91.1%) | 1,957 (89.7%) |
Income Below Poverty Among Married-Couple Families in Pittsfield
The poverty statistics for married-couple families in Pittsfield show that 5.2% or 42 of the total 803 families live below the poverty line. Families with no children have the highest poverty rate of 8.3%, comprising of 42 families. On the other hand, families with 1 or 2 children have the lowest poverty rate of 0.0%, which includes 0 families.
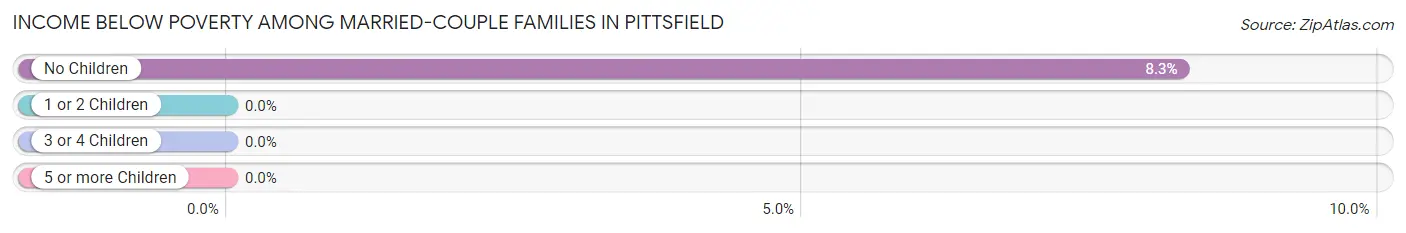
| Children | Above Poverty | Below Poverty |
| No Children | 465 (91.7%) | 42 (8.3%) |
| 1 or 2 Children | 296 (100.0%) | 0 (0.0%) |
| 3 or 4 Children | 0 (0.0%) | 0 (0.0%) |
| 5 or more Children | 0 (0.0%) | 0 (0.0%) |
| Total | 761 (94.8%) | 42 (5.2%) |
Income Below Poverty Among Single-Parent Households in Pittsfield
| Children | Single Father | Single Mother |
| No Children | 0 (0.0%) | 0 (0.0%) |
| 1 or 2 Children | 0 (0.0%) | 0 (0.0%) |
| 3 or 4 Children | 0 (0.0%) | 0 (0.0%) |
| 5 or more Children | 0 (0.0%) | 0 (0.0%) |
| Total | 0 (0.0%) | 0 (0.0%) |
Income Below Poverty Among Married-Couple vs Single-Parent Households in Pittsfield
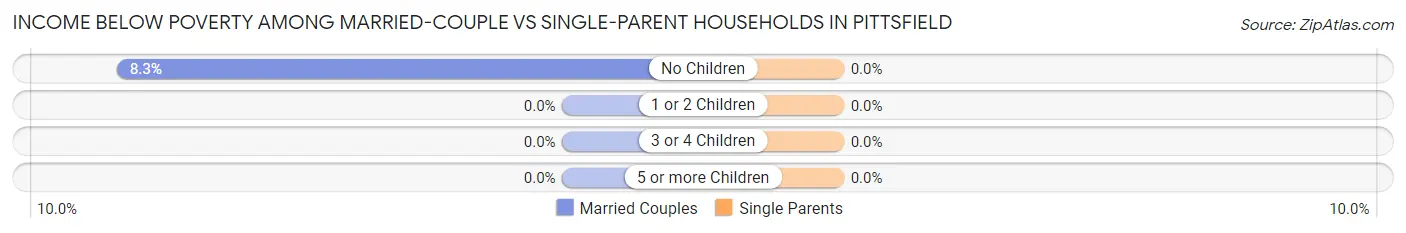
| Children | Married-Couple Families | Single-Parent Households |
| No Children | 42 (8.3%) | 0 (0.0%) |
| 1 or 2 Children | 0 (0.0%) | 0 (0.0%) |
| 3 or 4 Children | 0 (0.0%) | 0 (0.0%) |
| 5 or more Children | 0 (0.0%) | 0 (0.0%) |
| Total | 42 (5.2%) | 0 (0.0%) |
Race in Pittsfield
The most populous races in Pittsfield are White / Caucasian (3,996 | 96.2%), Black / African American (65 | 1.6%), and Hispanic or Latino (64 | 1.5%).
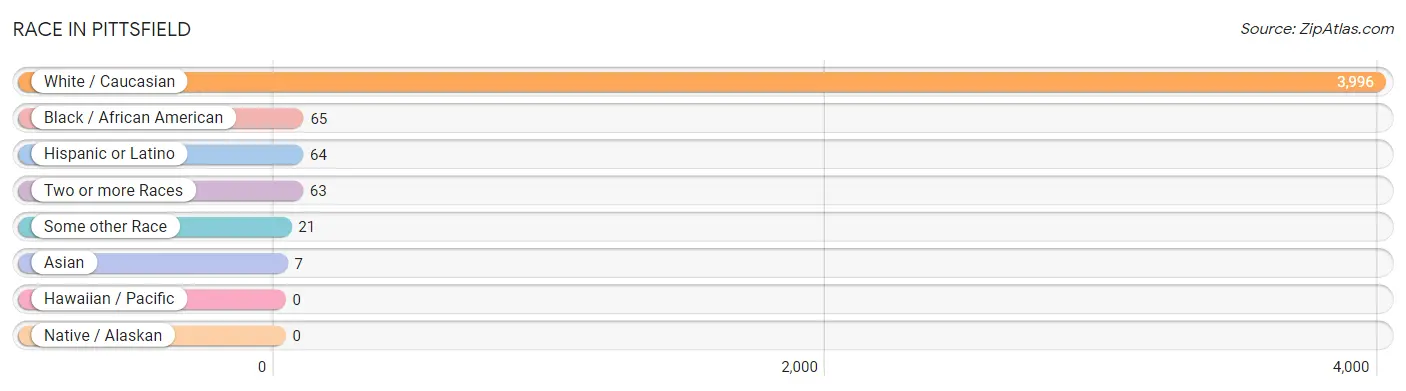
| Race | # Population | % Population |
| Asian | 7 | 0.2% |
| Black / African American | 65 | 1.6% |
| Hawaiian / Pacific | 0 | 0.0% |
| Hispanic or Latino | 64 | 1.5% |
| Native / Alaskan | 0 | 0.0% |
| White / Caucasian | 3,996 | 96.2% |
| Two or more Races | 63 | 1.5% |
| Some other Race | 21 | 0.5% |
| Total | 4,152 | 100.0% |
Ancestry in Pittsfield
The most populous ancestries reported in Pittsfield are German (801 | 19.3%), American (569 | 13.7%), English (402 | 9.7%), Irish (335 | 8.1%), and Scottish (107 | 2.6%), together accounting for 53.3% of all Pittsfield residents.
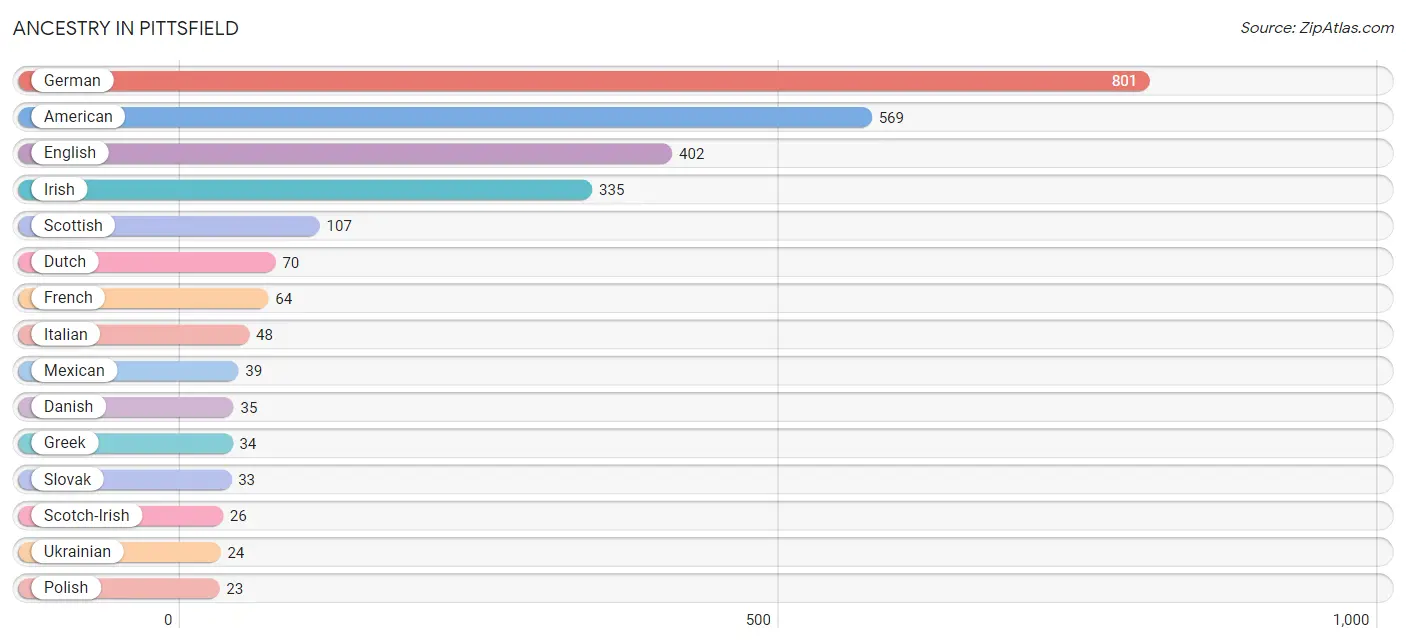
| Ancestry | # Population | % Population |
| American | 569 | 13.7% |
| Croatian | 6 | 0.1% |
| Cuban | 3 | 0.1% |
| Danish | 35 | 0.8% |
| Dutch | 70 | 1.7% |
| English | 402 | 9.7% |
| European | 18 | 0.4% |
| French | 64 | 1.5% |
| German | 801 | 19.3% |
| Greek | 34 | 0.8% |
| Irish | 335 | 8.1% |
| Italian | 48 | 1.2% |
| Mexican | 39 | 0.9% |
| Norwegian | 1 | 0.0% |
| Polish | 23 | 0.5% |
| Portuguese | 12 | 0.3% |
| Puerto Rican | 1 | 0.0% |
| Russian | 7 | 0.2% |
| Scandinavian | 5 | 0.1% |
| Scotch-Irish | 26 | 0.6% |
| Scottish | 107 | 2.6% |
| Slovak | 33 | 0.8% |
| Sri Lankan | 7 | 0.2% |
| Ukrainian | 24 | 0.6% | View All 24 Rows |
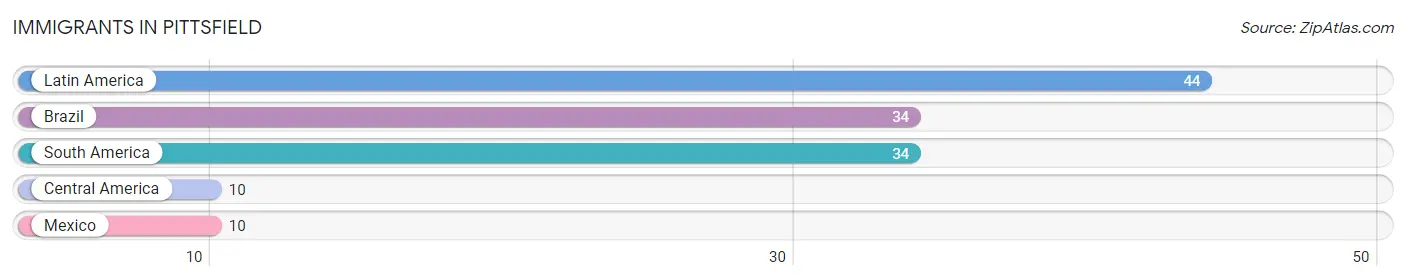
Immigrants in Pittsfield
The most numerous immigrant groups reported in Pittsfield came from Latin America (44 | 1.1%), Brazil (34 | 0.8%), South America (34 | 0.8%), Central America (10 | 0.2%), and Mexico (10 | 0.2%), together accounting for 3.2% of all Pittsfield residents.
| Immigration Origin | # Population | % Population |
| Brazil | 34 | 0.8% |
| Central America | 10 | 0.2% |
| Latin America | 44 | 1.1% |
| Mexico | 10 | 0.2% |
| South America | 34 | 0.8% | View All 5 Rows |
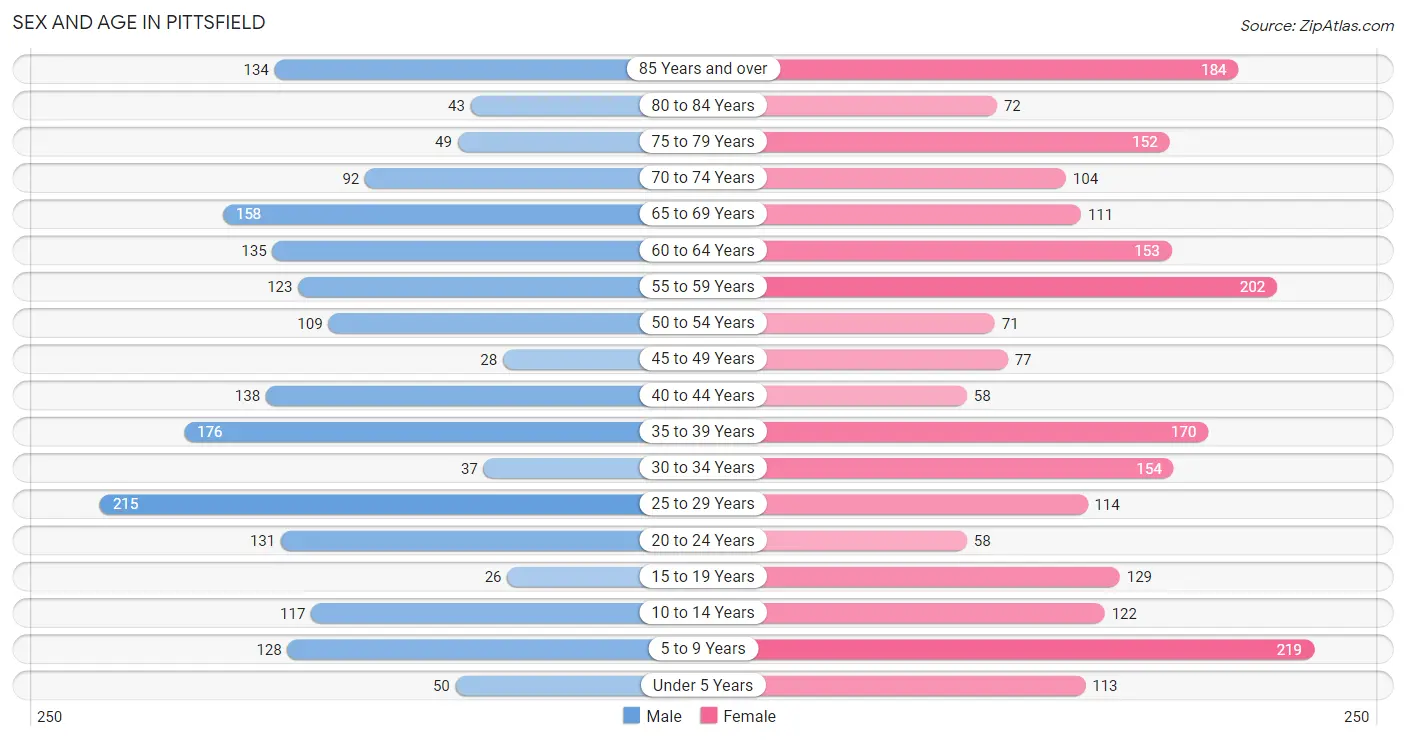
Sex and Age in Pittsfield
Sex and Age in Pittsfield
The most populous age groups in Pittsfield are 25 to 29 Years (215 | 11.4%) for men and 5 to 9 Years (219 | 9.7%) for women.
| Age Bracket | Male | Female |
| Under 5 Years | 50 (2.6%) | 113 (5.0%) |
| 5 to 9 Years | 128 (6.8%) | 219 (9.7%) |
| 10 to 14 Years | 117 (6.2%) | 122 (5.4%) |
| 15 to 19 Years | 26 (1.4%) | 129 (5.7%) |
| 20 to 24 Years | 131 (6.9%) | 58 (2.6%) |
| 25 to 29 Years | 215 (11.4%) | 114 (5.0%) |
| 30 to 34 Years | 37 (2.0%) | 154 (6.8%) |
| 35 to 39 Years | 176 (9.3%) | 170 (7.5%) |
| 40 to 44 Years | 138 (7.3%) | 58 (2.6%) |
| 45 to 49 Years | 28 (1.5%) | 77 (3.4%) |
| 50 to 54 Years | 109 (5.8%) | 71 (3.1%) |
| 55 to 59 Years | 123 (6.5%) | 202 (8.9%) |
| 60 to 64 Years | 135 (7.1%) | 153 (6.8%) |
| 65 to 69 Years | 158 (8.4%) | 111 (4.9%) |
| 70 to 74 Years | 92 (4.9%) | 104 (4.6%) |
| 75 to 79 Years | 49 (2.6%) | 152 (6.7%) |
| 80 to 84 Years | 43 (2.3%) | 72 (3.2%) |
| 85 Years and over | 134 (7.1%) | 184 (8.1%) |
| Total | 1,889 (100.0%) | 2,263 (100.0%) |
Families and Households in Pittsfield
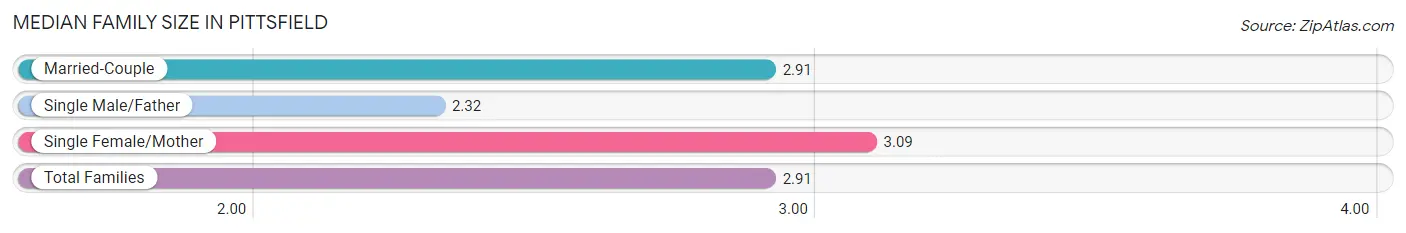
Median Family Size in Pittsfield
The median family size in Pittsfield is 2.91 persons per family, with single female/mother families (151 | 15.2%) accounting for the largest median family size of 3.09 persons per family. On the other hand, single male/father families (37 | 3.7%) represent the smallest median family size with 2.32 persons per family.
| Family Type | # Families | Family Size |
| Married-Couple | 803 (81.0%) | 2.91 |
| Single Male/Father | 37 (3.7%) | 2.32 |
| Single Female/Mother | 151 (15.2%) | 3.09 |
| Total Families | 991 (100.0%) | 2.91 |
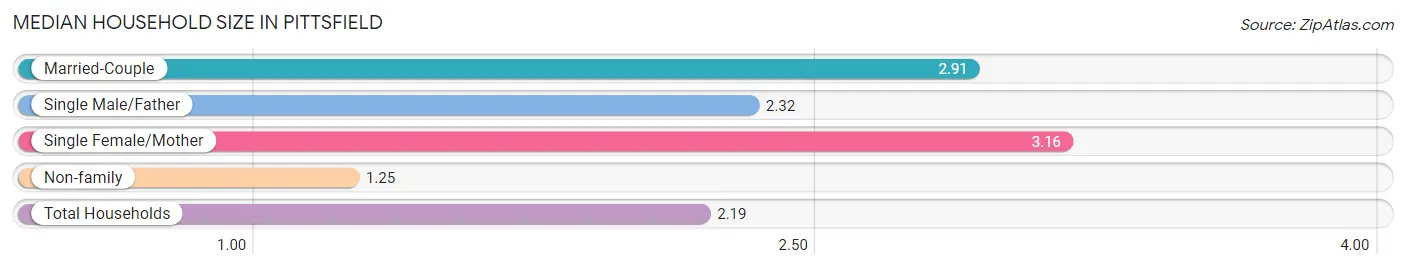
Median Household Size in Pittsfield
The median household size in Pittsfield is 2.19 persons per household, with single female/mother households (151 | 8.6%) accounting for the largest median household size of 3.16 persons per household. non-family households (768 | 43.7%) represent the smallest median household size with 1.25 persons per household.
| Household Type | # Households | Household Size |
| Married-Couple | 803 (45.7%) | 2.91 |
| Single Male/Father | 37 (2.1%) | 2.32 |
| Single Female/Mother | 151 (8.6%) | 3.16 |
| Non-family | 768 (43.7%) | 1.25 |
| Total Households | 1,759 (100.0%) | 2.19 |
Household Size by Marriage Status in Pittsfield
Out of a total of 1,759 households in Pittsfield, 991 (56.3%) are family households, while 768 (43.7%) are nonfamily households. The most numerous type of family households are 2-person households, comprising 603, and the most common type of nonfamily households are 1-person households, comprising 679.
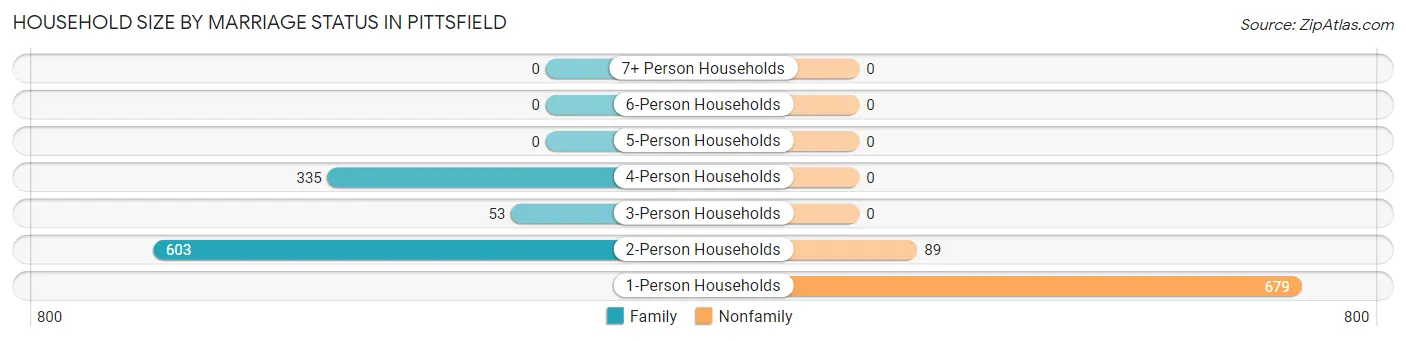
| Household Size | Family Households | Nonfamily Households |
| 1-Person Households | - | 679 (38.6%) |
| 2-Person Households | 603 (34.3%) | 89 (5.1%) |
| 3-Person Households | 53 (3.0%) | 0 (0.0%) |
| 4-Person Households | 335 (19.0%) | 0 (0.0%) |
| 5-Person Households | 0 (0.0%) | 0 (0.0%) |
| 6-Person Households | 0 (0.0%) | 0 (0.0%) |
| 7+ Person Households | 0 (0.0%) | 0 (0.0%) |
| Total | 991 (56.3%) | 768 (43.7%) |
Female Fertility in Pittsfield
Fertility by Age in Pittsfield
Average fertility rate in Pittsfield is 53.0 births per 1,000 women. Women in the age bracket of 20 to 34 years have the highest fertility rate with 126.0 births per 1,000 women. Women in the age bracket of 20 to 34 years acount for 100.0% of all women with births.
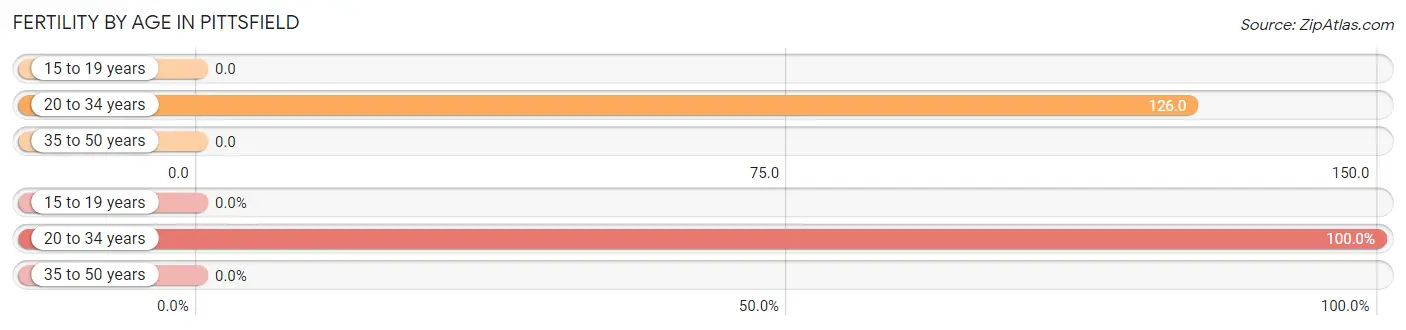
| Age Bracket | Women with Births | Births / 1,000 Women |
| 15 to 19 years | 0 (0.0%) | 0.0 |
| 20 to 34 years | 41 (100.0%) | 126.0 |
| 35 to 50 years | 0 (0.0%) | 0.0 |
| Total | 41 (100.0%) | 53.0 |
Fertility by Age by Marriage Status in Pittsfield
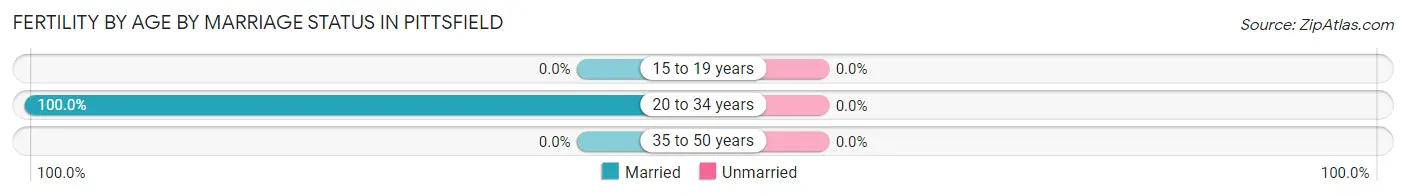
| Age Bracket | Married | Unmarried |
| 15 to 19 years | 0 (0.0%) | 0 (0.0%) |
| 20 to 34 years | 41 (100.0%) | 0 (0.0%) |
| 35 to 50 years | 0 (0.0%) | 0 (0.0%) |
| Total | 41 (100.0%) | 0 (0.0%) |
Fertility by Education in Pittsfield
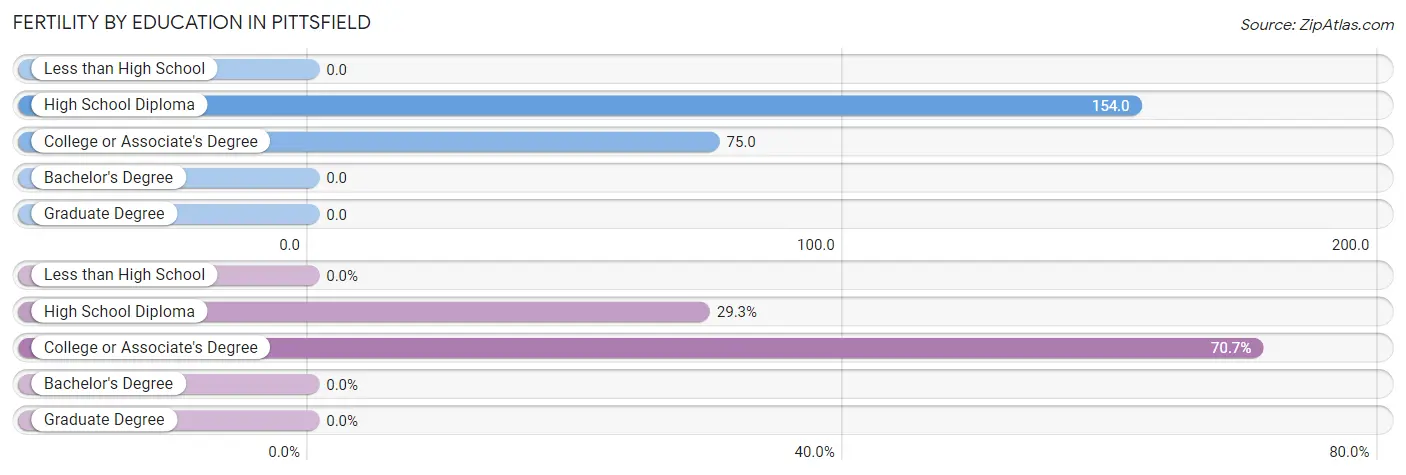
| Educational Attainment | Women with Births | Births / 1,000 Women |
| Less than High School | 0 (0.0%) | 0.0 |
| High School Diploma | 12 (29.3%) | 154.0 |
| College or Associate's Degree | 29 (70.7%) | 75.0 |
| Bachelor's Degree | 0 (0.0%) | 0.0 |
| Graduate Degree | 0 (0.0%) | 0.0 |
| Total | 41 (100.0%) | 53.0 |
Fertility by Education by Marriage Status in Pittsfield
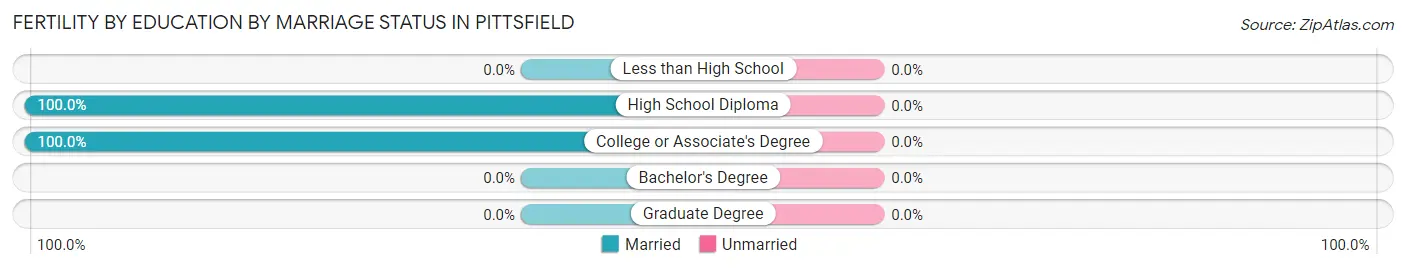
| Educational Attainment | Married | Unmarried |
| Less than High School | 0 (0.0%) | 0 (0.0%) |
| High School Diploma | 12 (100.0%) | 0 (0.0%) |
| College or Associate's Degree | 29 (100.0%) | 0 (0.0%) |
| Bachelor's Degree | 0 (0.0%) | 0 (0.0%) |
| Graduate Degree | 0 (0.0%) | 0 (0.0%) |
| Total | 41 (100.0%) | 0 (0.0%) |
Employment Characteristics in Pittsfield
Employment by Class of Employer in Pittsfield
Among the 1,590 employed individuals in Pittsfield, private company employees (750 | 47.2%), state government employees (283 | 17.8%), and not-for-profit organizations (188 | 11.8%) make up the most common classes of employment.
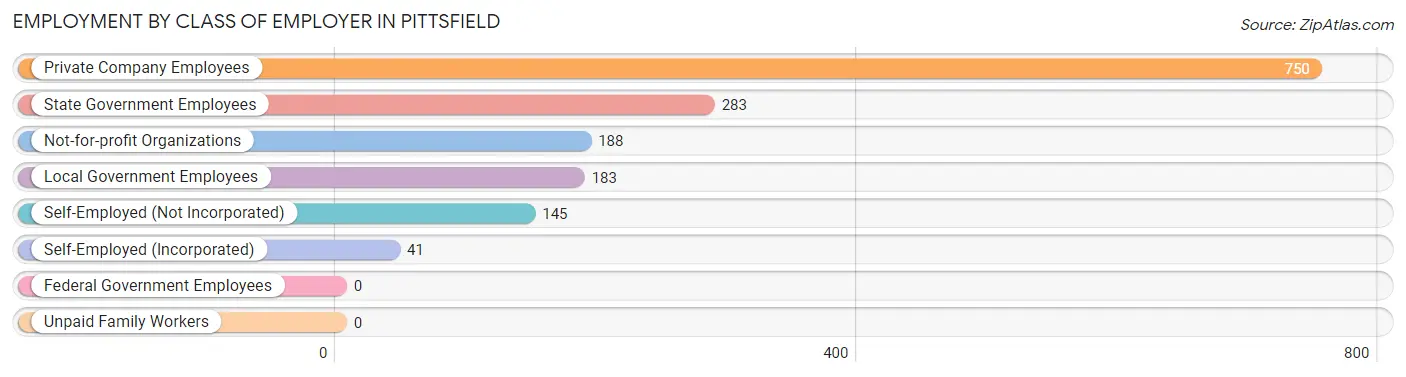
| Employer Class | # Employees | % Employees |
| Private Company Employees | 750 | 47.2% |
| Self-Employed (Incorporated) | 41 | 2.6% |
| Self-Employed (Not Incorporated) | 145 | 9.1% |
| Not-for-profit Organizations | 188 | 11.8% |
| Local Government Employees | 183 | 11.5% |
| State Government Employees | 283 | 17.8% |
| Federal Government Employees | 0 | 0.0% |
| Unpaid Family Workers | 0 | 0.0% |
| Total | 1,590 | 100.0% |
Employment Status by Age in Pittsfield
According to the labor force statistics for Pittsfield, out of the total population over 16 years of age (3,342), 52.5% or 1,755 individuals are in the labor force, with 8.3% or 146 of them unemployed. The age group with the highest labor force participation rate is 16 to 19 years, with 85.1% or 80 individuals in the labor force. Within the labor force, the 16 to 19 years age range has the highest percentage of unemployed individuals, with 75.0% or 60 of them being unemployed.
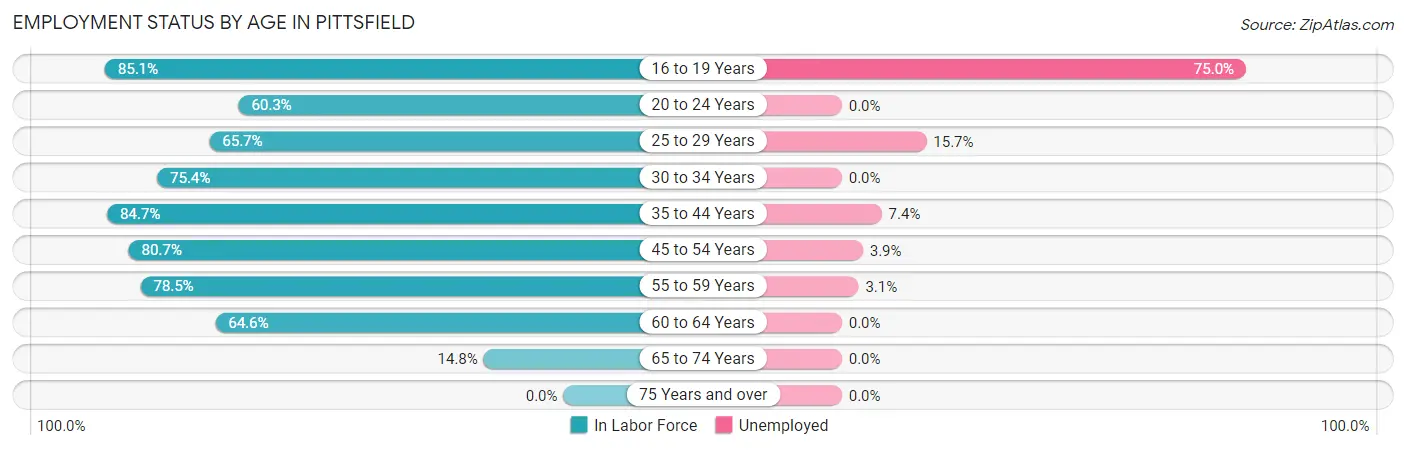
| Age Bracket | In Labor Force | Unemployed |
| 16 to 19 Years | 80 (85.1%) | 60 (75.0%) |
| 20 to 24 Years | 114 (60.3%) | 0 (0.0%) |
| 25 to 29 Years | 216 (65.7%) | 34 (15.7%) |
| 30 to 34 Years | 144 (75.4%) | 0 (0.0%) |
| 35 to 44 Years | 459 (84.7%) | 34 (7.4%) |
| 45 to 54 Years | 230 (80.7%) | 9 (3.9%) |
| 55 to 59 Years | 255 (78.5%) | 8 (3.1%) |
| 60 to 64 Years | 186 (64.6%) | 0 (0.0%) |
| 65 to 74 Years | 69 (14.8%) | 0 (0.0%) |
| 75 Years and over | 0 (0.0%) | 0 (0.0%) |
| Total | 1,755 (52.5%) | 146 (8.3%) |
Employment Status by Educational Attainment in Pittsfield
According to labor force statistics for Pittsfield, 76.0% of individuals (1,490) out of the total population between 25 and 64 years of age (1,960) are in the labor force, with 5.7% or 85 of them being unemployed. The group with the highest labor force participation rate are those with the educational attainment of bachelor's degree or higher, with 91.5% or 460 individuals in the labor force. Within the labor force, individuals with less than high school education have the highest percentage of unemployment, with 32.1% or 9 of them being unemployed.
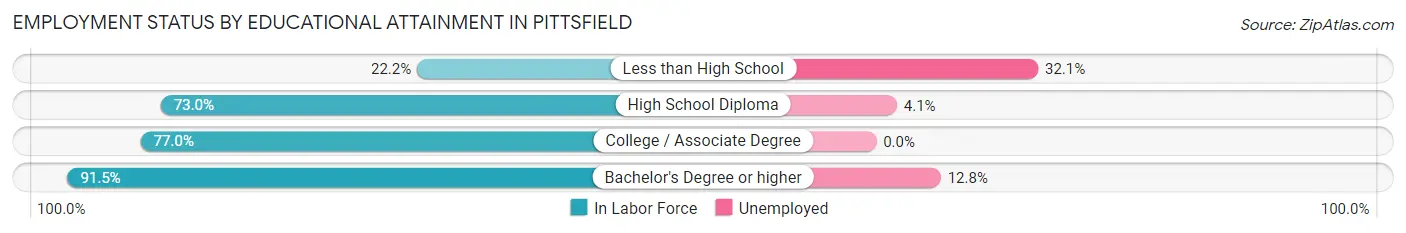
| Educational Attainment | In Labor Force | Unemployed |
| Less than High School | 28 (22.2%) | 40 (32.1%) |
| High School Diploma | 417 (73.0%) | 23 (4.1%) |
| College / Associate Degree | 585 (77.0%) | 0 (0.0%) |
| Bachelor's Degree or higher | 460 (91.5%) | 64 (12.8%) |
| Total | 1,490 (76.0%) | 112 (5.7%) |
Employment Occupations by Sex in Pittsfield
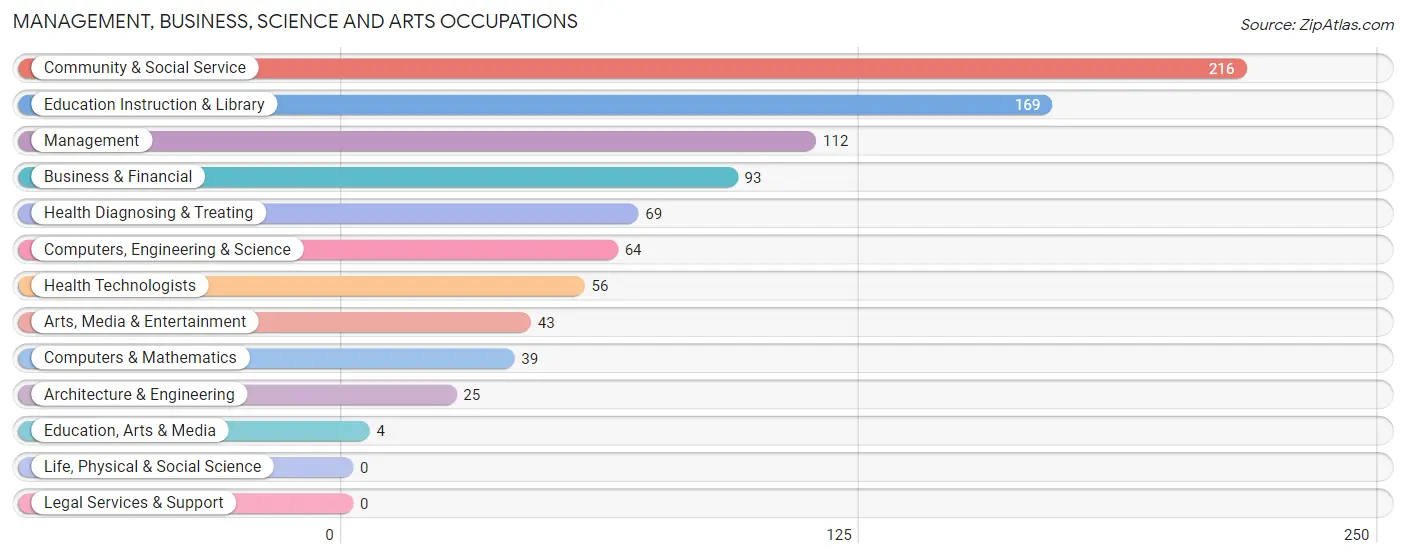
Management, Business, Science and Arts Occupations
The most common Management, Business, Science and Arts occupations in Pittsfield are Community & Social Service (216 | 13.4%), Education Instruction & Library (169 | 10.5%), Management (112 | 7.0%), Business & Financial (93 | 5.8%), and Health Diagnosing & Treating (69 | 4.3%).
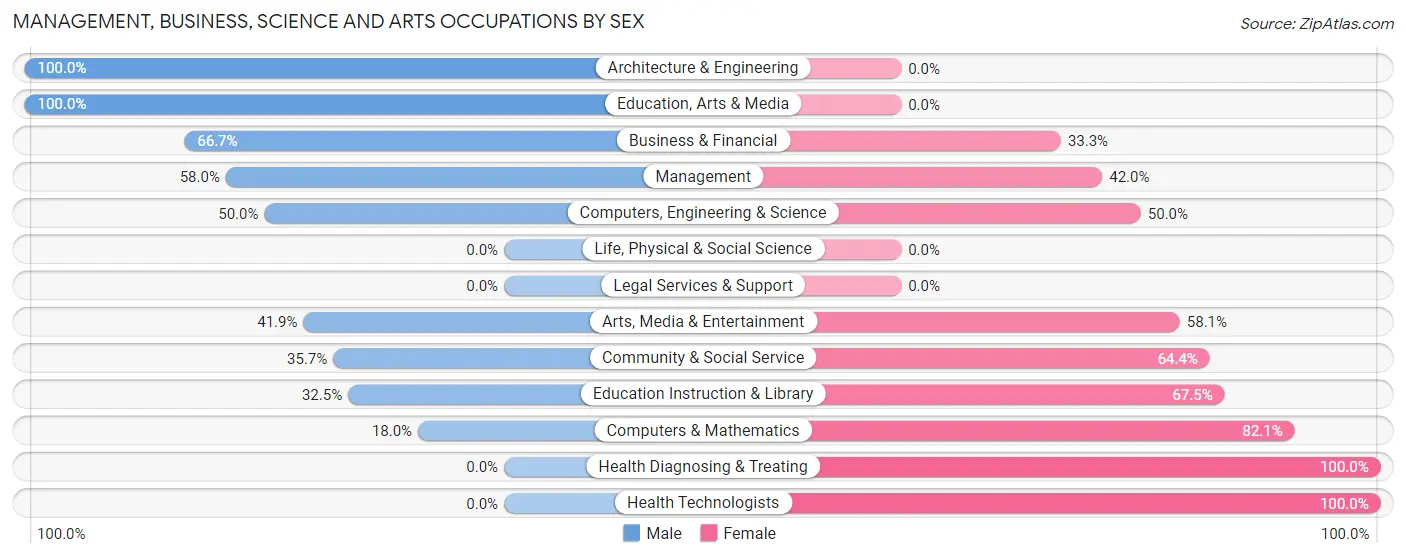
Management, Business, Science and Arts Occupations by Sex
Within the Management, Business, Science and Arts occupations in Pittsfield, the most male-oriented occupations are Architecture & Engineering (100.0%), Education, Arts & Media (100.0%), and Business & Financial (66.7%), while the most female-oriented occupations are Health Diagnosing & Treating (100.0%), Health Technologists (100.0%), and Computers & Mathematics (82.1%).
| Occupation | Male | Female |
| Management | 65 (58.0%) | 47 (42.0%) |
| Business & Financial | 62 (66.7%) | 31 (33.3%) |
| Computers, Engineering & Science | 32 (50.0%) | 32 (50.0%) |
| Computers & Mathematics | 7 (17.9%) | 32 (82.1%) |
| Architecture & Engineering | 25 (100.0%) | 0 (0.0%) |
| Life, Physical & Social Science | 0 (0.0%) | 0 (0.0%) |
| Community & Social Service | 77 (35.6%) | 139 (64.3%) |
| Education, Arts & Media | 4 (100.0%) | 0 (0.0%) |
| Legal Services & Support | 0 (0.0%) | 0 (0.0%) |
| Education Instruction & Library | 55 (32.5%) | 114 (67.5%) |
| Arts, Media & Entertainment | 18 (41.9%) | 25 (58.1%) |
| Health Diagnosing & Treating | 0 (0.0%) | 69 (100.0%) |
| Health Technologists | 0 (0.0%) | 56 (100.0%) |
| Total (Category) | 236 (42.6%) | 318 (57.4%) |
| Total (Overall) | 787 (48.9%) | 821 (51.1%) |
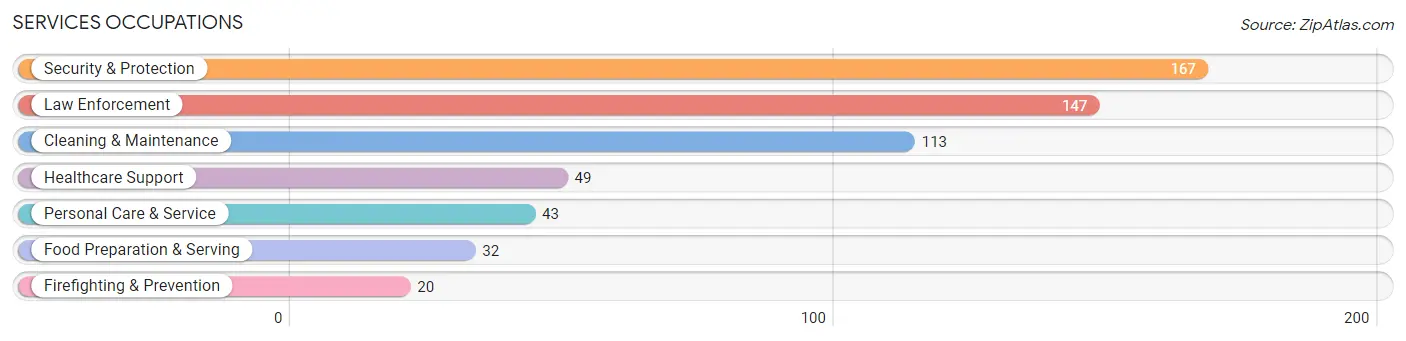
Services Occupations
The most common Services occupations in Pittsfield are Security & Protection (167 | 10.4%), Law Enforcement (147 | 9.1%), Cleaning & Maintenance (113 | 7.0%), Healthcare Support (49 | 3.0%), and Personal Care & Service (43 | 2.7%).
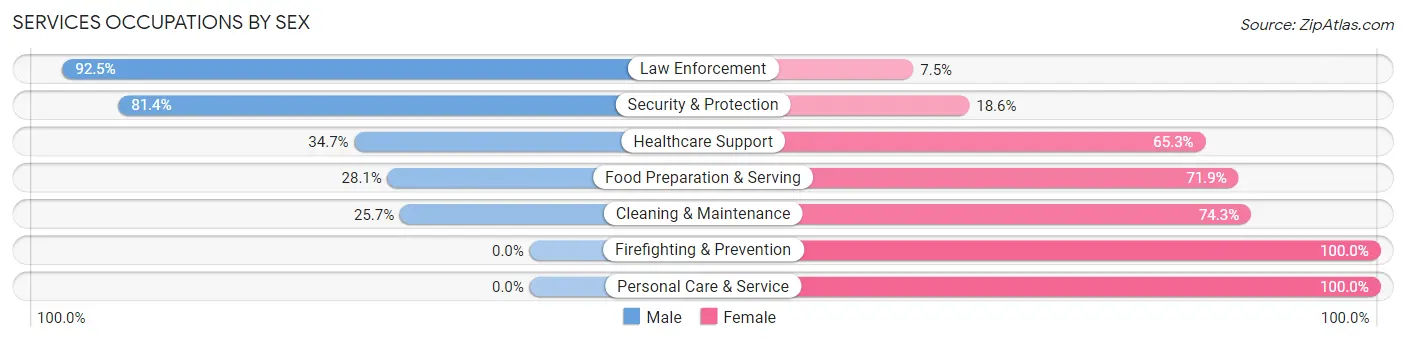
Services Occupations by Sex
Within the Services occupations in Pittsfield, the most male-oriented occupations are Law Enforcement (92.5%), Security & Protection (81.4%), and Healthcare Support (34.7%), while the most female-oriented occupations are Firefighting & Prevention (100.0%), Personal Care & Service (100.0%), and Cleaning & Maintenance (74.3%).
| Occupation | Male | Female |
| Healthcare Support | 17 (34.7%) | 32 (65.3%) |
| Security & Protection | 136 (81.4%) | 31 (18.6%) |
| Firefighting & Prevention | 0 (0.0%) | 20 (100.0%) |
| Law Enforcement | 136 (92.5%) | 11 (7.5%) |
| Food Preparation & Serving | 9 (28.1%) | 23 (71.9%) |
| Cleaning & Maintenance | 29 (25.7%) | 84 (74.3%) |
| Personal Care & Service | 0 (0.0%) | 43 (100.0%) |
| Total (Category) | 191 (47.3%) | 213 (52.7%) |
| Total (Overall) | 787 (48.9%) | 821 (51.1%) |
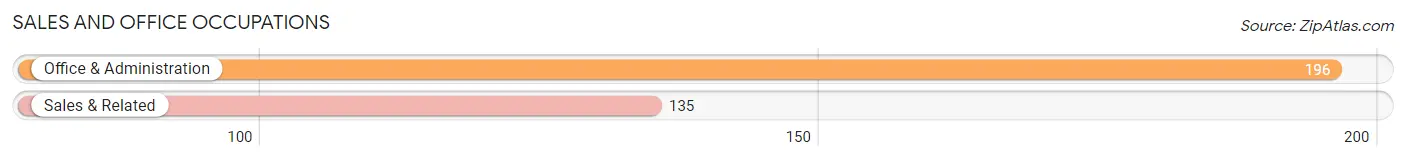
Sales and Office Occupations
The most common Sales and Office occupations in Pittsfield are Office & Administration (196 | 12.2%), and Sales & Related (135 | 8.4%).
Sales and Office Occupations by Sex
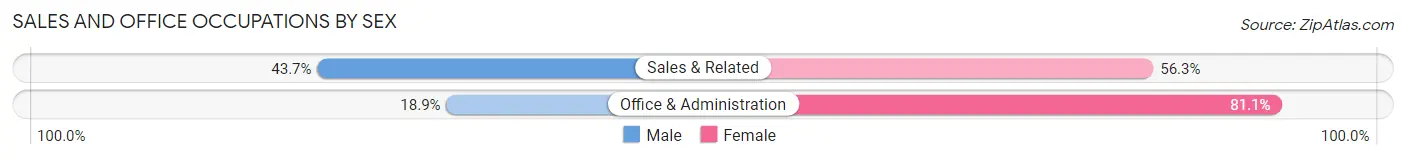
| Occupation | Male | Female |
| Sales & Related | 59 (43.7%) | 76 (56.3%) |
| Office & Administration | 37 (18.9%) | 159 (81.1%) |
| Total (Category) | 96 (29.0%) | 235 (71.0%) |
| Total (Overall) | 787 (48.9%) | 821 (51.1%) |
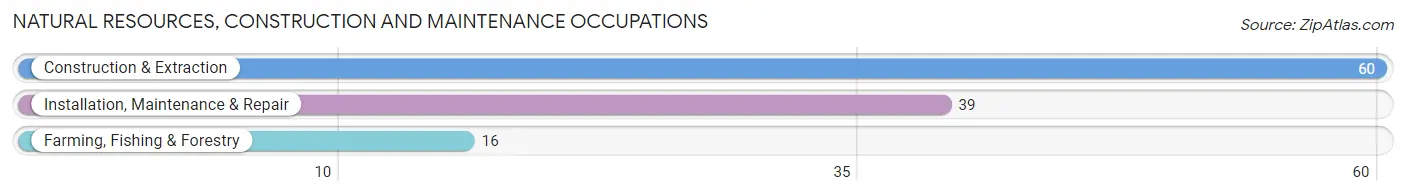
Natural Resources, Construction and Maintenance Occupations
The most common Natural Resources, Construction and Maintenance occupations in Pittsfield are Construction & Extraction (60 | 3.7%), Installation, Maintenance & Repair (39 | 2.4%), and Farming, Fishing & Forestry (16 | 1.0%).
Natural Resources, Construction and Maintenance Occupations by Sex
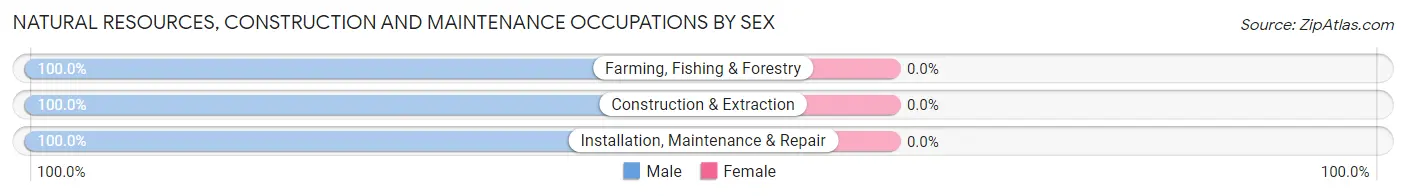
| Occupation | Male | Female |
| Farming, Fishing & Forestry | 16 (100.0%) | 0 (0.0%) |
| Construction & Extraction | 60 (100.0%) | 0 (0.0%) |
| Installation, Maintenance & Repair | 39 (100.0%) | 0 (0.0%) |
| Total (Category) | 115 (100.0%) | 0 (0.0%) |
| Total (Overall) | 787 (48.9%) | 821 (51.1%) |
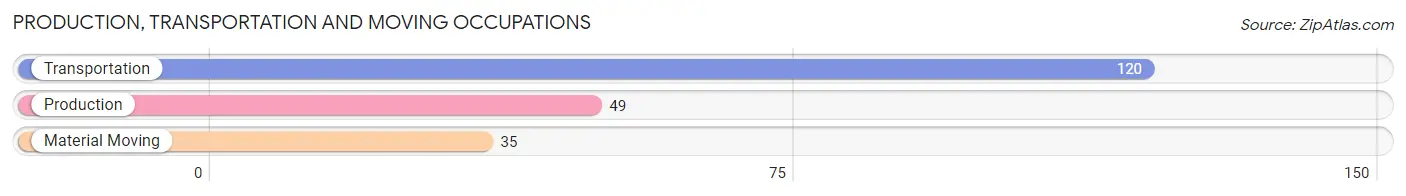
Production, Transportation and Moving Occupations
The most common Production, Transportation and Moving occupations in Pittsfield are Transportation (120 | 7.5%), Production (49 | 3.0%), and Material Moving (35 | 2.2%).
Production, Transportation and Moving Occupations by Sex
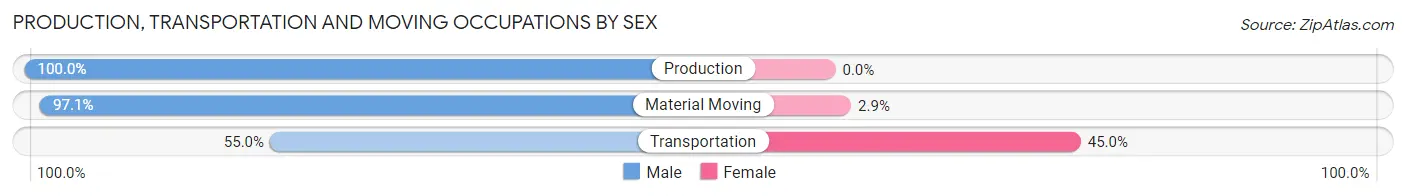
| Occupation | Male | Female |
| Production | 49 (100.0%) | 0 (0.0%) |
| Transportation | 66 (55.0%) | 54 (45.0%) |
| Material Moving | 34 (97.1%) | 1 (2.9%) |
| Total (Category) | 149 (73.0%) | 55 (27.0%) |
| Total (Overall) | 787 (48.9%) | 821 (51.1%) |
Employment Industries by Sex in Pittsfield
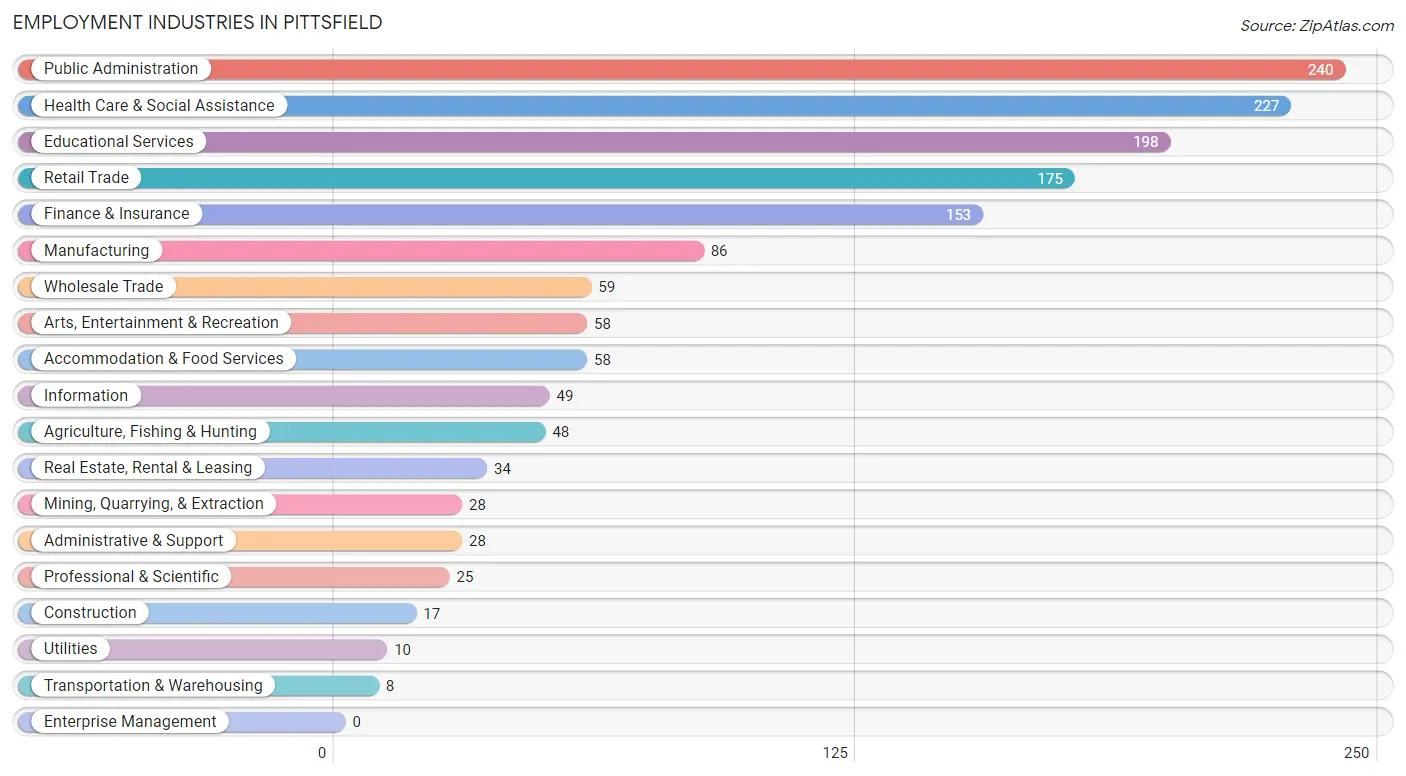
Employment Industries in Pittsfield
The major employment industries in Pittsfield include Public Administration (240 | 14.9%), Health Care & Social Assistance (227 | 14.1%), Educational Services (198 | 12.3%), Retail Trade (175 | 10.9%), and Finance & Insurance (153 | 9.5%).
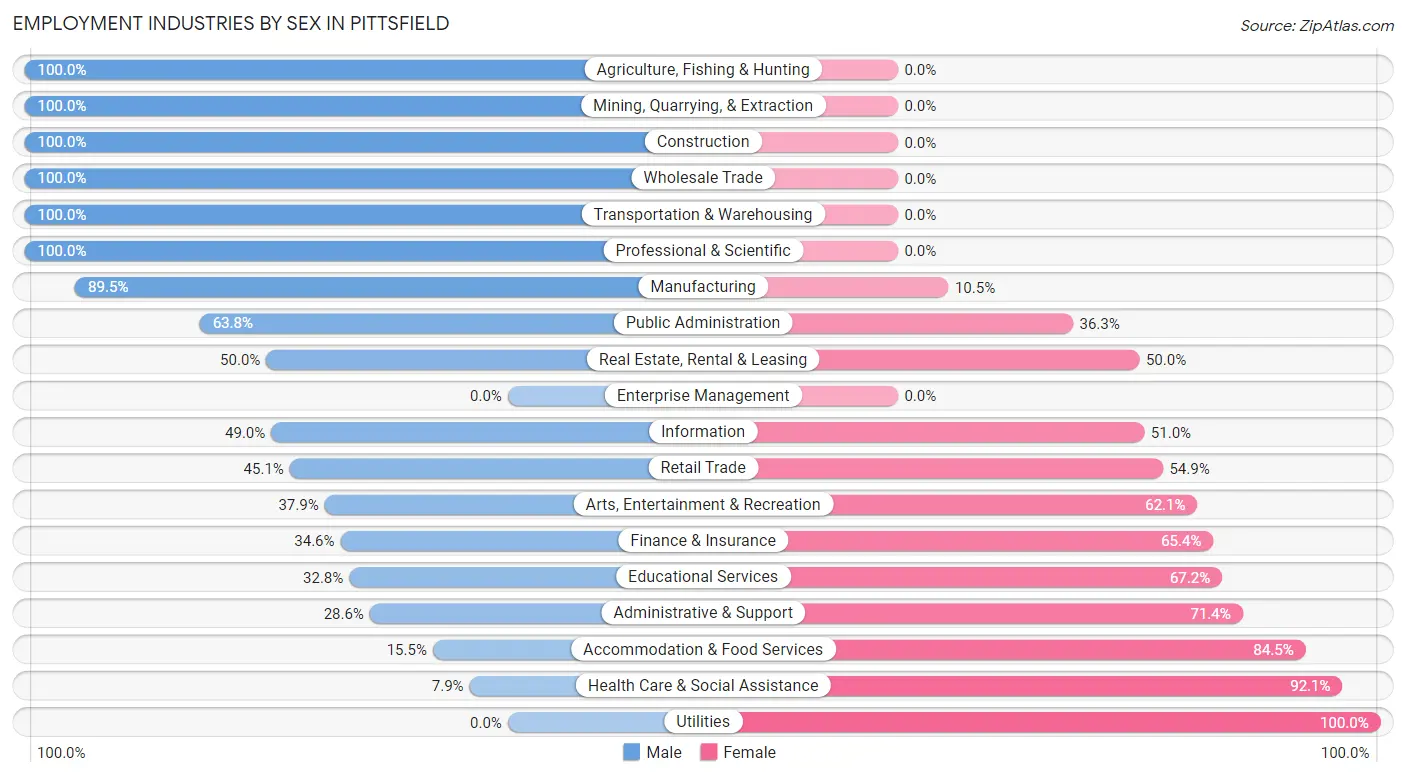
Employment Industries by Sex in Pittsfield
The Pittsfield industries that see more men than women are Agriculture, Fishing & Hunting (100.0%), Mining, Quarrying, & Extraction (100.0%), and Construction (100.0%), whereas the industries that tend to have a higher number of women are Utilities (100.0%), Health Care & Social Assistance (92.1%), and Accommodation & Food Services (84.5%).
| Industry | Male | Female |
| Agriculture, Fishing & Hunting | 48 (100.0%) | 0 (0.0%) |
| Mining, Quarrying, & Extraction | 28 (100.0%) | 0 (0.0%) |
| Construction | 17 (100.0%) | 0 (0.0%) |
| Manufacturing | 77 (89.5%) | 9 (10.5%) |
| Wholesale Trade | 59 (100.0%) | 0 (0.0%) |
| Retail Trade | 79 (45.1%) | 96 (54.9%) |
| Transportation & Warehousing | 8 (100.0%) | 0 (0.0%) |
| Utilities | 0 (0.0%) | 10 (100.0%) |
| Information | 24 (49.0%) | 25 (51.0%) |
| Finance & Insurance | 53 (34.6%) | 100 (65.4%) |
| Real Estate, Rental & Leasing | 17 (50.0%) | 17 (50.0%) |
| Professional & Scientific | 25 (100.0%) | 0 (0.0%) |
| Enterprise Management | 0 (0.0%) | 0 (0.0%) |
| Administrative & Support | 8 (28.6%) | 20 (71.4%) |
| Educational Services | 65 (32.8%) | 133 (67.2%) |
| Health Care & Social Assistance | 18 (7.9%) | 209 (92.1%) |
| Arts, Entertainment & Recreation | 22 (37.9%) | 36 (62.1%) |
| Accommodation & Food Services | 9 (15.5%) | 49 (84.5%) |
| Public Administration | 153 (63.7%) | 87 (36.2%) |
| Total | 787 (48.9%) | 821 (51.1%) |
Education in Pittsfield
School Enrollment in Pittsfield
The most common levels of schooling among the 895 students in Pittsfield are elementary school (242 | 27.0%), middle school (217 | 24.2%), and high school (183 | 20.4%).
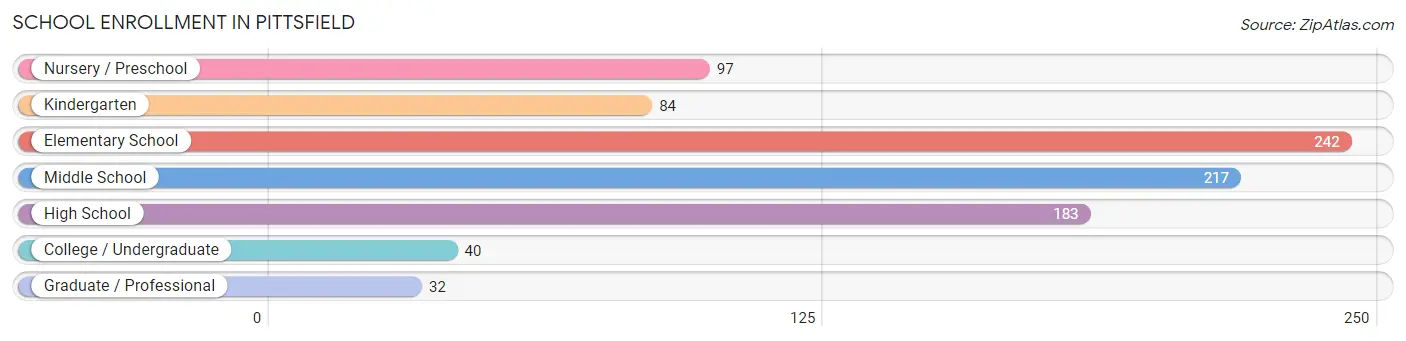
| School Level | # Students | % Students |
| Nursery / Preschool | 97 | 10.8% |
| Kindergarten | 84 | 9.4% |
| Elementary School | 242 | 27.0% |
| Middle School | 217 | 24.2% |
| High School | 183 | 20.4% |
| College / Undergraduate | 40 | 4.5% |
| Graduate / Professional | 32 | 3.6% |
| Total | 895 | 100.0% |
School Enrollment by Age by Funding Source in Pittsfield
Out of a total of 895 students who are enrolled in schools in Pittsfield, 125 (14.0%) attend a private institution, while the remaining 770 (86.0%) are enrolled in public schools. The age group of 20 to 24 year olds has the highest likelihood of being enrolled in private schools, with 45 (100.0% in the age bracket) enrolled. Conversely, the age group of 10 to 14 year olds has the lowest likelihood of being enrolled in a private school, with 239 (100.0% in the age bracket) attending a public institution.
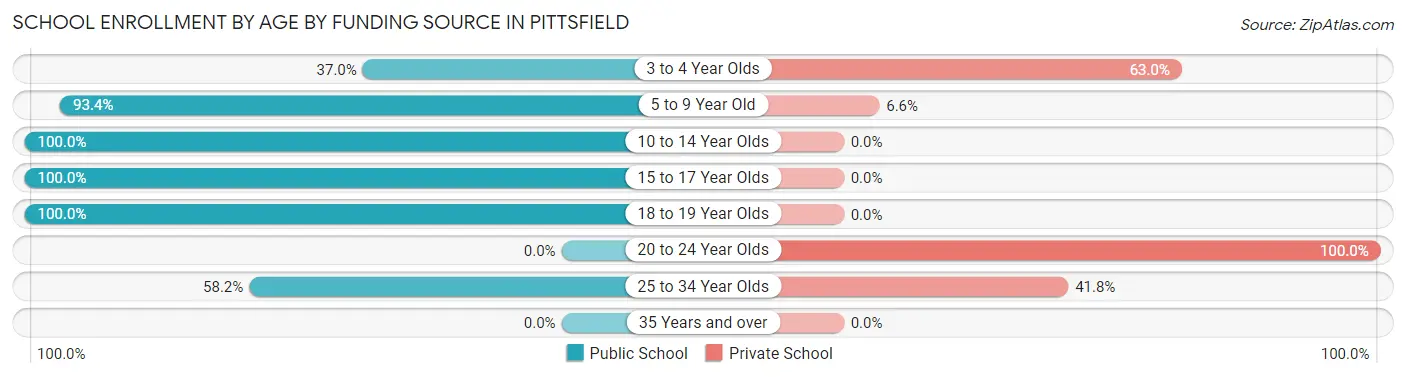
| Age Bracket | Public School | Private School |
| 3 to 4 Year Olds | 20 (37.0%) | 34 (63.0%) |
| 5 to 9 Year Old | 324 (93.4%) | 23 (6.6%) |
| 10 to 14 Year Olds | 239 (100.0%) | 0 (0.0%) |
| 15 to 17 Year Olds | 141 (100.0%) | 0 (0.0%) |
| 18 to 19 Year Olds | 14 (100.0%) | 0 (0.0%) |
| 20 to 24 Year Olds | 0 (0.0%) | 45 (100.0%) |
| 25 to 34 Year Olds | 32 (58.2%) | 23 (41.8%) |
| 35 Years and over | 0 (0.0%) | 0 (0.0%) |
| Total | 770 (86.0%) | 125 (14.0%) |
Educational Attainment by Field of Study in Pittsfield
Education (203 | 25.8%), business (181 | 23.0%), arts & humanities (123 | 15.7%), bio, nature & agricultural (69 | 8.8%), and computers & mathematics (39 | 5.0%) are the most common fields of study among 786 individuals in Pittsfield who have obtained a bachelor's degree or higher.
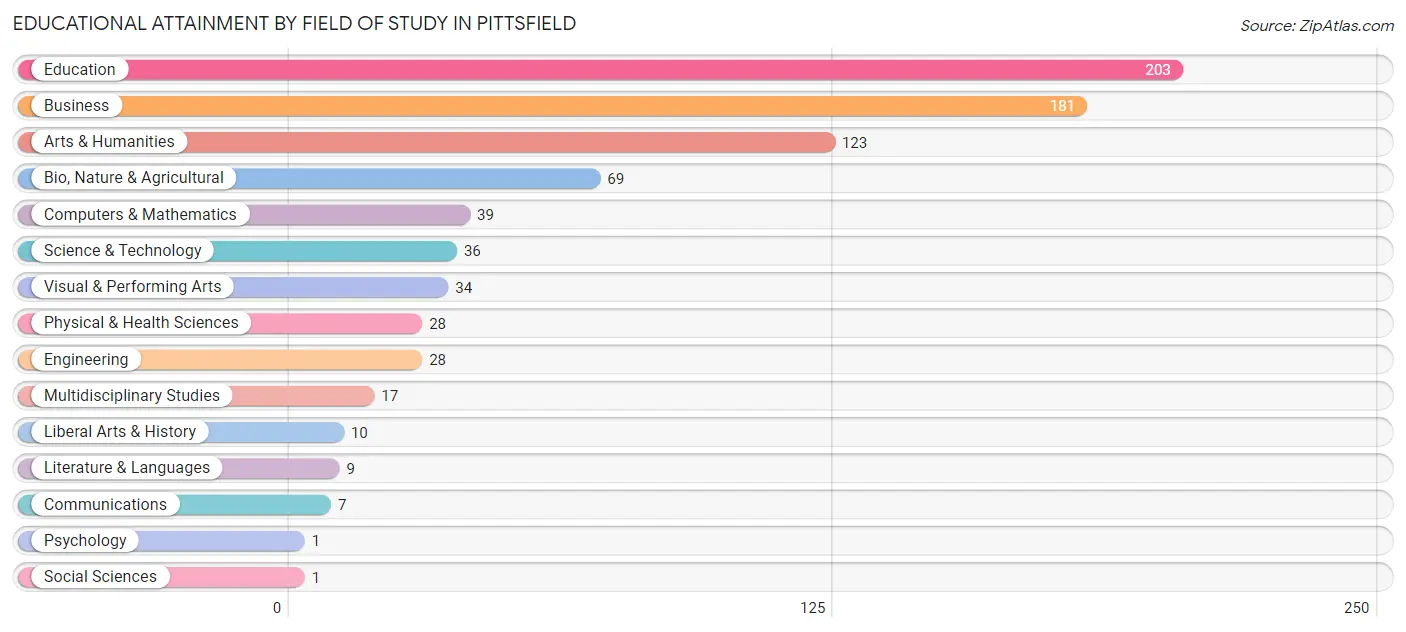
| Field of Study | # Graduates | % Graduates |
| Computers & Mathematics | 39 | 5.0% |
| Bio, Nature & Agricultural | 69 | 8.8% |
| Physical & Health Sciences | 28 | 3.6% |
| Psychology | 1 | 0.1% |
| Social Sciences | 1 | 0.1% |
| Engineering | 28 | 3.6% |
| Multidisciplinary Studies | 17 | 2.2% |
| Science & Technology | 36 | 4.6% |
| Business | 181 | 23.0% |
| Education | 203 | 25.8% |
| Literature & Languages | 9 | 1.1% |
| Liberal Arts & History | 10 | 1.3% |
| Visual & Performing Arts | 34 | 4.3% |
| Communications | 7 | 0.9% |
| Arts & Humanities | 123 | 15.7% |
| Total | 786 | 100.0% |
Transportation & Commute in Pittsfield
Vehicle Availability by Sex in Pittsfield
The most prevalent vehicle ownership categories in Pittsfield are males with 2 vehicles (404, accounting for 52.6%) and females with 2 vehicles (427, making up 49.3%).
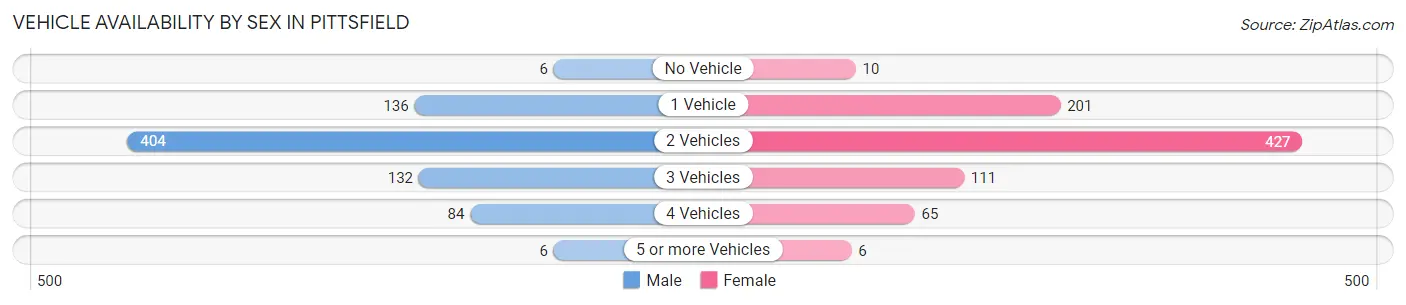
| Vehicles Available | Male | Female |
| No Vehicle | 6 (0.8%) | 10 (1.2%) |
| 1 Vehicle | 136 (17.7%) | 201 (24.5%) |
| 2 Vehicles | 404 (52.6%) | 427 (52.1%) |
| 3 Vehicles | 132 (17.2%) | 111 (13.5%) |
| 4 Vehicles | 84 (10.9%) | 65 (7.9%) |
| 5 or more Vehicles | 6 (0.8%) | 6 (0.7%) |
| Total | 768 (100.0%) | 820 (100.0%) |
Commute Time in Pittsfield
The most frequently occuring commute durations in Pittsfield are 5 to 9 minutes (519 commuters, 34.1%), less than 5 minutes (261 commuters, 17.2%), and 10 to 14 minutes (130 commuters, 8.6%).
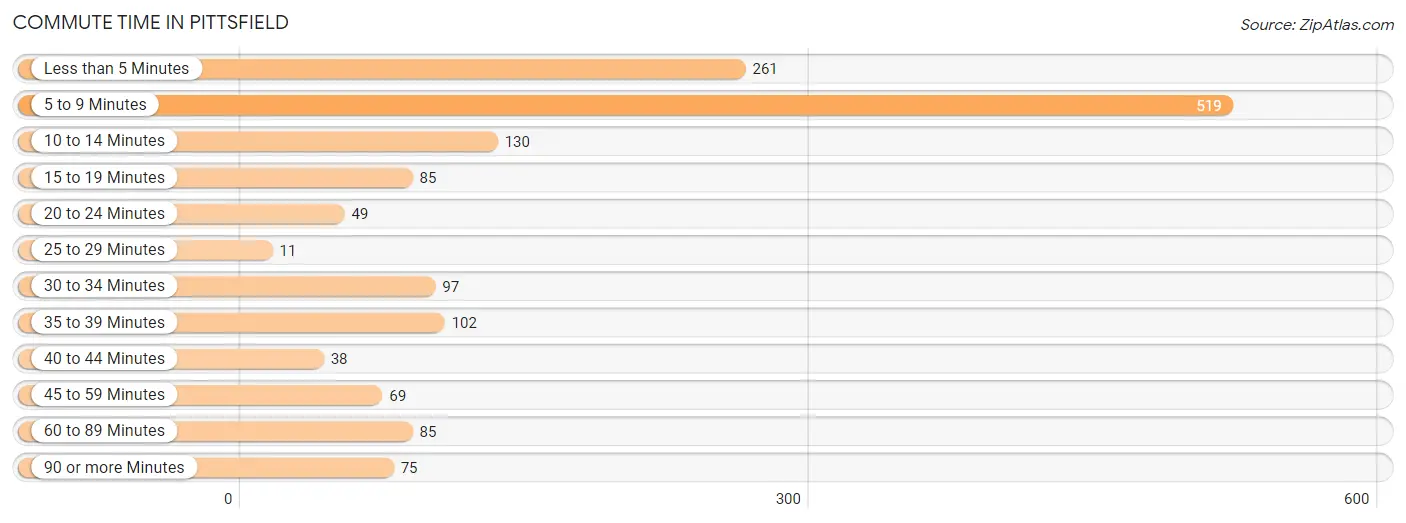
| Commute Time | # Commuters | % Commuters |
| Less than 5 Minutes | 261 | 17.2% |
| 5 to 9 Minutes | 519 | 34.1% |
| 10 to 14 Minutes | 130 | 8.6% |
| 15 to 19 Minutes | 85 | 5.6% |
| 20 to 24 Minutes | 49 | 3.2% |
| 25 to 29 Minutes | 11 | 0.7% |
| 30 to 34 Minutes | 97 | 6.4% |
| 35 to 39 Minutes | 102 | 6.7% |
| 40 to 44 Minutes | 38 | 2.5% |
| 45 to 59 Minutes | 69 | 4.5% |
| 60 to 89 Minutes | 85 | 5.6% |
| 90 or more Minutes | 75 | 4.9% |
Commute Time by Sex in Pittsfield
The most common commute times in Pittsfield are 5 to 9 minutes (188 commuters, 25.5%) for males and 5 to 9 minutes (331 commuters, 42.3%) for females.
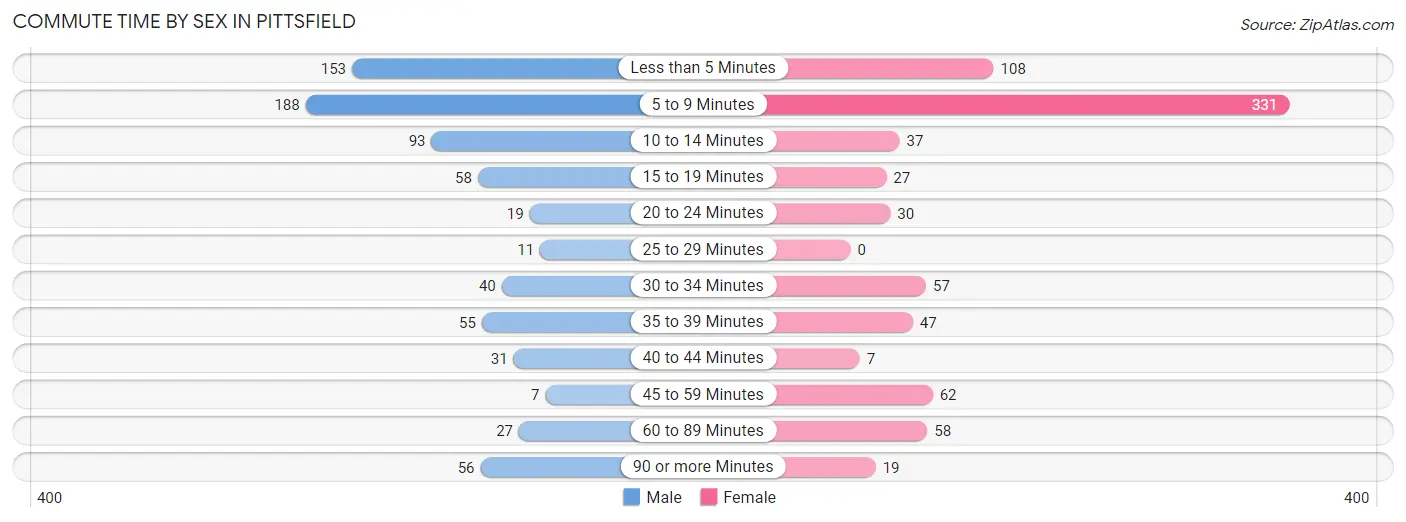
| Commute Time | Male | Female |
| Less than 5 Minutes | 153 (20.7%) | 108 (13.8%) |
| 5 to 9 Minutes | 188 (25.5%) | 331 (42.3%) |
| 10 to 14 Minutes | 93 (12.6%) | 37 (4.7%) |
| 15 to 19 Minutes | 58 (7.9%) | 27 (3.5%) |
| 20 to 24 Minutes | 19 (2.6%) | 30 (3.8%) |
| 25 to 29 Minutes | 11 (1.5%) | 0 (0.0%) |
| 30 to 34 Minutes | 40 (5.4%) | 57 (7.3%) |
| 35 to 39 Minutes | 55 (7.4%) | 47 (6.0%) |
| 40 to 44 Minutes | 31 (4.2%) | 7 (0.9%) |
| 45 to 59 Minutes | 7 (0.9%) | 62 (7.9%) |
| 60 to 89 Minutes | 27 (3.7%) | 58 (7.4%) |
| 90 or more Minutes | 56 (7.6%) | 19 (2.4%) |
Time of Departure to Work by Sex in Pittsfield
The most frequent times of departure to work in Pittsfield are 7:30 AM to 7:59 AM (134, 18.2%) for males and 7:30 AM to 7:59 AM (213, 27.2%) for females.
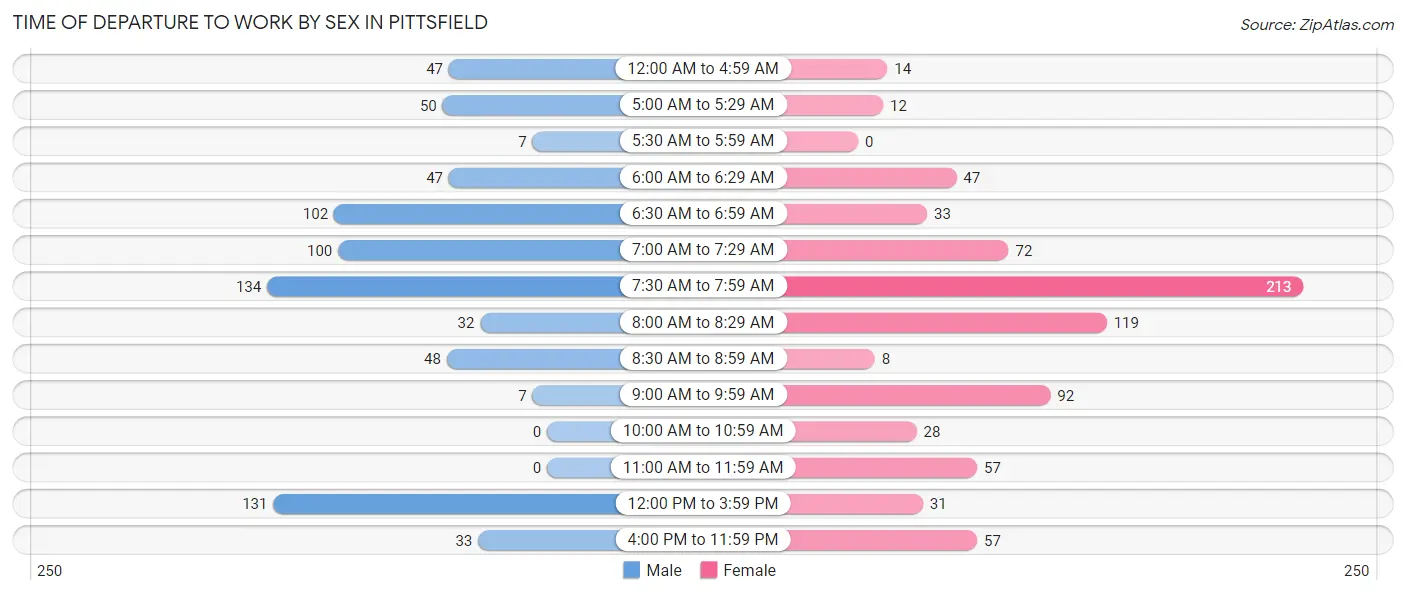
| Time of Departure | Male | Female |
| 12:00 AM to 4:59 AM | 47 (6.4%) | 14 (1.8%) |
| 5:00 AM to 5:29 AM | 50 (6.8%) | 12 (1.5%) |
| 5:30 AM to 5:59 AM | 7 (0.9%) | 0 (0.0%) |
| 6:00 AM to 6:29 AM | 47 (6.4%) | 47 (6.0%) |
| 6:30 AM to 6:59 AM | 102 (13.8%) | 33 (4.2%) |
| 7:00 AM to 7:29 AM | 100 (13.6%) | 72 (9.2%) |
| 7:30 AM to 7:59 AM | 134 (18.2%) | 213 (27.2%) |
| 8:00 AM to 8:29 AM | 32 (4.3%) | 119 (15.2%) |
| 8:30 AM to 8:59 AM | 48 (6.5%) | 8 (1.0%) |
| 9:00 AM to 9:59 AM | 7 (0.9%) | 92 (11.7%) |
| 10:00 AM to 10:59 AM | 0 (0.0%) | 28 (3.6%) |
| 11:00 AM to 11:59 AM | 0 (0.0%) | 57 (7.3%) |
| 12:00 PM to 3:59 PM | 131 (17.7%) | 31 (4.0%) |
| 4:00 PM to 11:59 PM | 33 (4.5%) | 57 (7.3%) |
| Total | 738 (100.0%) | 783 (100.0%) |
Housing Occupancy in Pittsfield
Occupancy by Ownership in Pittsfield
Of the total 1,759 dwellings in Pittsfield, owner-occupied units account for 1,340 (76.2%), while renter-occupied units make up 419 (23.8%).
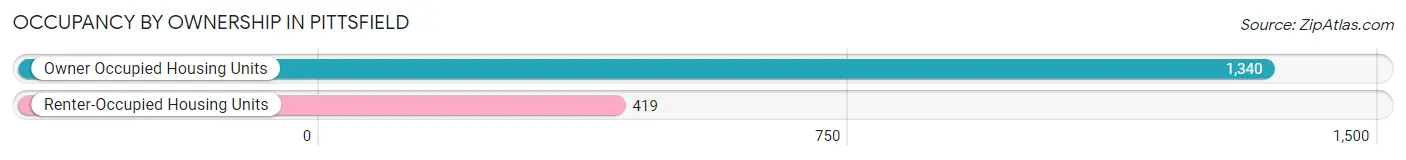
| Occupancy | # Housing Units | % Housing Units |
| Owner Occupied Housing Units | 1,340 | 76.2% |
| Renter-Occupied Housing Units | 419 | 23.8% |
| Total Occupied Housing Units | 1,759 | 100.0% |
Occupancy by Household Size in Pittsfield
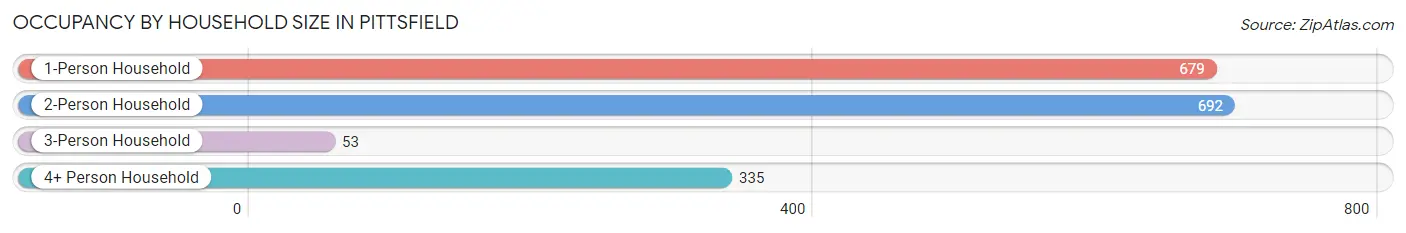
| Household Size | # Housing Units | % Housing Units |
| 1-Person Household | 679 | 38.6% |
| 2-Person Household | 692 | 39.3% |
| 3-Person Household | 53 | 3.0% |
| 4+ Person Household | 335 | 19.0% |
| Total Housing Units | 1,759 | 100.0% |
Occupancy by Ownership by Household Size in Pittsfield
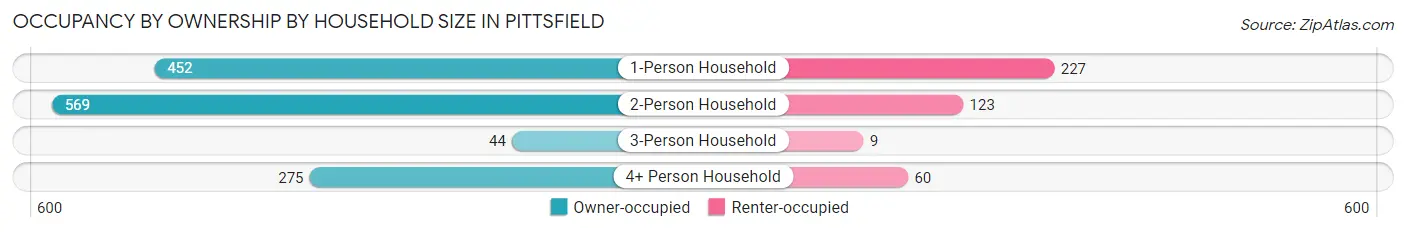
| Household Size | Owner-occupied | Renter-occupied |
| 1-Person Household | 452 (66.6%) | 227 (33.4%) |
| 2-Person Household | 569 (82.2%) | 123 (17.8%) |
| 3-Person Household | 44 (83.0%) | 9 (17.0%) |
| 4+ Person Household | 275 (82.1%) | 60 (17.9%) |
| Total Housing Units | 1,340 (76.2%) | 419 (23.8%) |
Occupancy by Educational Attainment in Pittsfield
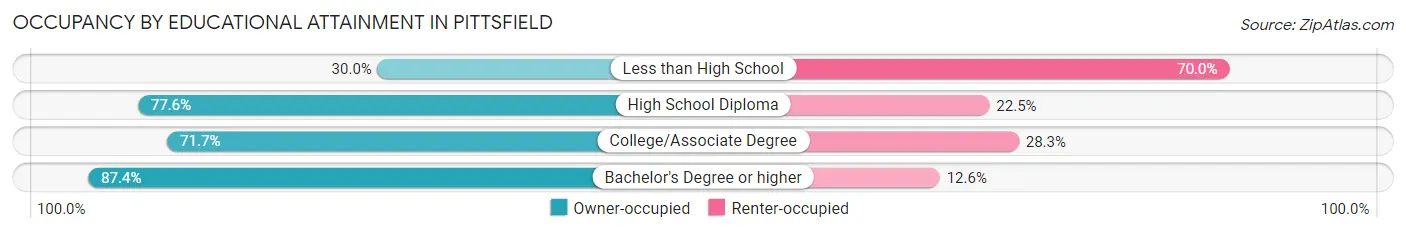
| Household Size | Owner-occupied | Renter-occupied |
| Less than High School | 27 (30.0%) | 63 (70.0%) |
| High School Diploma | 449 (77.5%) | 130 (22.5%) |
| College/Associate Degree | 406 (71.7%) | 160 (28.3%) |
| Bachelor's Degree or higher | 458 (87.4%) | 66 (12.6%) |
Occupancy by Age of Householder in Pittsfield
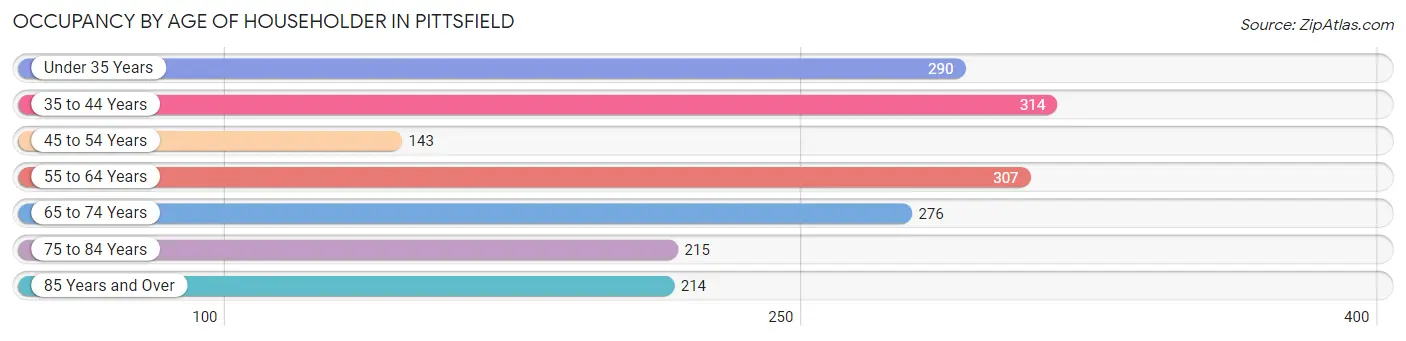
| Age Bracket | # Households | % Households |
| Under 35 Years | 290 | 16.5% |
| 35 to 44 Years | 314 | 17.8% |
| 45 to 54 Years | 143 | 8.1% |
| 55 to 64 Years | 307 | 17.4% |
| 65 to 74 Years | 276 | 15.7% |
| 75 to 84 Years | 215 | 12.2% |
| 85 Years and Over | 214 | 12.2% |
| Total | 1,759 | 100.0% |
Housing Finances in Pittsfield
Median Income by Occupancy in Pittsfield
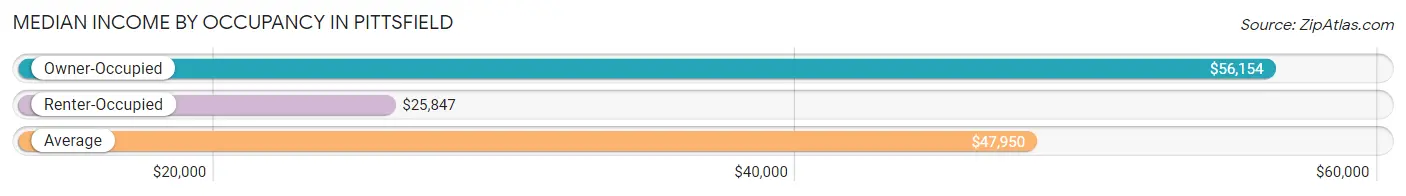
| Occupancy Type | # Households | Median Income |
| Owner-Occupied | 1,340 (76.2%) | $56,154 |
| Renter-Occupied | 419 (23.8%) | $25,847 |
| Average | 1,759 (100.0%) | $47,950 |
Occupancy by Householder Income Bracket in Pittsfield
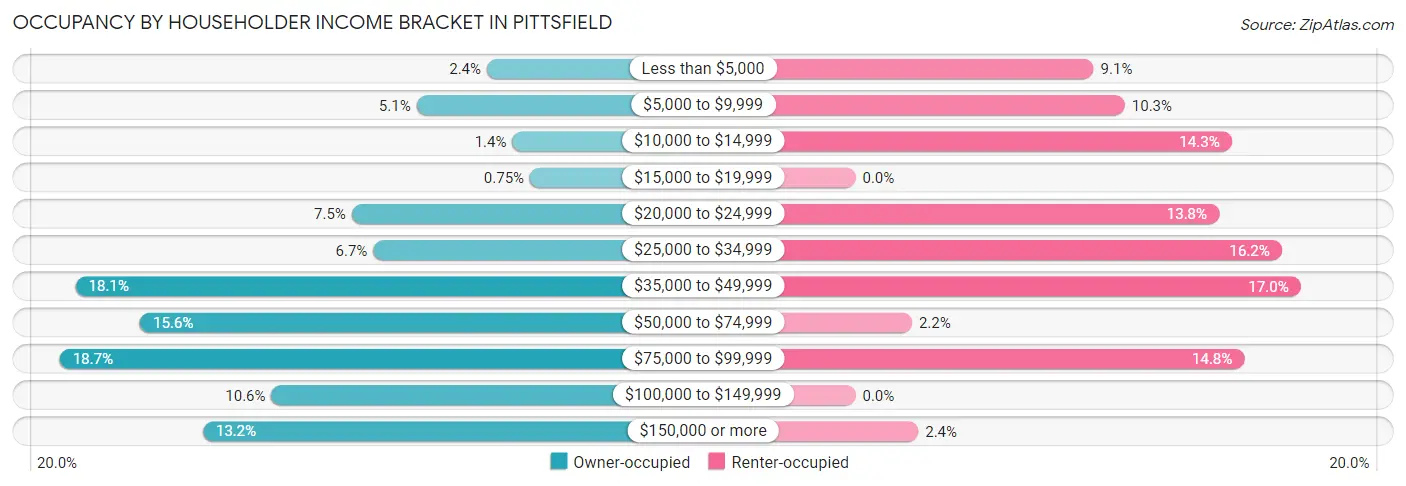
| Income Bracket | Owner-occupied | Renter-occupied |
| Less than $5,000 | 32 (2.4%) | 38 (9.1%) |
| $5,000 to $9,999 | 68 (5.1%) | 43 (10.3%) |
| $10,000 to $14,999 | 19 (1.4%) | 60 (14.3%) |
| $15,000 to $19,999 | 10 (0.7%) | 0 (0.0%) |
| $20,000 to $24,999 | 101 (7.5%) | 58 (13.8%) |
| $25,000 to $34,999 | 90 (6.7%) | 68 (16.2%) |
| $35,000 to $49,999 | 242 (18.1%) | 71 (17.0%) |
| $50,000 to $74,999 | 209 (15.6%) | 9 (2.1%) |
| $75,000 to $99,999 | 250 (18.7%) | 62 (14.8%) |
| $100,000 to $149,999 | 142 (10.6%) | 0 (0.0%) |
| $150,000 or more | 177 (13.2%) | 10 (2.4%) |
| Total | 1,340 (100.0%) | 419 (100.0%) |
Monthly Housing Cost Tiers in Pittsfield
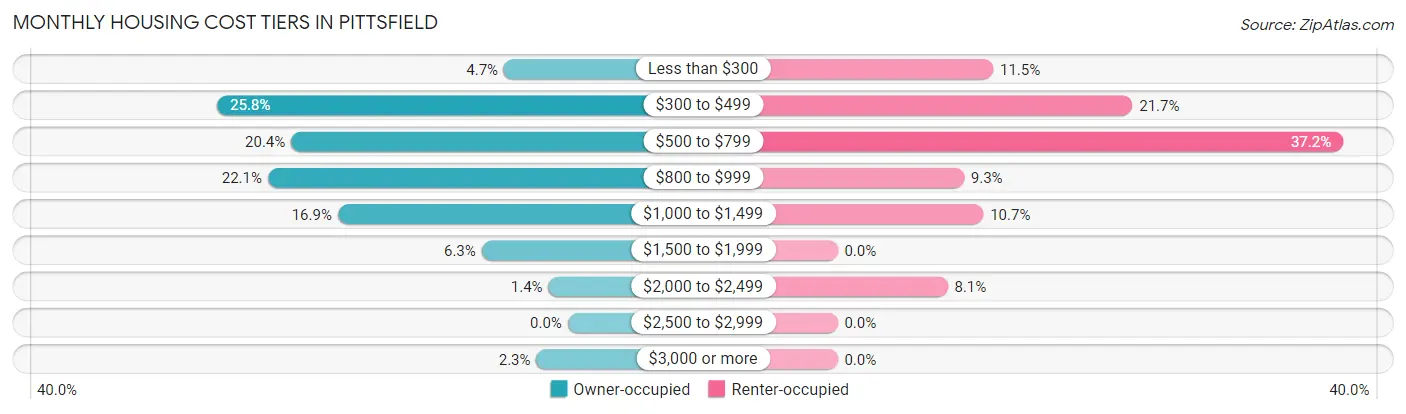
| Monthly Cost | Owner-occupied | Renter-occupied |
| Less than $300 | 63 (4.7%) | 48 (11.5%) |
| $300 to $499 | 346 (25.8%) | 91 (21.7%) |
| $500 to $799 | 273 (20.4%) | 156 (37.2%) |
| $800 to $999 | 296 (22.1%) | 39 (9.3%) |
| $1,000 to $1,499 | 227 (16.9%) | 45 (10.7%) |
| $1,500 to $1,999 | 85 (6.3%) | 0 (0.0%) |
| $2,000 to $2,499 | 19 (1.4%) | 34 (8.1%) |
| $2,500 to $2,999 | 0 (0.0%) | 0 (0.0%) |
| $3,000 or more | 31 (2.3%) | 0 (0.0%) |
| Total | 1,340 (100.0%) | 419 (100.0%) |
Physical Housing Characteristics in Pittsfield
Housing Structures in Pittsfield
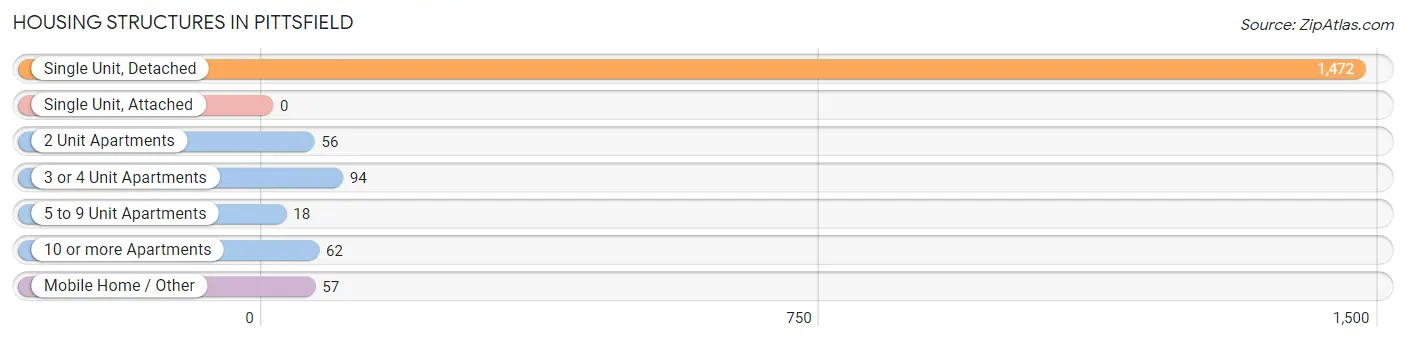
| Structure Type | # Housing Units | % Housing Units |
| Single Unit, Detached | 1,472 | 83.7% |
| Single Unit, Attached | 0 | 0.0% |
| 2 Unit Apartments | 56 | 3.2% |
| 3 or 4 Unit Apartments | 94 | 5.3% |
| 5 to 9 Unit Apartments | 18 | 1.0% |
| 10 or more Apartments | 62 | 3.5% |
| Mobile Home / Other | 57 | 3.2% |
| Total | 1,759 | 100.0% |
Housing Structures by Occupancy in Pittsfield
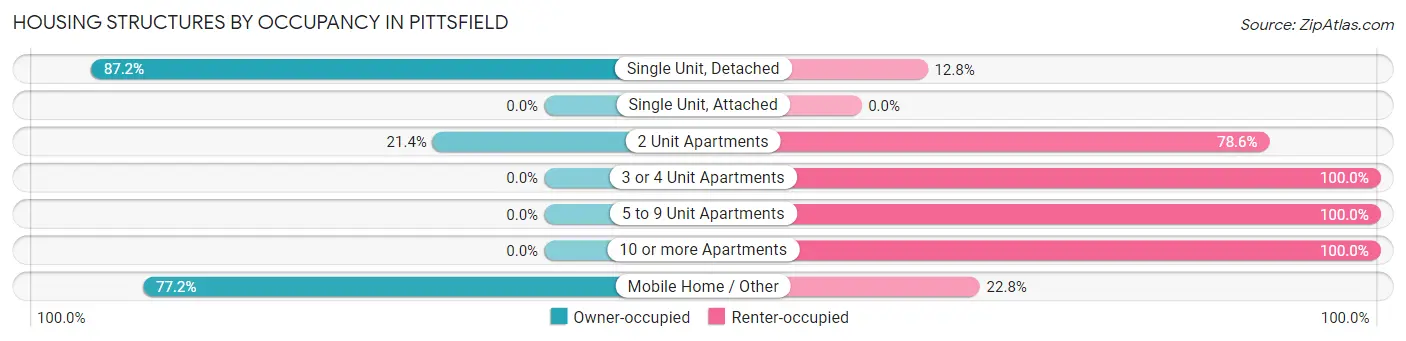
| Structure Type | Owner-occupied | Renter-occupied |
| Single Unit, Detached | 1,284 (87.2%) | 188 (12.8%) |
| Single Unit, Attached | 0 (0.0%) | 0 (0.0%) |
| 2 Unit Apartments | 12 (21.4%) | 44 (78.6%) |
| 3 or 4 Unit Apartments | 0 (0.0%) | 94 (100.0%) |
| 5 to 9 Unit Apartments | 0 (0.0%) | 18 (100.0%) |
| 10 or more Apartments | 0 (0.0%) | 62 (100.0%) |
| Mobile Home / Other | 44 (77.2%) | 13 (22.8%) |
| Total | 1,340 (76.2%) | 419 (23.8%) |
Housing Structures by Number of Rooms in Pittsfield
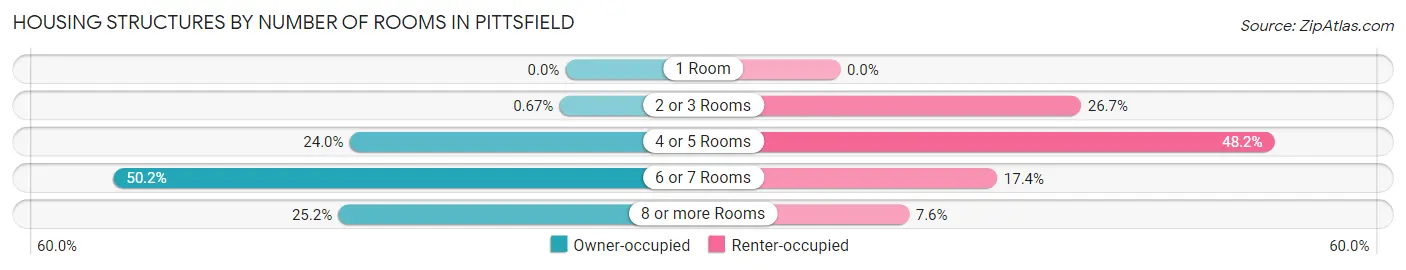
| Number of Rooms | Owner-occupied | Renter-occupied |
| 1 Room | 0 (0.0%) | 0 (0.0%) |
| 2 or 3 Rooms | 9 (0.7%) | 112 (26.7%) |
| 4 or 5 Rooms | 321 (24.0%) | 202 (48.2%) |
| 6 or 7 Rooms | 672 (50.1%) | 73 (17.4%) |
| 8 or more Rooms | 338 (25.2%) | 32 (7.6%) |
| Total | 1,340 (100.0%) | 419 (100.0%) |
Housing Structure by Heating Type in Pittsfield
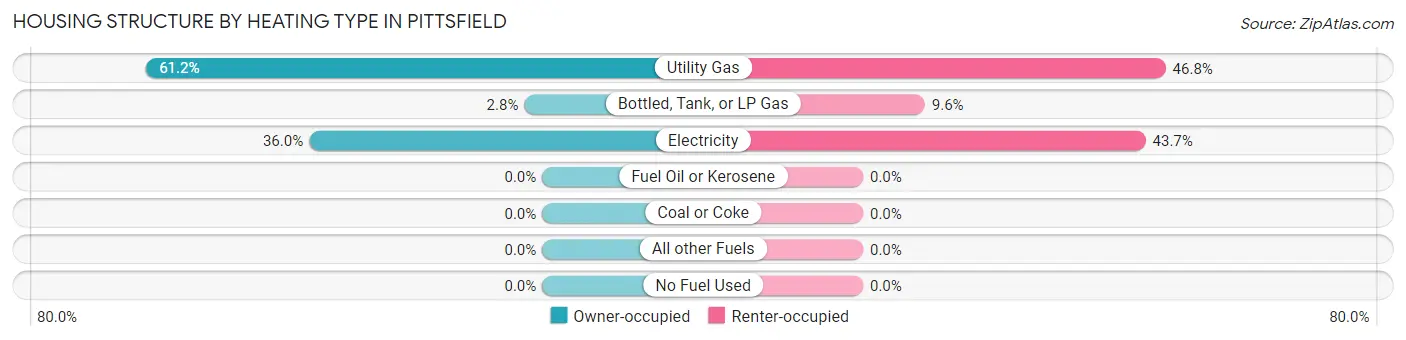
| Heating Type | Owner-occupied | Renter-occupied |
| Utility Gas | 820 (61.2%) | 196 (46.8%) |
| Bottled, Tank, or LP Gas | 37 (2.8%) | 40 (9.6%) |
| Electricity | 483 (36.0%) | 183 (43.7%) |
| Fuel Oil or Kerosene | 0 (0.0%) | 0 (0.0%) |
| Coal or Coke | 0 (0.0%) | 0 (0.0%) |
| All other Fuels | 0 (0.0%) | 0 (0.0%) |
| No Fuel Used | 0 (0.0%) | 0 (0.0%) |
| Total | 1,340 (100.0%) | 419 (100.0%) |
Household Vehicle Usage in Pittsfield
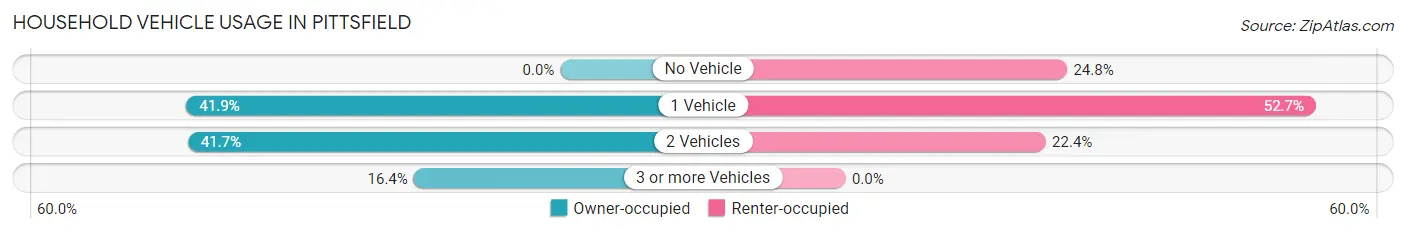
| Vehicles per Household | Owner-occupied | Renter-occupied |
| No Vehicle | 0 (0.0%) | 104 (24.8%) |
| 1 Vehicle | 561 (41.9%) | 221 (52.7%) |
| 2 Vehicles | 559 (41.7%) | 94 (22.4%) |
| 3 or more Vehicles | 220 (16.4%) | 0 (0.0%) |
| Total | 1,340 (100.0%) | 419 (100.0%) |
Real Estate & Mortgages in Pittsfield
Real Estate and Mortgage Overview in Pittsfield
| Characteristic | Without Mortgage | With Mortgage |
| Housing Units | 609 | 731 |
| Median Property Value | $110,100 | $103,500 |
| Median Household Income | $48,150 | $119 |
| Monthly Housing Costs | $449 | $31 |
| Real Estate Taxes | $1,372 | $18 |
Property Value by Mortgage Status in Pittsfield
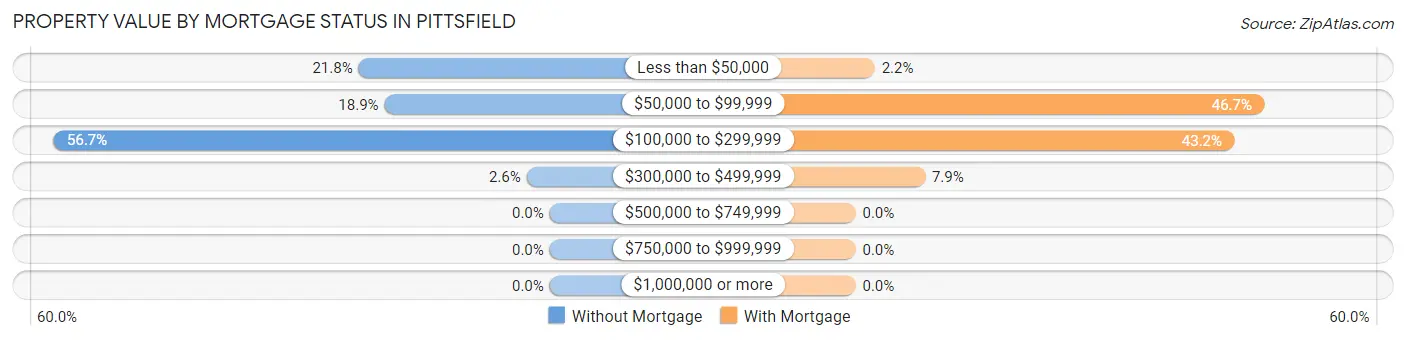
| Property Value | Without Mortgage | With Mortgage |
| Less than $50,000 | 133 (21.8%) | 16 (2.2%) |
| $50,000 to $99,999 | 115 (18.9%) | 341 (46.7%) |
| $100,000 to $299,999 | 345 (56.7%) | 316 (43.2%) |
| $300,000 to $499,999 | 16 (2.6%) | 58 (7.9%) |
| $500,000 to $749,999 | 0 (0.0%) | 0 (0.0%) |
| $750,000 to $999,999 | 0 (0.0%) | 0 (0.0%) |
| $1,000,000 or more | 0 (0.0%) | 0 (0.0%) |
| Total | 609 (100.0%) | 731 (100.0%) |
Household Income by Mortgage Status in Pittsfield
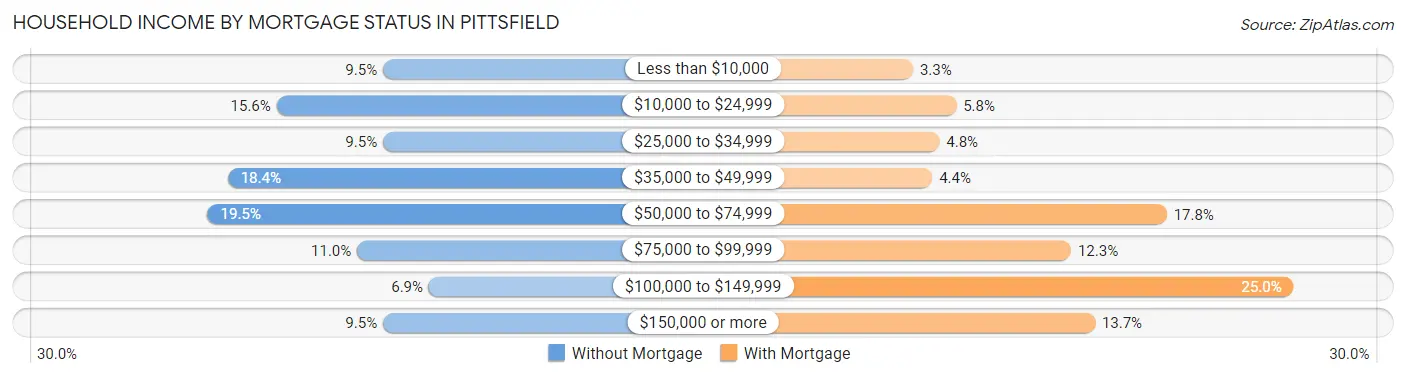
| Household Income | Without Mortgage | With Mortgage |
| Less than $10,000 | 58 (9.5%) | 24 (3.3%) |
| $10,000 to $24,999 | 95 (15.6%) | 42 (5.8%) |
| $25,000 to $34,999 | 58 (9.5%) | 35 (4.8%) |
| $35,000 to $49,999 | 112 (18.4%) | 32 (4.4%) |
| $50,000 to $74,999 | 119 (19.5%) | 130 (17.8%) |
| $75,000 to $99,999 | 67 (11.0%) | 90 (12.3%) |
| $100,000 to $149,999 | 42 (6.9%) | 183 (25.0%) |
| $150,000 or more | 58 (9.5%) | 100 (13.7%) |
| Total | 609 (100.0%) | 731 (100.0%) |
Property Value to Household Income Ratio in Pittsfield
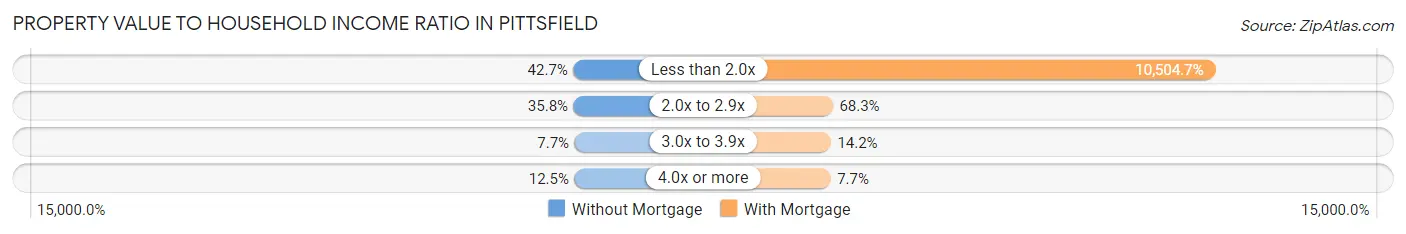
| Value-to-Income Ratio | Without Mortgage | With Mortgage |
| Less than 2.0x | 260 (42.7%) | 76,789 (10,504.6%) |
| 2.0x to 2.9x | 218 (35.8%) | 499 (68.3%) |
| 3.0x to 3.9x | 47 (7.7%) | 104 (14.2%) |
| 4.0x or more | 76 (12.5%) | 56 (7.7%) |
| Total | 609 (100.0%) | 731 (100.0%) |
Real Estate Taxes by Mortgage Status in Pittsfield
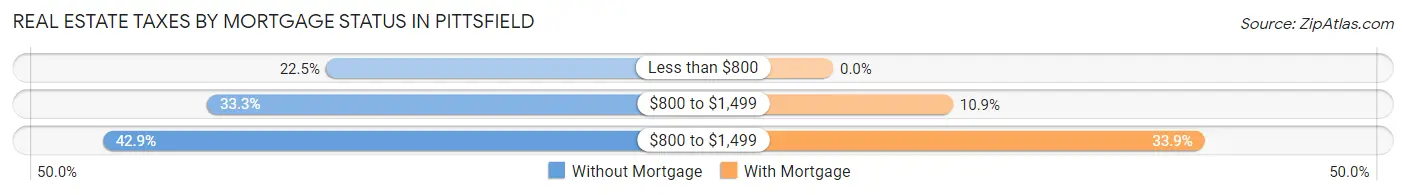
| Property Taxes | Without Mortgage | With Mortgage |
| Less than $800 | 137 (22.5%) | 0 (0.0%) |
| $800 to $1,499 | 203 (33.3%) | 80 (10.9%) |
| $800 to $1,499 | 261 (42.9%) | 248 (33.9%) |
| Total | 609 (100.0%) | 731 (100.0%) |
Health & Disability in Pittsfield
Health Insurance Coverage by Age in Pittsfield
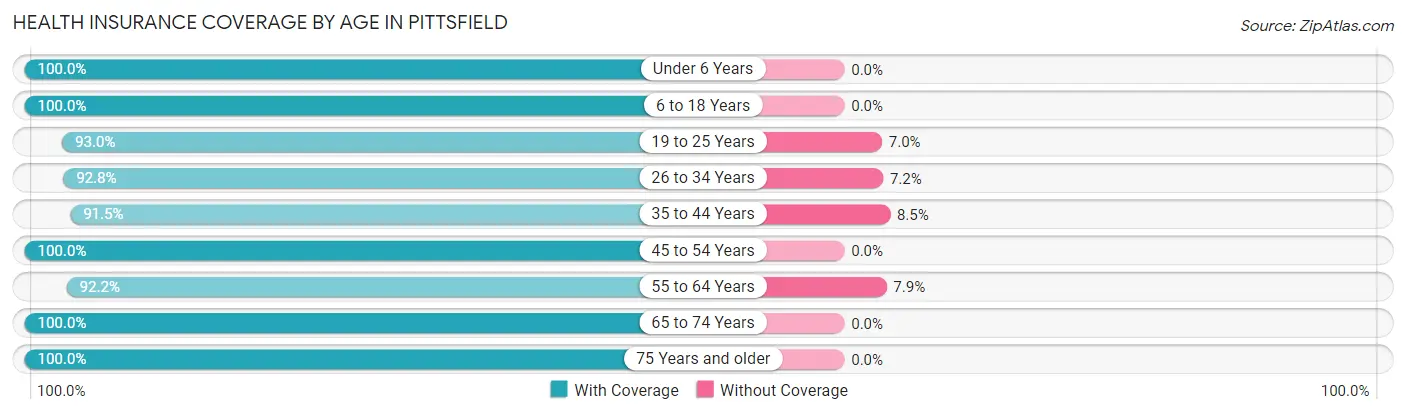
| Age Bracket | With Coverage | Without Coverage |
| Under 6 Years | 272 (100.0%) | 0 (0.0%) |
| 6 to 18 Years | 618 (100.0%) | 0 (0.0%) |
| 19 to 25 Years | 186 (93.0%) | 14 (7.0%) |
| 26 to 34 Years | 412 (92.8%) | 32 (7.2%) |
| 35 to 44 Years | 473 (91.5%) | 44 (8.5%) |
| 45 to 54 Years | 244 (100.0%) | 0 (0.0%) |
| 55 to 64 Years | 552 (92.1%) | 47 (7.9%) |
| 65 to 74 Years | 433 (100.0%) | 0 (0.0%) |
| 75 Years and older | 547 (100.0%) | 0 (0.0%) |
| Total | 3,737 (96.5%) | 137 (3.5%) |
Health Insurance Coverage by Citizenship Status in Pittsfield
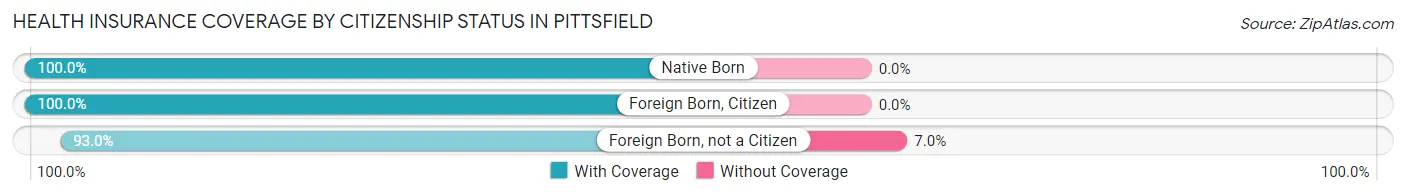
| Citizenship Status | With Coverage | Without Coverage |
| Native Born | 272 (100.0%) | 0 (0.0%) |
| Foreign Born, Citizen | 618 (100.0%) | 0 (0.0%) |
| Foreign Born, not a Citizen | 186 (93.0%) | 14 (7.0%) |
Health Insurance Coverage by Household Income in Pittsfield
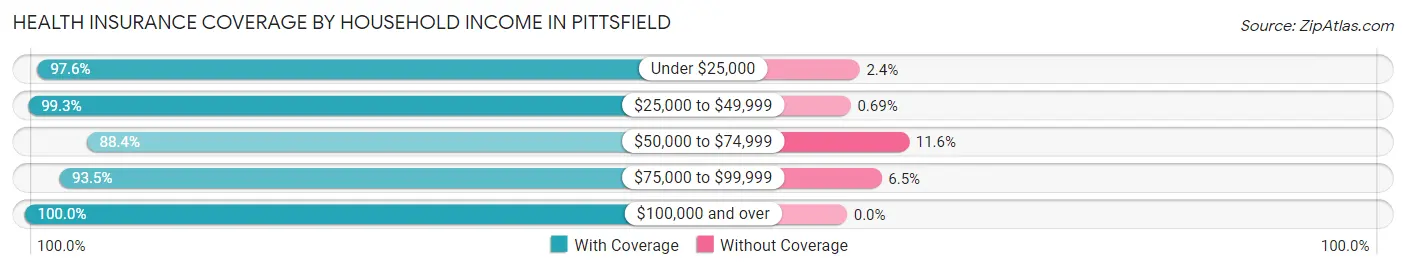
| Household Income | With Coverage | Without Coverage |
| Under $25,000 | 536 (97.6%) | 13 (2.4%) |
| $25,000 to $49,999 | 867 (99.3%) | 6 (0.7%) |
| $50,000 to $74,999 | 434 (88.4%) | 57 (11.6%) |
| $75,000 to $99,999 | 882 (93.5%) | 61 (6.5%) |
| $100,000 and over | 999 (100.0%) | 0 (0.0%) |
Public vs Private Health Insurance Coverage by Age in Pittsfield
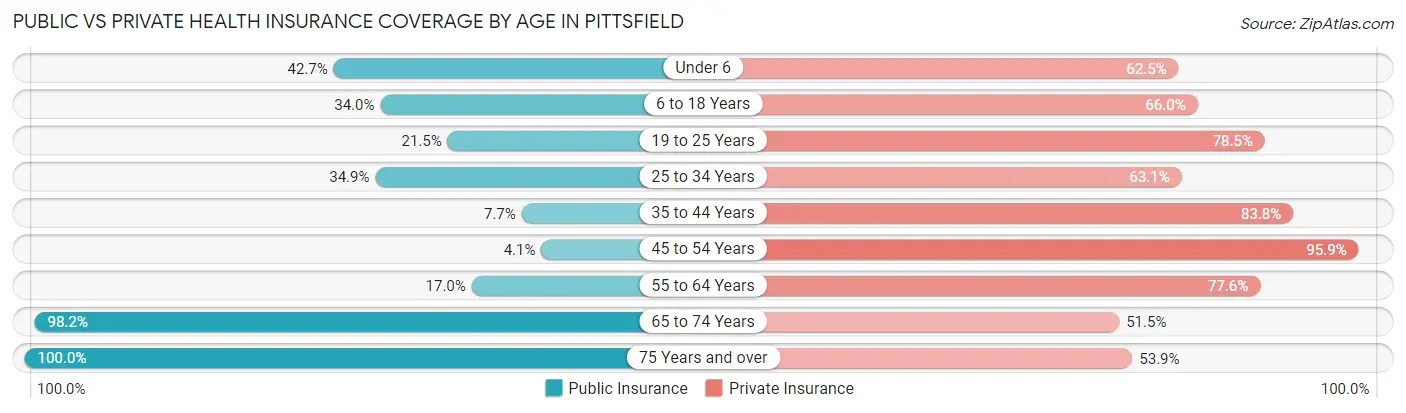
| Age Bracket | Public Insurance | Private Insurance |
| Under 6 | 116 (42.6%) | 170 (62.5%) |
| 6 to 18 Years | 210 (34.0%) | 408 (66.0%) |
| 19 to 25 Years | 43 (21.5%) | 157 (78.5%) |
| 25 to 34 Years | 155 (34.9%) | 280 (63.1%) |
| 35 to 44 Years | 40 (7.7%) | 433 (83.8%) |
| 45 to 54 Years | 10 (4.1%) | 234 (95.9%) |
| 55 to 64 Years | 102 (17.0%) | 465 (77.6%) |
| 65 to 74 Years | 425 (98.2%) | 223 (51.5%) |
| 75 Years and over | 547 (100.0%) | 295 (53.9%) |
| Total | 1,648 (42.5%) | 2,665 (68.8%) |
Disability Status by Sex by Age in Pittsfield
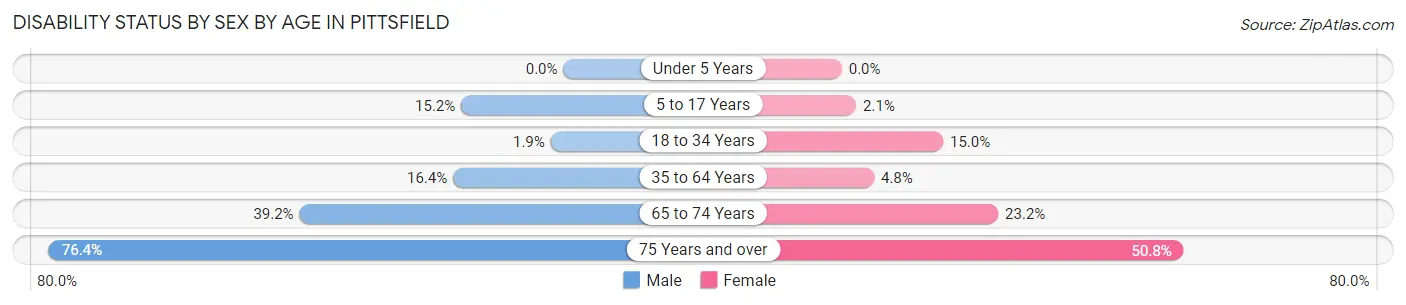
| Age Bracket | Male | Female |
| Under 5 Years | 0 (0.0%) | 0 (0.0%) |
| 5 to 17 Years | 39 (15.2%) | 10 (2.1%) |
| 18 to 34 Years | 6 (1.9%) | 49 (15.0%) |
| 35 to 64 Years | 103 (16.4%) | 35 (4.8%) |
| 65 to 74 Years | 87 (39.2%) | 49 (23.2%) |
| 75 Years and over | 165 (76.4%) | 168 (50.8%) |
Disability Class by Sex by Age in Pittsfield
Disability Class: Hearing Difficulty
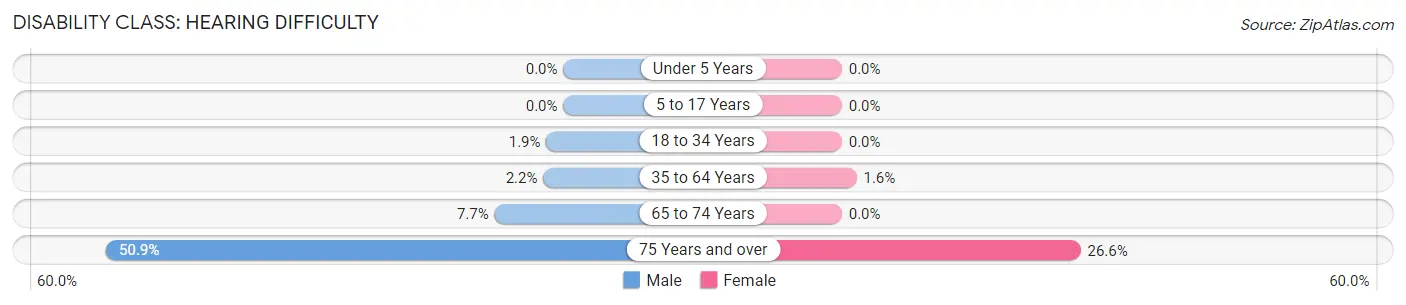
| Age Bracket | Male | Female |
| Under 5 Years | 0 (0.0%) | 0 (0.0%) |
| 5 to 17 Years | 0 (0.0%) | 0 (0.0%) |
| 18 to 34 Years | 6 (1.9%) | 0 (0.0%) |
| 35 to 64 Years | 14 (2.2%) | 12 (1.6%) |
| 65 to 74 Years | 17 (7.7%) | 0 (0.0%) |
| 75 Years and over | 110 (50.9%) | 88 (26.6%) |
Disability Class: Vision Difficulty
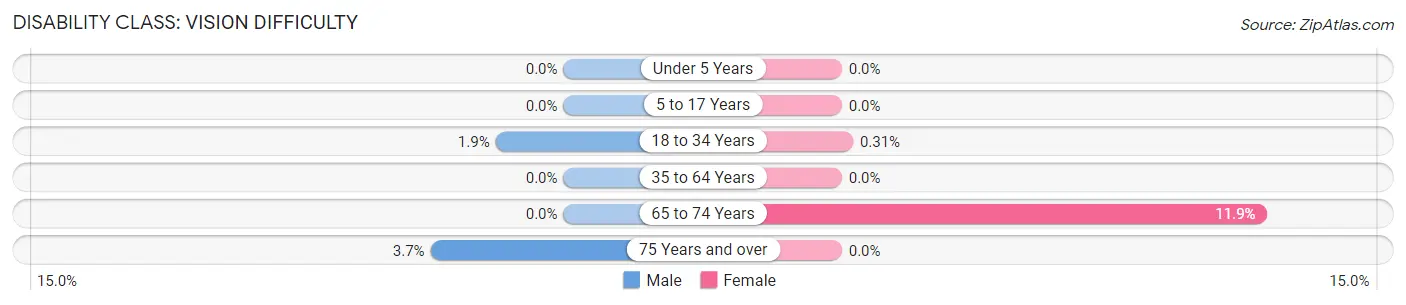
| Age Bracket | Male | Female |
| Under 5 Years | 0 (0.0%) | 0 (0.0%) |
| 5 to 17 Years | 0 (0.0%) | 0 (0.0%) |
| 18 to 34 Years | 6 (1.9%) | 1 (0.3%) |
| 35 to 64 Years | 0 (0.0%) | 0 (0.0%) |
| 65 to 74 Years | 0 (0.0%) | 25 (11.8%) |
| 75 Years and over | 8 (3.7%) | 0 (0.0%) |
Disability Class: Cognitive Difficulty
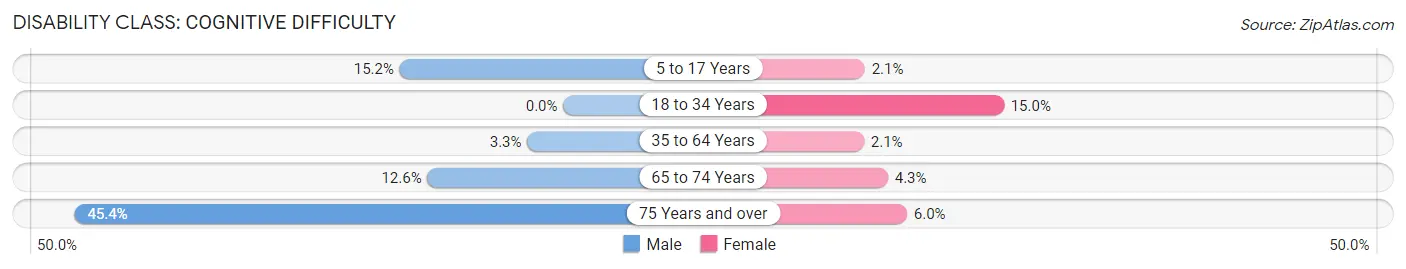
| Age Bracket | Male | Female |
| 5 to 17 Years | 39 (15.2%) | 10 (2.1%) |
| 18 to 34 Years | 0 (0.0%) | 49 (15.0%) |
| 35 to 64 Years | 21 (3.3%) | 15 (2.1%) |
| 65 to 74 Years | 28 (12.6%) | 9 (4.3%) |
| 75 Years and over | 98 (45.4%) | 20 (6.0%) |
Disability Class: Ambulatory Difficulty
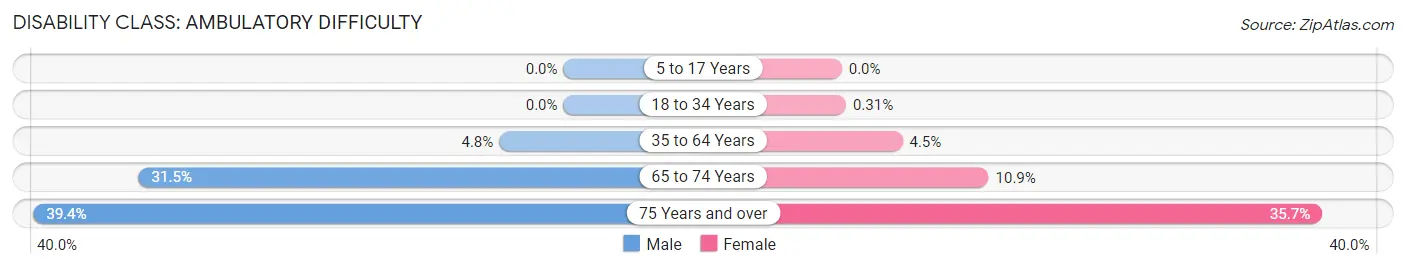
| Age Bracket | Male | Female |
| 5 to 17 Years | 0 (0.0%) | 0 (0.0%) |
| 18 to 34 Years | 0 (0.0%) | 1 (0.3%) |
| 35 to 64 Years | 30 (4.8%) | 33 (4.5%) |
| 65 to 74 Years | 70 (31.5%) | 23 (10.9%) |
| 75 Years and over | 85 (39.4%) | 118 (35.6%) |
Disability Class: Self-Care Difficulty
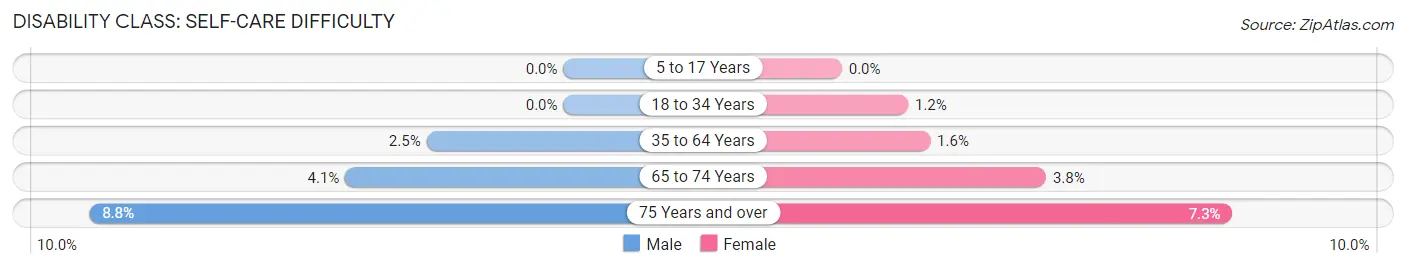
| Age Bracket | Male | Female |
| 5 to 17 Years | 0 (0.0%) | 0 (0.0%) |
| 18 to 34 Years | 0 (0.0%) | 4 (1.2%) |
| 35 to 64 Years | 16 (2.5%) | 12 (1.6%) |
| 65 to 74 Years | 9 (4.1%) | 8 (3.8%) |
| 75 Years and over | 19 (8.8%) | 24 (7.2%) |
Technology Access in Pittsfield
Computing Device Access in Pittsfield
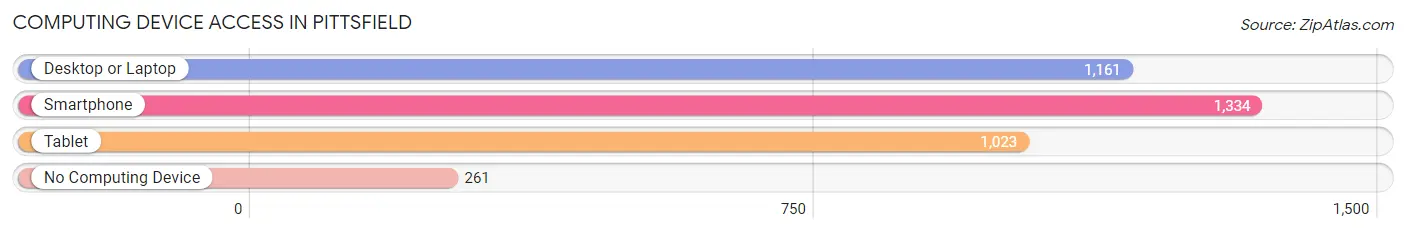
| Device Type | # Households | % Households |
| Desktop or Laptop | 1,161 | 66.0% |
| Smartphone | 1,334 | 75.8% |
| Tablet | 1,023 | 58.2% |
| No Computing Device | 261 | 14.8% |
| Total | 1,759 | 100.0% |
Internet Access in Pittsfield
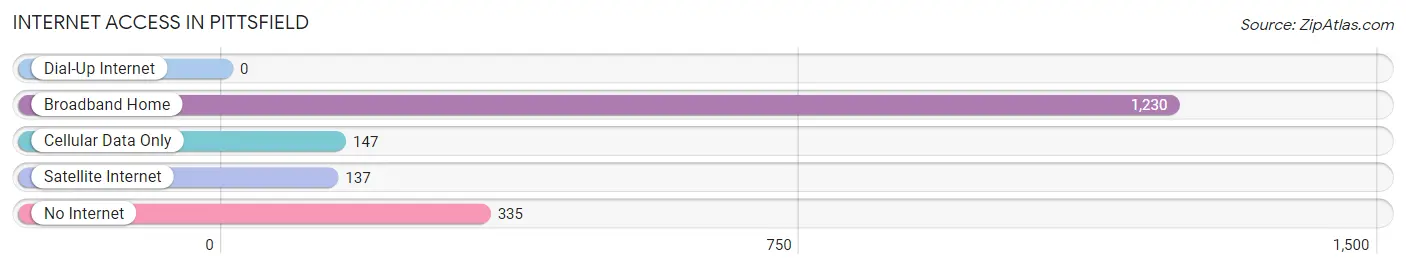
| Internet Type | # Households | % Households |
| Dial-Up Internet | 0 | 0.0% |
| Broadband Home | 1,230 | 69.9% |
| Cellular Data Only | 147 | 8.4% |
| Satellite Internet | 137 | 7.8% |
| No Internet | 335 | 19.0% |
| Total | 1,759 | 100.0% |
Pittsfield Summary
Pittsfield, Illinois is a small city located in Pike County, Illinois. It is the county seat of Pike County and is located in the western part of the state, about 90 miles northwest of St. Louis, Missouri. The city has a population of about 4,500 people and is the largest city in Pike County.
History
Pittsfield was founded in 1825 by William Pitts, a settler from Kentucky. The city was named after him and was incorporated in 1837. The city was an important stop on the Underground Railroad, and many escaped slaves passed through the city on their way to freedom.
In the late 19th century, Pittsfield was a major center for the coal mining industry. The city was home to several coal mines, and the coal industry was the main source of employment for the city’s residents. The coal industry declined in the early 20th century, and the city’s economy shifted to agriculture and manufacturing.
Geography
Pittsfield is located in western Illinois, about 90 miles northwest of St. Louis, Missouri. The city is situated in the Illinois River Valley, and the city is surrounded by rolling hills and farmland. The city is located at the intersection of U.S. Route 54 and Illinois Route 106.
The climate in Pittsfield is typical of the Midwest, with hot summers and cold winters. The average annual temperature is around 50 degrees Fahrenheit, and the average annual precipitation is around 40 inches.
Economy
The economy of Pittsfield is largely based on agriculture and manufacturing. The city is home to several manufacturing companies, including a plastics manufacturer, a metal fabricator, and a food processing plant. The city is also home to several agricultural businesses, including a dairy farm, a grain elevator, and a feed mill.
The city is also home to several retail businesses, including a grocery store, a hardware store, and several restaurants. The city is also home to several banks and financial institutions.
Demographics
As of the 2010 census, the population of Pittsfield was 4,497. The racial makeup of the city was 97.2% White, 0.7% African American, 0.3% Native American, 0.3% Asian, 0.1% Pacific Islander, 0.4% from other races, and 1.0% from two or more races. Hispanic or Latino of any race were 1.3% of the population.
The median household income in Pittsfield was $37,917, and the median family income was $45,938. The per capita income for the city was $19,945. About 11.2% of families and 14.2% of the population were below the poverty line, including 19.2% of those under age 18 and 8.2% of those age 65 or over.
Common Questions
What is Per Capita Income in Pittsfield?
Per Capita income in Pittsfield is $28,896.
What is the Median Family Income in Pittsfield?
Median Family Income in Pittsfield is $77,063.
What is the Median Household income in Pittsfield?
Median Household Income in Pittsfield is $47,950.
What is Income or Wage Gap in Pittsfield?
Income or Wage Gap in Pittsfield is 33.8%.
Women in Pittsfield earn 66.2 cents for every dollar earned by a man.
What is Inequality or Gini Index in Pittsfield?
Inequality or Gini Index in Pittsfield is 0.43.
What is the Total Population of Pittsfield?
Total Population of Pittsfield is 4,152.
What is the Total Male Population of Pittsfield?
Total Male Population of Pittsfield is 1,889.
What is the Total Female Population of Pittsfield?
Total Female Population of Pittsfield is 2,263.
What is the Ratio of Males per 100 Females in Pittsfield?
There are 83.47 Males per 100 Females in Pittsfield.
What is the Ratio of Females per 100 Males in Pittsfield?
There are 119.80 Females per 100 Males in Pittsfield.
What is the Median Population Age in Pittsfield?
Median Population Age in Pittsfield is 42.0 Years.
What is the Average Family Size in Pittsfield
Average Family Size in Pittsfield is 2.9 People.
What is the Average Household Size in Pittsfield
Average Household Size in Pittsfield is 2.2 People.
How Large is the Labor Force in Pittsfield?
There are 1,755 People in the Labor Forcein in Pittsfield.
What is the Percentage of People in the Labor Force in Pittsfield?
52.5% of People are in the Labor Force in Pittsfield.
What is the Unemployment Rate in Pittsfield?
Unemployment Rate in Pittsfield is 8.3%.