Zip Codes with the Highest Percentage of Population Employed in Administrative & Support Services in Peoria, IL
RELATED REPORTS & OPTIONS
Administrative & Support Services
Peoria
Compare Zip Codes
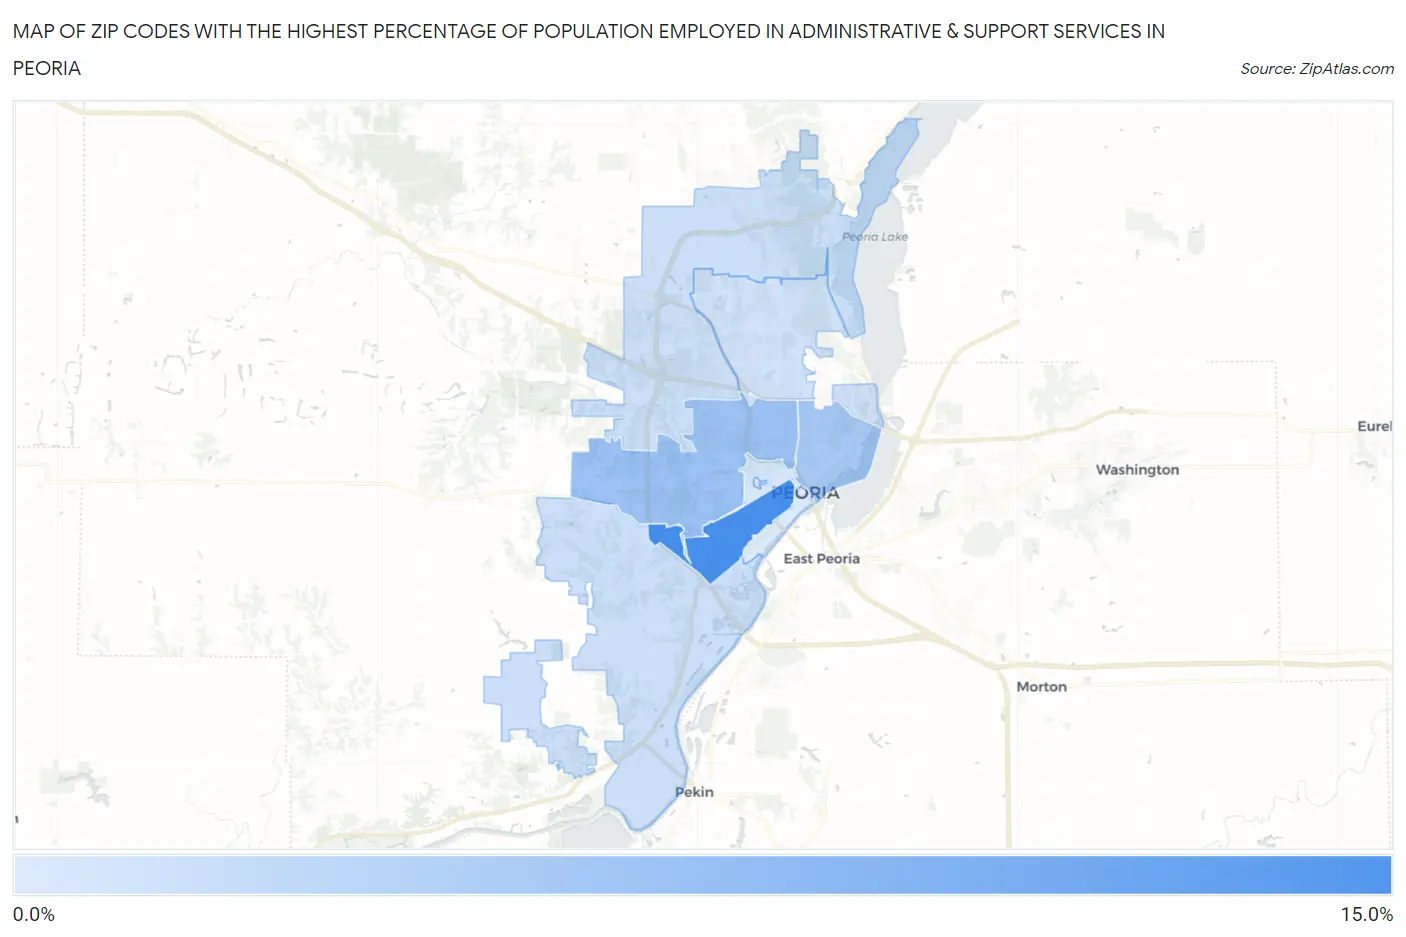
Map of Zip Codes with the Highest Percentage of Population Employed in Administrative & Support Services in Peoria
2.5%
12.3%
Zip Codes with the Highest Percentage of Population Employed in Administrative & Support Services in Peoria, IL
| Zip Code | % Employed | vs State | vs National | |
| 1. | 61605 | 12.3% | 4.0%(+8.25)#26 | 4.1%(+8.12)#813 |
| 2. | 61604 | 6.8% | 4.0%(+2.77)#128 | 4.1%(+2.63)#3,498 |
| 3. | 61603 | 6.0% | 4.0%(+1.94)#169 | 4.1%(+1.80)#4,872 |
| 4. | 61607 | 3.5% | 4.0%(-0.491)#483 | 4.1%(-0.624)#12,831 |
| 5. | 61615 | 3.5% | 4.0%(-0.499)#486 | 4.1%(-0.631)#12,869 |
| 6. | 61614 | 3.3% | 4.0%(-0.762)#556 | 4.1%(-0.895)#14,181 |
| 7. | 61606 | 2.9% | 4.0%(-1.10)#638 | 4.1%(-1.24)#15,925 |
| 8. | 61602 | 2.5% | 4.0%(-1.55)#747 | 4.1%(-1.68)#18,293 |
1
Common Questions
What are the Top 5 Zip Codes with the Highest Percentage of Population Employed in Administrative & Support Services in Peoria, IL?
Top 5 Zip Codes with the Highest Percentage of Population Employed in Administrative & Support Services in Peoria, IL are:
What zip code has the Highest Percentage of Population Employed in Administrative & Support Services in Peoria, IL?
61605 has the Highest Percentage of Population Employed in Administrative & Support Services in Peoria, IL with 12.3%.
What is the Percentage of Population Employed in Administrative & Support Services in Peoria, IL?
Percentage of Population Employed in Administrative & Support Services in Peoria is 5.0%.
What is the Percentage of Population Employed in Administrative & Support Services in Illinois?
Percentage of Population Employed in Administrative & Support Services in Illinois is 4.0%.
What is the Percentage of Population Employed in Administrative & Support Services in the United States?
Percentage of Population Employed in Administrative & Support Services in the United States is 4.1%.