Zip Codes with the Highest Percentage of Population Employed in Accommodation & Food Services in Peoria, IL
RELATED REPORTS & OPTIONS
Accommodation & Food Services
Peoria
Compare Zip Codes
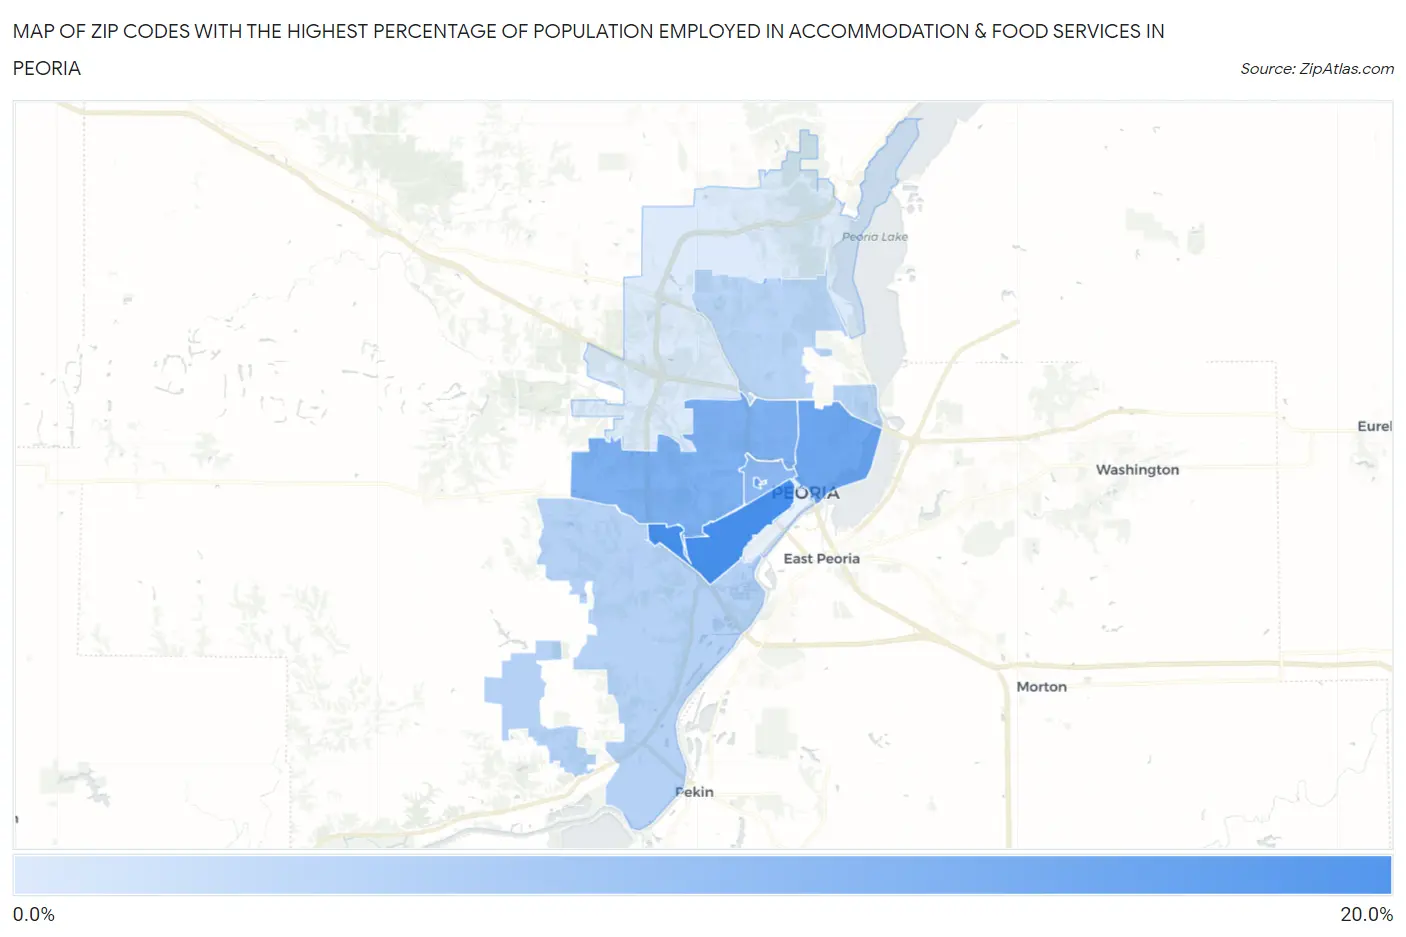
Map of Zip Codes with the Highest Percentage of Population Employed in Accommodation & Food Services in Peoria
2.8%
17.8%
Zip Codes with the Highest Percentage of Population Employed in Accommodation & Food Services in Peoria, IL
| Zip Code | % Employed | vs State | vs National | |
| 1. | 61605 | 17.8% | 6.5%(+11.3)#24 | 6.9%(+10.9)#1,133 |
| 2. | 61625 | 14.6% | 6.5%(+8.10)#45 | 6.9%(+7.69)#1,800 |
| 3. | 61603 | 13.6% | 6.5%(+7.09)#55 | 6.9%(+6.68)#2,109 |
| 4. | 61604 | 12.0% | 6.5%(+5.49)#75 | 6.9%(+5.08)#2,858 |
| 5. | 61606 | 10.7% | 6.5%(+4.19)#106 | 6.9%(+3.78)#3,830 |
| 6. | 61607 | 6.5% | 6.5%(+0.066)#439 | 6.9%(-0.346)#11,730 |
| 7. | 61614 | 6.1% | 6.5%(-0.357)#481 | 6.9%(-0.768)#13,090 |
| 8. | 61615 | 2.8% | 6.5%(-3.67)#1,010 | 6.9%(-4.08)#23,754 |
1
Common Questions
What are the Top 5 Zip Codes with the Highest Percentage of Population Employed in Accommodation & Food Services in Peoria, IL?
Top 5 Zip Codes with the Highest Percentage of Population Employed in Accommodation & Food Services in Peoria, IL are:
What zip code has the Highest Percentage of Population Employed in Accommodation & Food Services in Peoria, IL?
61605 has the Highest Percentage of Population Employed in Accommodation & Food Services in Peoria, IL with 17.8%.
What is the Percentage of Population Employed in Accommodation & Food Services in Peoria, IL?
Percentage of Population Employed in Accommodation & Food Services in Peoria is 8.4%.
What is the Percentage of Population Employed in Accommodation & Food Services in Illinois?
Percentage of Population Employed in Accommodation & Food Services in Illinois is 6.5%.
What is the Percentage of Population Employed in Accommodation & Food Services in the United States?
Percentage of Population Employed in Accommodation & Food Services in the United States is 6.9%.