Zip Codes with the Highest Percentage of Population Employed in Office & Administration in Peoria, IL
RELATED REPORTS & OPTIONS
Office & Administration
Peoria
Compare Zip Codes
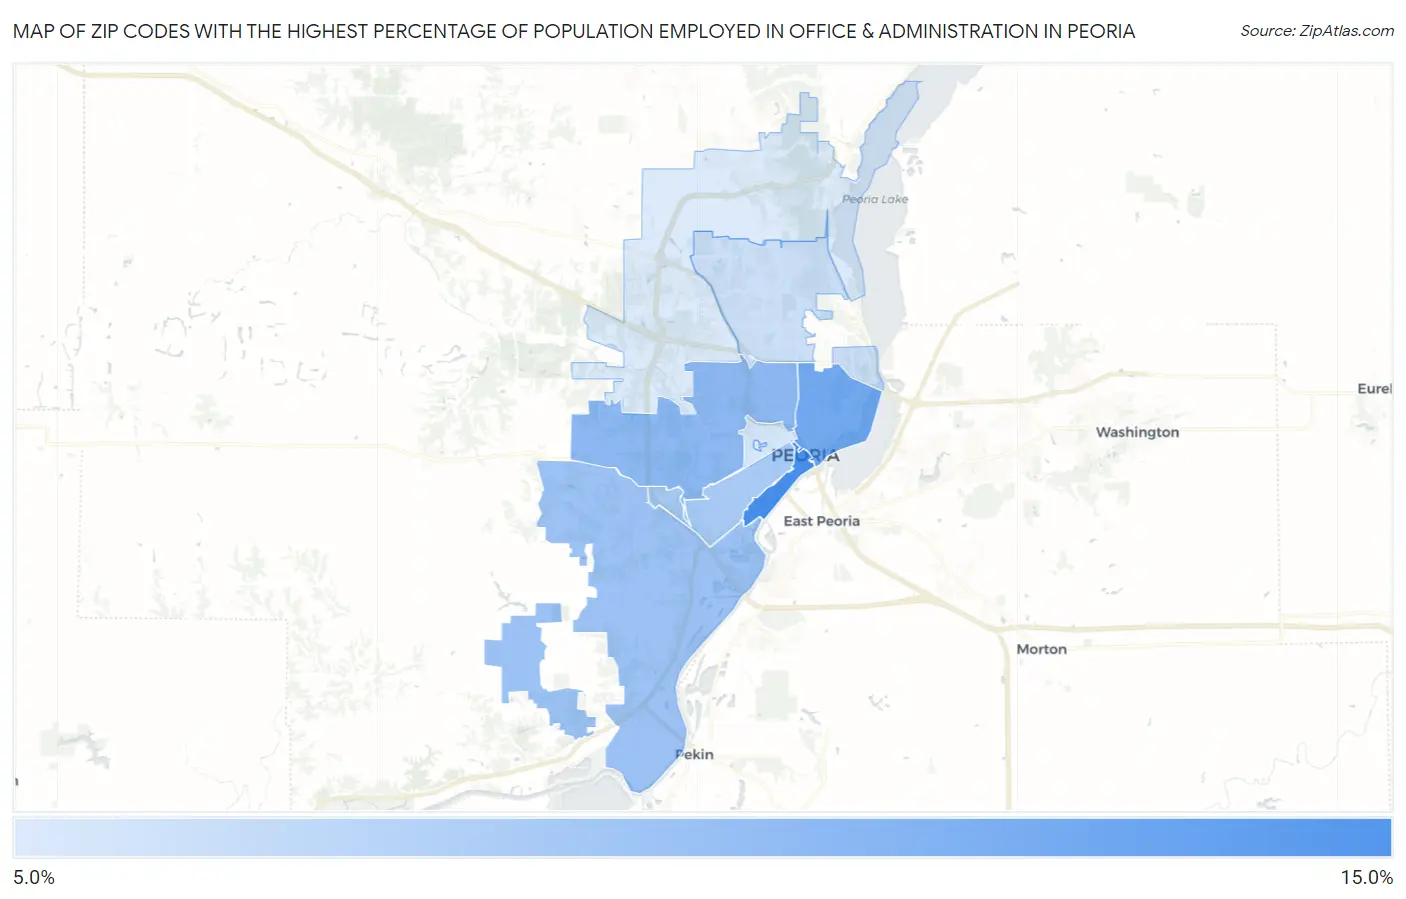
Map of Zip Codes with the Highest Percentage of Population Employed in Office & Administration in Peoria
8.3%
14.8%
Zip Codes with the Highest Percentage of Population Employed in Office & Administration in Peoria, IL
| Zip Code | % Employed | vs State | vs National | |
| 1. | 61602 | 14.8% | 10.8%(+4.05)#233 | 10.9%(+3.96)#4,812 |
| 2. | 61603 | 12.8% | 10.8%(+2.08)#403 | 10.9%(+1.99)#8,434 |
| 3. | 61604 | 11.8% | 10.8%(+1.01)#548 | 10.9%(+0.922)#11,405 |
| 4. | 61607 | 11.1% | 10.8%(+0.370)#622 | 10.9%(+0.278)#13,416 |
| 5. | 61605 | 10.6% | 10.8%(-0.204)#701 | 10.9%(-0.295)#15,268 |
| 6. | 61614 | 9.0% | 10.8%(-1.73)#906 | 10.9%(-1.82)#20,160 |
| 7. | 61606 | 8.6% | 10.8%(-2.13)#962 | 10.9%(-2.22)#21,326 |
| 8. | 61615 | 8.3% | 10.8%(-2.42)#998 | 10.9%(-2.51)#22,096 |
1
Common Questions
What are the Top 5 Zip Codes with the Highest Percentage of Population Employed in Office & Administration in Peoria, IL?
Top 5 Zip Codes with the Highest Percentage of Population Employed in Office & Administration in Peoria, IL are:
What zip code has the Highest Percentage of Population Employed in Office & Administration in Peoria, IL?
61602 has the Highest Percentage of Population Employed in Office & Administration in Peoria, IL with 14.8%.
What is the Percentage of Population Employed in Office & Administration in Peoria, IL?
Percentage of Population Employed in Office & Administration in Peoria is 9.6%.
What is the Percentage of Population Employed in Office & Administration in Illinois?
Percentage of Population Employed in Office & Administration in Illinois is 10.8%.
What is the Percentage of Population Employed in Office & Administration in the United States?
Percentage of Population Employed in Office & Administration in the United States is 10.9%.