Zip Codes with the Highest Percentage of Population Employed in Community & Social Service in Peoria, IL
RELATED REPORTS & OPTIONS
Community & Social Service
Peoria
Compare Zip Codes
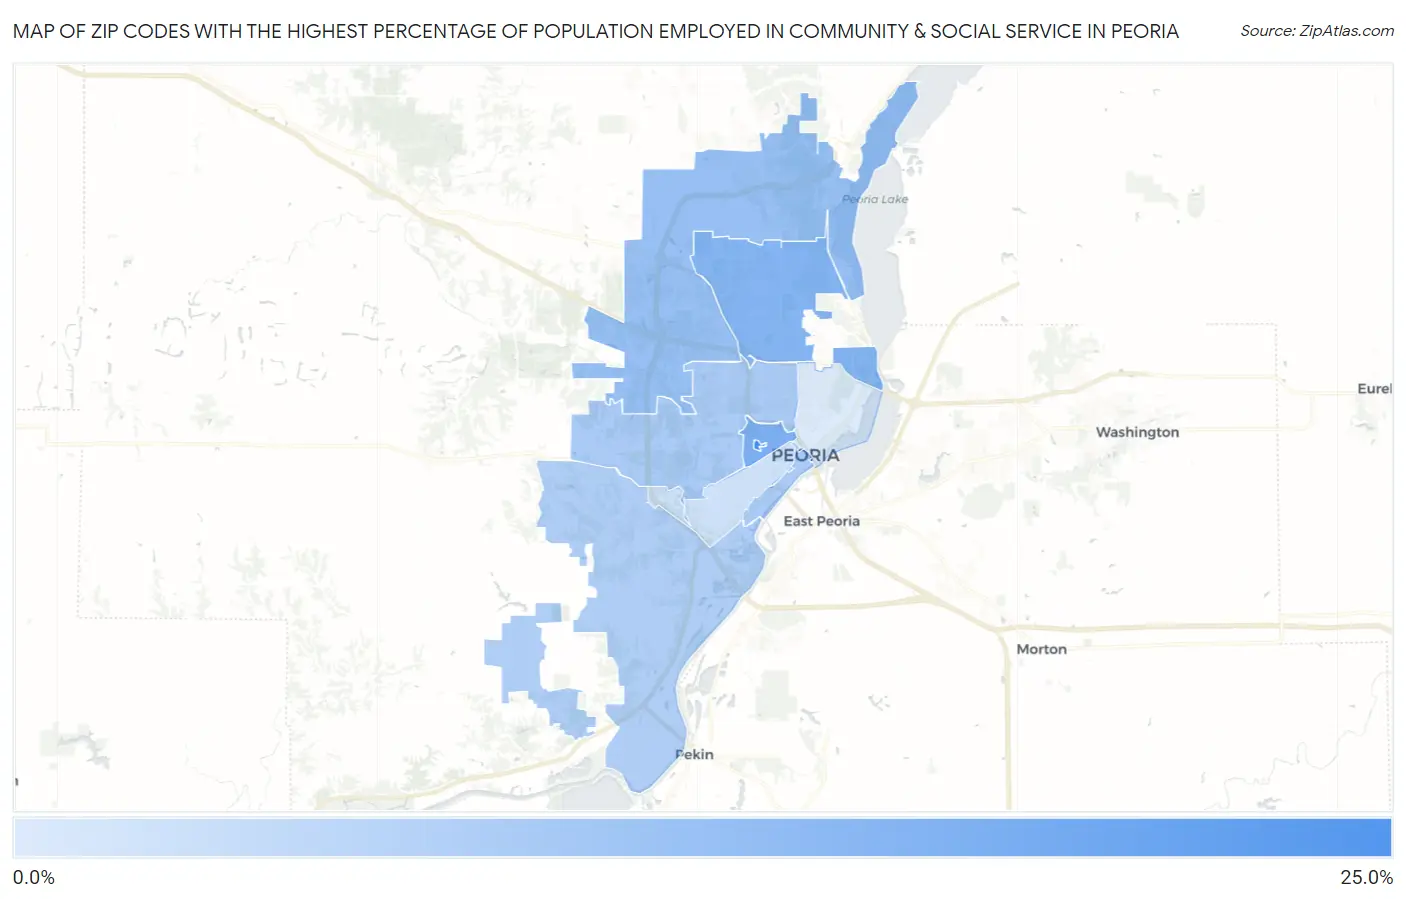
Map of Zip Codes with the Highest Percentage of Population Employed in Community & Social Service in Peoria
4.4%
24.5%
Zip Codes with the Highest Percentage of Population Employed in Community & Social Service in Peoria, IL
| Zip Code | % Employed | vs State | vs National | |
| 1. | 61625 | 24.5% | 11.3%(+13.2)#22 | 11.2%(+13.3)#1,040 |
| 2. | 61606 | 17.0% | 11.3%(+5.72)#93 | 11.2%(+5.79)#3,379 |
| 3. | 61614 | 15.8% | 11.3%(+4.49)#128 | 11.2%(+4.55)#4,279 |
| 4. | 61615 | 13.1% | 11.3%(+1.83)#243 | 11.2%(+1.90)#7,377 |
| 5. | 61604 | 10.9% | 11.3%(-0.352)#403 | 11.2%(-0.287)#11,820 |
| 6. | 61602 | 10.7% | 11.3%(-0.580)#440 | 11.2%(-0.515)#12,378 |
| 7. | 61607 | 10.2% | 11.3%(-1.05)#498 | 11.2%(-0.980)#13,527 |
| 8. | 61605 | 6.3% | 11.3%(-5.01)#946 | 11.2%(-4.95)#23,782 |
| 9. | 61603 | 4.4% | 11.3%(-6.84)#1,117 | 11.2%(-6.77)#27,023 |
1
Common Questions
What are the Top 5 Zip Codes with the Highest Percentage of Population Employed in Community & Social Service in Peoria, IL?
Top 5 Zip Codes with the Highest Percentage of Population Employed in Community & Social Service in Peoria, IL are:
What zip code has the Highest Percentage of Population Employed in Community & Social Service in Peoria, IL?
61625 has the Highest Percentage of Population Employed in Community & Social Service in Peoria, IL with 24.5%.
What is the Percentage of Population Employed in Community & Social Service in Peoria, IL?
Percentage of Population Employed in Community & Social Service in Peoria is 11.9%.
What is the Percentage of Population Employed in Community & Social Service in Illinois?
Percentage of Population Employed in Community & Social Service in Illinois is 11.3%.
What is the Percentage of Population Employed in Community & Social Service in the United States?
Percentage of Population Employed in Community & Social Service in the United States is 11.2%.